- Devices and Connectivity
- Server-side infrastructure
- Development and Configuration steps
- Live Demo
- Conclusion
- Links
Environmental controls in the office rooms are very important as the loss of HVAC can result in significant loss of servers, network gear, employee productivity etc.
In this tutorial we will prototype facilities monitoring system that will be able to cover following use cases:
- Monitoring of temperature and humidity in different zones of the office building.
- Processing of collected telemetry with various alerting rules based on zone type: work space, meeting and server rooms.
- Distribution of collected alarms to assigned facility managers.
- Visualization of real-time and historical values on the configurable web dashboards.
This article describes development and configuration steps we have done in order to build the PoC.
The prototype is open-source and is also based on open-source technologies, so you are able to use it for building commercial products.
Devices and Connectivity
We decided to use quite cheap hardware based on ESP8266 and DHT22 sensor. The total cost of each device that includes sensor and connectivity module is approximately 5$. Since this is a prototype, we decided to use MQTT over WiFi and have not discussed other connectivity options.
Server-side infrastructure
The server-side part of the solution will be based on the ThingsBoard IoT platform which is 100% open-source and can be deployed both in the cloud, on premises or even on Raspberry Pi 3. The collected data is stored in Cassandra database due to built-in fault-tolerance and scalability. We have recently launched Live Demo instance to simplify the getting-started process, so we will use this instance in the tutorial.
Development and Configuration steps
Step 1. Device provisioning
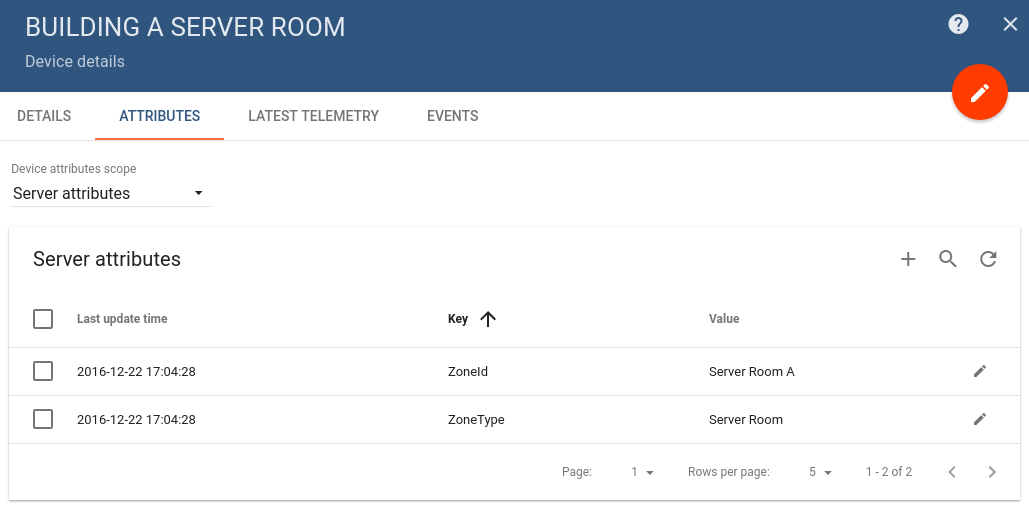
The initial step of the PoC is to provision several devices and their attributes. We’ve decided to support three zone types: work area, meeting and server rooms. We have registered three buildings with four rooms in each. During registration, we have populated Zone Id, Zone Type server-side attributes. Note that the server-side device attributes may be used by the processing rules, but are not visible to the device itself.

Step 2. Flushing the devices
During this step, we have flushed firmware update with individual device credentials built-in to the firmware. The firmware code and corresponding instructions are available in links below. We have used code from our previous article without modifications, since all the logic is on the server side.
Please note that steps 1 and 2 may be automated, we’ve developed simple java based application that performs provisioning of the devices and other entities using REST API and also emulates these devices for the live demo purposes.
Step 3. Processing Rules
During these steps we have provisioned rules that analyze temperature and humidity against configurable thresholds based on zone type.
For example, acceptable humidity range in a server room is between 40% and 60%, however, humidity range for the work zone is from 30% to 70%.
The rules are basically a set of logical expression written using javascript syntax.
For example, a rule for a server room consists of two parts: attribute and telemetry filter. This filters may be combined, but we decided to separate them to simplify the PoC.
Attributes filter body example:
1
typeof ss.ZoneType !== 'undefined' && ss.ZoneType === 'Server Room'
Telemetry filter body example:
1
2
3
4
5
6
7
8
9
(
    typeof temperature !== 'undefined'
    && (temperature <= 10 || temperature >= 25)
)
||
(
    typeof humidity !== 'undefined'
    && (humidity <= 40 || humidity >= 60)
)
You may notice “null” checks in the filter body. This is basically a good practice, because you may use the same server for multiple device applications. Some of them report humidity and temperature, the others upload other sensor readings and this should not affect rules processing.
Step 4. Alarms distribution
At this step, we have configured email plugin to distribute data using SendGrid mail service and provisioned rule action to send data to the configured email address. Rule action consists of several templates that allow flexible configuration of email topic, body and address list based on substitution of device attributes and telemetry values.
For example, following email body template:
1
2
3
[$date.get('yyyy-MM-dd HH:mm:ss')] $ss.get('ZoneId') HVAC malfunction detected.
Temperature - $temperature.valueAsString (°C).
Humidity - $humidity.valueAsString (%)!
Will be evaluated to the following email body
1
2
3
[2016-12-22 15:06:09] Server Room C HVAC malfunction detected.
Temperature – 45.0 (°C).
Humidity – 70.0 (%)!
The evaluation and template syntax is based on Velocity engine.
Step 5. Data visualization
At this step, we provisioned several dashboards to visualize the data. We will describe them below.
Map dashboard
This dashboard shows multiple buildings on the map with their short status available in the tooltip. You can use links in the tooltips to navigate to Floor Plan and Historical Data dashboards.

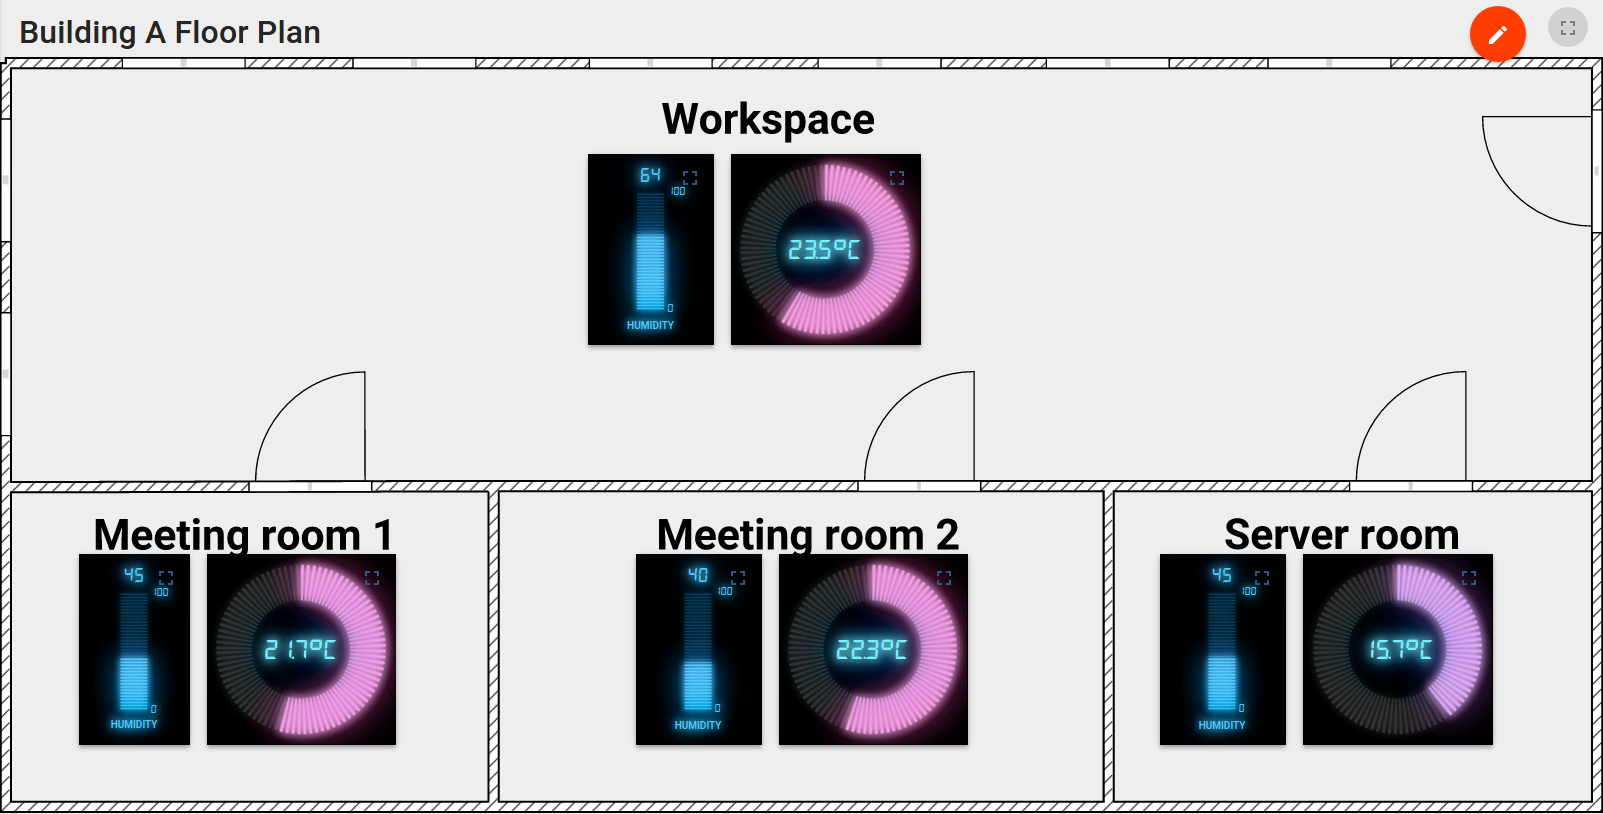
Floor Plan dashboard
This dashboard uses a static background image with the floor plan. We have placed widgets that show temperature and humidity in each room that is being monitored.

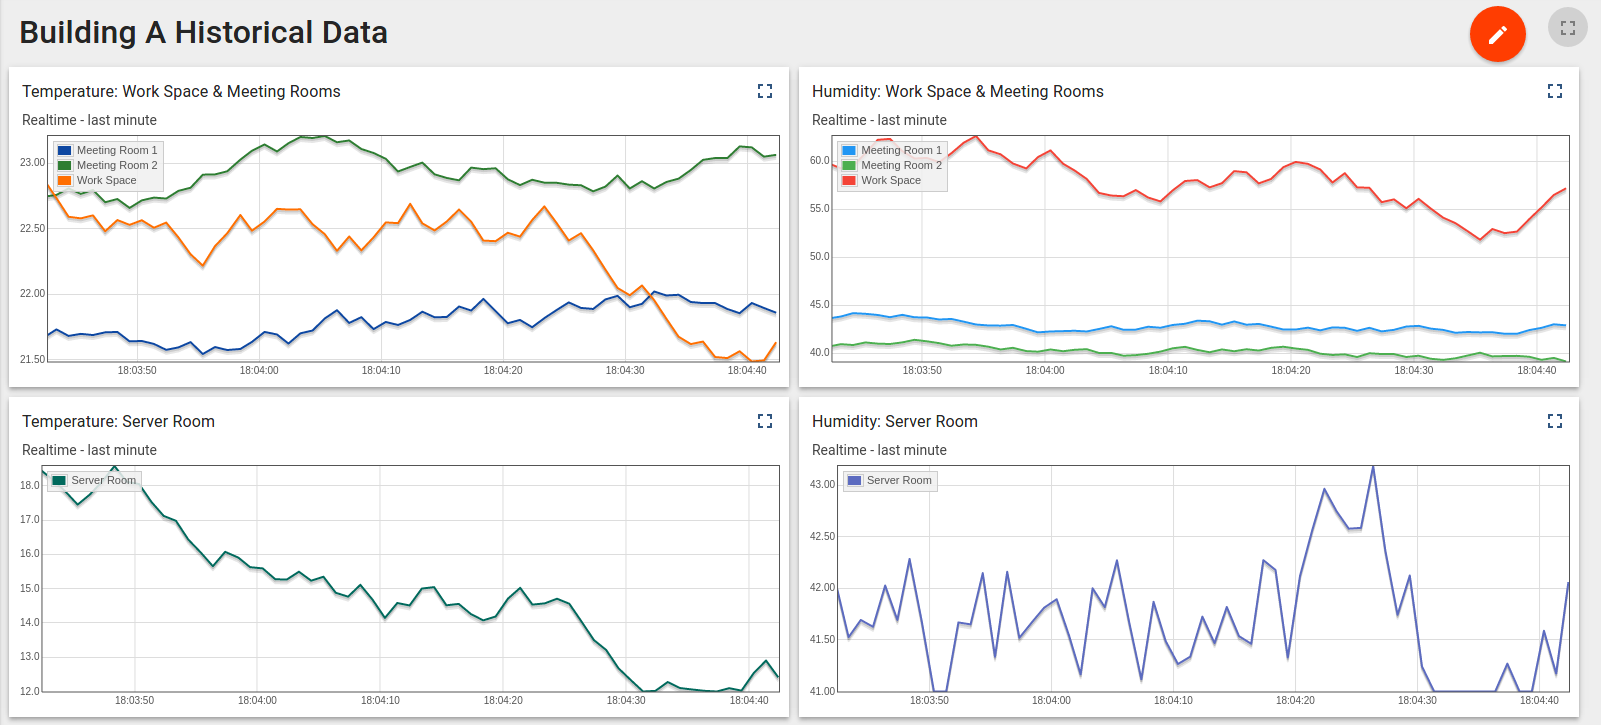
Historical dashboard
This dashboard shows last minute of sensor readings that are reported each second.

Live Demo
In order to demonstrate this PoC in action you need to do two simple steps:
- Sign-up or login to the live demo instance and save your login and password.
- Download and launch device emulator using this link.
1
java -jar facilities-monitoring.jar demo.thingsboard.io
Once started, the emulator will ask you for your live demo login and password. This information will be used to get the JWT token and execute REST API calls in order to:
- provision demo devices.
- create rules and dashboards.
- start emulation of the temperature and humidity sensor data for provisioned devices using MQTT.
Conclusion
This prototype was written by two engineers literally in one day. Most of the time was spent on the client-side code (Lua script for real device and emulator). The server-side part of the prototype has zero coding and was all about configuration of the rules, plugins, and dashboards.
This demonstrates how easy is to prototype and build IoT solutions using ThingsBoard. Of course, there is a certain learning curve that you need to pass, but we hope that this article and other docs will help you to do this.
If you found this article interesting, please leave your feedback, questions or feature requests in the comments section and “star” our project on the github in order to stay tuned for new releases and tutorials.
Links
-
Compatible sample applications for different hardware platforms:
- ThingsBoard github page
- Emulator source code
- Emulator binary
