Introduction
Equipment in production plays an important role in achieving maximum efficiency, quality, and payback. The issues that are key to optimizing the use of equipment are:
- Underutilization of Equipment
- Ineffective Production Scheduling
- Excessive Wear and Tear on Machinery
- Operational Bottlenecks
- Suboptimal Maintenance Scheduling
- Misaligned Capacity Planning
Solving these problems requires constant monitoring of equipment utilization and performance metrics. As production output increases, manufacturers may need to partially or completely change their equipment maintenance strategies and schedules to maintain efficiency. Unfortunately, these problems cannot be solved once and for all. But it also means that we can endlessly improve the optimization process.
That is why having the most up-to-date data is important when choosing an optimization strategy. Previously, with the help of logging, you could see how the equipment worked at the end of the day or week. With the growth of technology and the help of IoT devices, we can receive raw data in real-time. With advanced analytics, you can turn raw data into meaningful reports and predict future equipment behavior using machine learning models.
Equipment Utilization
To understand the overall condition of the equipment, you need to operate with a significant number of KPIs. We have divided KPIs by the problems they solve:
Underutilization of Equipment and Operational Bottlenecks
- Production Output – A numerical or quality indicator of the useful action performed by the equipment. The information is collected using counters, scales, or quality sensors transmitted via the network to the ThingsBoard. The data does not require any additional processing.
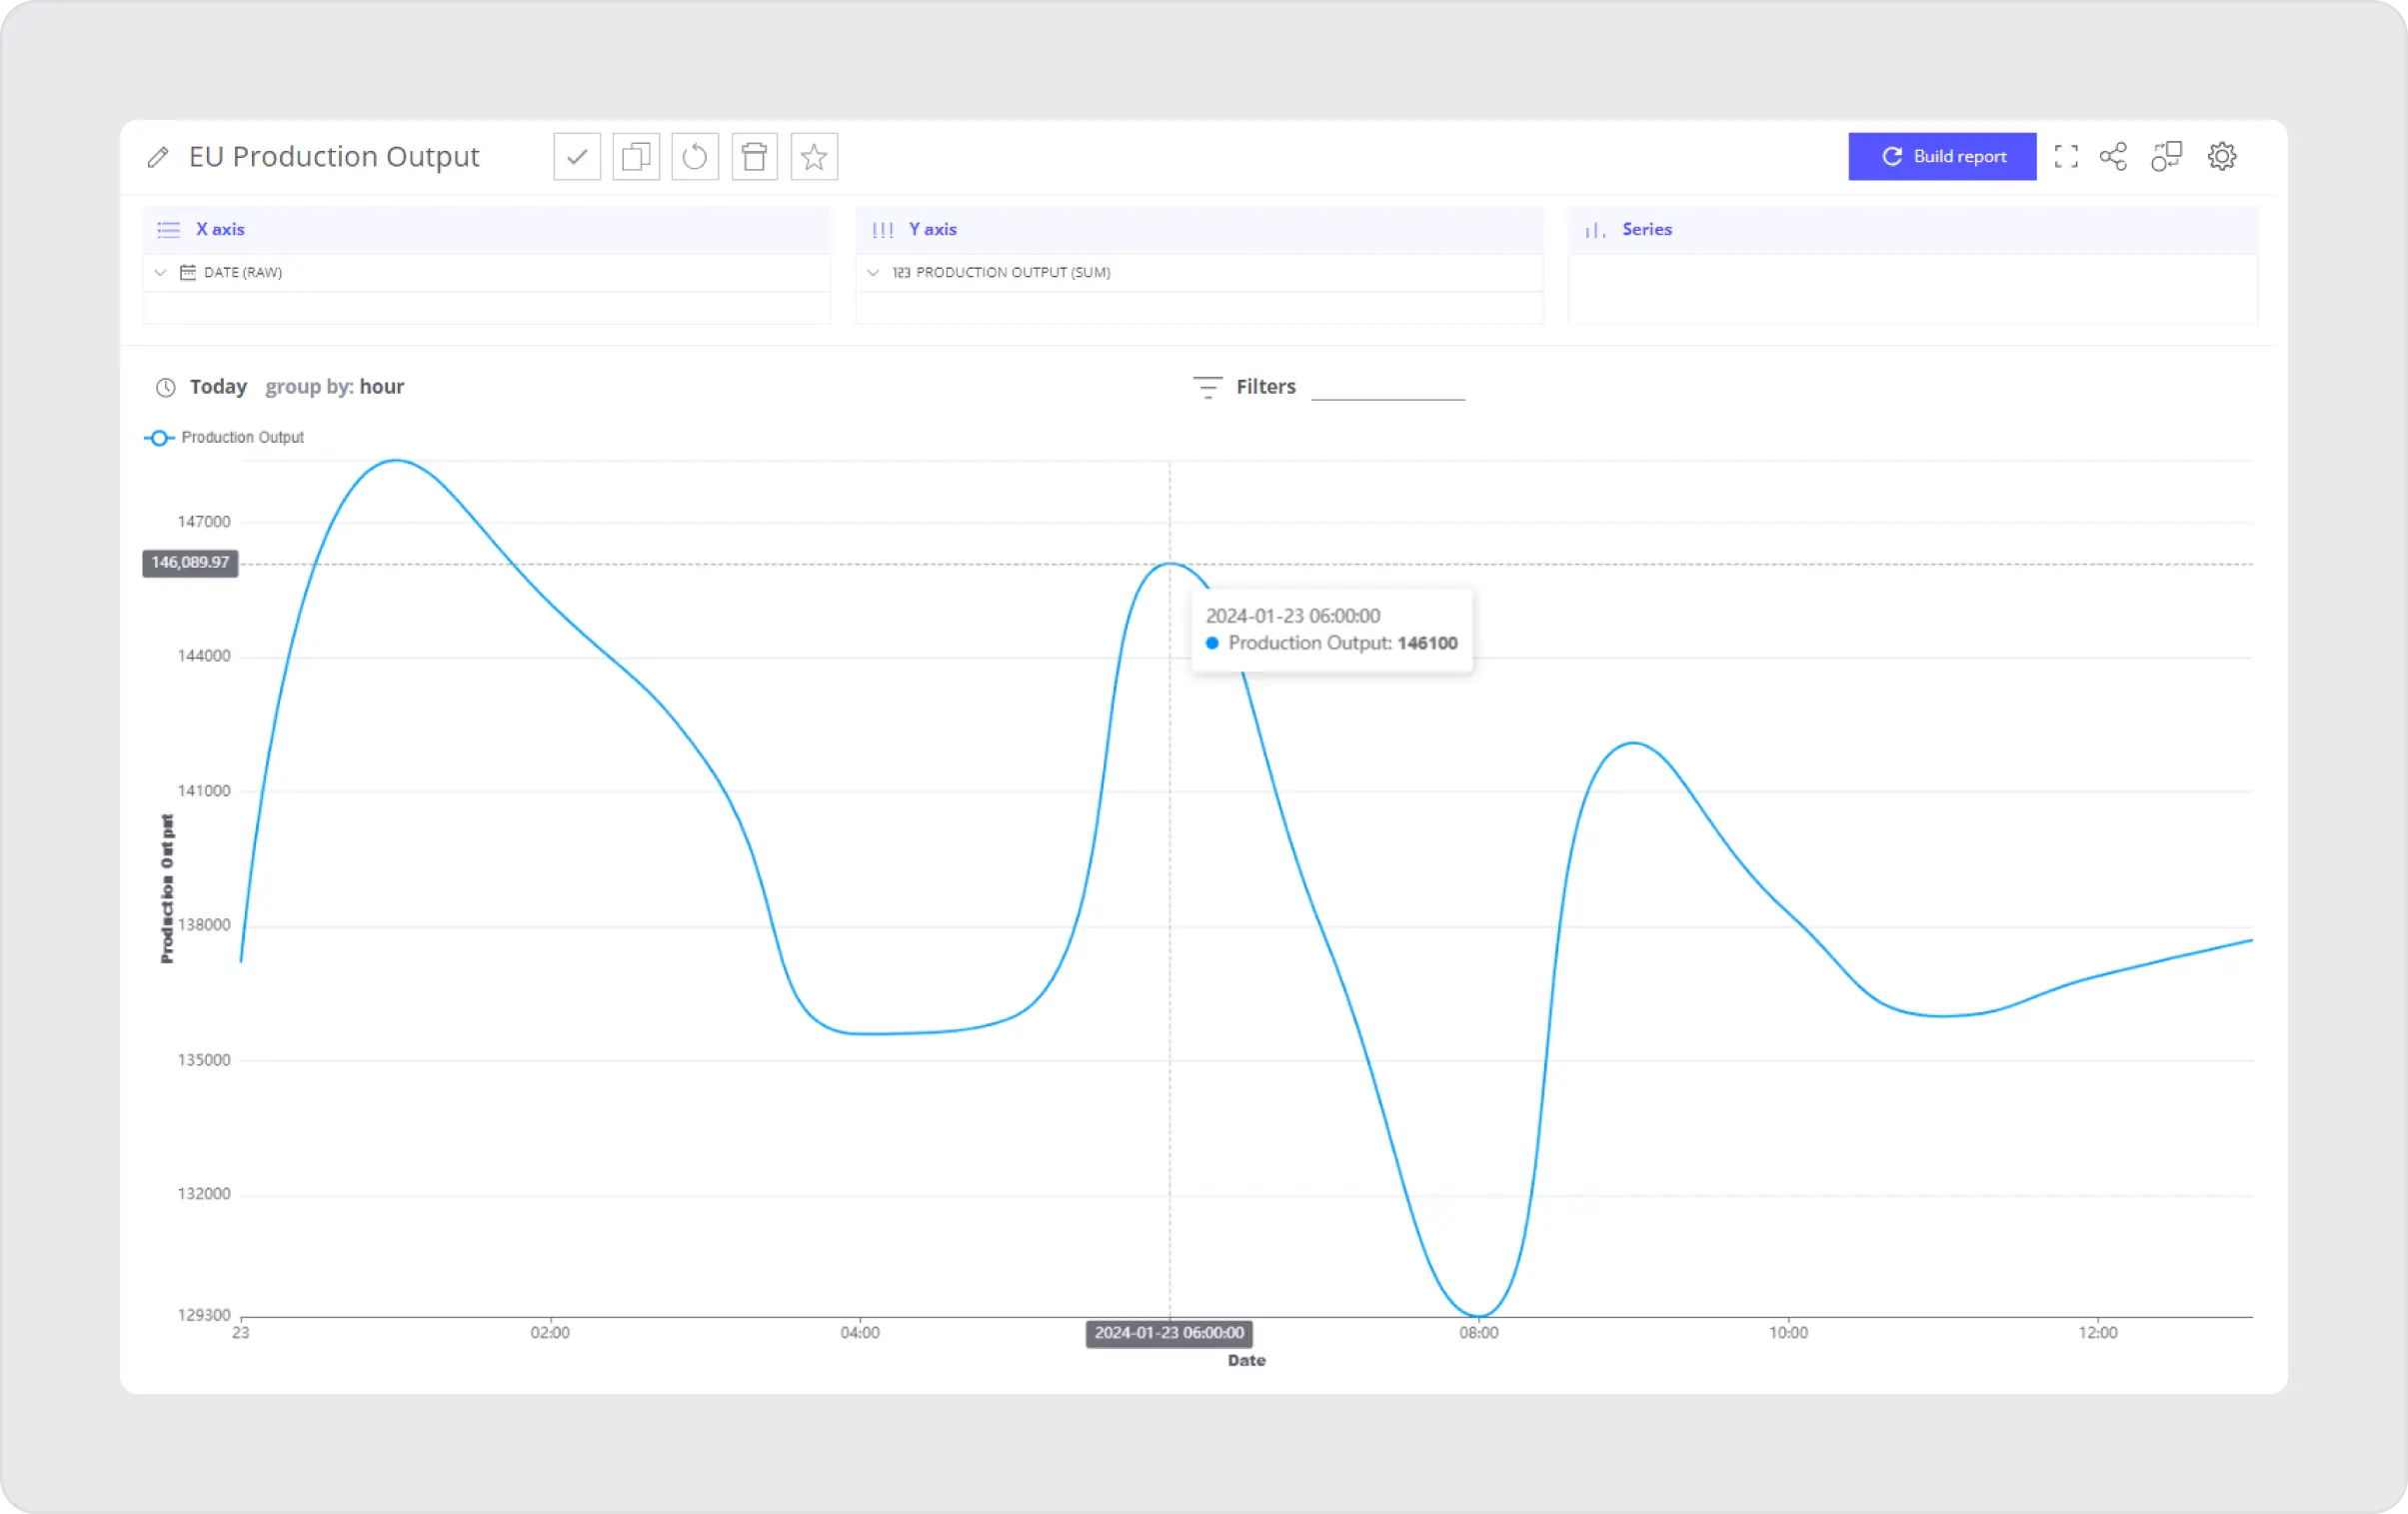
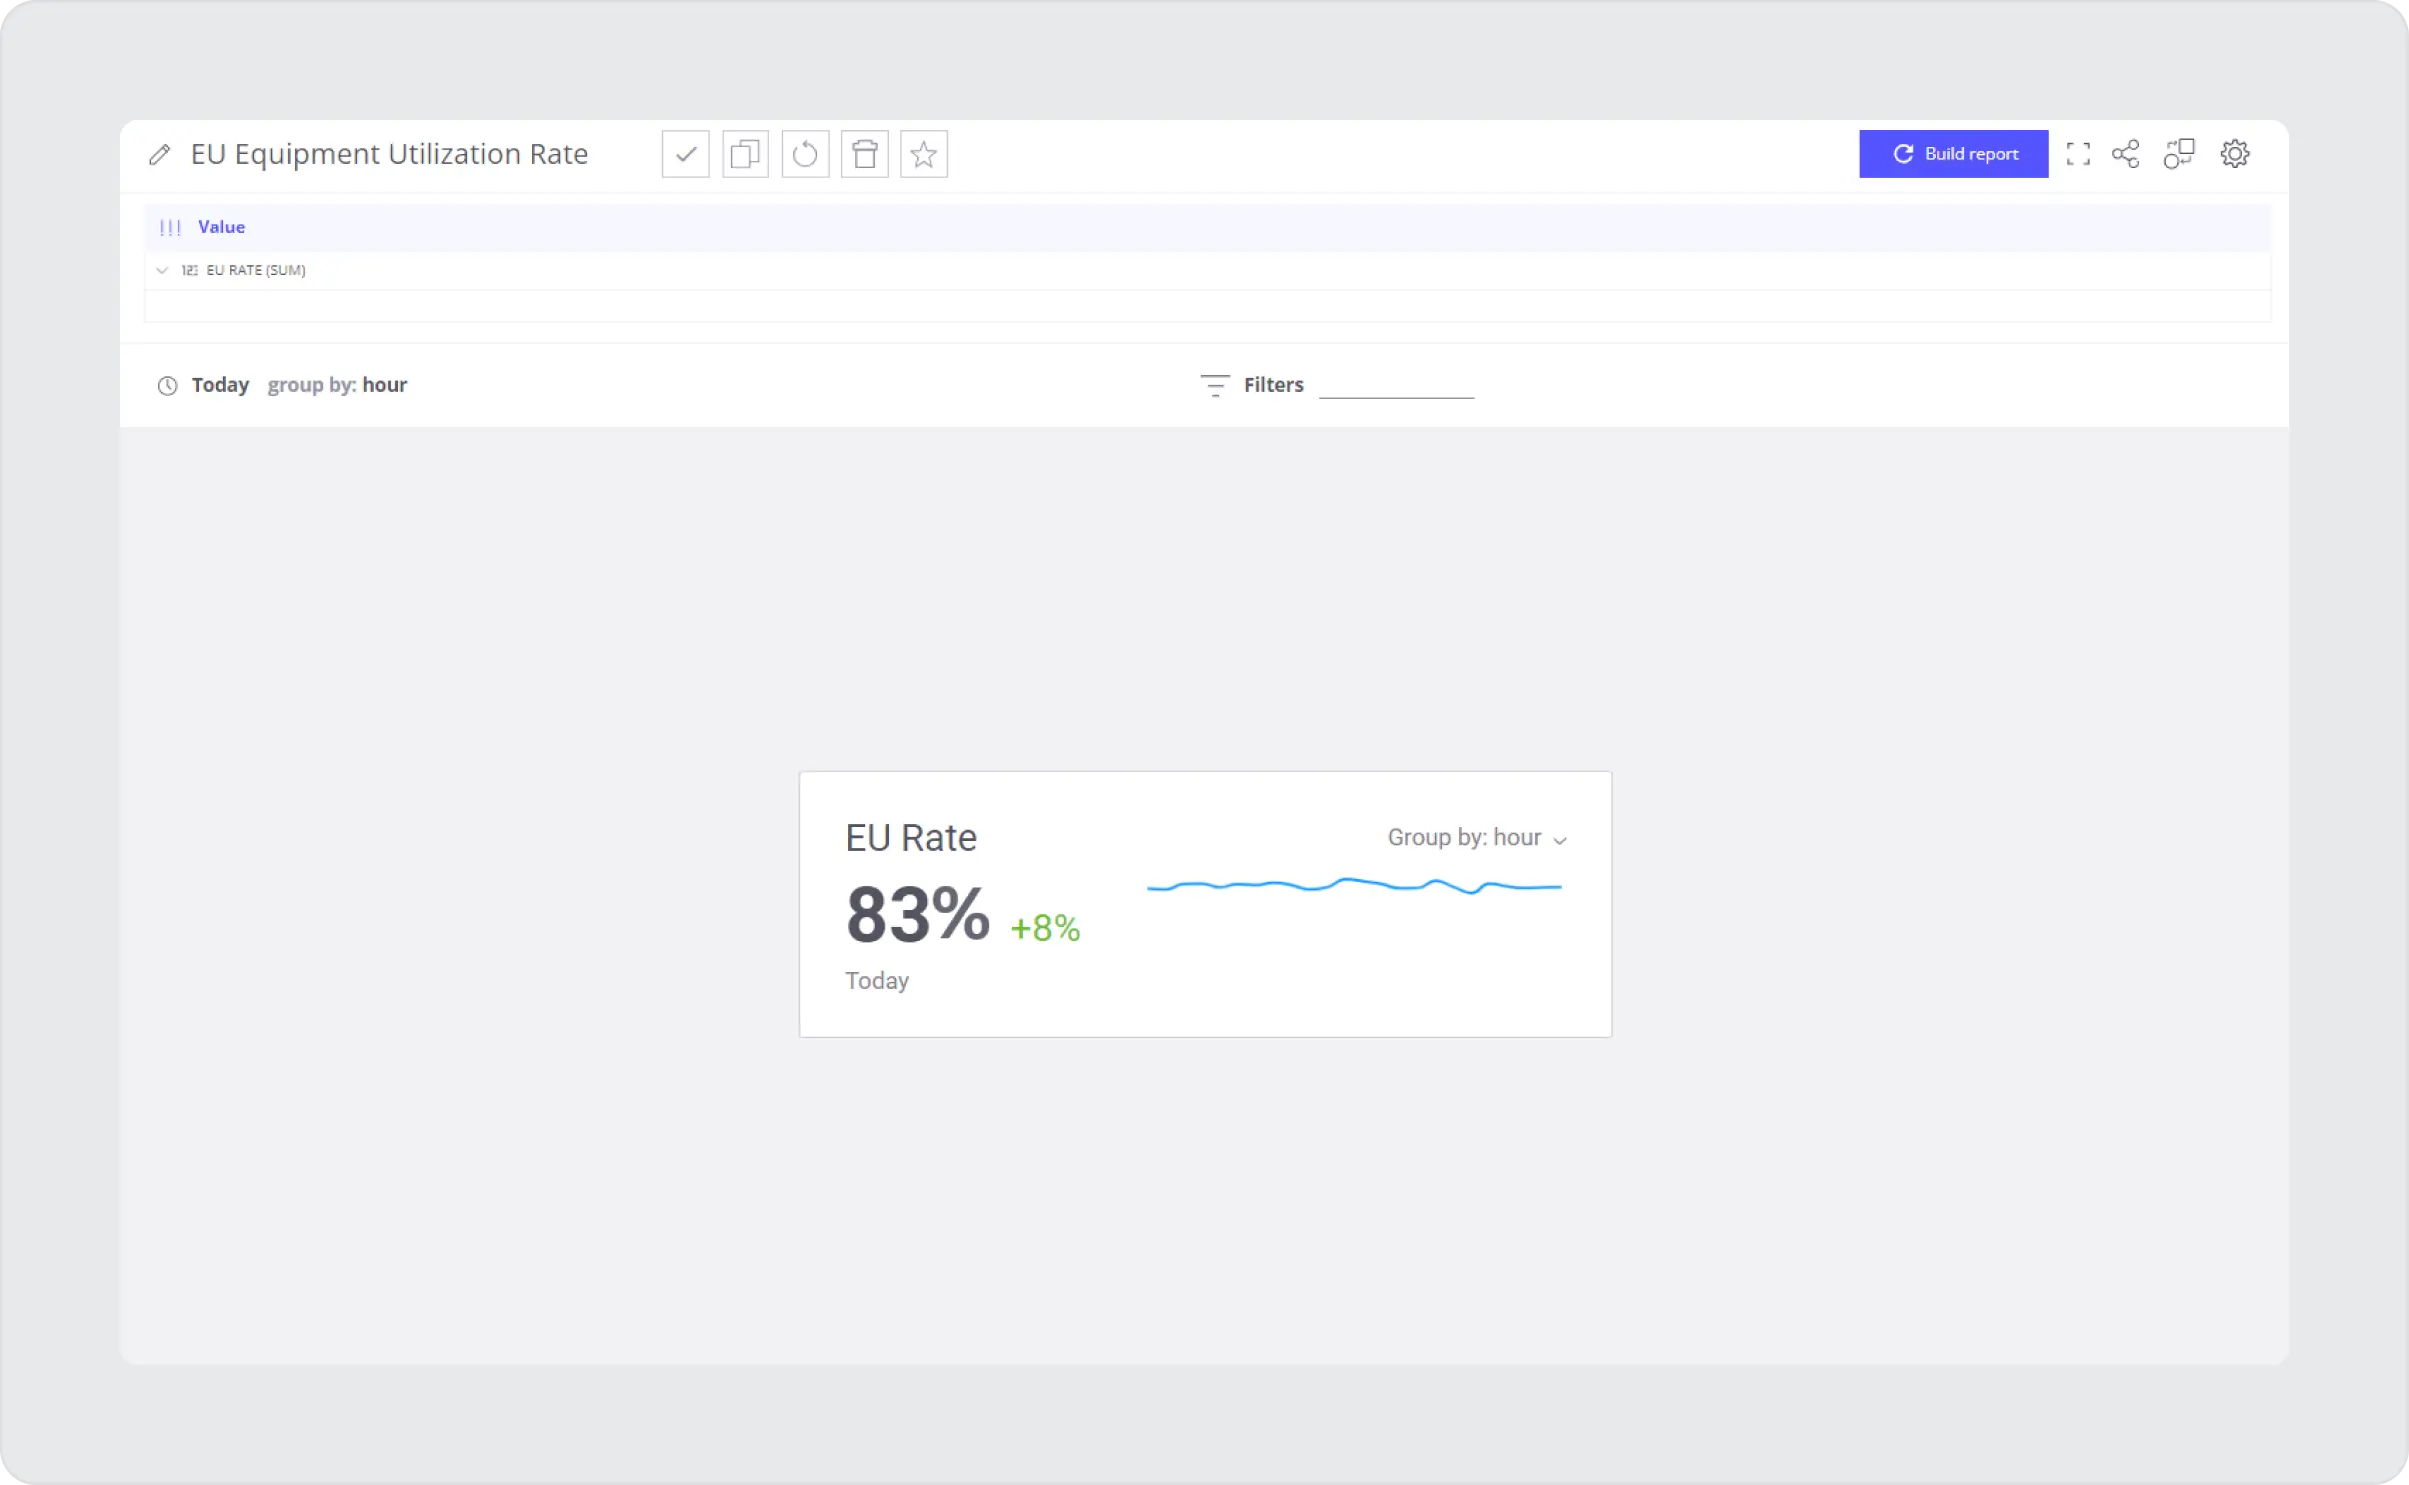
- Equipment Utilization Rate – measures the degree to which equipment is utilized over a period compared to its full potential or capacity. Production Output is taken as the current capacity indicator. The maximum capacity is set according to the technical documentation. The indicator is calculated by an analytics system that finds the ratio of Production Output to Maximum Capacity in real-time.
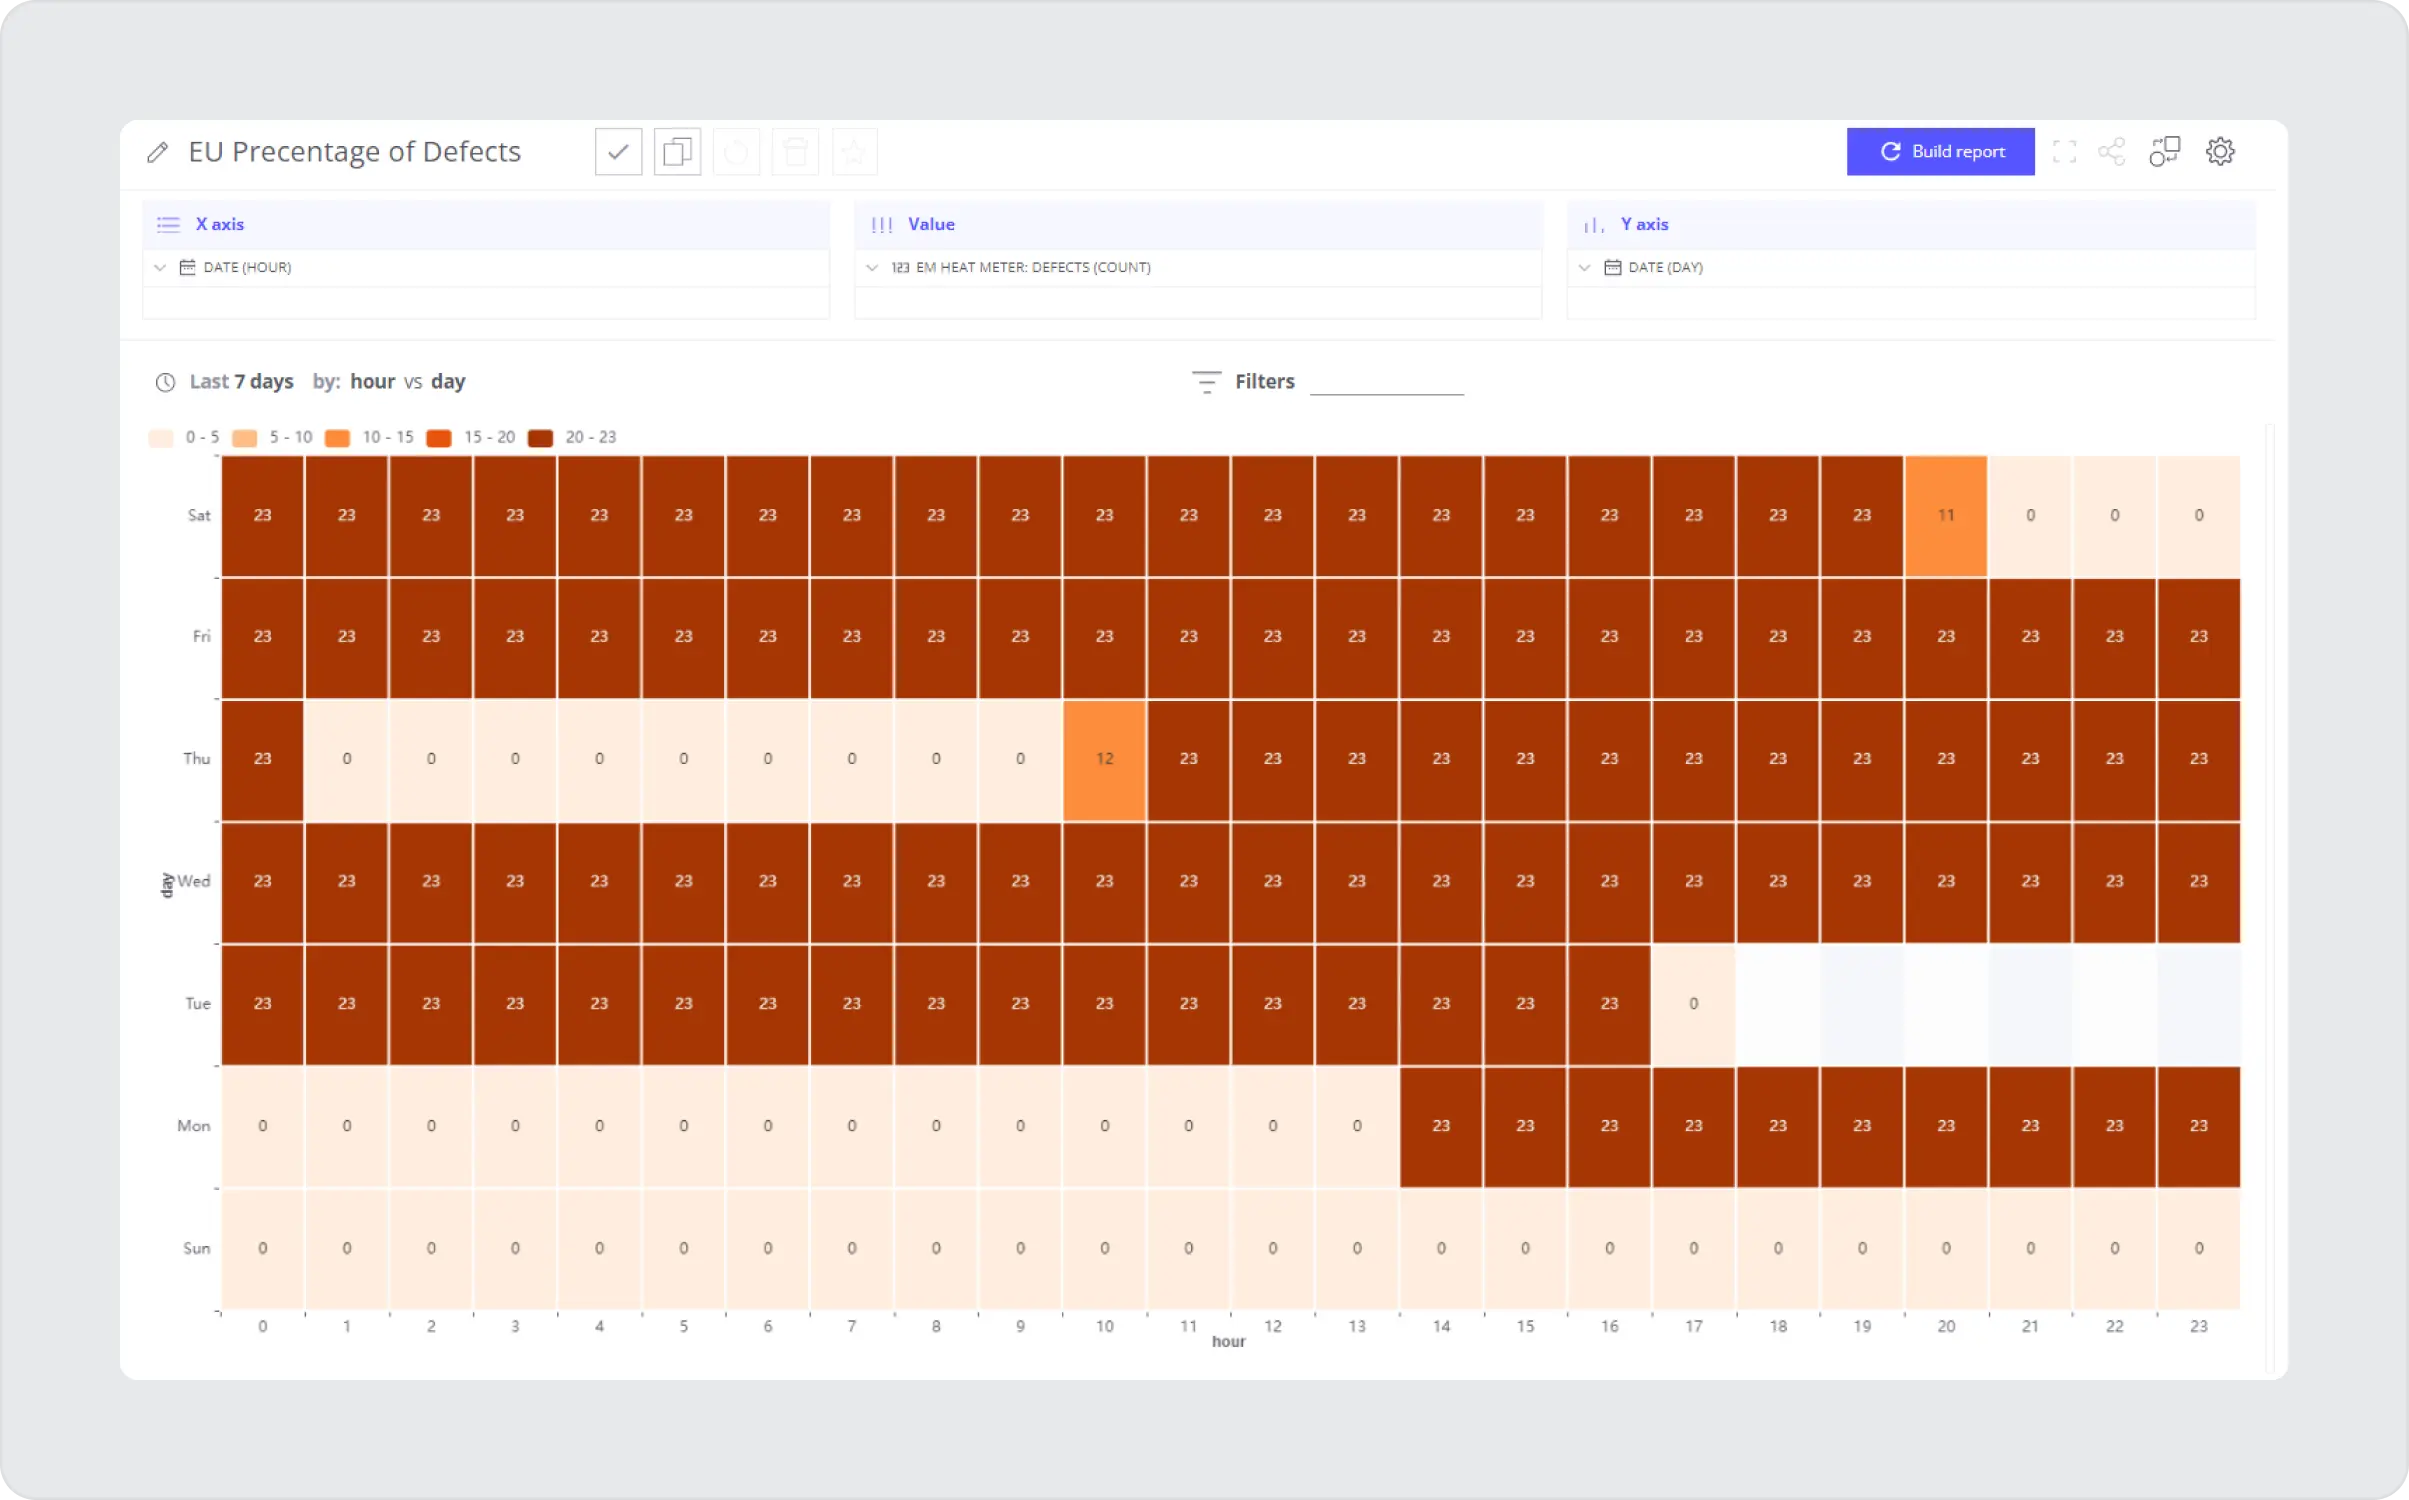
- Percentage of defects – The number of defects concerning the Production Output. Defective products are automatically detected using computer vision, ultrasonic or X-ray inspection, or by using manual inspection. The advanced analytics system calculates it in real-time by comparing the number of defective products to the manufactured product.
Ineffective Production Scheduling
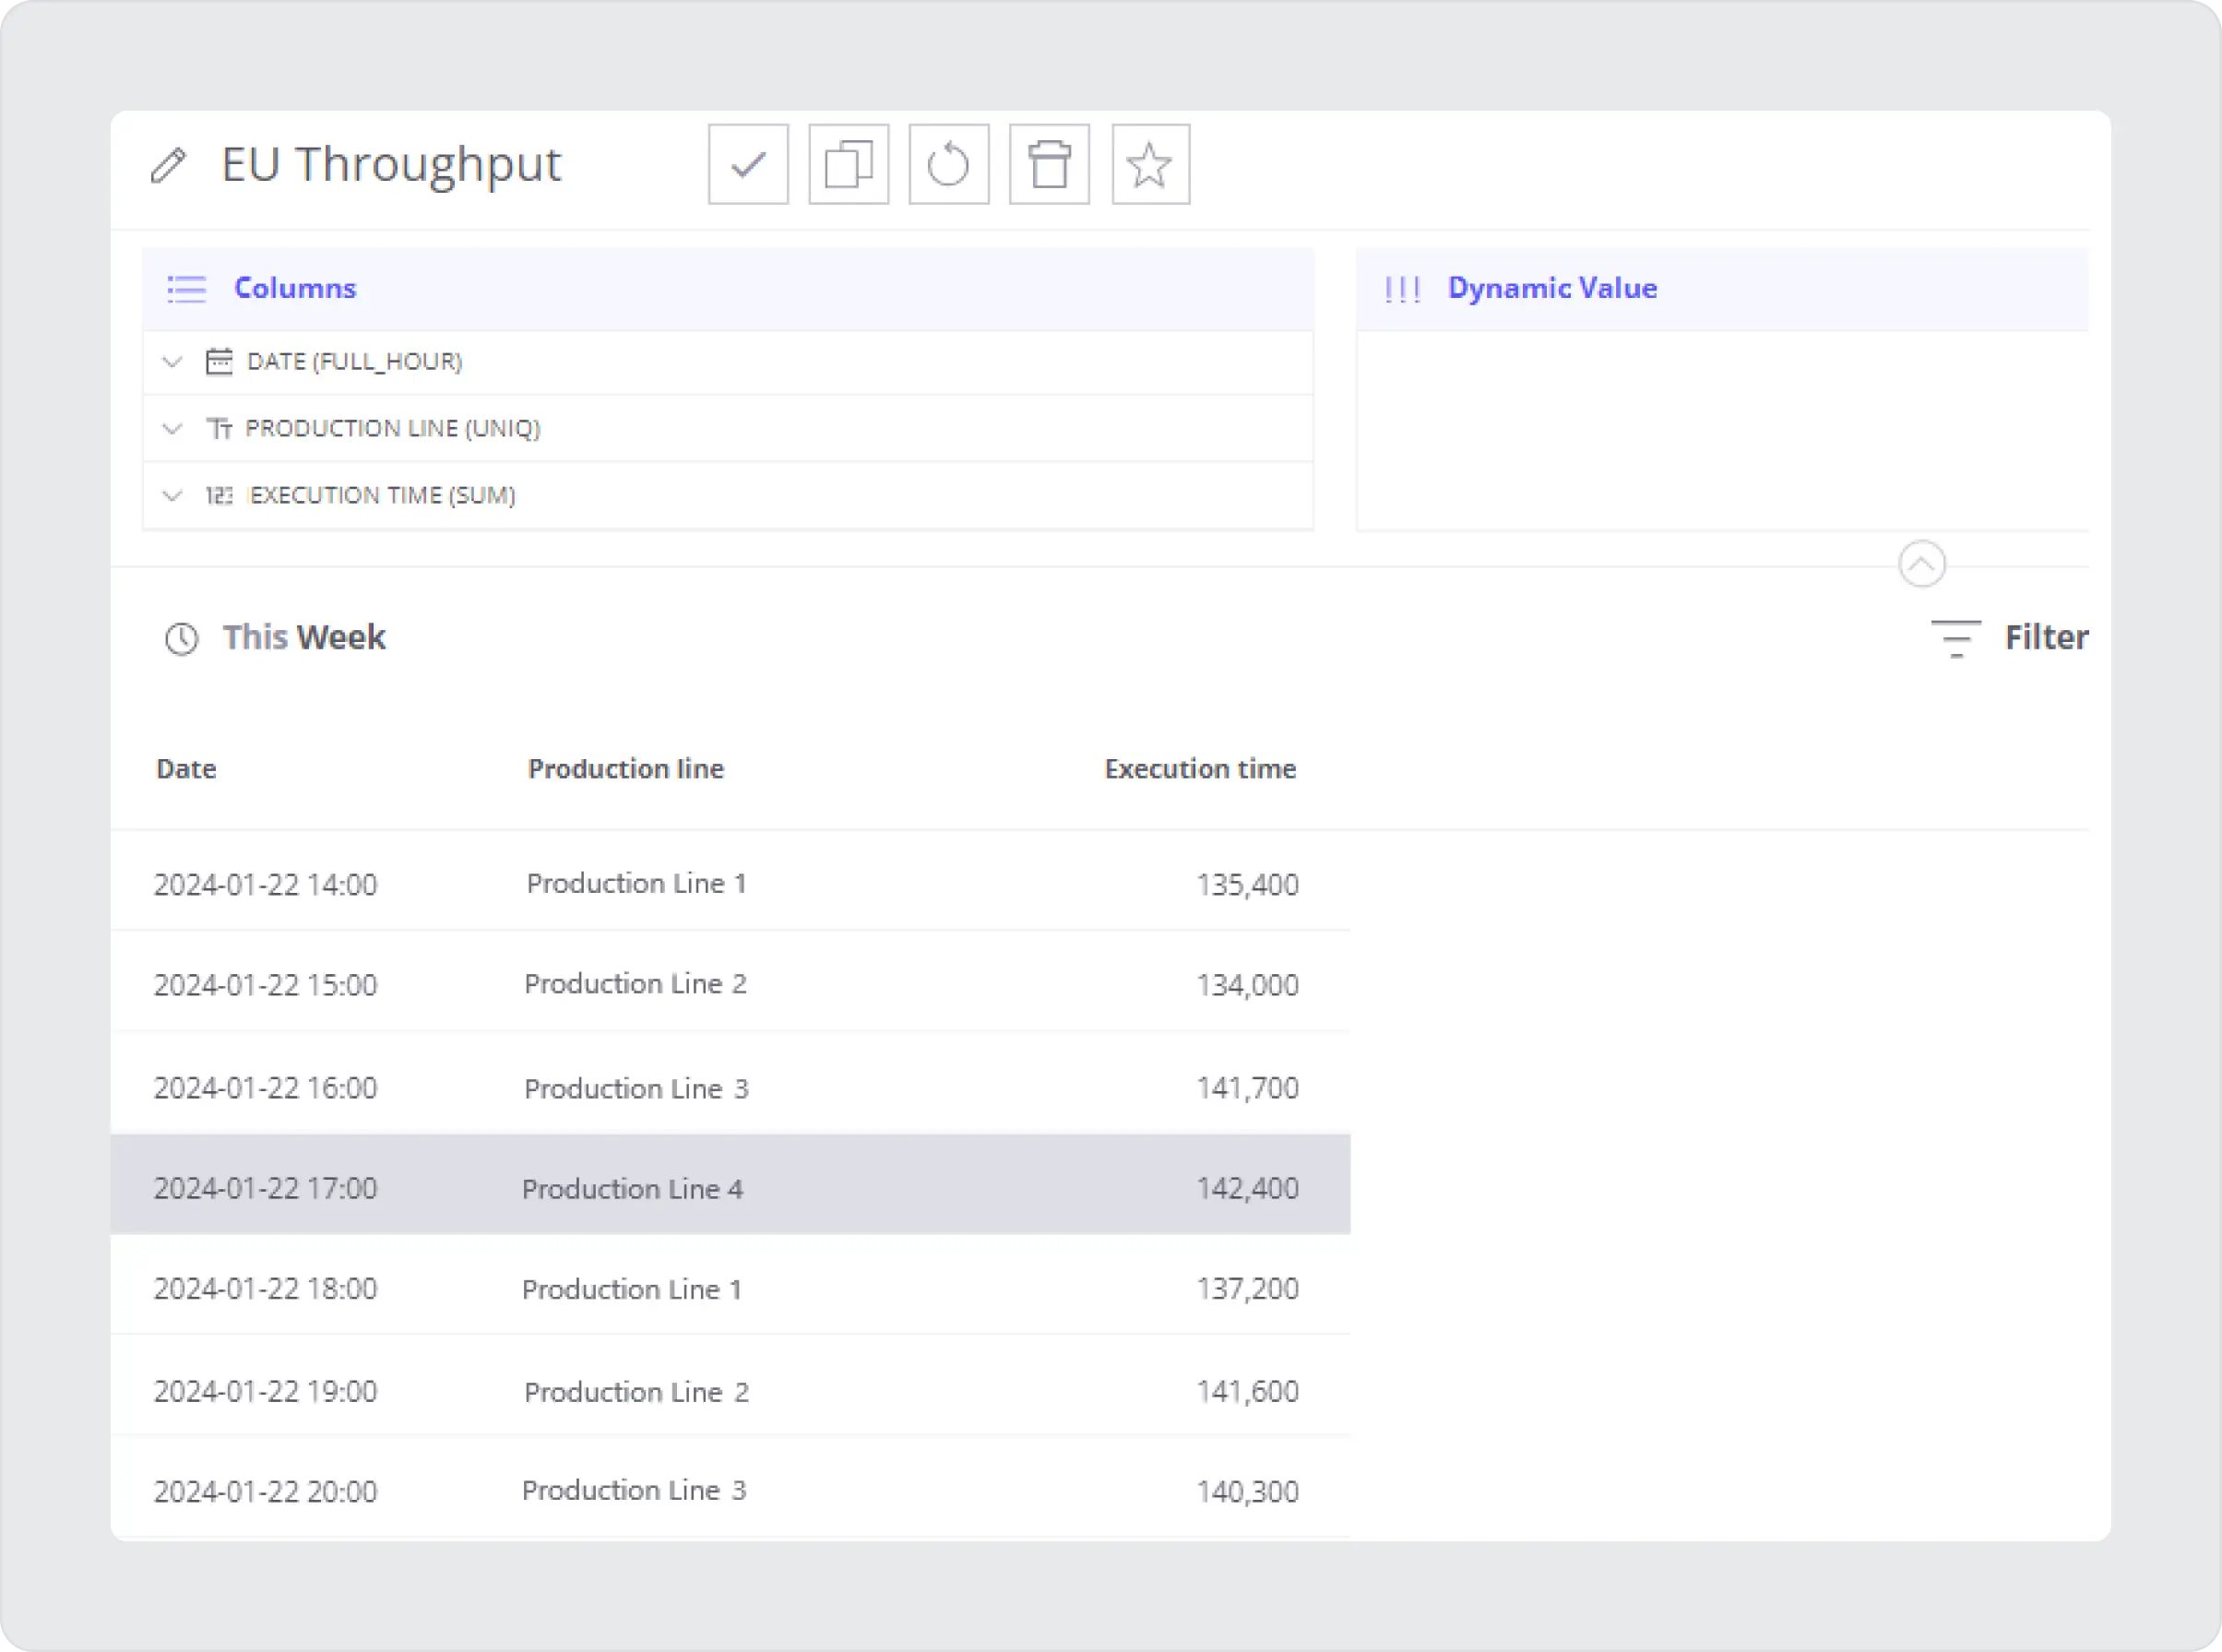
- Throughput – Measuring the rate at which products are produced on a machine, line, plant, or across the entire company. Throughput is calculated from meters installed at the inlet and outlet of each production line. After that, the advanced analytics system converts the raw data of time indicators into a ready-made report of the time it took the equipment to perform a certain action.
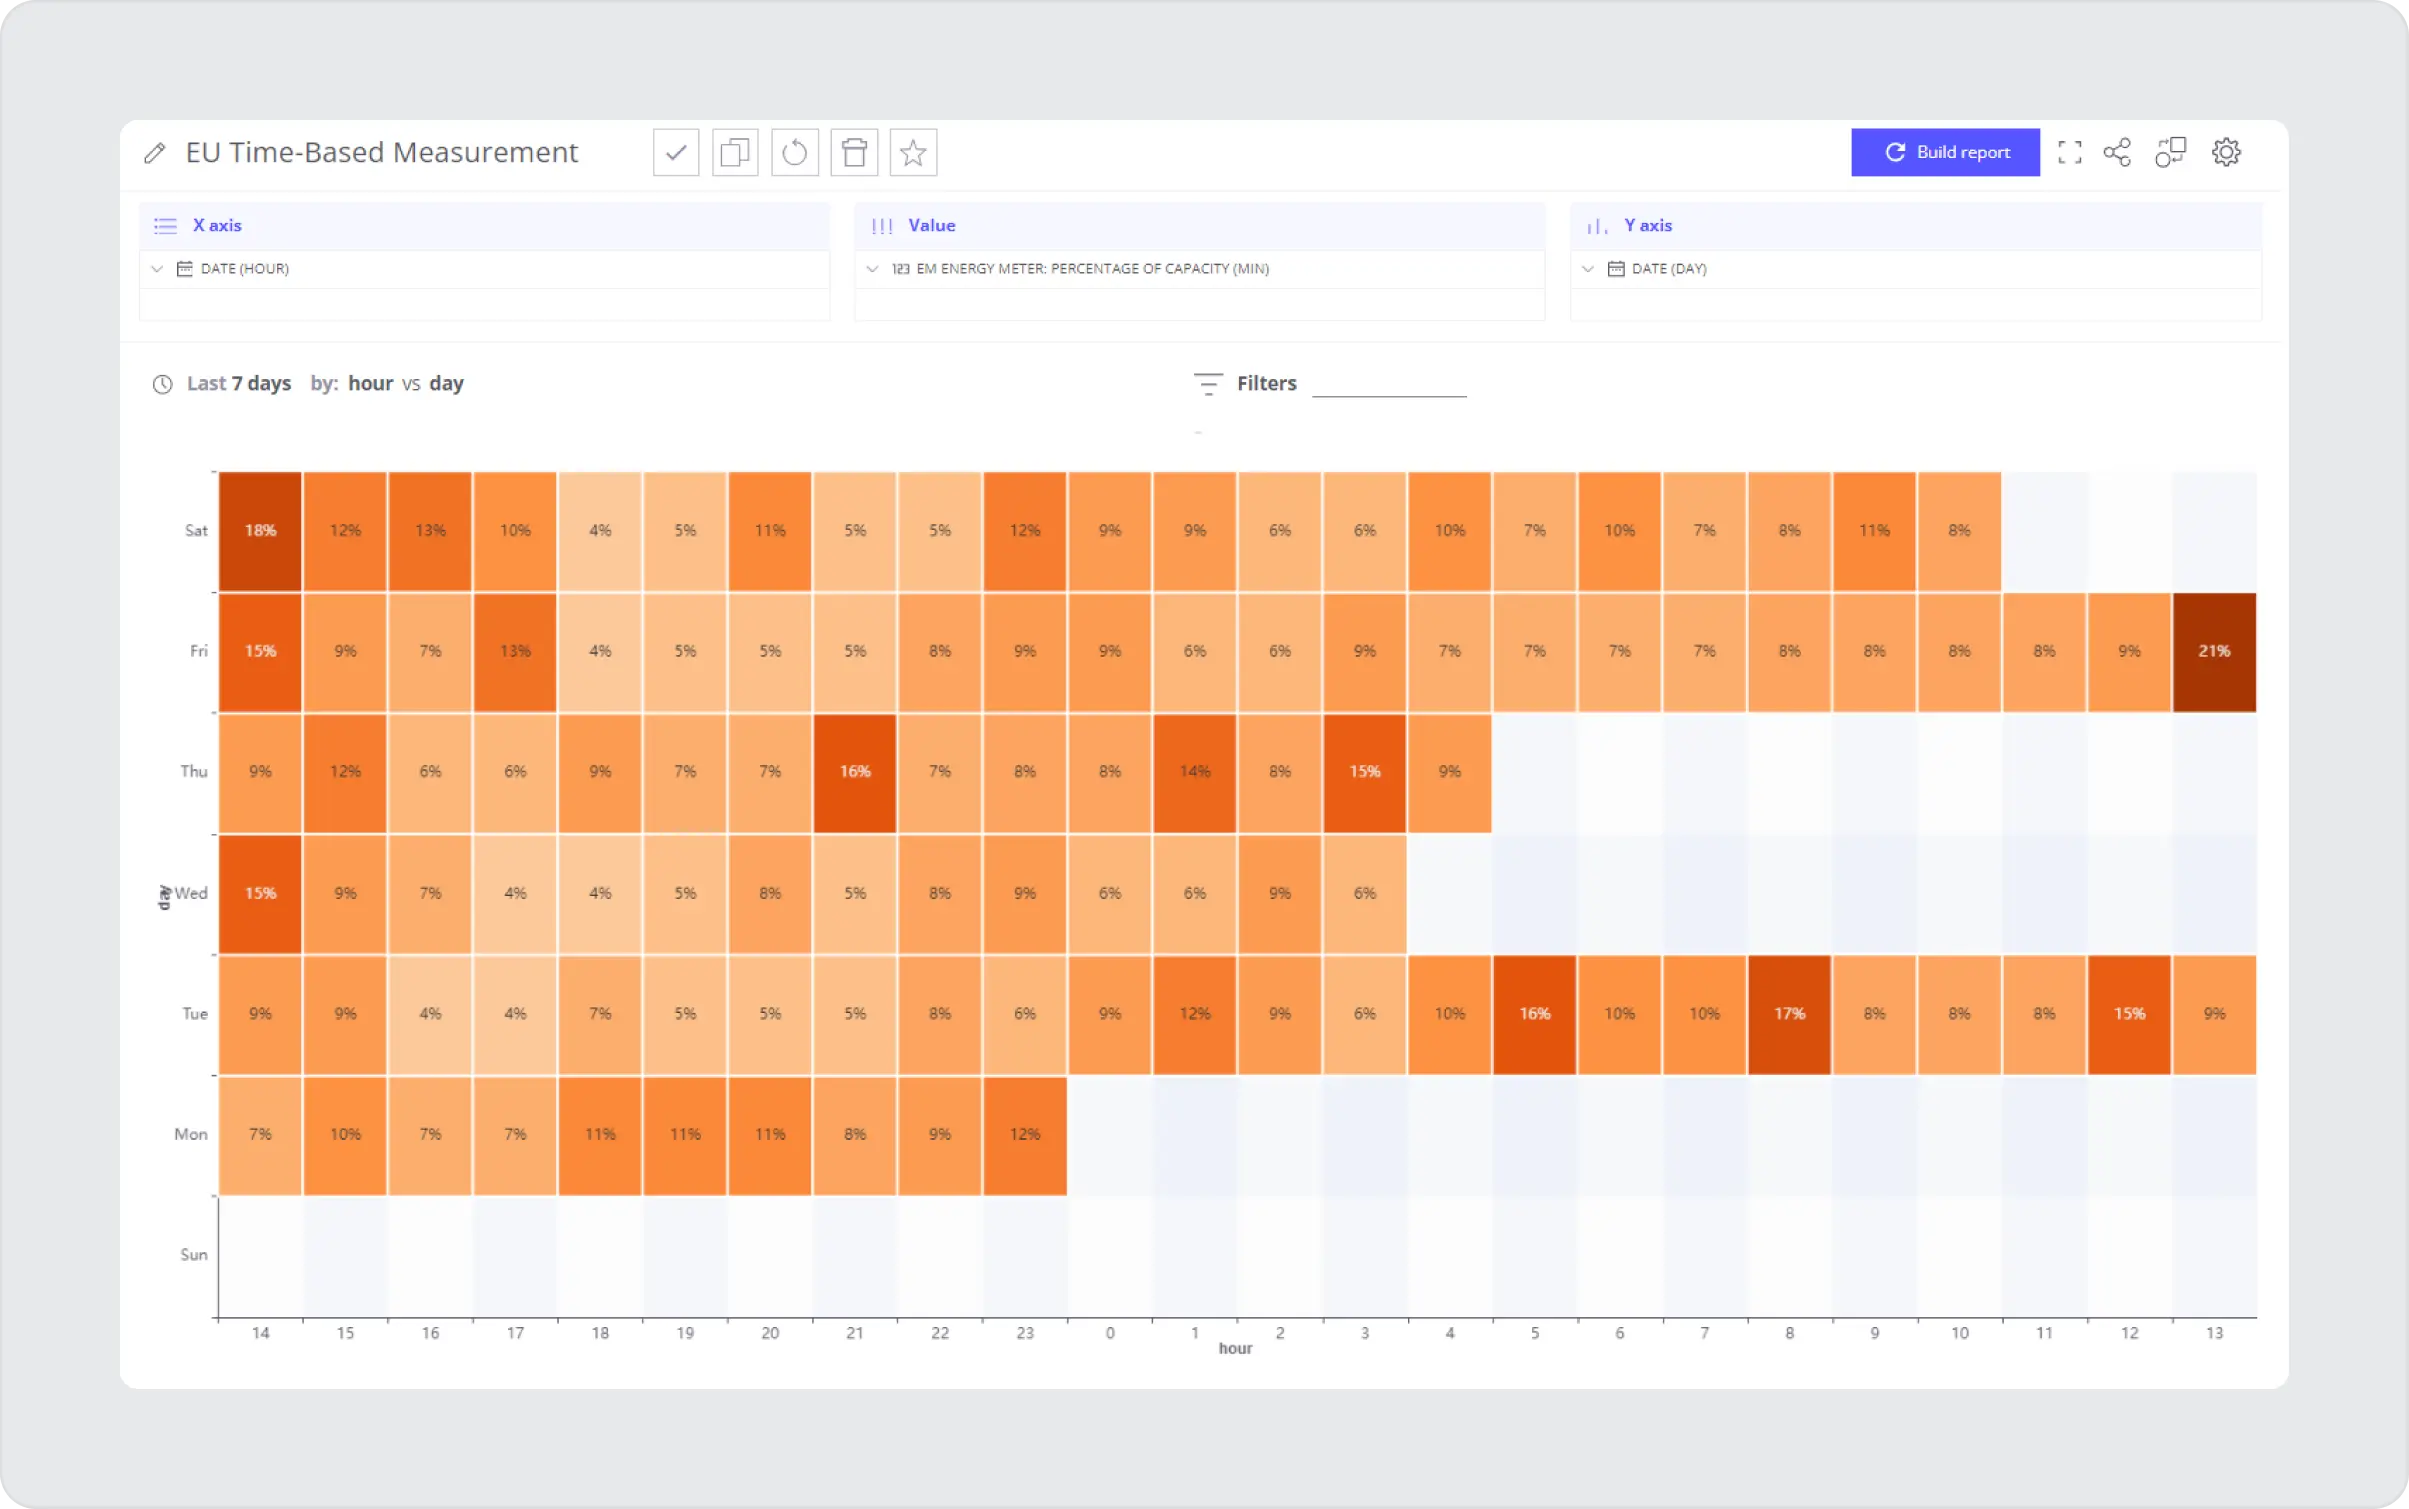
- Time-Based Measurement – tracks how long the equipment is actively used during a defined period, such as a shift or a day. This measurement is crucial as it reveals the actual usage versus the potential capacity, highlighting whether the equipment is being underutilized or overused. Information is collected using IoT devices or functions built into the equipment. After that, raw time data is translated into a ready-made KPI indicator using advanced analytics.
Excessive Wear and Tear on Machinery and Suboptimal Maintenance Scheduling
- Downtime and Uptime – Uptime refers to the duration when the equipment is running and available for use, directly contributing to productivity. Downtime, on the other hand, represents periods when the equipment is non-operational due to maintenance, breakdowns, or other issues. These metrics are crucial for understanding the reliability and efficiency of equipment. Information is collected using IoT devices or functions built into the equipment. The data does not require any additional processing.
- Mean Time To Repair (MTTR) – This measures the average time it takes to repair equipment after a failure. A lower MTTR helps in reducing downtime and maintaining productivity. This indicator uses the same metrics for calculation as the Downtime and Uptime KPIs. After collecting the data, the advanced analytics system calculates the average value among the time indicators and provides a ready-made report.
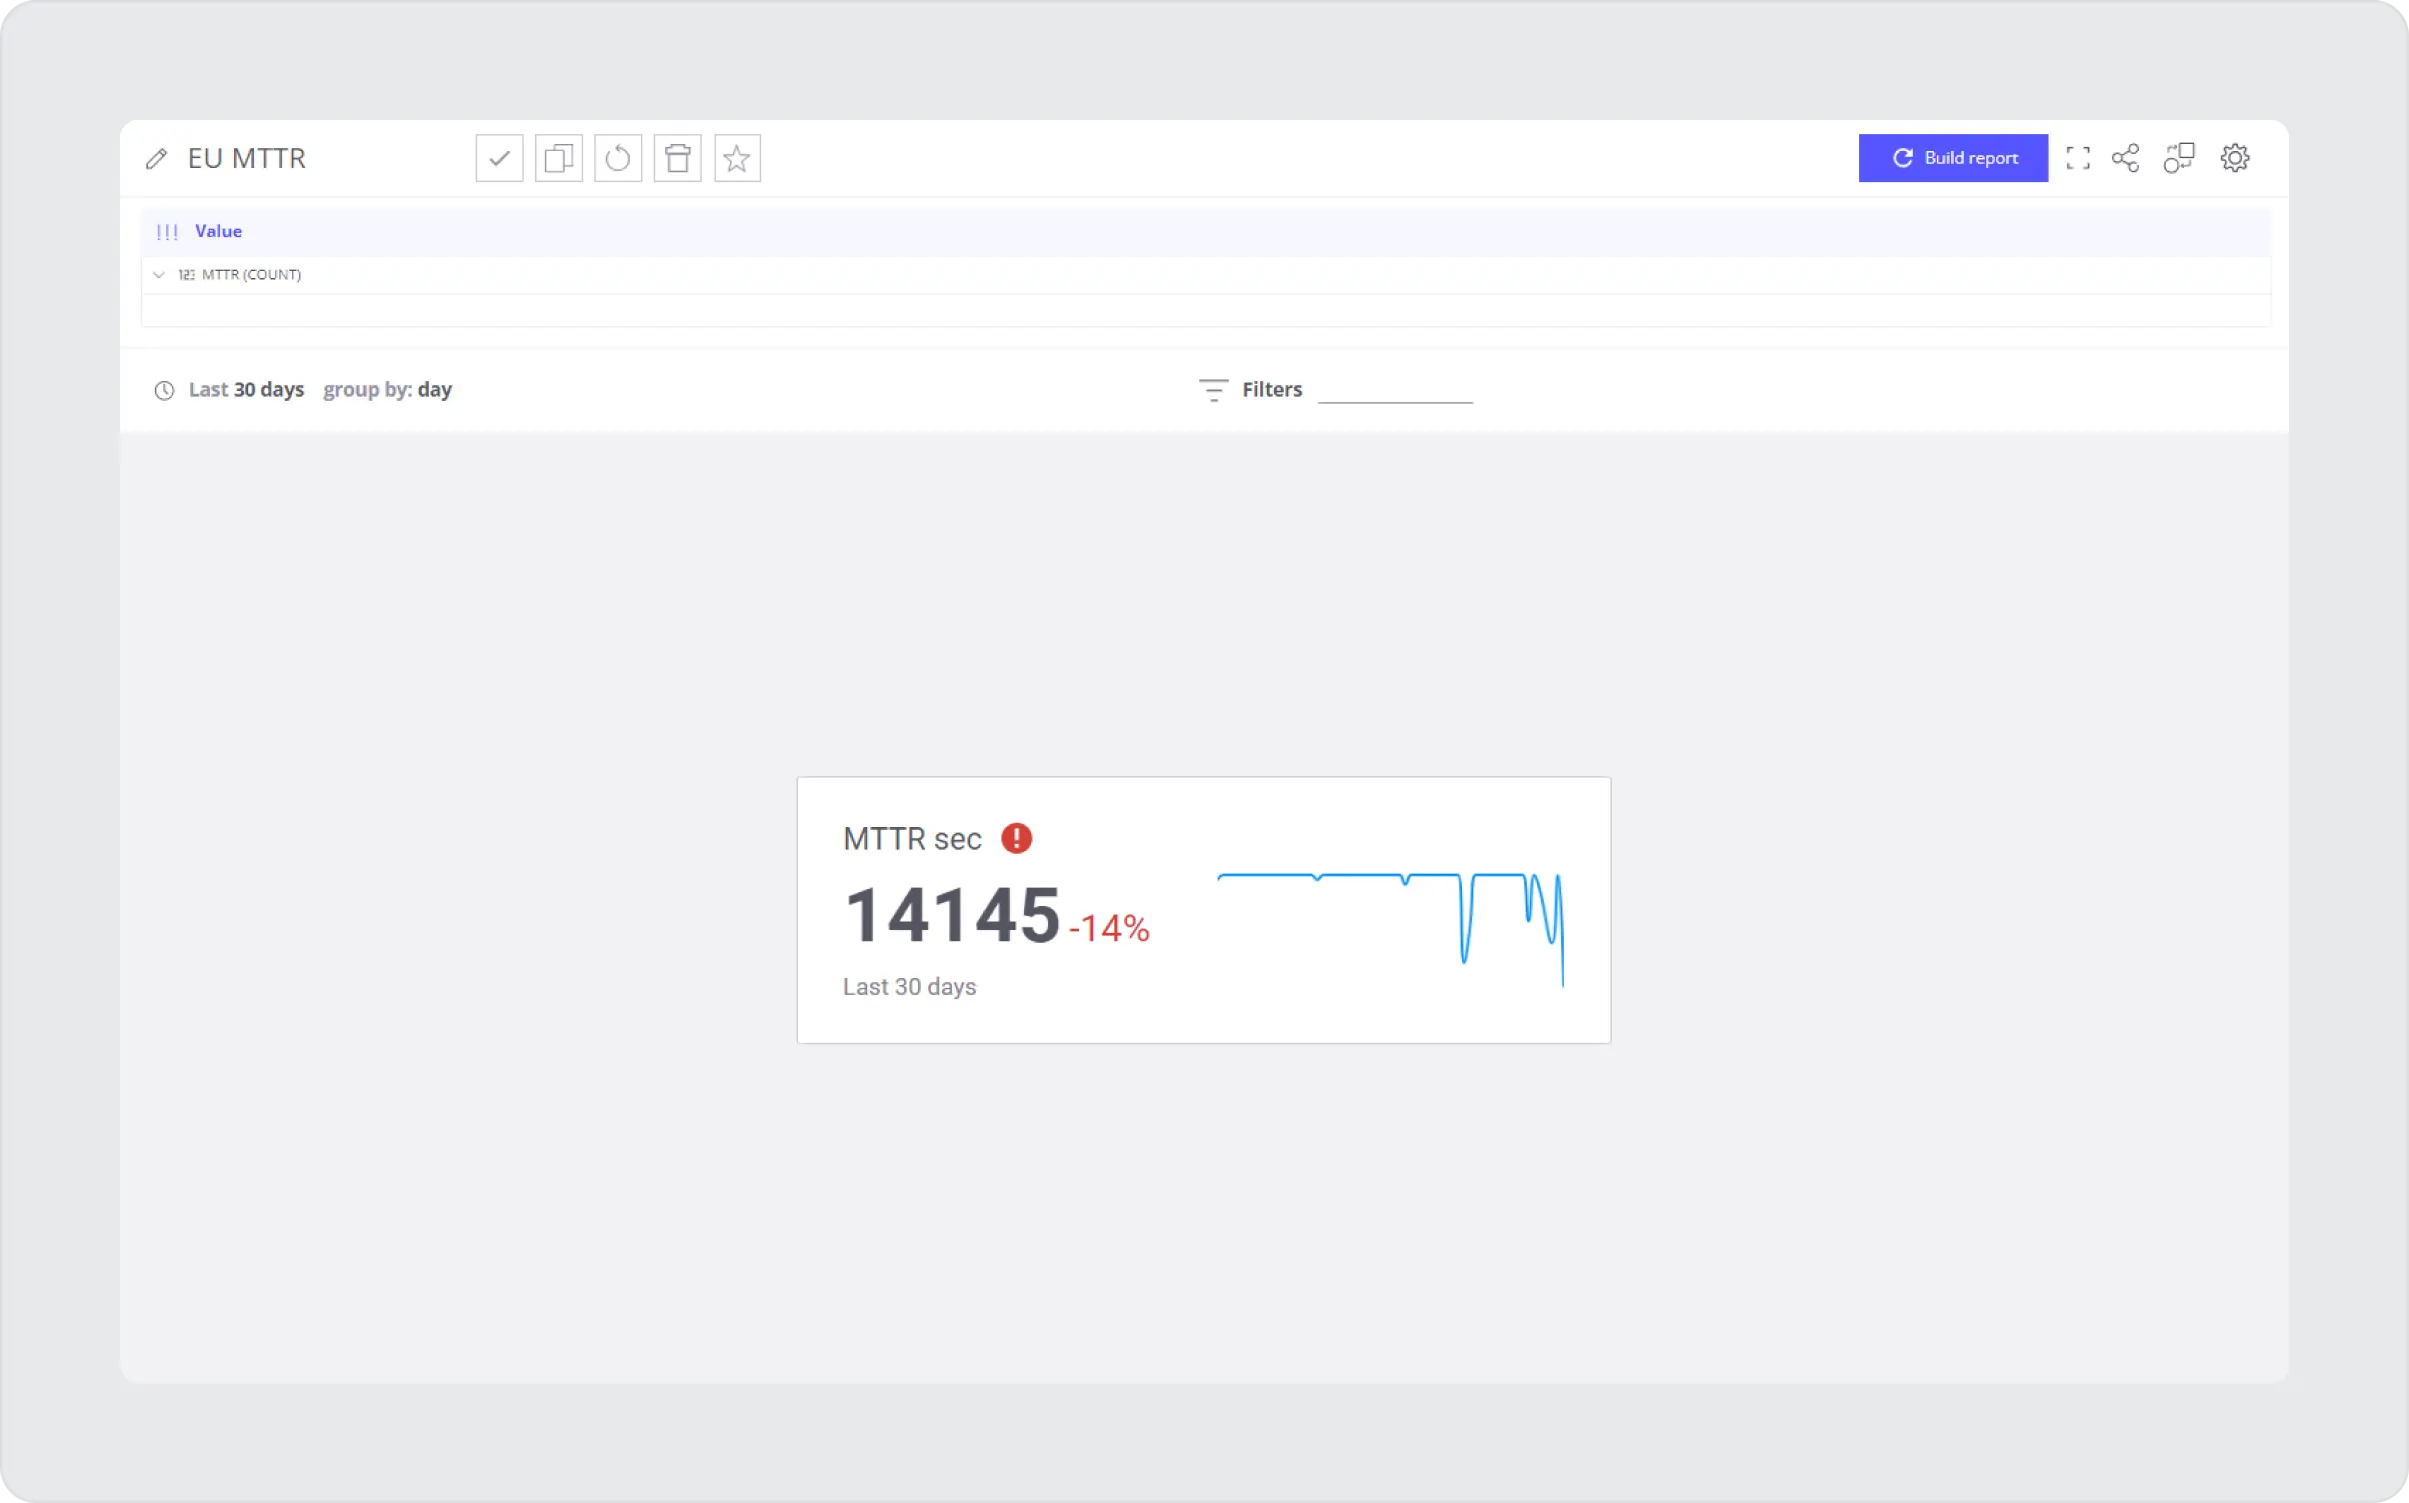
- Mean Time Between Failures (MTBF) – This KPI measures the average time between equipment failures. A higher MTBF indicates more reliable equipment. This indicator uses the same metrics for calculation as the Downtime and Uptime KPIs. After collecting the data, the advanced analytics system calculates the average value among the time indicators and provides a ready-made report.
Based on the indicators, this method helps to track production and has more opportunities to react proactively or to problems. Thus, the use of advanced analytics gives us access to:
- Maximizing Efficiency: Companies can identify underused resources by measuring how much equipment is used compared to its full potential. This helps make adjustments to increase efficiency, ensuring that the equipment is not just sitting idle when it could contribute to production.
- Cost Optimization: Equipment represents a significant investment for any business. Measuring its utilization helps understand whether the company is getting the most out of this investment. If equipment isn’t used effectively, it could lead to unnecessary expenses like paying for machines that aren’t contributing to revenue generation.
- Improving Production Planning: Equipment utilization data is crucial for effective production scheduling. It helps align the use of machinery with production demands, ensuring that the right equipment is available and operational when needed.
- Reducing Wear and Tear: Overuse of equipment can lead to increased maintenance needs and shorter lifespans for machinery. By monitoring utilization, companies can balance the workload on equipment to prevent excessive wear and tear.
- Identifying Bottlenecks: Low utilization rates can signal bottlenecks where equipment is not used effectively in production. This can lead to insights about process inefficiencies or the need to reallocate resources.
- Maintenance Scheduling: Knowing how frequently and intensely equipment is used informs maintenance schedules. Instead of following a rigid maintenance calendar, companies can plan maintenance based on actual usage, reducing downtime and maintenance costs.
Conclusion
The exploration of advanced analytics in equipment utilization underscores a transformative shift in optimizing manufacturing processes. By integrating real-time data collection through IoT devices with the analytical power of advanced analytics and machine learning, production facilities are equipped to make more informed, proactive decisions. This approach revolutionizes equipment management by providing a deeper and more accurate understanding of various key performance indicators (KPIs) like Equipment Utilization Rate, Throughput, Downtime and Uptime, MTTR, and MTBF.
The implications of this evolution are far-reaching. Advanced analytics enables a more dynamic approach to addressing challenges like underutilization, inefficient production scheduling, and excessive wear and tear on machinery. It allows for real-time identification of operational bottlenecks and facilitates more strategic maintenance scheduling, thereby extending the lifespan of equipment and optimizing investment returns.
Furthermore, the capacity to predict and preempt equipment failures through these sophisticated analytical tools enhances operational efficiency and significantly reduces costs. This proactive equipment maintenance and optimization approach ensures that resources are utilized effectively, reducing wastage and downtime.
In conclusion, integrating advanced analytics into equipment utilization is not just an enhancement of existing processes; it’s a fundamental shift towards a more data-driven, efficient, and productive manufacturing environment. Adopting these technologies will become a cornerstone for competitive advantage as industries evolve, driving innovation and excellence in manufacturing processes. The future of industrial efficiency and productivity lies in harnessing the power of advanced analytics, and the journey has just begun.
