This state combines an interactive map with a real-time table of tank metrics, displaying fuel level, temperature, battery, and connectivity status for each unit. It also includes a centralized alarm panel showing active alarms like low fuel, overheating, or offline sensors. The unified view allows operators to monitor spatial distribution and critical tank data at a glance, ensuring fast, informed decision-making.
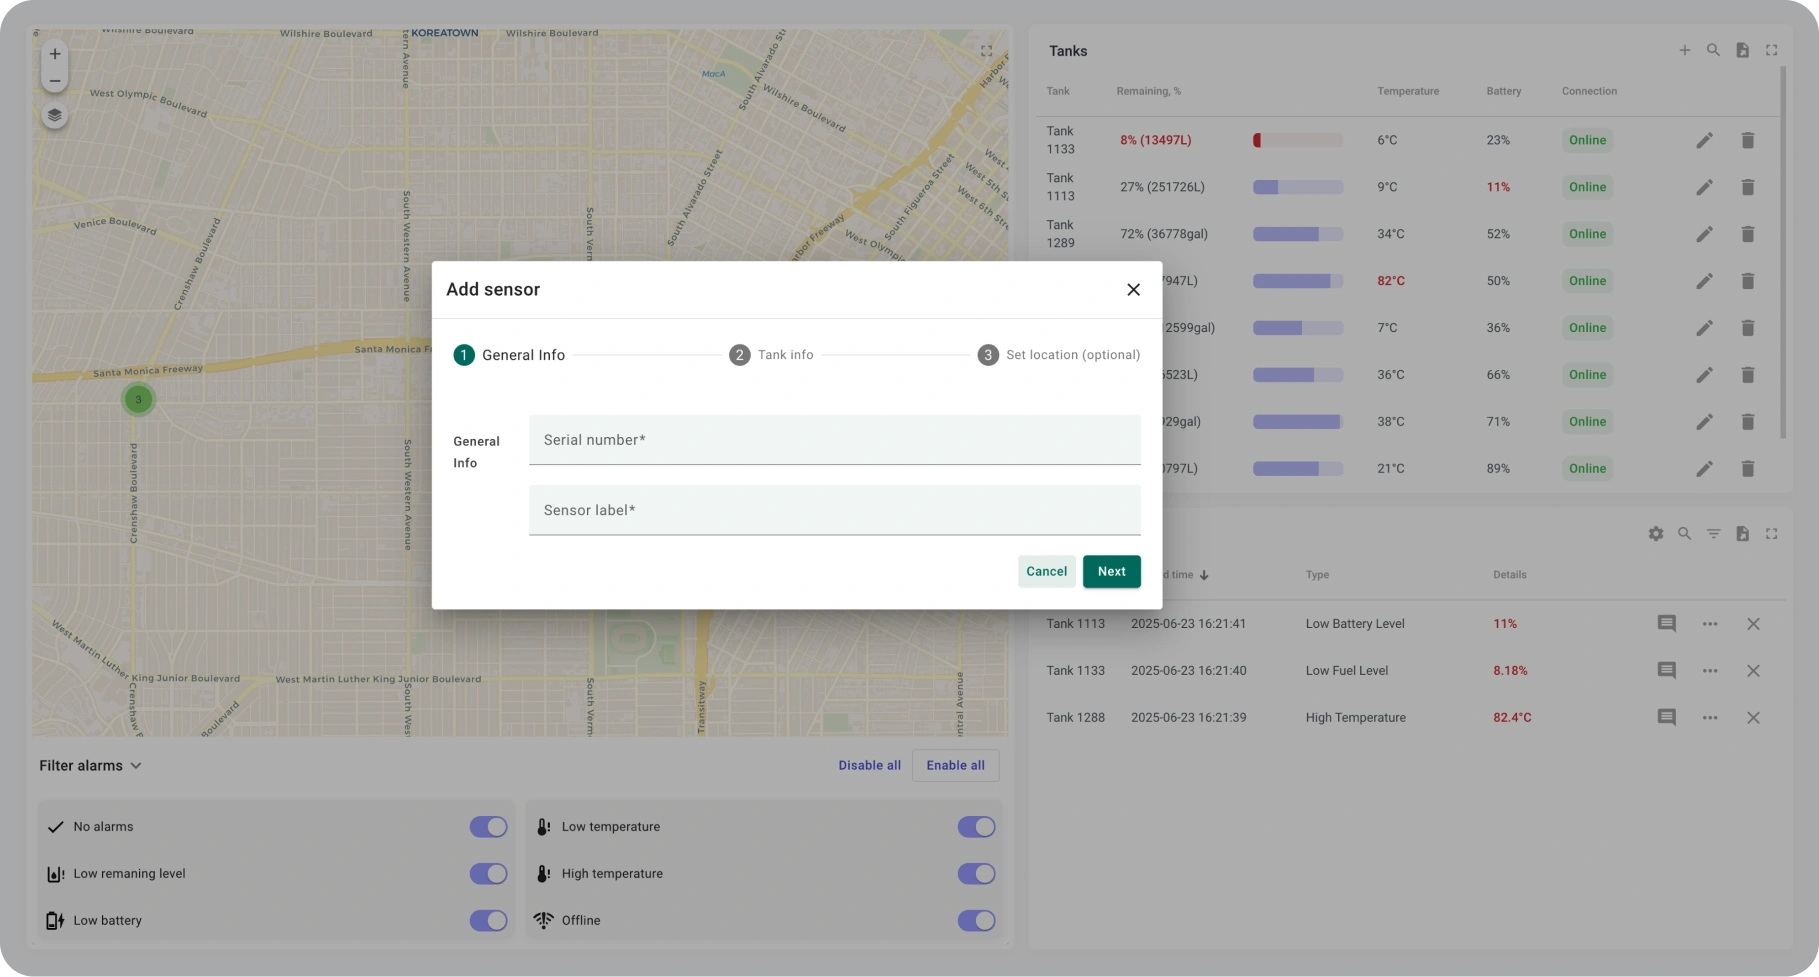
This form guides users through adding a new sensor by entering its serial number and assigning a label. It’s the first step in onboarding a tank into the system. Simple onboarding flows are critical for scaling the monitoring system with minimal manual work or technical barriers.
This screen lets users configure threshold values for alarms based on remaining level, temperature, and battery status. Alarms are triggered when incoming data crosses defined boundaries. Such visual rule management helps organizations enforce control policies and reduce downtime through preventive alarms.
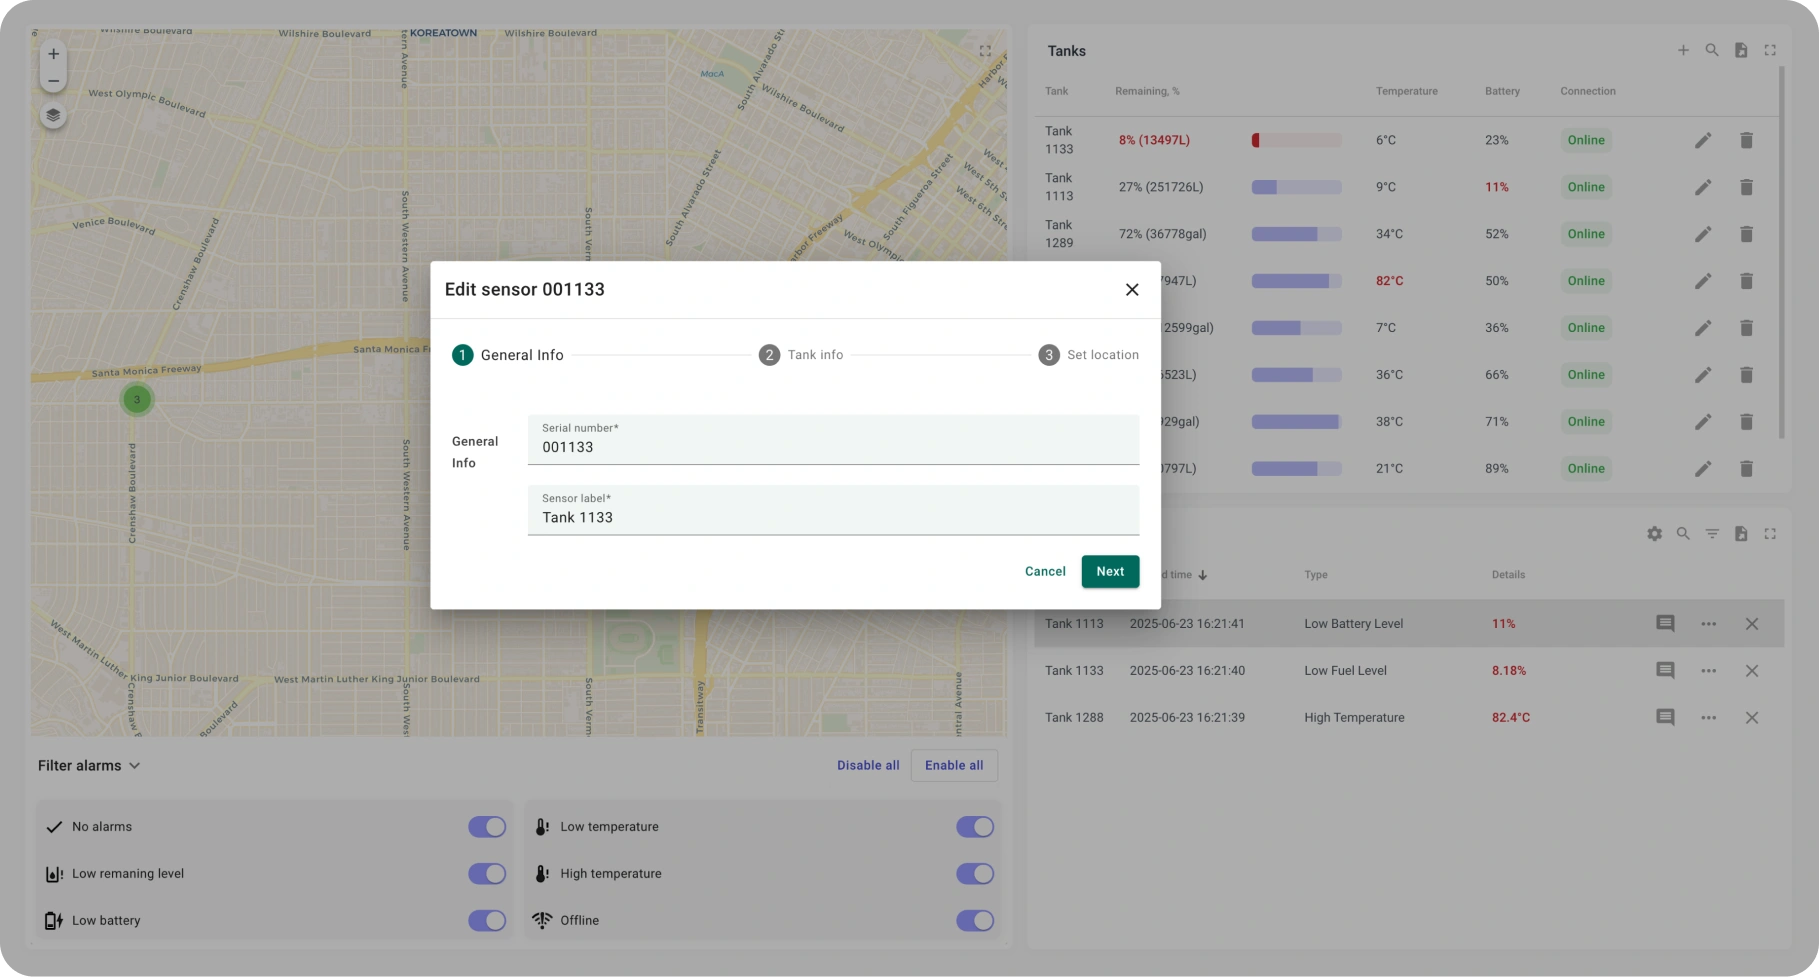
This state allows users to edit key sensor details, including the serial number, custom label, tank assignment, and related metadata. It provides a clean, form-based interface to ensure sensor information stays accurate and organized across the system. Maintaining consistent sensor data is essential for reliable monitoring, especially in large-scale deployments with many connected devices.
This state provides a detailed view of an individual tank, displaying current fuel level with visual indicators, real-time telemetry, historical data logs, and refill or drain events. It also includes a list of recent alarms related to this tank, such as level drops or temperature spikes, with timestamps and statuses. Such granular visualization helps operators track tank behavior over time, identify abnormal patterns, and take preventive action before issues escalate.
This state allows users to define the physical characteristics of a tank — including its shape (e.g., cylindrical, rectangular), dimensions, and total capacity — which are crucial for accurate volume calculation. Users can also configure how the sensor interprets level data based on the tank geometry and select the preferred measurement method (e.g., linear, step-based). Precise calibration of sensor readings to the real tank shape significantly improves measurement accuracy and ensures correct volume representation on dashboards.
Interactive map and tank status overview state
This state combines an interactive map with a real-time table of tank metrics, displaying fuel level, temperature, battery, and connectivity status for each unit. It also includes a centralized alarm panel showing active alarms like low fuel, overheating, or offline sensors. The unified view allows operators to monitor spatial distribution and critical tank data at a glance, ensuring fast, informed decision-making.

Sensor add interface
This form guides users through adding a new sensor by entering its serial number and assigning a label. It’s the first step in onboarding a tank into the system. Simple onboarding flows are critical for scaling the monitoring system with minimal manual work or technical barriers.
Alarm rules configuration
This screen lets users configure threshold values for alarms based on remaining level, temperature, and battery status. Alarms are triggered when incoming data crosses defined boundaries. Such visual rule management helps organizations enforce control policies and reduce downtime through preventive alarms.

Edit sensor
This state allows users to edit key sensor details, including the serial number, custom label, tank assignment, and related metadata. It provides a clean, form-based interface to ensure sensor information stays accurate and organized across the system. Maintaining consistent sensor data is essential for reliable monitoring, especially in large-scale deployments with many connected devices.
Tank details dashboard state
This state provides a detailed view of an individual tank, displaying current fuel level with visual indicators, real-time telemetry, historical data logs, and refill or drain events. It also includes a list of recent alarms related to this tank, such as level drops or temperature spikes, with timestamps and statuses. Such granular visualization helps operators track tank behavior over time, identify abnormal patterns, and take preventive action before issues escalate.

Tank shape
This state allows users to define the physical characteristics of a tank — including its shape (e.g., cylindrical, rectangular), dimensions, and total capacity — which are crucial for accurate volume calculation. Users can also configure how the sensor interprets level data based on the tank geometry and select the preferred measurement method (e.g., linear, step-based). Precise calibration of sensor readings to the real tank shape significantly improves measurement accuracy and ensures correct volume representation on dashboards.


'%20stroke='%233E9AF8'%20stroke-width='1.5'/%3e%3cg%20clip-path='url(%23a)'%20fill='%233E9AF8'%3e%3cpath%20d='m196.475%2095.626-15.033-15.07a1.8%201.8%200%200%200-1.273-.528h-9.235a3.766%203.766%200%200%200-3.762%203.762v20.652h-5.919V86.474a3.598%203.598%200%200%200-3.593-3.594h-7.188V64.91a3.598%203.598%200%200%200-3.594-3.594H128.91a3.598%203.598%200%200%200-3.594%203.594v7.906h-7.21a1.797%201.797%200%201%200%200%203.594h7.21v6.469h-18.519a1.797%201.797%200%201%200%200%203.594h7.715v17.968h-7.715c-.993%200-1.797.805-1.797%201.797v10.063c0%20.992.804%201.797%201.797%201.797h7.599a8.932%208.932%200%200%200%201.735%206.468h-9.334a1.797%201.797%200%201%200%200%203.594h30.891c4.954%200%208.985-4.03%208.985-8.984%200-.365-.025-.725-.068-1.078h26.024a8.938%208.938%200%200%200%201.735%206.468h-16.985a1.797%201.797%200%201%200%200%203.594h24.168c4.954%200%208.984-4.03%208.984-8.984%200-.365-.024-.725-.066-1.078h2.773a3.767%203.767%200%200%200%203.762-3.763v-17.44c0-.476-.189-.933-.525-1.27Zm-3.069%205.941h-9.318l3.314-3.313%203.313-3.313%202.691%202.698v3.928Zm-15.453-1.796v-5.26l6.174-6.174%204.05%204.06-9.056%209.055a1.799%201.799%200%200%201-1.168-1.681Zm3.636-13.979-3.636%203.636v-5.806h1.471l2.165%202.17Zm-23.927%2018.65h-17.971V86.474h3.594v5.39c0%20.993.804%201.797%201.797%201.797h7.187c.993%200%201.797-.804%201.797-1.797v-5.39h3.594l.002%2017.968Zm-10.784-17.968h3.594v3.593h-3.594v-3.593Zm-7.21-21.563v3.594h-3.593V64.91h3.593Zm-10.758%200h3.571v5.39c0%20.993.804%201.798%201.797%201.798h7.187c.992%200%201.797-.805%201.797-1.797v-5.39h3.616l.003%2017.968H128.91V64.91Zm0%2021.563v3.593h-3.594v-3.593h3.594Zm-10.804%200h3.616v5.39c0%20.993.805%201.797%201.797%201.797h7.188c.992%200%201.796-.804%201.796-1.797v-5.39h3.572l.002%2017.968h-17.971V86.474Zm-.183%2032.703a5.396%205.396%200%200%201%205.39-5.391%205.397%205.397%200%200%201%205.391%205.391%205.396%205.396%200%200%201-5.391%205.39%205.396%205.396%200%200%201-5.39-5.39Zm12.578%205.384a.027.027%200%200%200%20.005.006h-.01a.027.027%200%200%201%20.005-.006Zm7.187.006a5.396%205.396%200%200%201-5.39-5.39%205.396%205.396%200%200%201%205.39-5.391%205.397%205.397%200%200%201%205.391%205.391%205.396%205.396%200%200%201-5.391%205.39Zm7.671-10.062a8.975%208.975%200%200%200-14.858-.713%208.978%208.978%200%200%200-7.188-3.6%208.986%208.986%200%200%200-7.671%204.313h-7.048v-6.469h58.578v6.469h-21.813Zm36.188%2010.062a5.396%205.396%200%200%201-5.391-5.39%205.397%205.397%200%200%201%205.391-5.391%205.397%205.397%200%200%201%205.391%205.391%205.397%205.397%200%200%201-5.391%205.39Zm11.691-10.062h-4.02a8.986%208.986%200%200%200-7.671-4.313%208.985%208.985%200%200%200-7.671%204.313h-3.11V83.79c0-.093.075-.169.168-.169h3.425v16.15a5.396%205.396%200%200%200%205.391%205.39h13.656v9.175a.17.17%200%200%201-.168.169Z'/%3e%3cpath%20d='M150.191%20124.567c-.472%200-.936.193-1.27.527a1.81%201.81%200%200%200-.526%201.27c0%20.473.192.937.526%201.271a1.81%201.81%200%200%200%201.27.526c.473%200%20.937-.192%201.271-.526.334-.334.526-.798.526-1.271a1.81%201.81%200%200%200-.526-1.27%201.812%201.812%200%200%200-1.271-.527ZM110.918%2076.411a1.81%201.81%200%200%200%201.271-.526c.334-.334.526-.798.526-1.27%200-.473-.191-.937-.526-1.271a1.81%201.81%200%200%200-1.271-.527c-.473%200-.937.193-1.271.527a1.806%201.806%200%200%200-.525%201.27c0%20.473.19.937.525%201.27.334.335.798.527%201.271.527Z'/%3e%3c/g%3e%3cdefs%3e%3cclipPath%20id='a'%3e%3cpath%20fill='%23fff'%20transform='matrix(1%200%200%20-1%20106%20140.317)'%20d='M0%200h92v92H0z'/%3e%3c/clipPath%3e%3c/defs%3e%3c/svg%3e)


