Low-power sensor networks
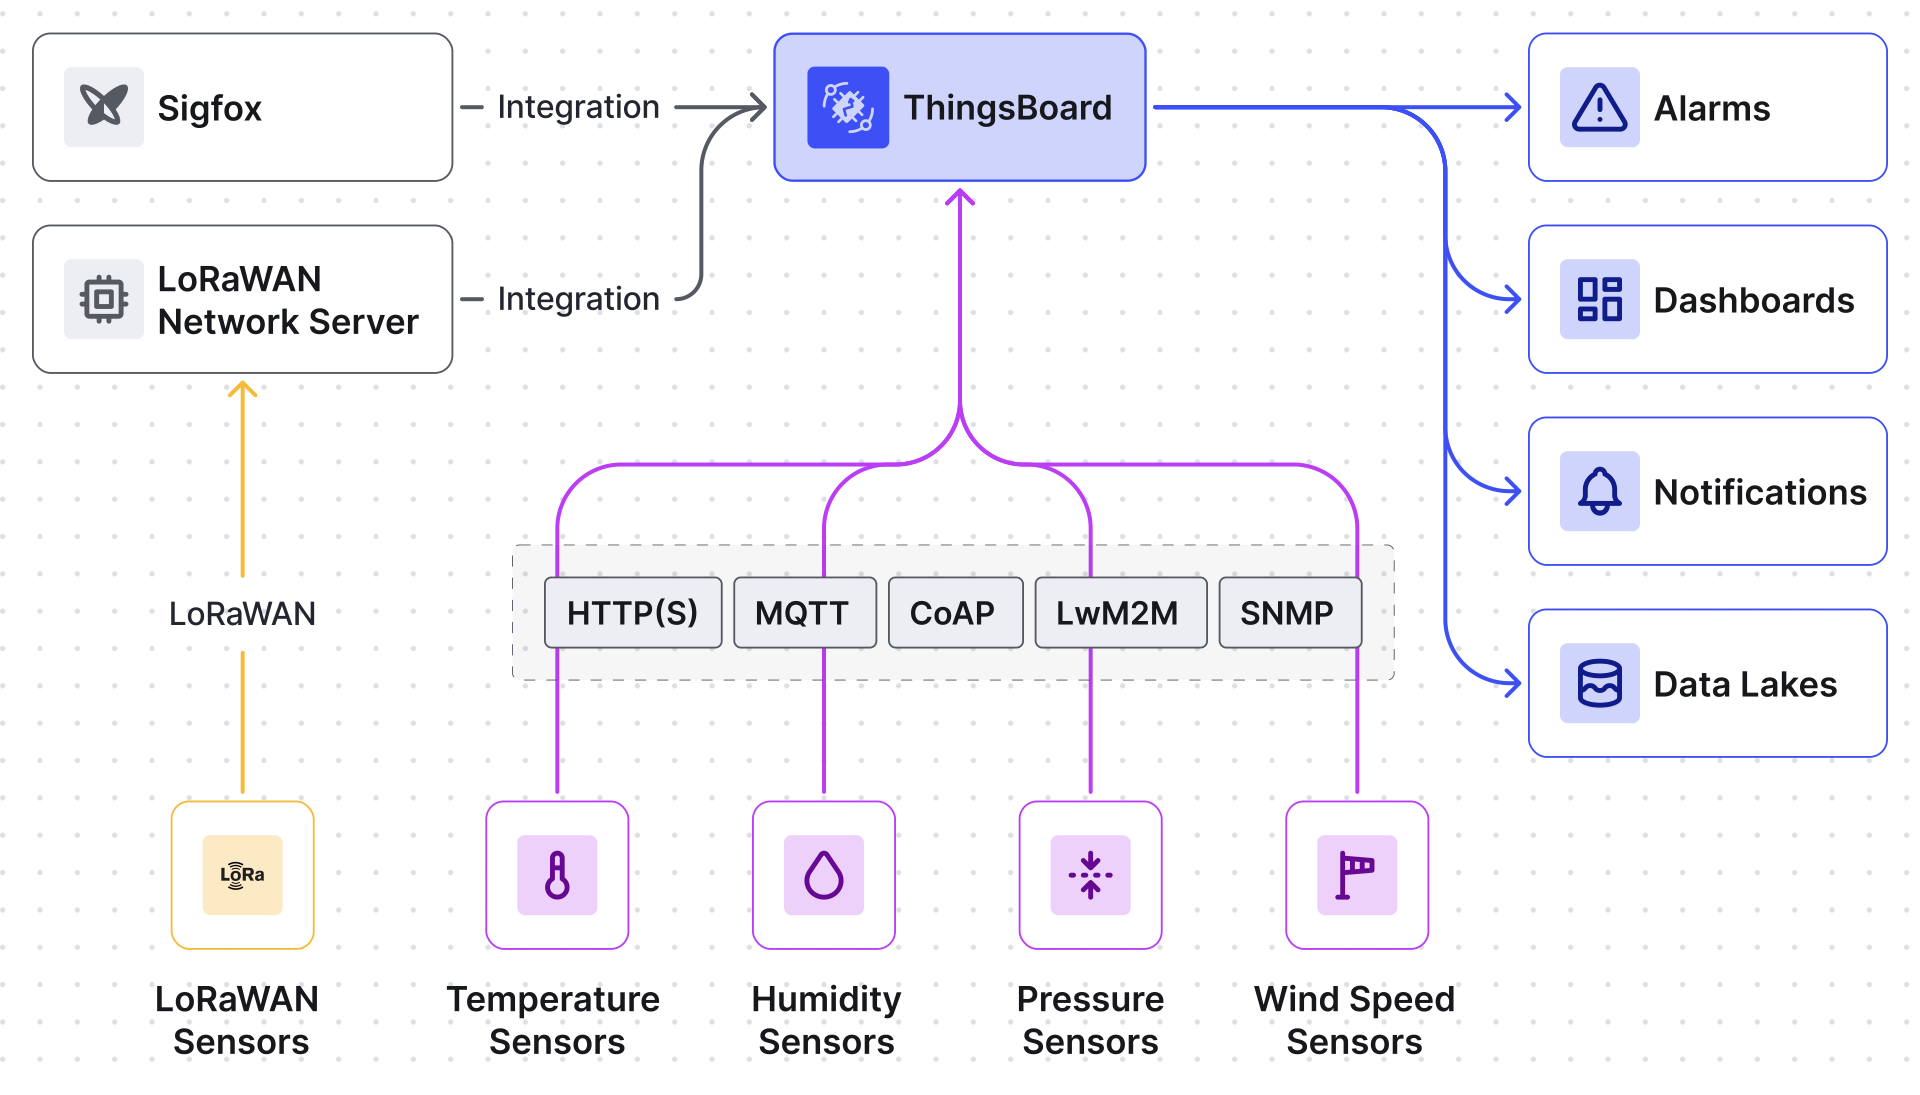
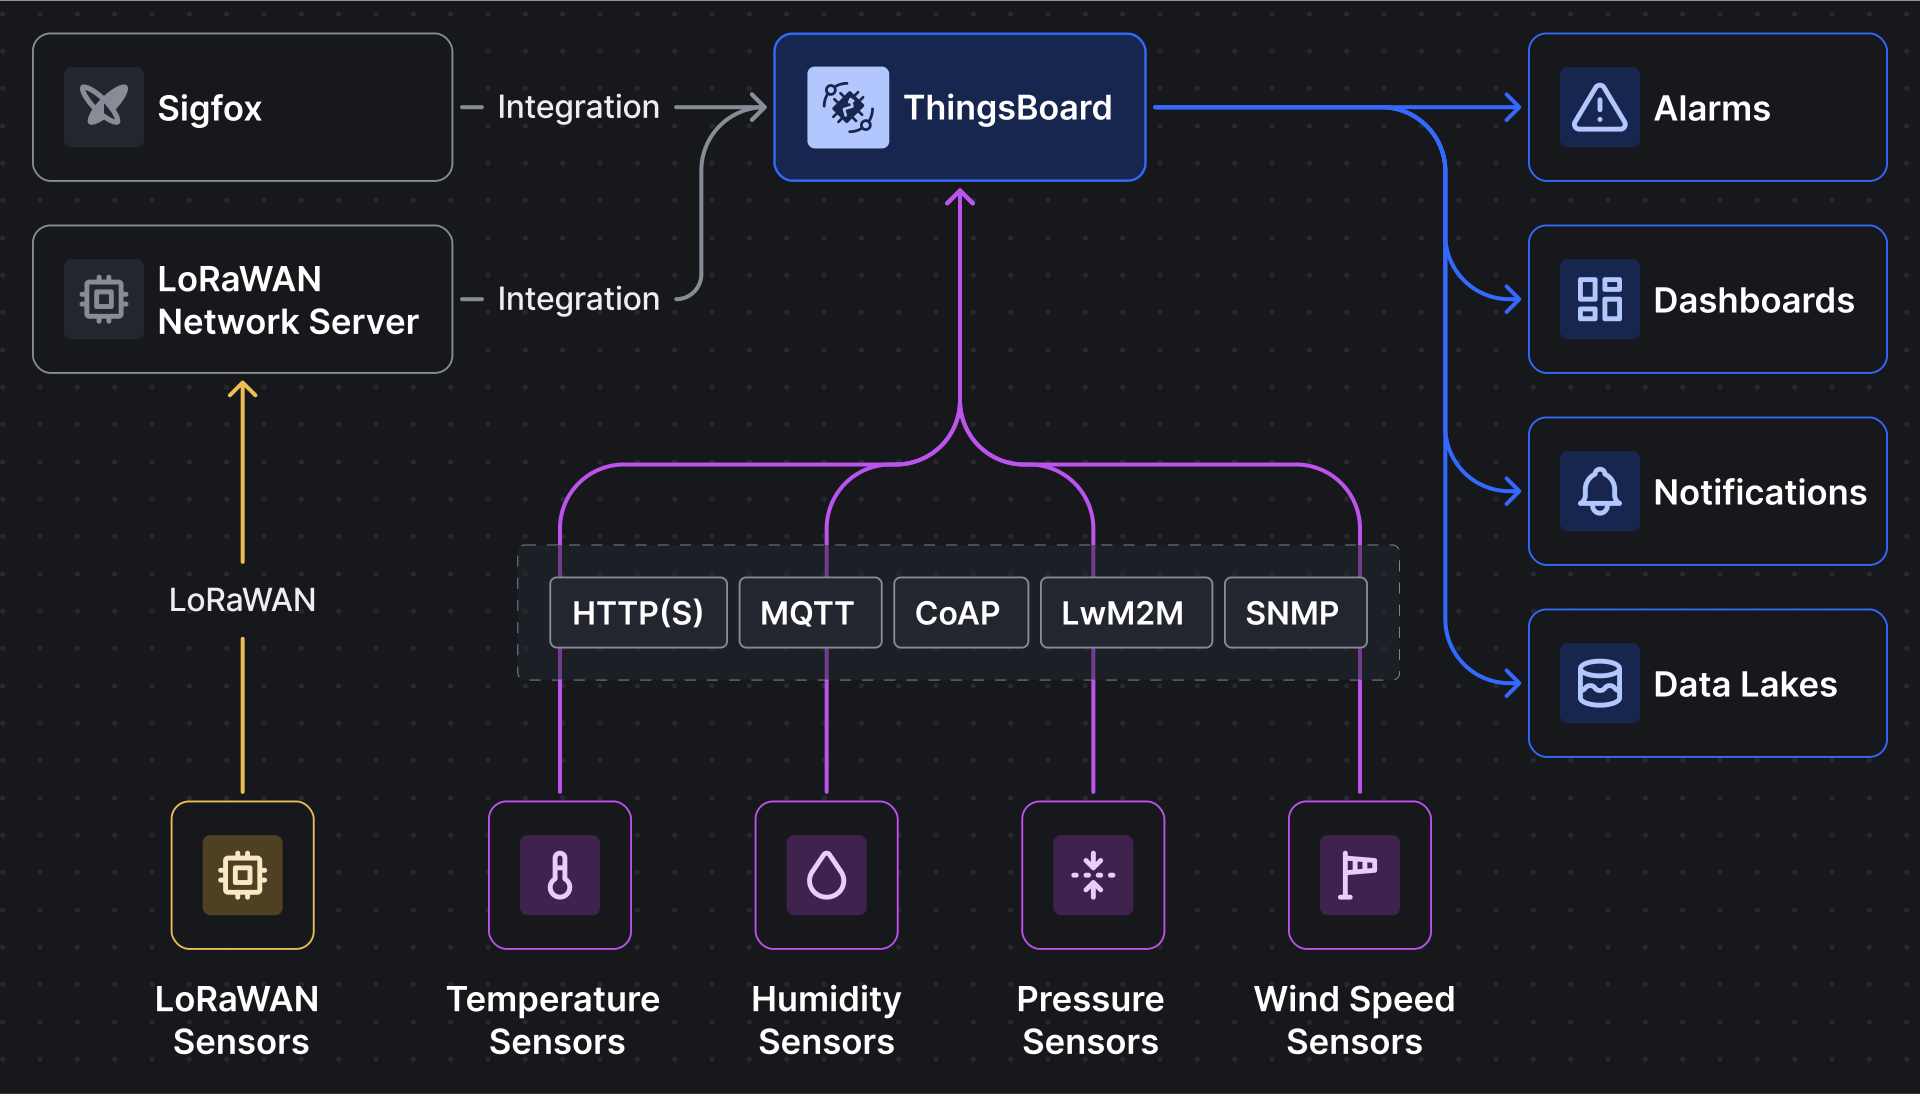
Connect battery-powered sensors from LoRaWAN, NB-IoT, or Sigfox networks, or directly over MQTT, HTTP, CoAP, and LwM2M.
Learn more about integrationsWe use cookies
We use cookies for site analytics, to measure our advertising campaigns and, if you allow it, to load the site search from Google. Nothing optional is set until you choose. You can change your choice anytime in Your Privacy Choices at the bottom of every page. Cookie Policy
IoT environmental monitoring keeps temperature, humidity, CO₂, and other conditions in range across offices, labs, warehouses, and outdoor sites. ThingsBoard collects readings from low-power sensors, alerts your team when a value crosses a threshold, and keeps the full history for audits and reports.
This page covers indoor and outdoor conditions. For outdoor pollution and AQI, see air quality monitoring.
At Medline Adana Hospital, ARIOT uses ThingsBoard and LoRaWAN sensors to keep medicine storage within safe limits.


Sensors send data to ThingsBoard directly over MQTT, HTTP, CoAP, or LwM2M, from LoRaWAN, NB-IoT, or Sigfox networks, or via a platform integration with another cloud.
The rule engine analyzes incoming messages as they arrive, raises alarms, and routes data to dashboards. Operators see alarms and performance metrics in real time from one interface.
The main view lists sensors with their location on a map and their alarms. Click a sensor to see its temperature and humidity history and change its settings.
Dashboard provides real-time monitoring of sensor data with interactive charts displaying metrics like temperature and humidity. The interface allows configuring alarm thresholds and sensor locations while showing active alarms with severity levels. You can analyze historical data and manage device settings.
Track real-time temperature and humidity readings from Sensor C1 along with historical data from the past hour. Compare key metrics (min/max/average values) to maintain optimal environment conditions.

Track real-time temperature and humidity readings from Sensor T1 along with historical data from the past hour. Compare key metrics (min/max/average values) to maintain optimal environment conditions.
You can configure Sensor's critical thresholds including high temperature and low humidity alarms. Precise geolocation can be modified via latitude/longitude coordinates. All changes remain pending until confirmed with the Save button. The Cancel option reverts any unsaved modifications to previous settings.
Cities, labs, farms, schools, and warehouses use environmental monitoring for safety, compliance, and comfort.
Monitoring air quality, noise levels, temperature, and humidity across city zones to support environmental policy, alert residents, improve urban living conditions.
Controlling environmental conditions in greenhouses and agricultural zones, scheduling based on occupancy, and ensuring sustainability targets are met.
Monitoring temperature, humidity, and air circulation to ensure proper storage conditions for perishable goods and pharmaceutical products.


Maintaining sterile conditions and proper ventilation by tracking air quality, CO₂ levels, and temperature in sensitive medical or laboratory zones.
Collecting long-term environmental data for scientific research, campus sustainability programs, and educational use in environmental studies.
Yes. Alarm rules work per sensor or per sensor type, and notifications go out by email, SMS, Slack, Microsoft Teams, or the mobile app.
Battery-powered sensors usually connect from a LoRaWAN, NB-IoT, or Sigfox network through a platform integration with servers such as TTN, ChirpStack, and Actility. Other sensors connect directly over MQTT, HTTP, CoAP, or LwM2M. Details are in the connectivity guide.
Yes. Sensors in labs, clean rooms, and storage rooms report temperature and humidity, alarm rules flag every excursion, and the full history stays available for audits. Role-based access and audit logs show who viewed or changed the data. See the Trust Center for how we protect it.
Yes. Install the Temperature & Humidity sensors template or browse other environment monitoring templates. Each one arrives with dashboards, maps, and alarms that you adapt to your sensors.
The following interactive dashboard represents an environment monitoring component that you may easily embed into your IoT solution. This particular dashboard allows users to monitor temperature and humidity sensors. You may quickly adapt it to air quality or other sensors and add remote control scenarios.
