Stand with Ukraine flag
Pricing Try it now

Air quality monitoring solution

Urban areas, industrial districts, and high-traffic zones constantly battle air pollution — a critical issue that affects both public health and regulatory compliance. From fine particulate matter (PM2.5, PM10) to harmful gases like SO₂ and CO, monitoring these environmental threats requires a robust and responsive system. ThingsBoard rises to this challenge with unmatched flexibility and reliability.

View live demo

The ThingsBoard IoT platform is purpose-built to address this challenge with its scalable architecture, multi-protocol support (MQTT, HTTP, CoAP, LwM2M), and powerful rule engine. It seamlessly connects distributed air quality sensors, ensures secure and reliable data ingestion, and enables real-time analytics and alarming across large deployments.

With its customizable dashboards, flexible data visualization tools, and low-code rule configuration, ThingsBoard empowers organizations to deploy air quality monitoring systems faster, manage them efficiently, and respond to environmental changes proactively. Whether for smart cities, industrial compliance, or community health initiatives, ThingsBoard delivers the performance and adaptability needed to take control of air quality.

Accelerate your IoT roadmap with our team

Our team is a trusted partner for scalable solutions delivered fast and on a fixed timeline.

Letter icon
How it works

Solution structure of air quality monitoring

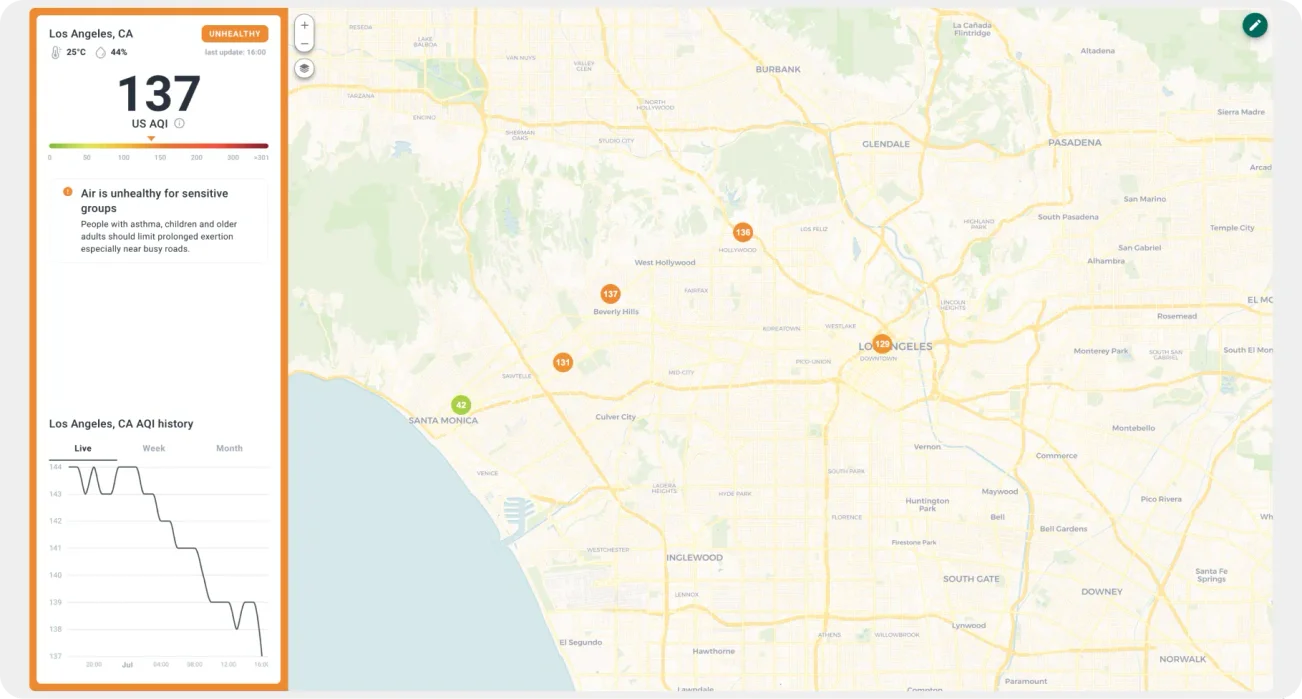
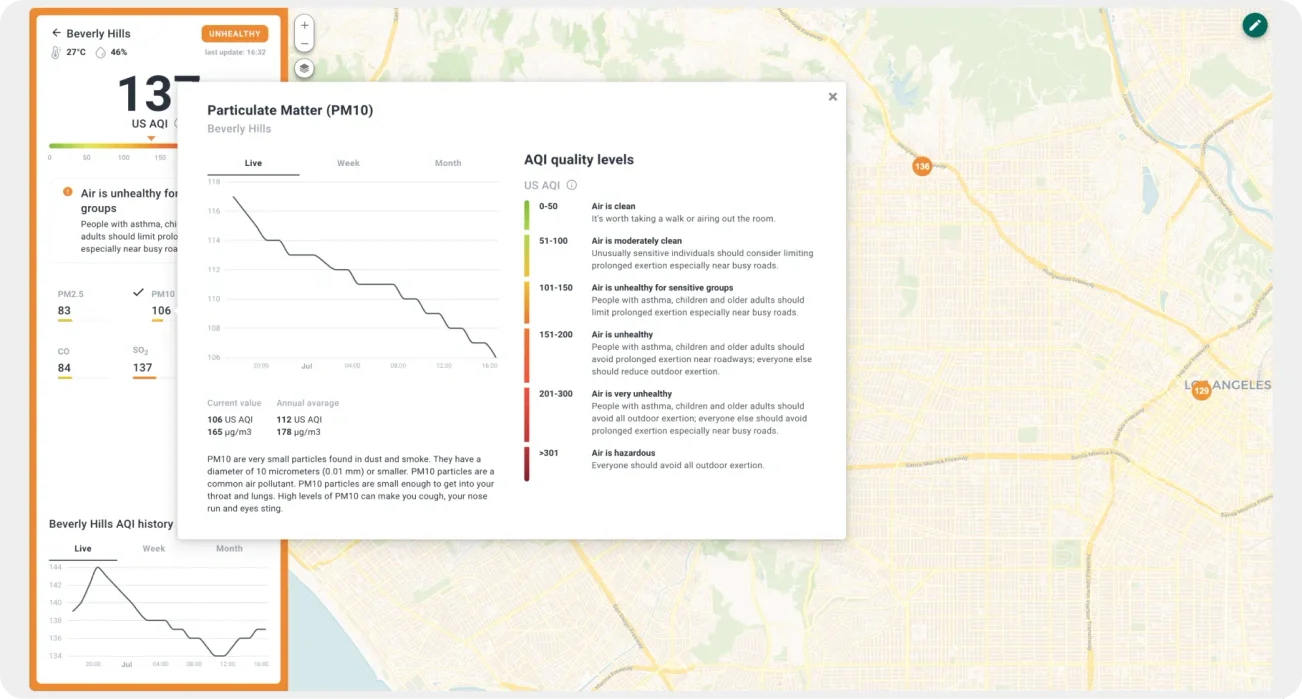
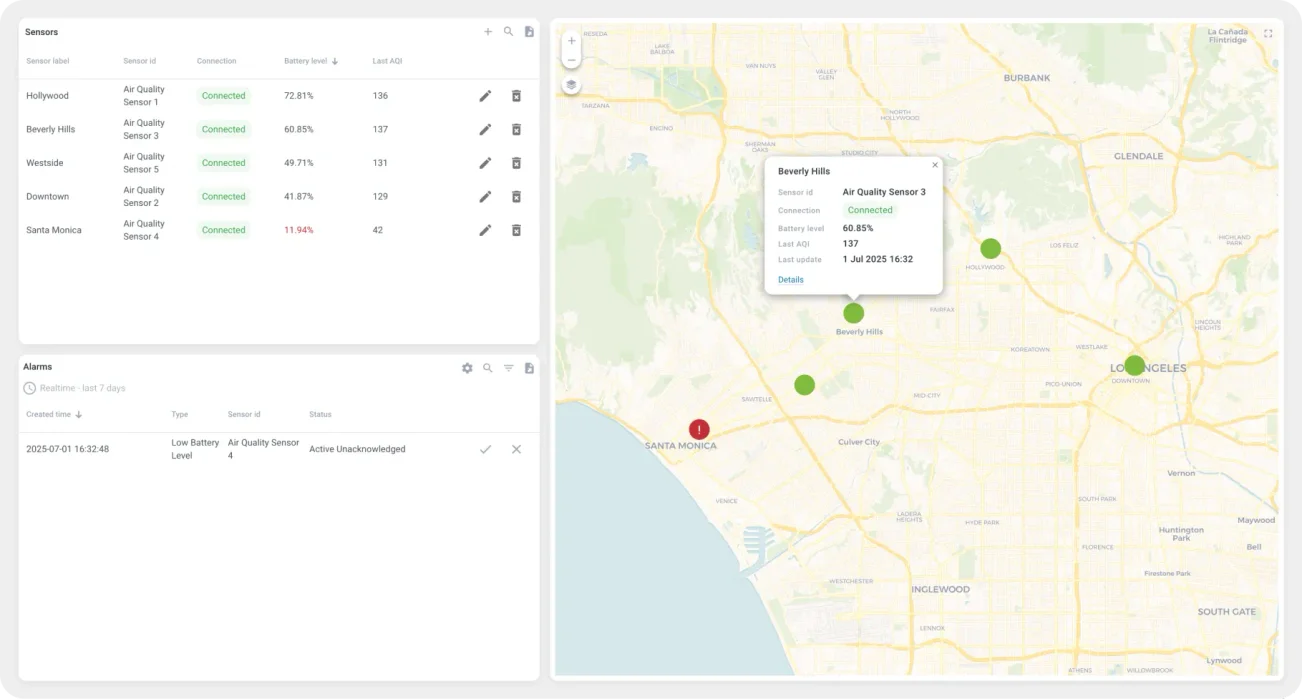
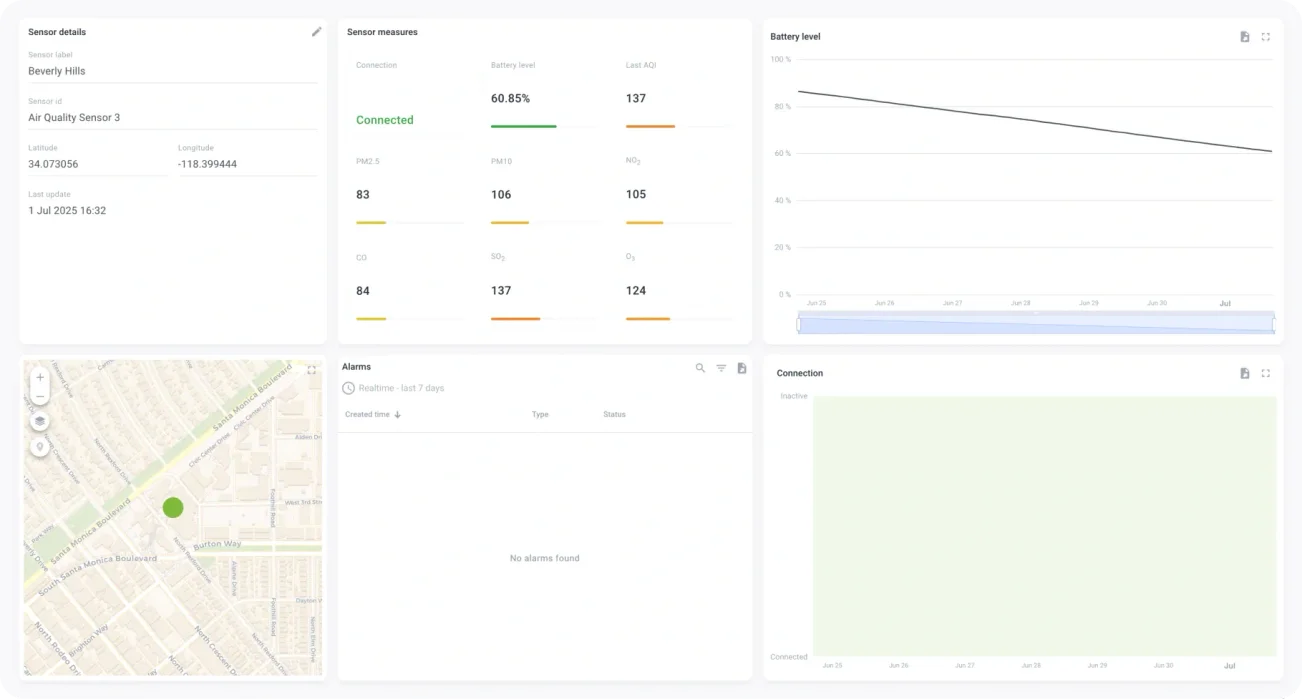
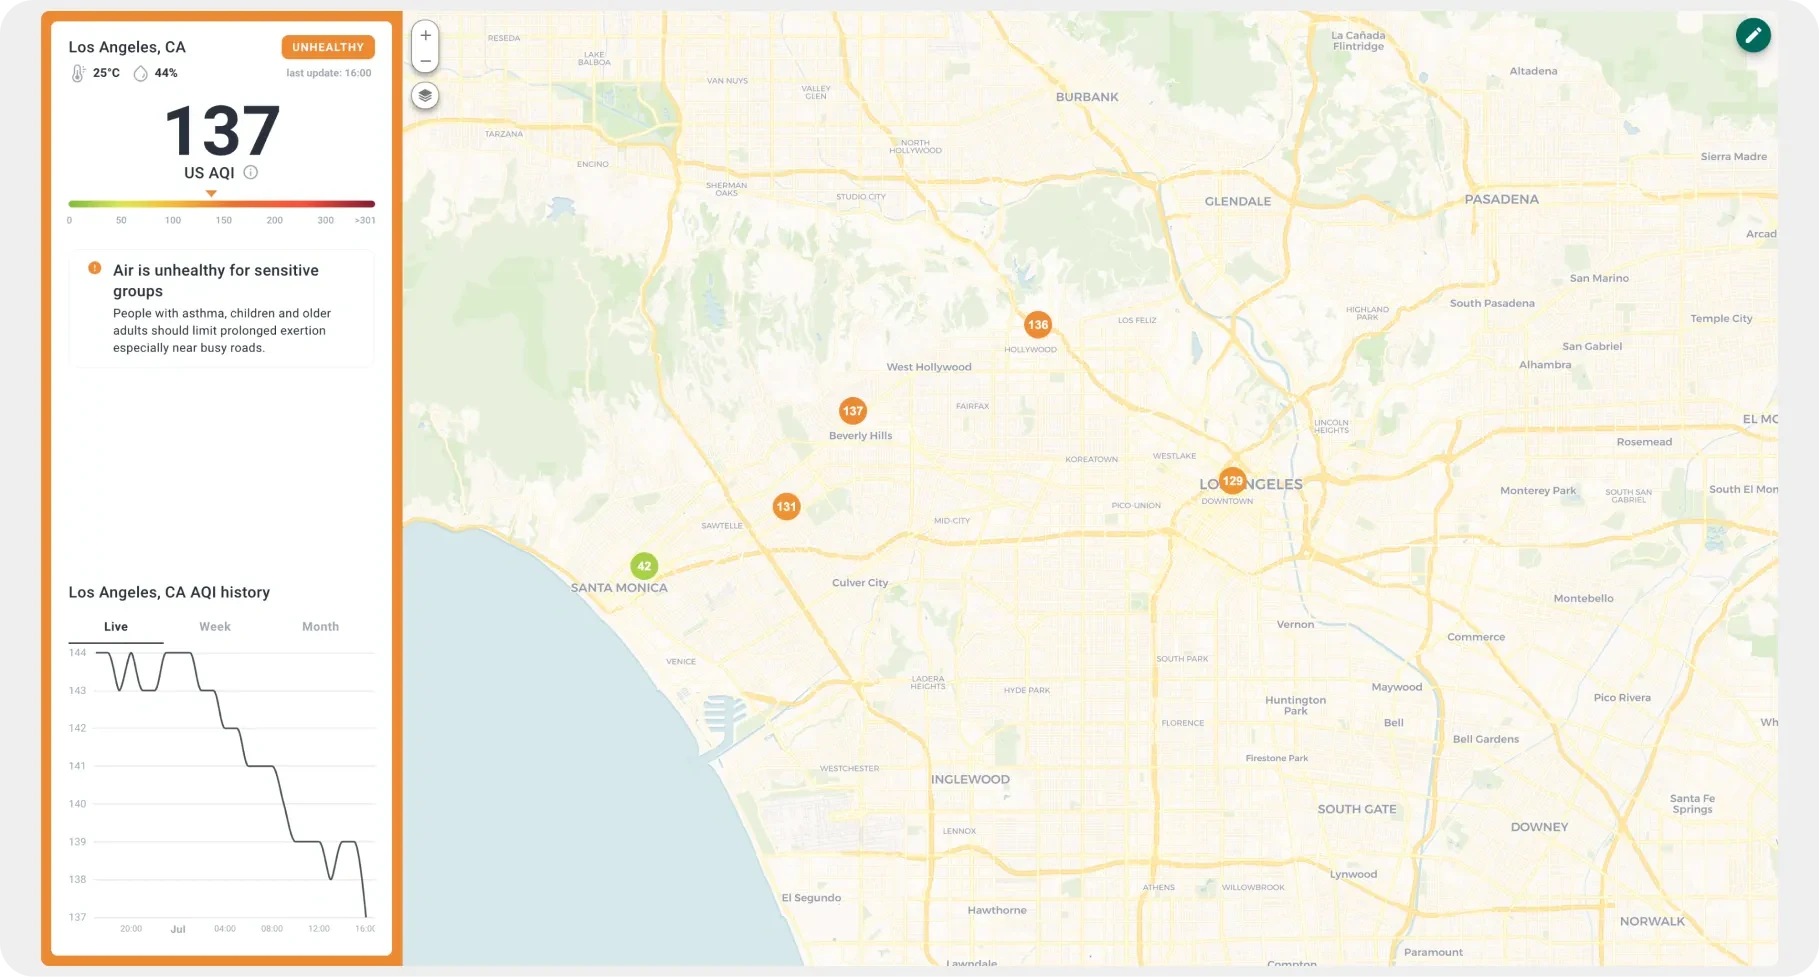
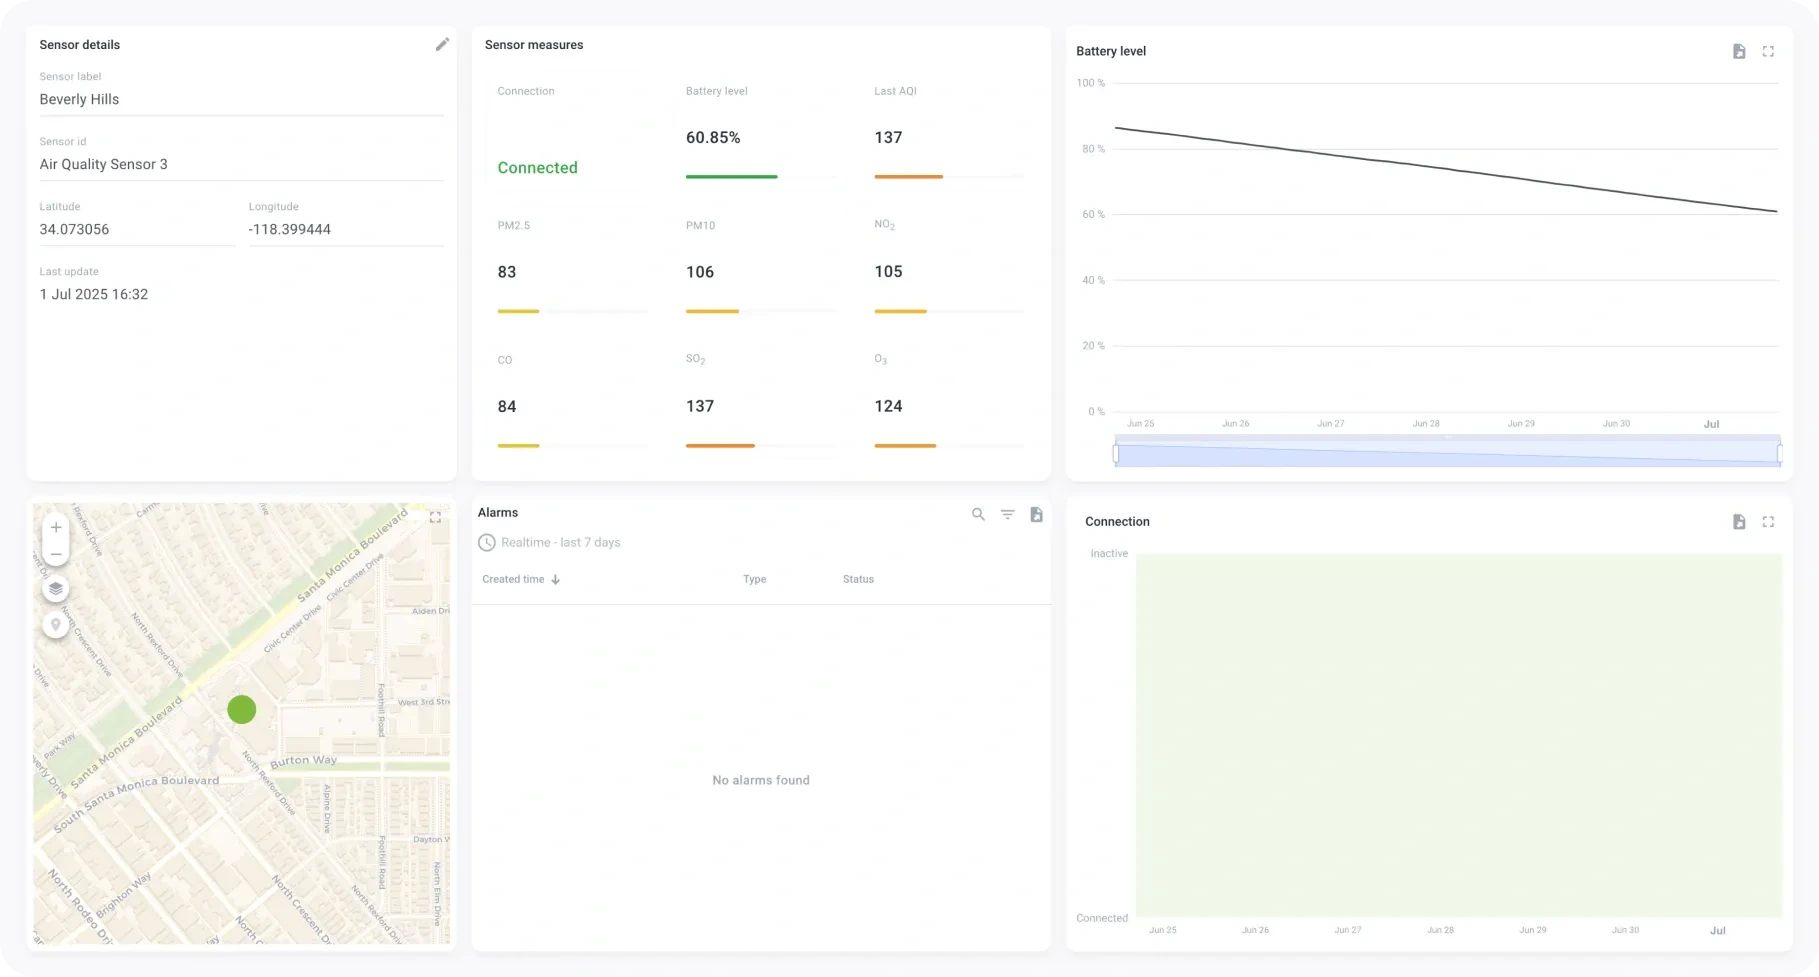
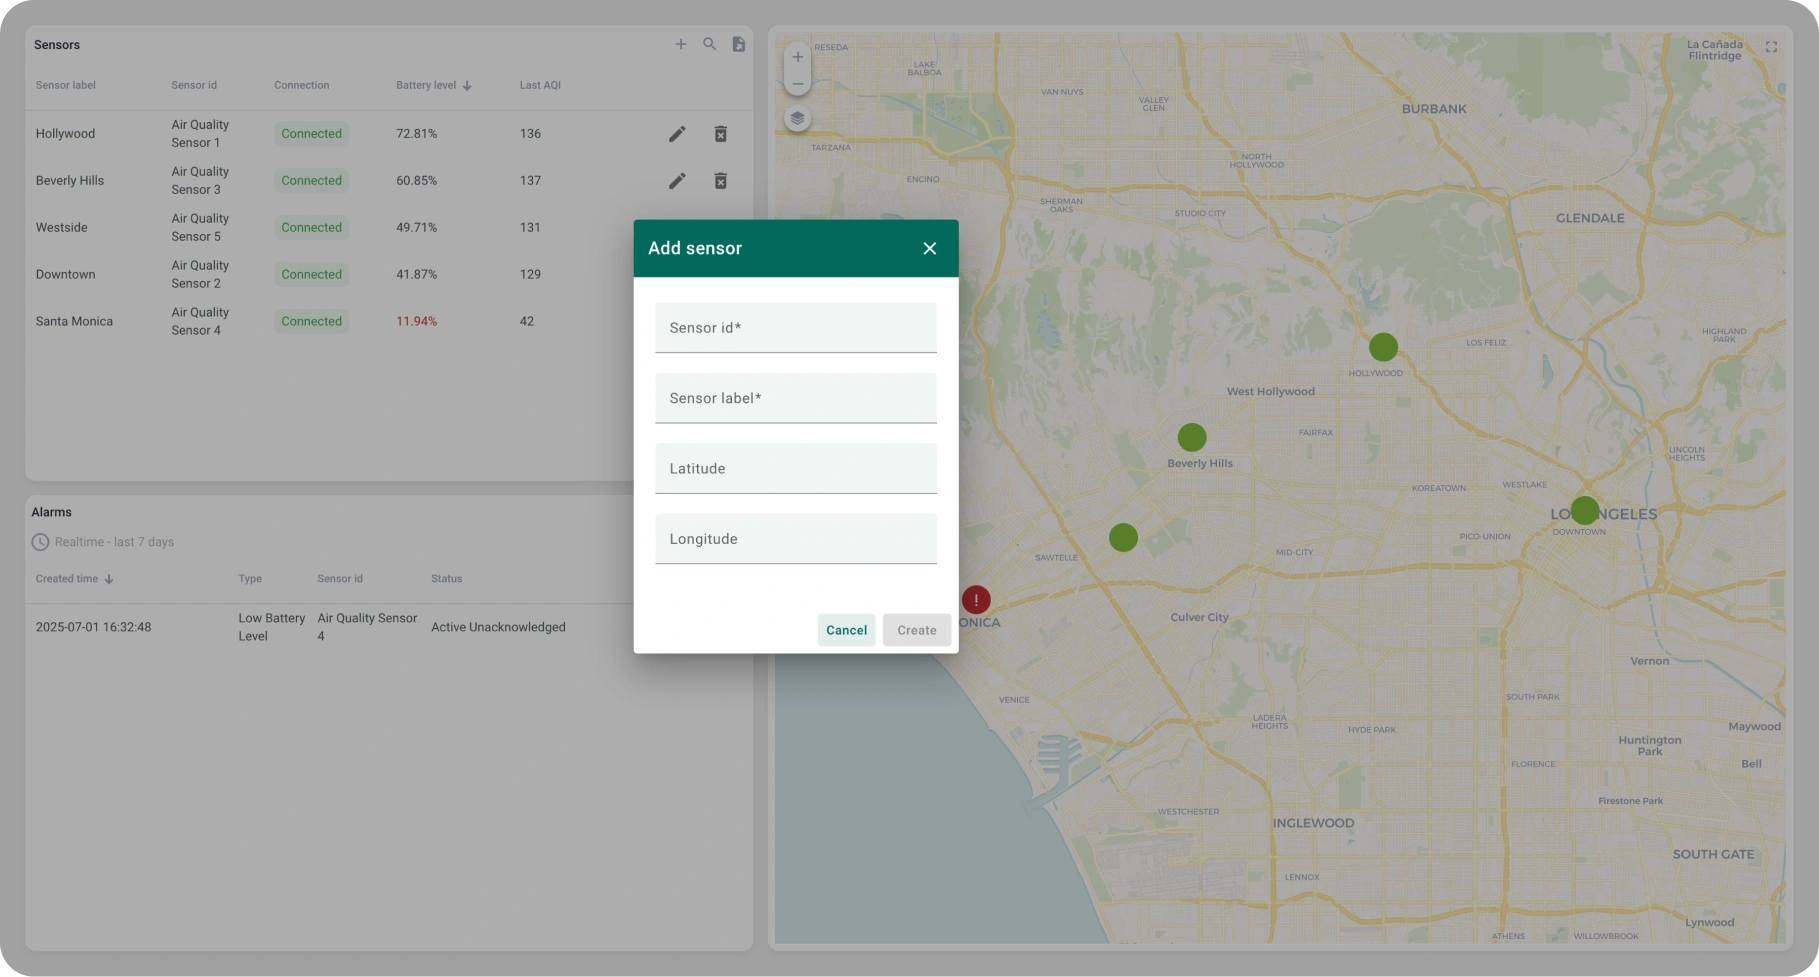
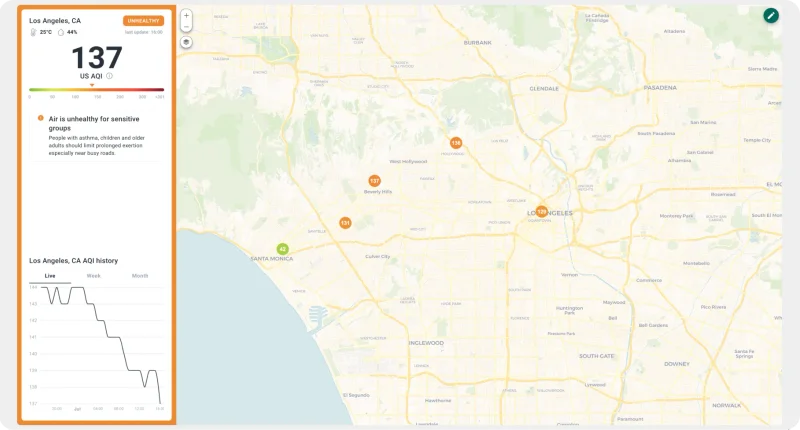
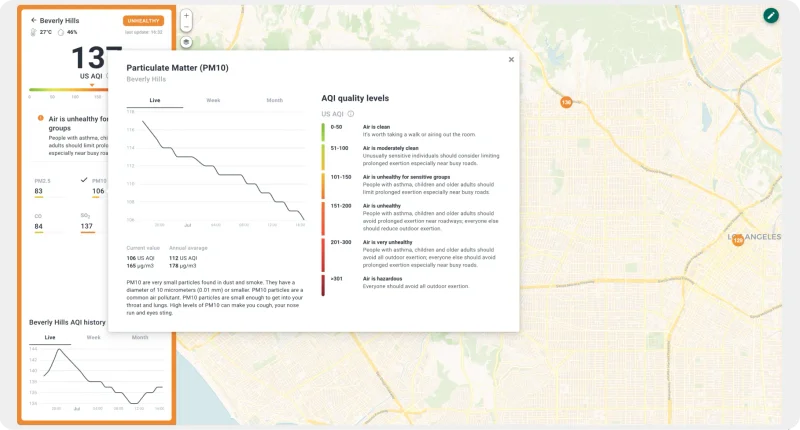
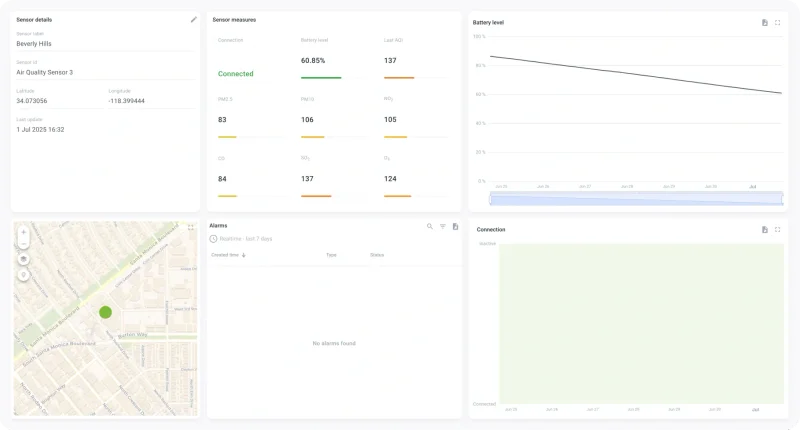
An air quality monitoring solution powered by ThingsBoard consists of IoT sensors that collect real-time data on pollutants such as PM2.5, PM10, CO, SO₂, NO₂, and O₃. These devices transmit telemetry to the platform via industry-standard communication protocols, including MQTT, HTTP/HTTPS, CoAP, and LwM2M — enabling flexible integration across sectors.

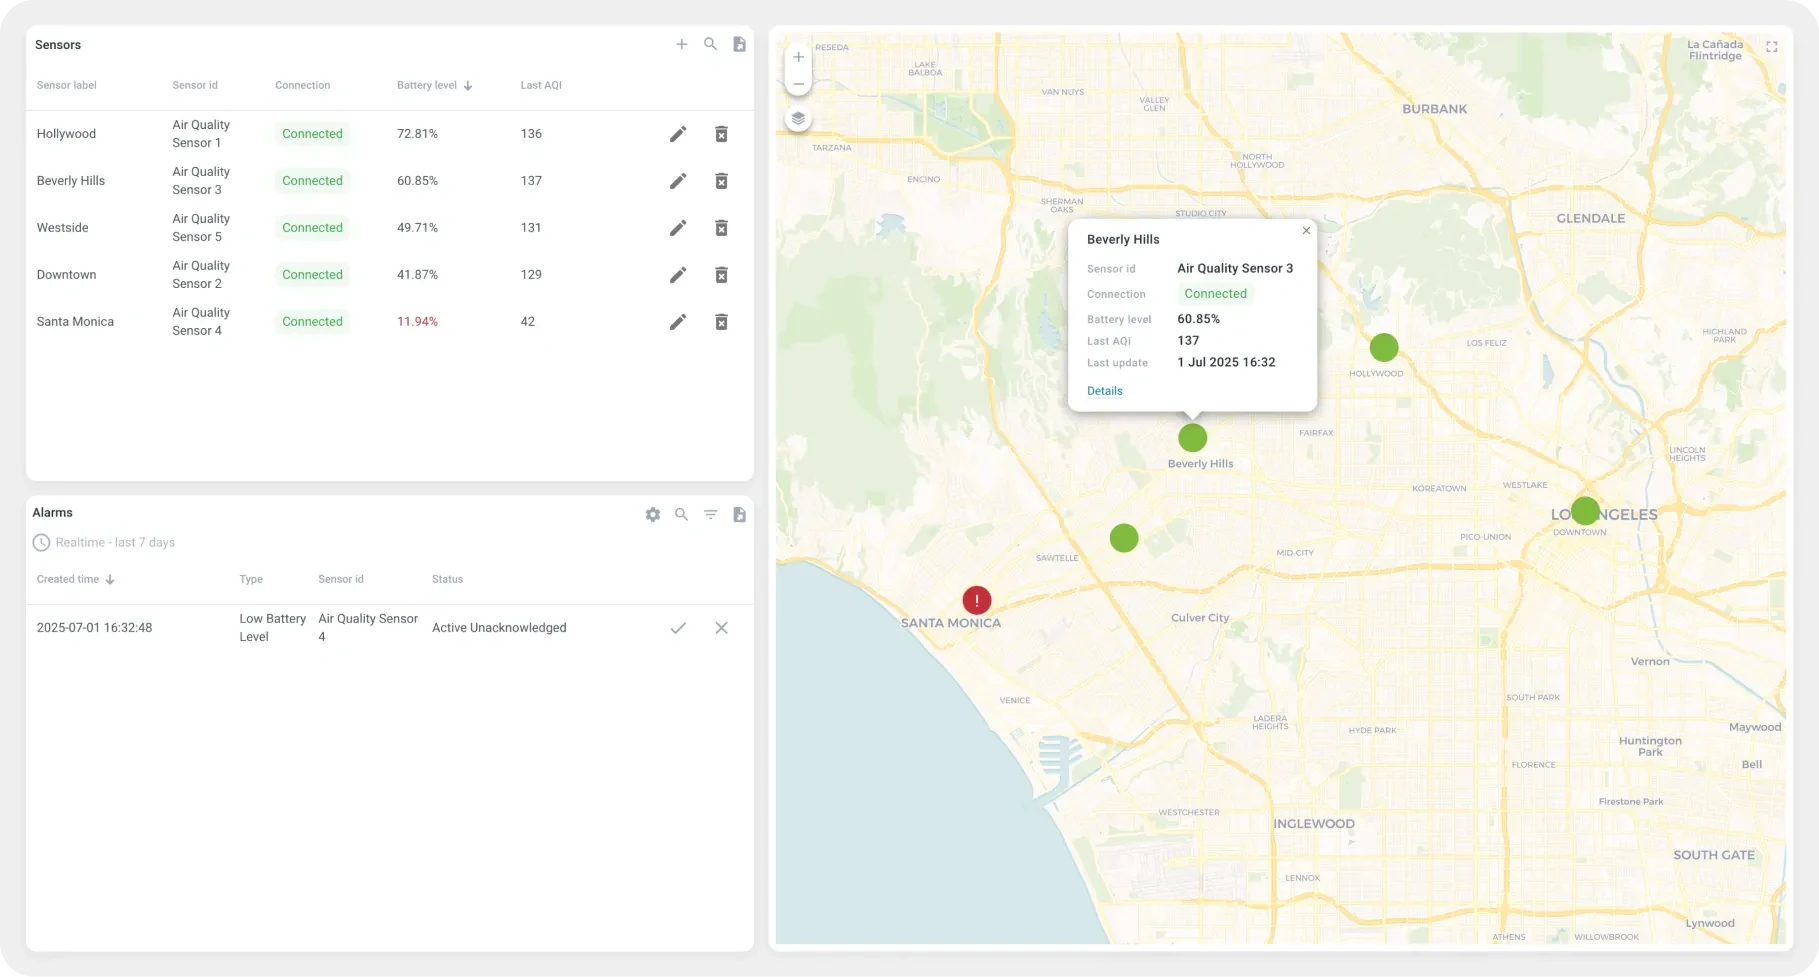
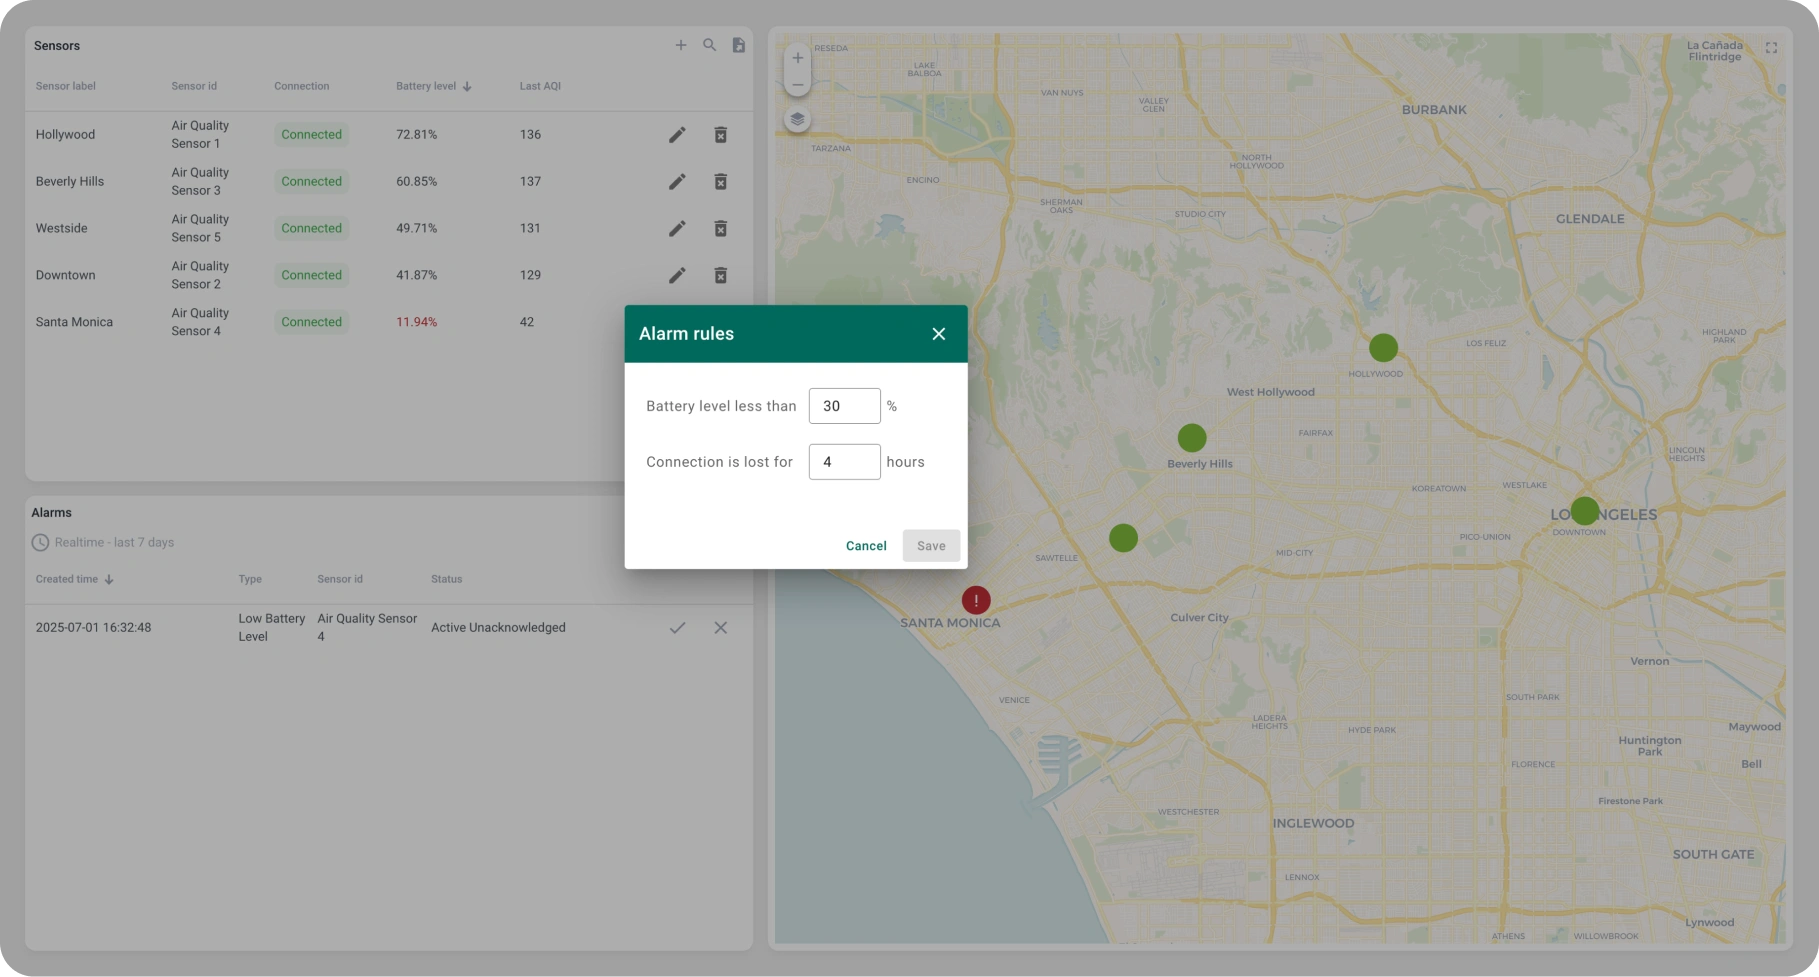
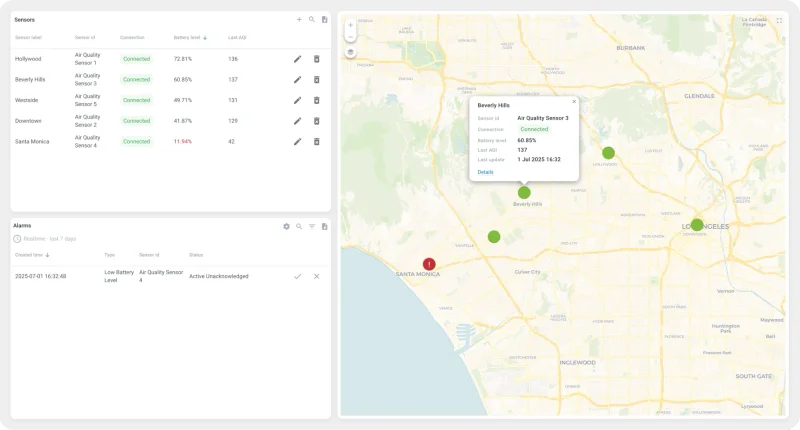
Once received by ThingsBoard, the data is processed, stored in a time-series database, and visualized via interactive dashboards. Custom rule chains allow the generation of automated alarms when AQI thresholds are breached or sensor battery levels drop below critical levels.

Interface insights

Air quality monitoring dashboard structure

The air quality monitoring solution in ThingsBoard is built on a modular dashboard structure that serves both public and administrative needs. Each dashboard is composed of configurable widgets, real-time data streams, map overlays, and interactive filters — all powered by ThingsBoard’s flexible dashboard engine.

Public dashboard: citywide AQI map state

Particulate matter insights: PM10, PM2.5, and more

Dashboard list: access management

Admin dashboard: sensor status and map overview state

Sensor detail view state

Add sensor interface

Alarm rule configuration

Displays all sensor locations with live AQI values. Colored markers reflect pollution levels using EPA standards. Clicking on a location shows its historical AQI trend. This interface makes data easily accessible to users (citizens and city officials) for transparent decision-making.

Detailed popup with pollutant-specific graphs, current and average levels, and health impact descriptions. These insights allow environmental analysts to evaluate pollutant behavior throughout the day.

Displays all available dashboards: public for general visibility and administrative for sensor configuration. Separation of access ensures operational control while maintaining public transparency.

The administrator panel shows sensor connectivity, battery status, last AQI readings, and geolocation. This enables rapid identification of sensor issues or local air quality anomalies.

Shows real-time values for each pollutant, battery trend, historical connection status, and location on the map. It supports deep technical analysis and validation of specific sensor performance.

Simple form for registering new sensors with ID, label, and coordinates. This supports fast expansion of the network without any development effort.

Rule editor for triggering alarms based on battery level or lost connectivity. Enables proactive maintenance and ensures data reliability over time.

Public dashboard: citywide AQI map state

Displays all sensor locations with live AQI values. Colored markers reflect pollution levels using EPA standards. Clicking on a location shows its historical AQI trend. This interface makes data easily accessible to users (citizens and city officials) for transparent decision-making.

Interactive map showing air quality monitoring stations with AQI indicators

Particulate matter insights: PM10, PM2.5, and more

Detailed popup with pollutant-specific graphs, current and average levels, and health impact descriptions. These insights allow environmental analysts to evaluate pollutant behavior throughout the day.

Individual station dashboard with pollutant readings and trend charts

Dashboard list: access management

Displays all available dashboards: public for general visibility and administrative for sensor configuration. Separation of access ensures operational control while maintaining public transparency.

Historical air quality data charts with configurable time ranges

Admin dashboard: sensor status and map overview state

The administrator panel shows sensor connectivity, battery status, last AQI readings, and geolocation. This enables rapid identification of sensor issues or local air quality anomalies.

Air quality alarm management interface with threshold violations

Sensor detail view state

Shows real-time values for each pollutant, battery trend, historical connection status, and location on the map. It supports deep technical analysis and validation of specific sensor performance.

Comparative view of multiple monitoring stations with side-by-side data

Add sensor interface

Simple form for registering new sensors with ID, label, and coordinates. This supports fast expansion of the network without any development effort.

Environmental parameters dashboard with weather and atmospheric data

Alarm rule configuration

Rule editor for triggering alarms based on battery level or lost connectivity. Enables proactive maintenance and ensures data reliability over time.

Aggregated AQI trends and regulatory compliance reporting dashboard
Versatile implementation

Applications of air quality monitoring solution

IoT-based air quality monitoring with ThingsBoard can be deployed across diverse environments where understanding and managing air pollution is critical for health, compliance, and operational efficiency.

Smart cities

ThingsBoard enables city authorities to deploy scalable sensor networks and automate air quality alarms, helping protect public health and enforce clean air regulations in real time.

Transportation & logistics

Air quality tracking near highways, ports, and airports to assess environmental impact and meet regulations.

Real estate development

Developers leverage ThingsBoard's remote monitoring, public dashboards, and analytics to showcase air quality metrics as a selling point for eco-friendly properties.

Smart city
Industrial zone
Transportation
Education
Real estate

Industrial zones

Manufacturers use ThingsBoard to monitor emissions through customizable dashboards and rule-based automation, ensuring regulatory compliance and minimizing environmental risks.

Education & research

Academic institutions benefit from ThingsBoard's real-time data visualization and open API, integrating environmental data into curriculum, research projects, and citizen science initiatives.

Smart city

Smart cities

ThingsBoard enables city authorities to deploy scalable sensor networks and automate air quality alarms, helping protect public health and enforce clean air regulations in real time.

Industrial zone

Industrial zones

Manufacturers use ThingsBoard to monitor emissions through customizable dashboards and rule-based automation, ensuring regulatory compliance and minimizing environmental risks.

Transportation

Transportation & logistics

Air quality tracking near highways, ports, and airports to assess environmental impact and meet regulations.

Education

Education & research

Academic institutions benefit from ThingsBoard's real-time data visualization and open API, integrating environmental data into curriculum, research projects, and citizen science initiatives.

Real estate

Real estate development

Developers leverage ThingsBoard's remote monitoring, public dashboards, and analytics to showcase air quality metrics as a selling point for eco-friendly properties.

Summary of air quality monitoring

ThingsBoard’s air quality monitoring solution offers a scalable, real-time IoT-based platform for environmental intelligence. It connects pollution sensors with cloud dashboards, alarms, and data storage to empower cities, industries, and institutions to act on air quality insights. Its flexibility, open protocol support, and customizable visualization make it ideal for public health, regulatory compliance, and green initiatives.

Text summary icon