Trendz Analytics Docs
Build analytics dashboards, predict trends, and detect anomalies in your ThingsBoard IoT data.
-
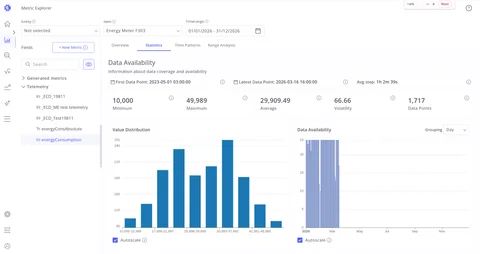
Metric Explorer
Instantly browse telemetry from any device or asset. Explore statistics, time patterns, and range analysis in one place.
-
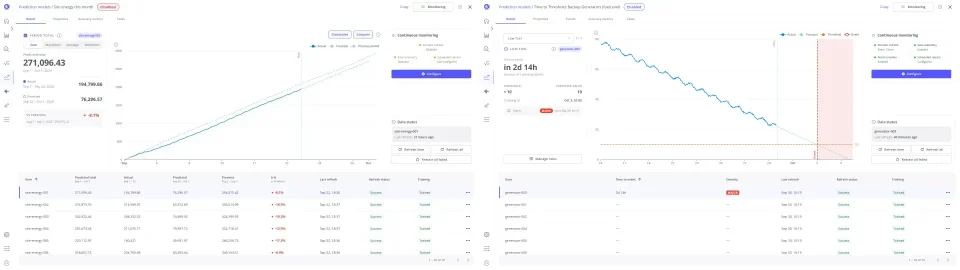
Prediction models
Forecast what telemetry does next, and turn the forecast into an answer you can act on. Predict a series ahead, a period total, the moment a threshold is crossed, or whether a target is hit.
-
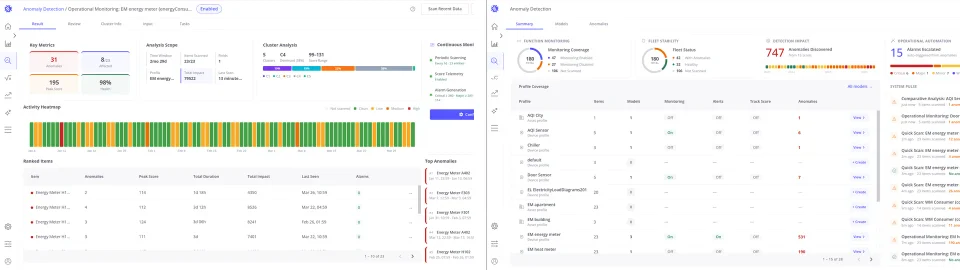
Anomaly detection
Learn what normal looks like for every device, then flag the readings that depart from it. Models are trained per device profile, scored on every scan, and escalated as ThingsBoard alarms.
-
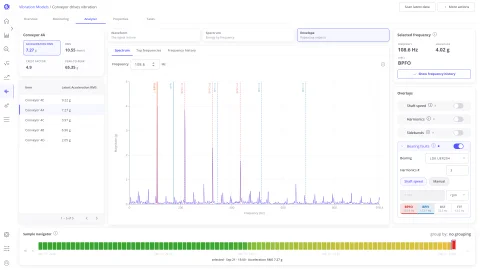
Vibration analysis
Turn raw accelerometer waveforms into ISO severity zones, fault diagnosis, and ThingsBoard alarms.
-
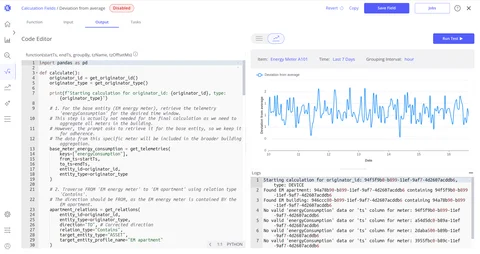
Calculated fields
Define custom KPIs and derived metrics; store results back in ThingsBoard.
-
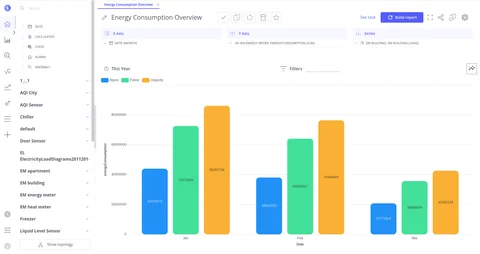
Visualizations
Built-in view types with advanced aggregation: line, bar, pie, heatmap, scatter, calendar, card, AI card, and more.
-
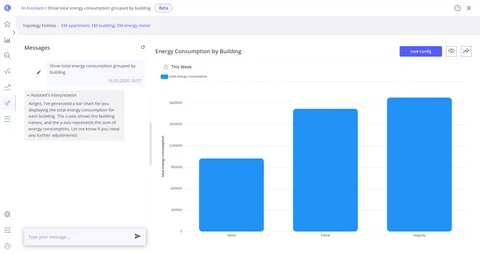
AI assistant
Generate visualizations and plain-language summaries from natural language prompts.