Trendz Analytics The AI-Powered IoT Data Analytics Workspace
Trendz Analytics is an add-on for ThingsBoard that turns telemetry into business KPIs and actionable insights.
Explore how IoT Analytics can Improve Your Business
Turn raw sensor data into clear numbers everyone can use — cost, efficiency, output, quality — the same way across every site and customer.
Examples
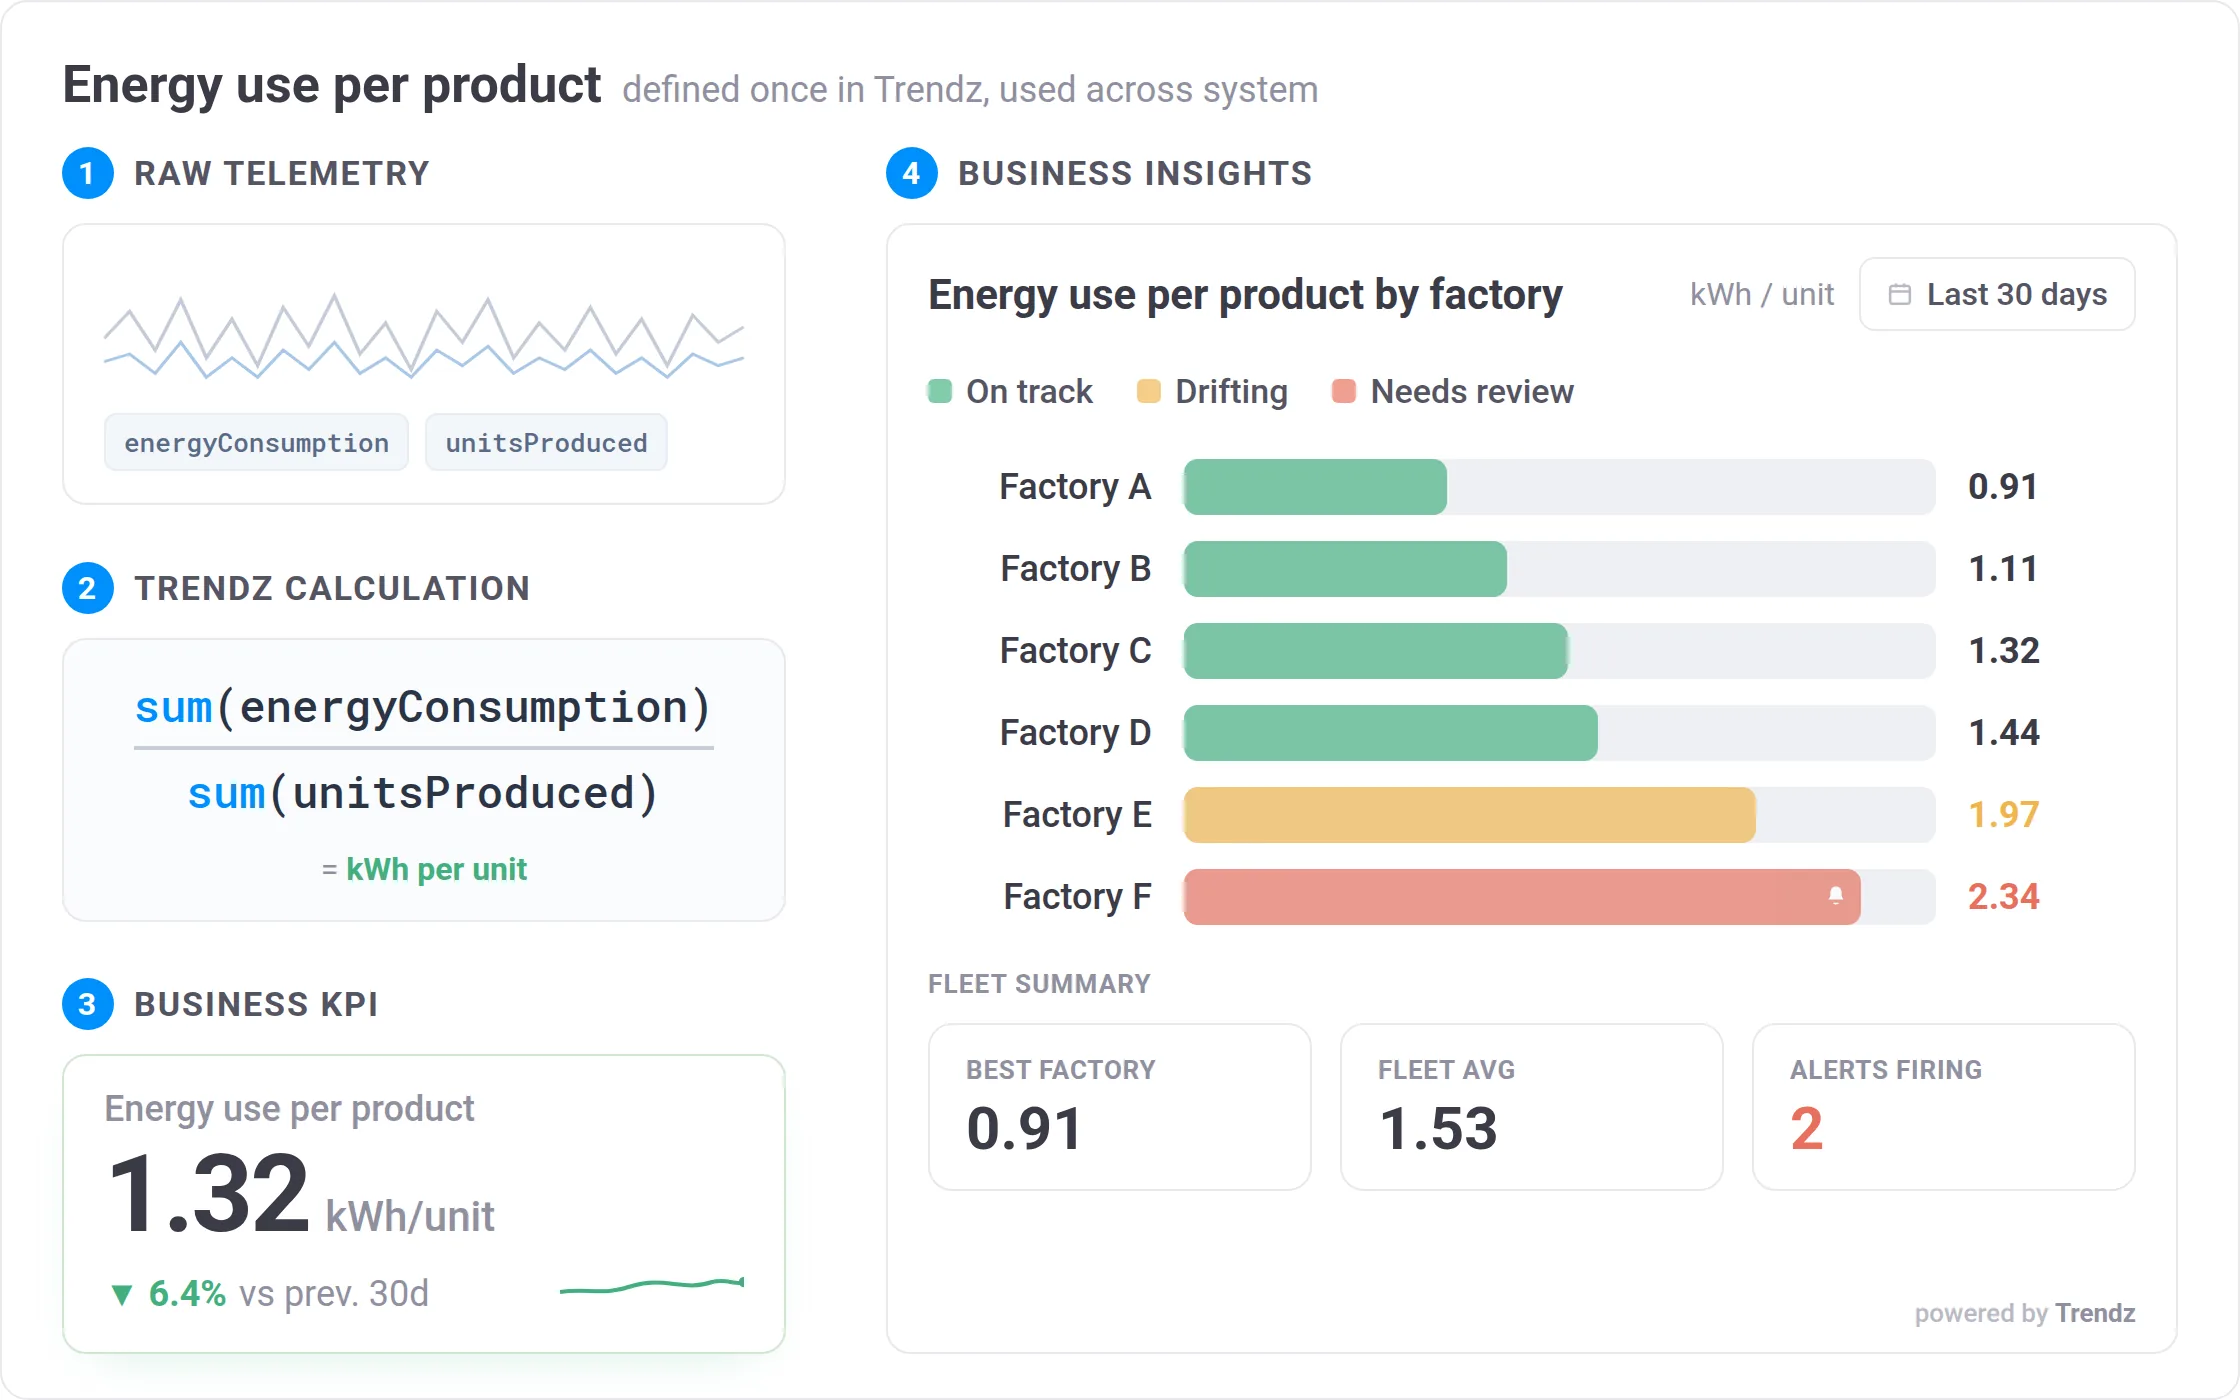
Trendz helps you define a few "business metrics" on top of your ThingsBoard data. Once a KPI is defined, you can reuse it everywhere: dashboards, portfolio views, alerts, and reports.
Forecast the next days/weeks so you can plan work before problems, high-run-outs, threshold breaches, and KPI drift.
Examples
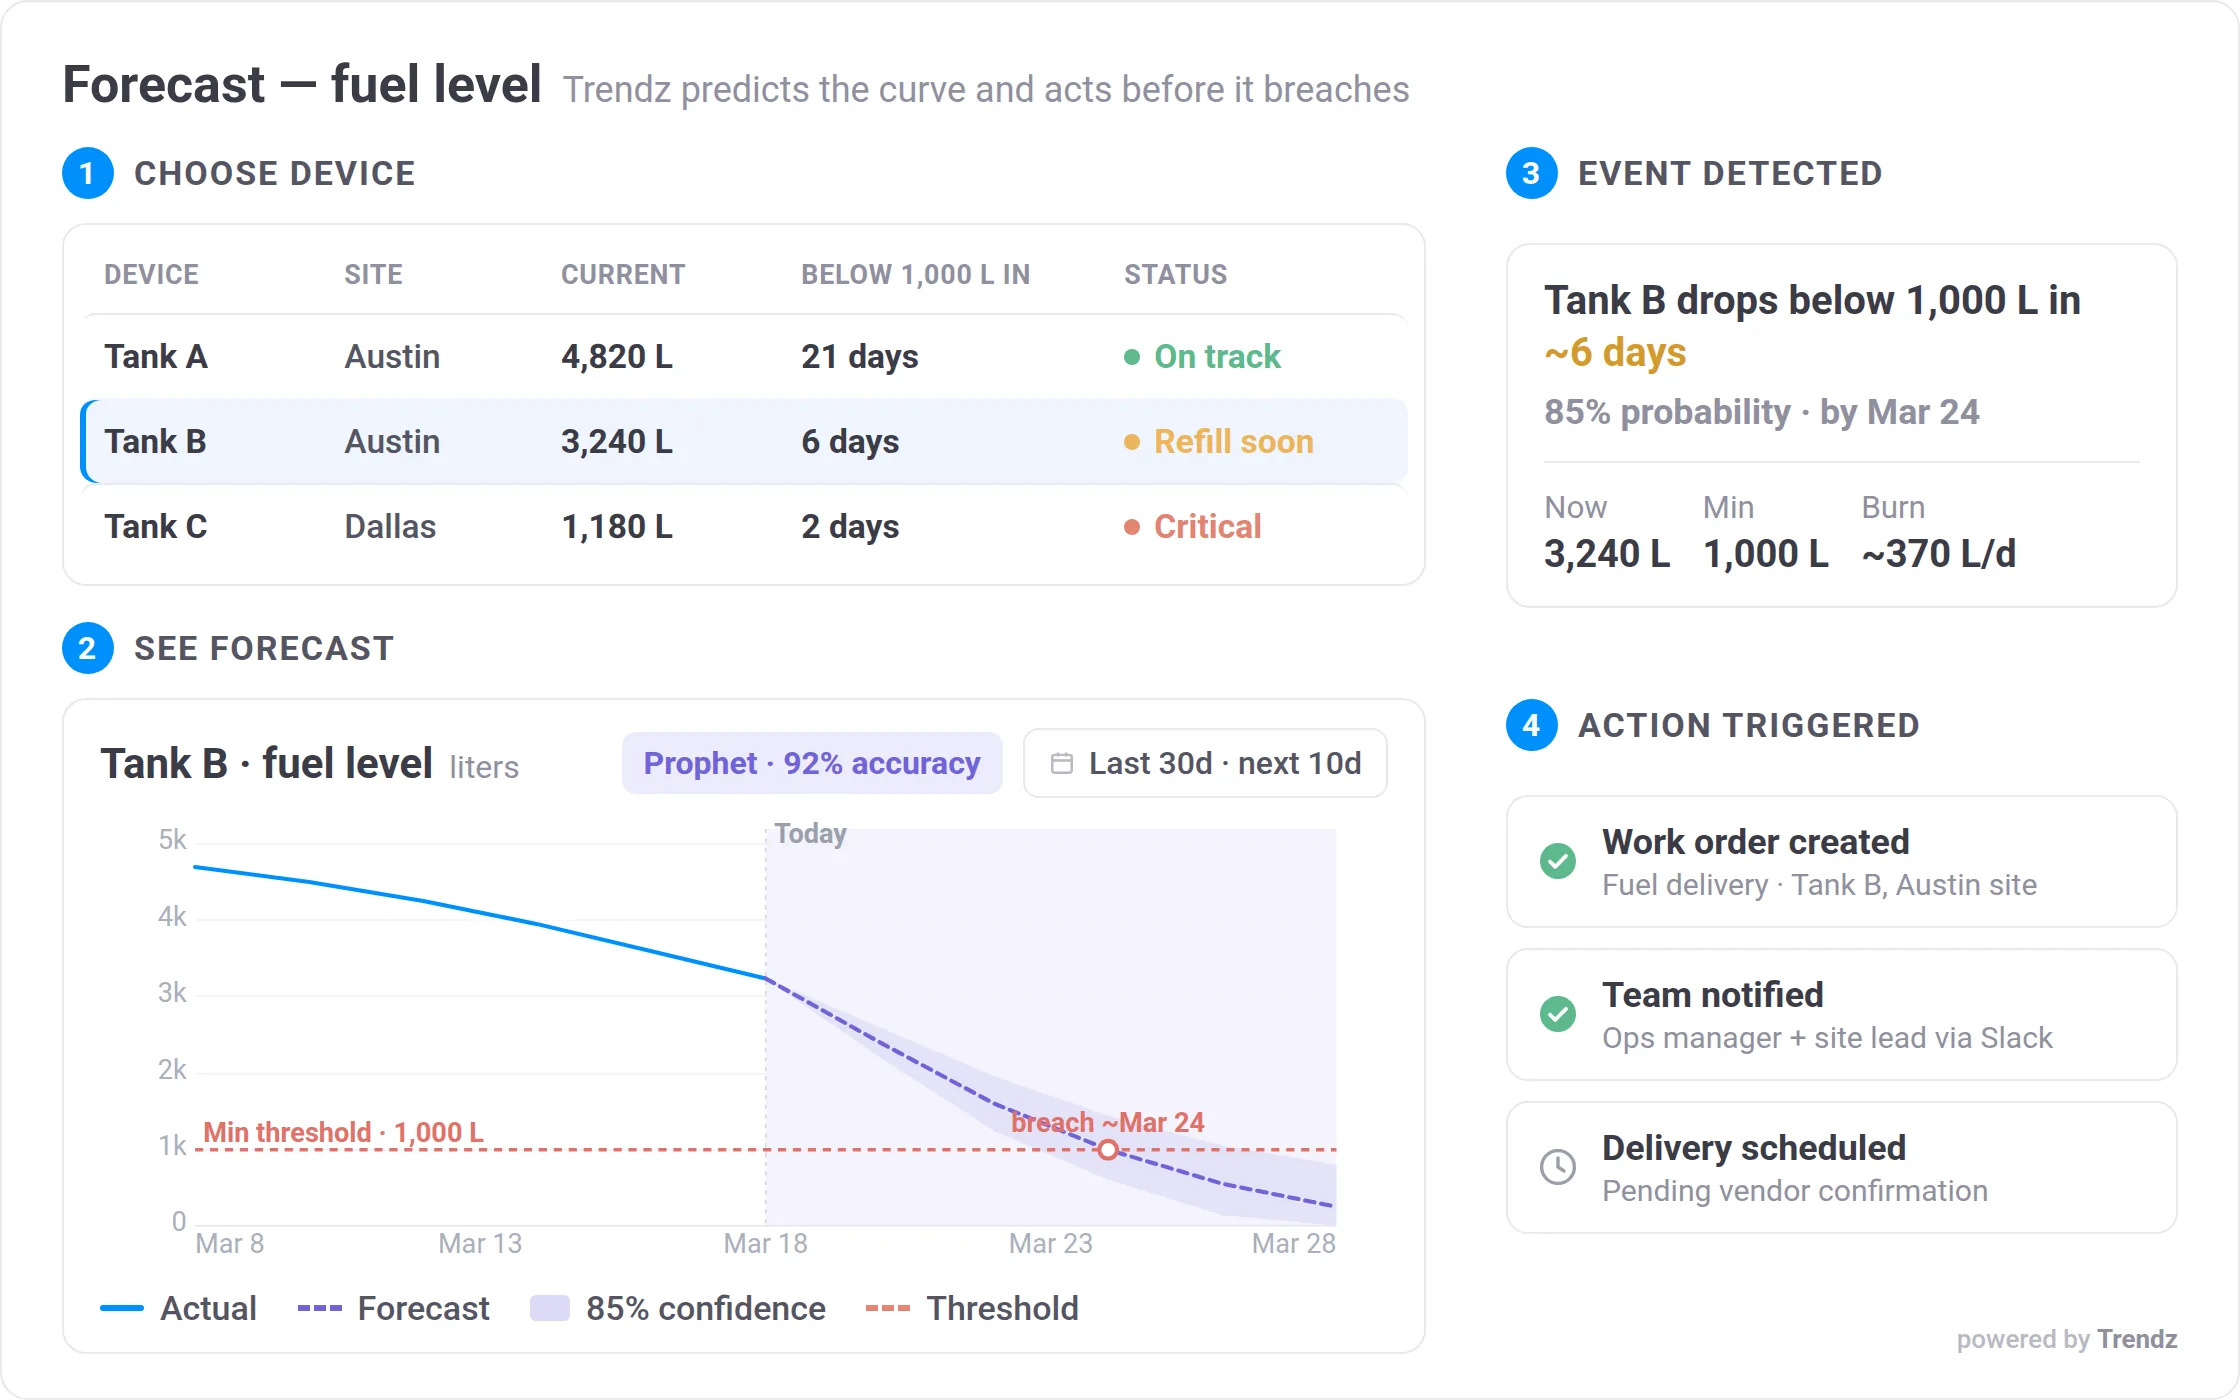
Trendz forecasts your charts into the future and verifies the accuracy of predictions. That makes it practical for operations: you don't just see "it will happen", you see when it might happen and how risky it is.
See which assets are getting worse over time, so you can service them at the right moment — before failures and before waste becomes expensive.
Examples
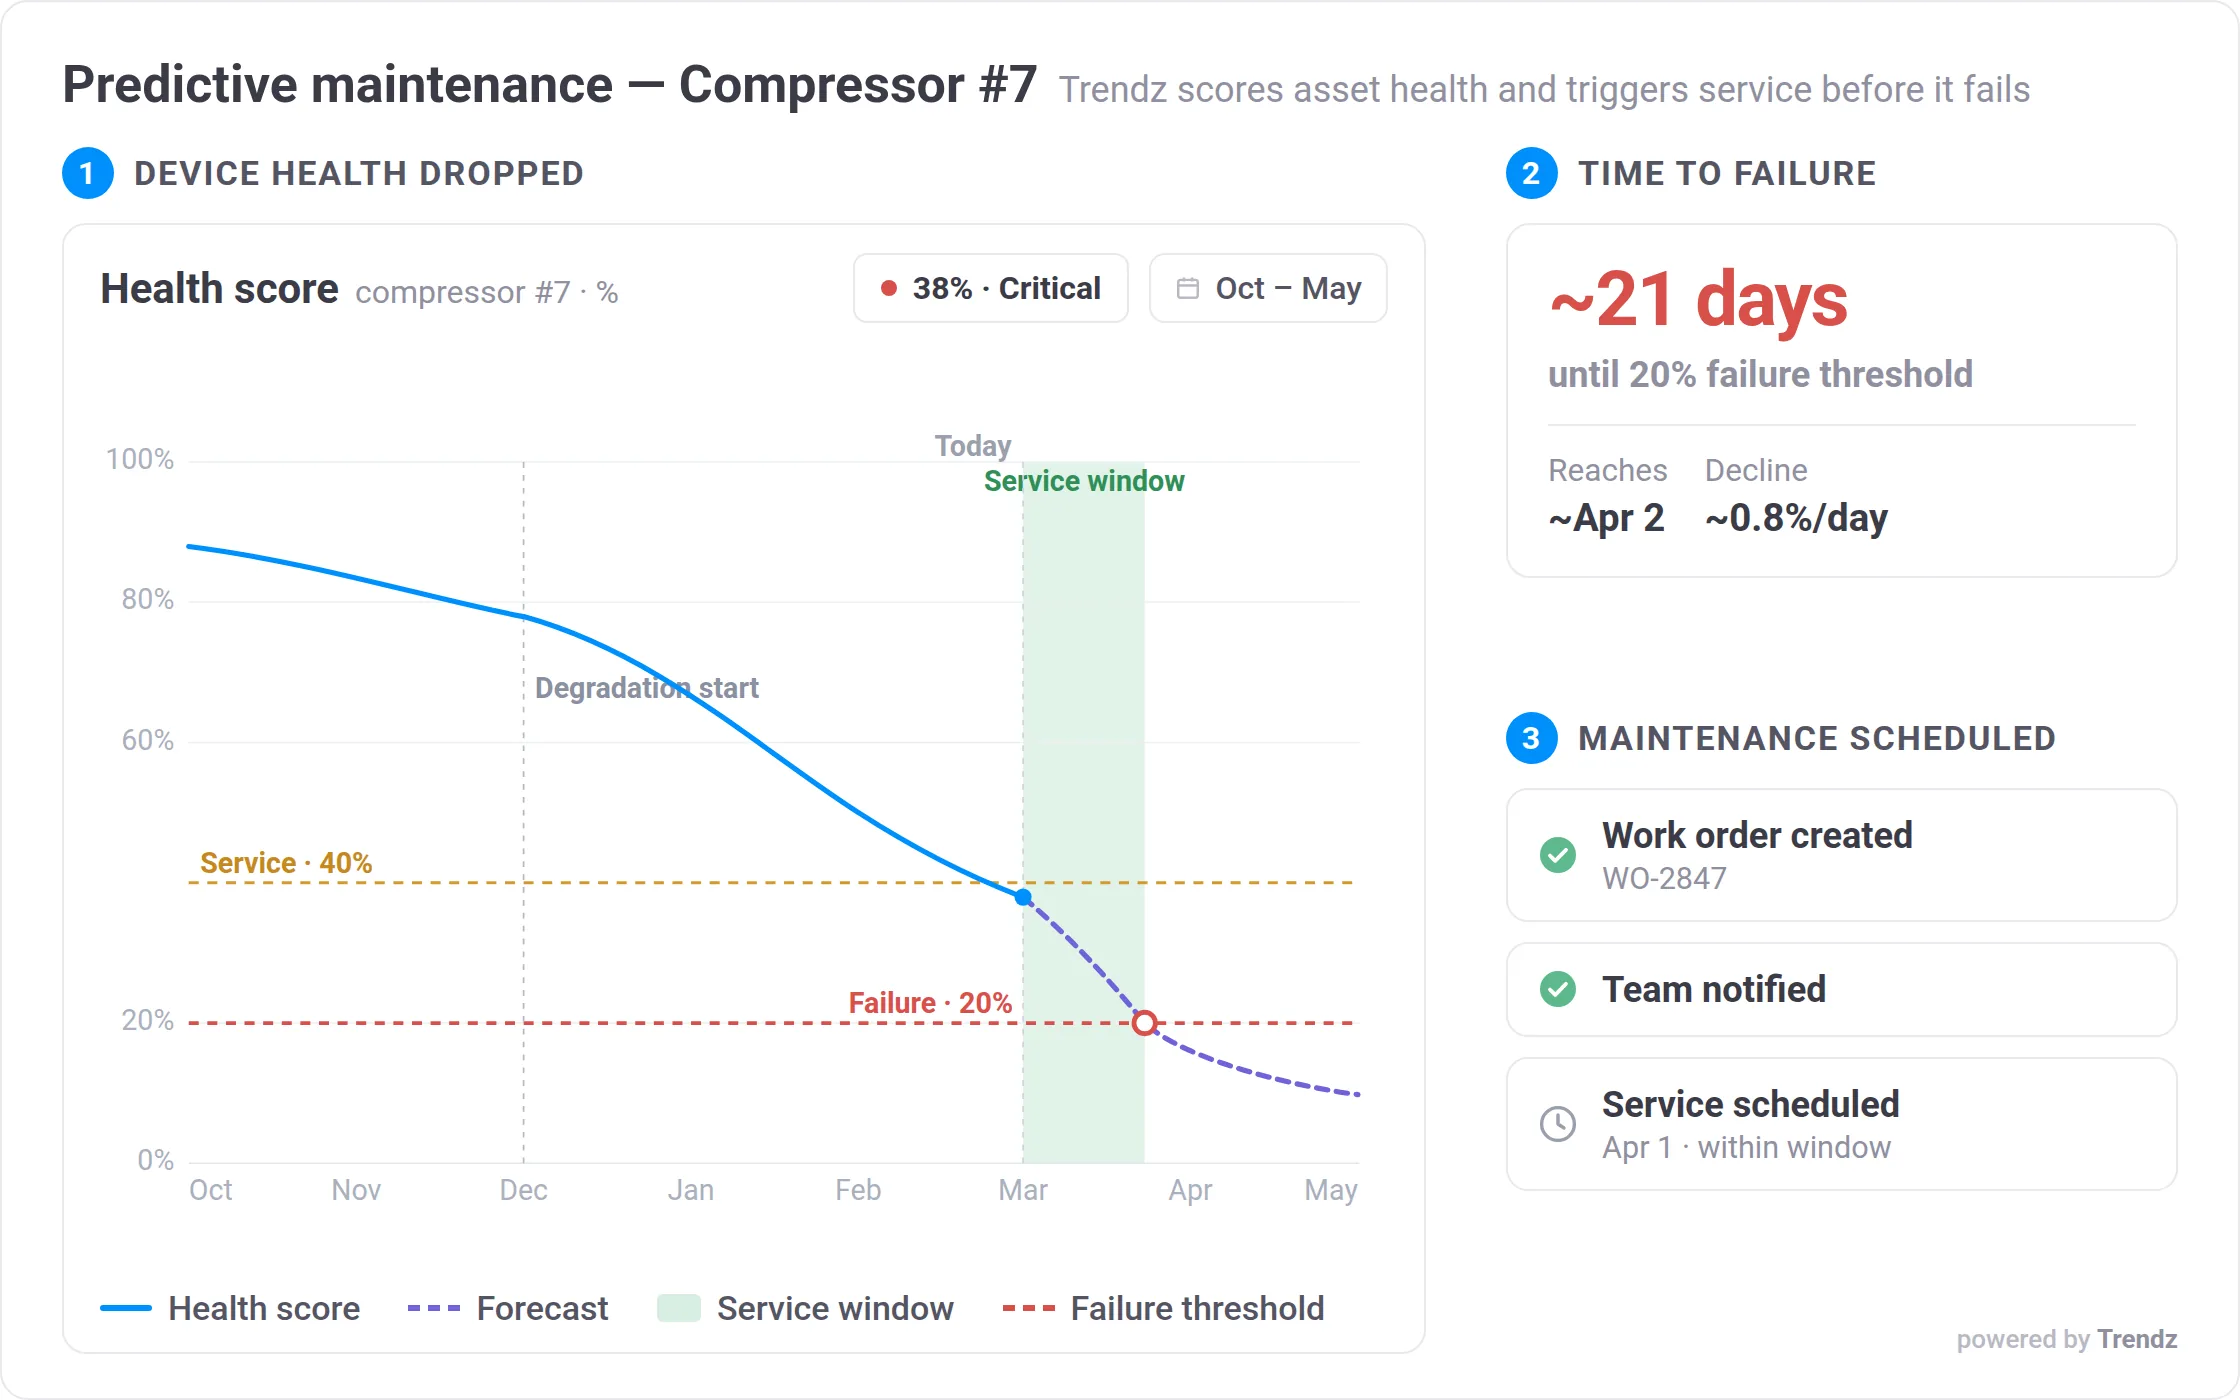
Trendz tracks how an asset performs over time and compares it to what "good" looks like for that asset or similar assets. When health declines, you can find when it started, review evidence charts, and trigger a maintenance incident.
Get a clear signal when something starts behaving unusually, without drowning in noisy alarms, especially where static thresholds miss the real problem.
Examples
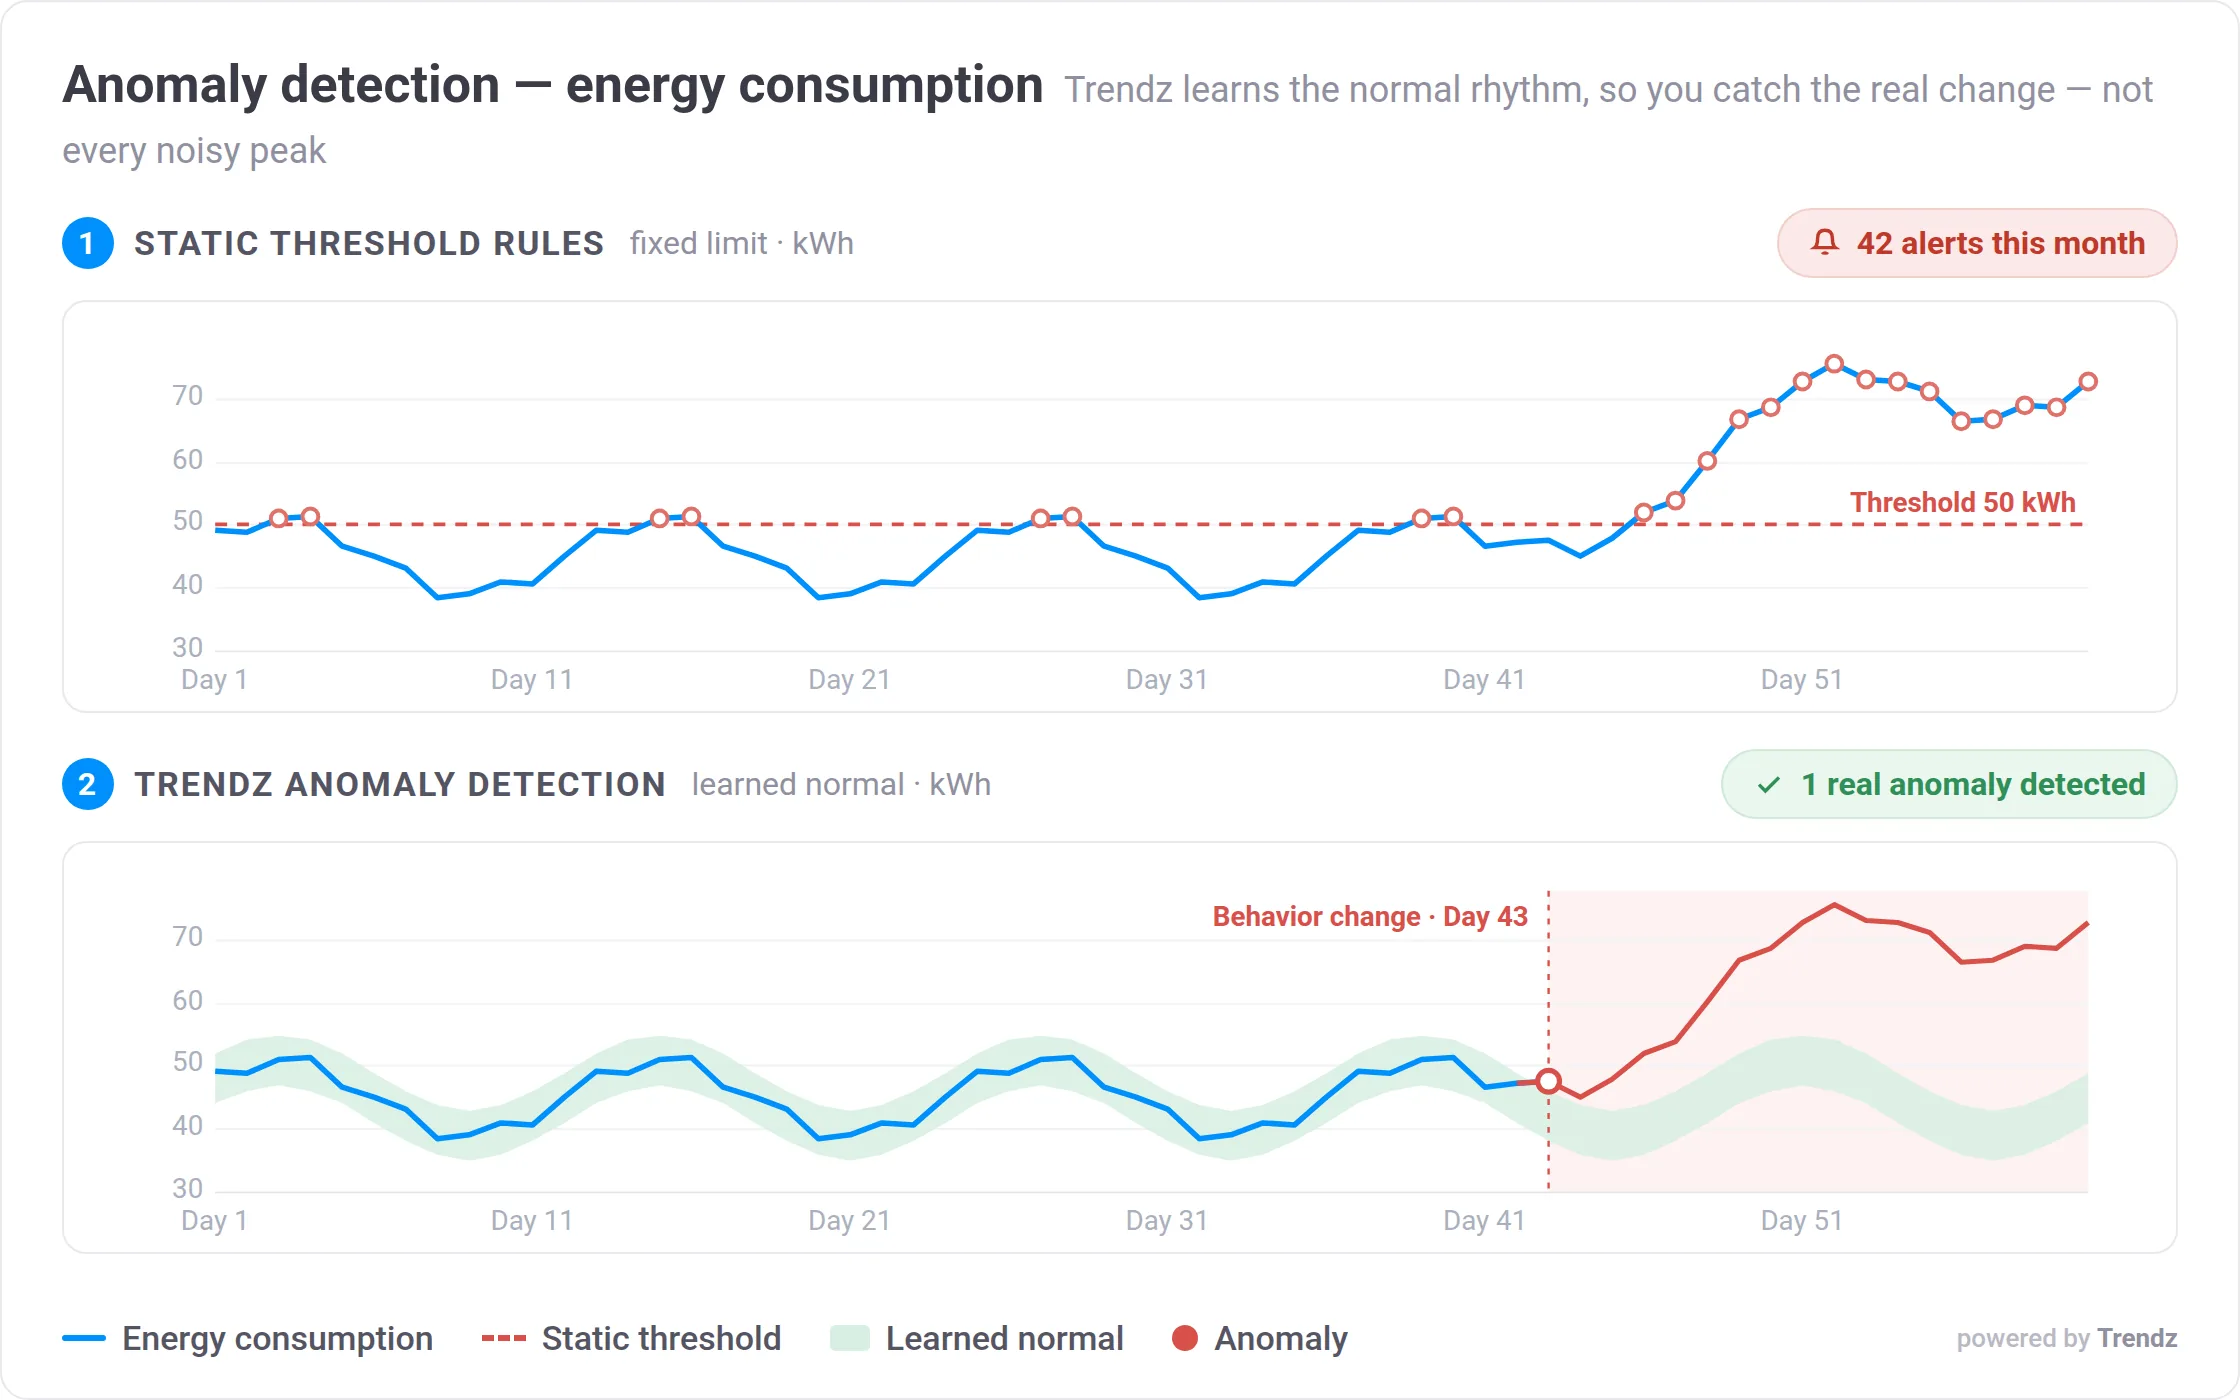
Some issues don't have a clean rule like "over 80 = bad". Trendz can flag when behavior changes from normal and mark the moment it changed, so investigation starts from a real timestamp, not guesses.
Rank assets and sites that behave differently than their peers, so you can focus on the few that drive most cost and incidents.
Examples

Trendz compares similar assets and surfaces the ones that stand out — worst efficiency, highest cost, most downtime, slowest recovery. Start from a ranked list, then drill down to see why it's different using clear visuals.
Measure how long assets spend underused, optimal, overloaded, or out-of-control — then use that for capacity planning, SLA reporting, and operational improvements.
Examples
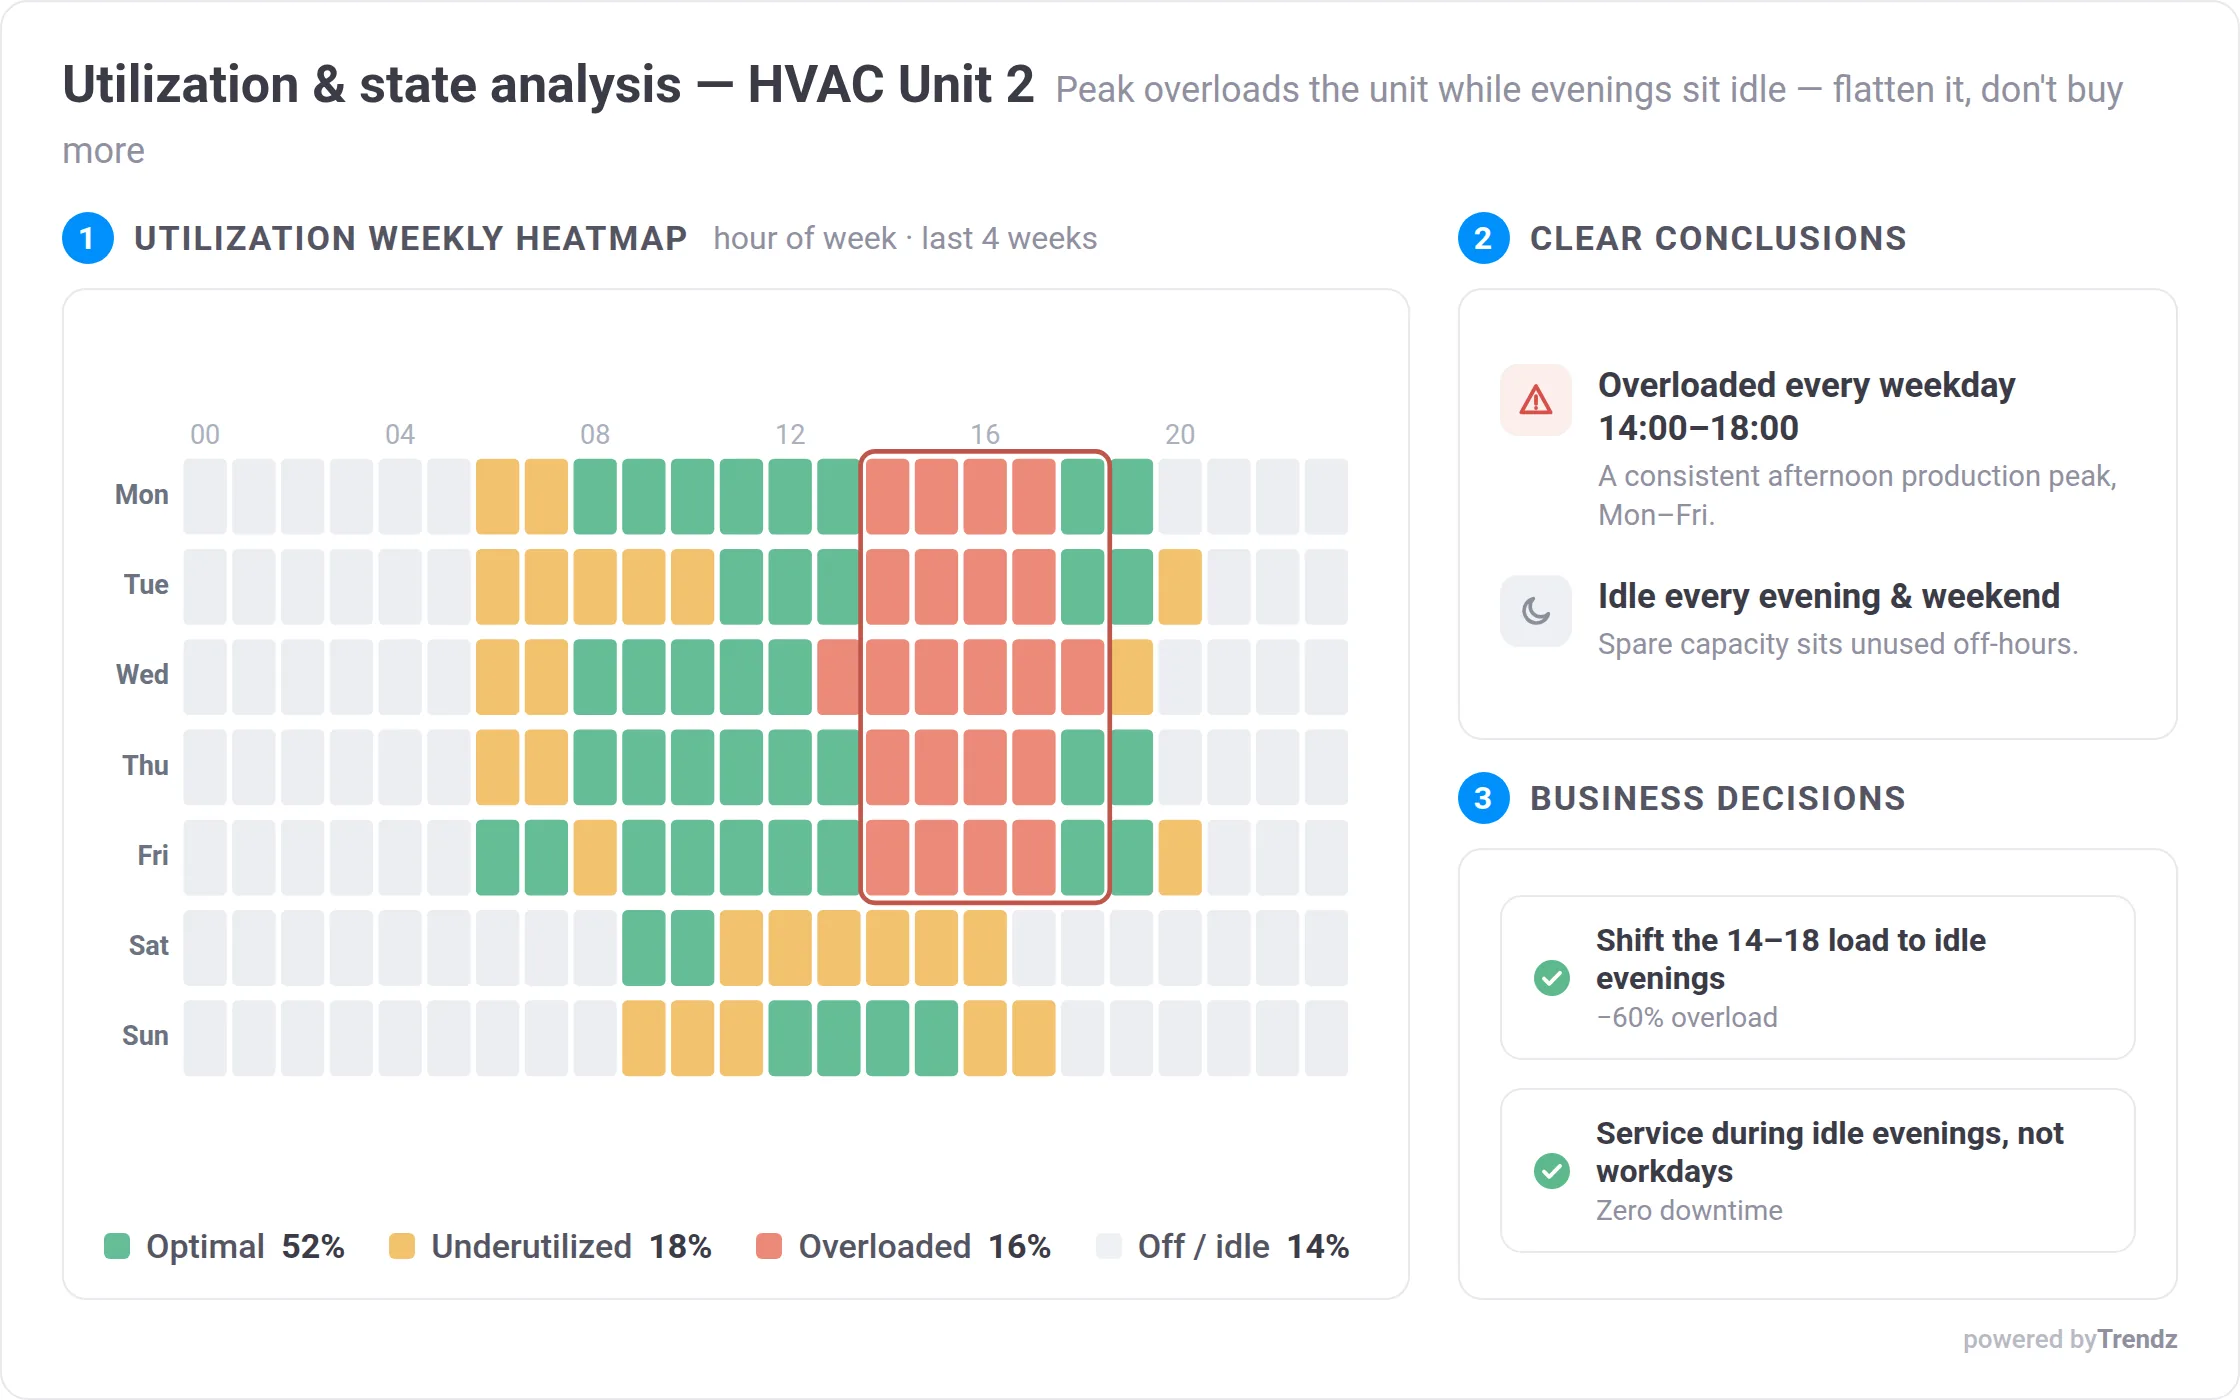
Trendz turns operating states into simple percentages and timelines, so you can spot bottlenecks and recurring waste. Calendar-style views make patterns obvious (after hours, weekends, shift changes) and help teams connect issues to real operations.
Trendz helps you define a few "business metrics" on top of your ThingsBoard data. Once a KPI is defined, you can reuse it everywhere: dashboards, portfolio views, alerts, and reports.
Elevate Your IoT Data Analytics with Metric Explorer
This is your no-code engine for deep data analytics in IoT. Explore telemetry, slice data in seconds, and reveal hidden patterns using AI-assisted tools. Build complex business logic and metrics instantly — without writing a single line of code.
More about Metric ExplorerHow to Run Trendz for Efficient Data Analytics in IoT
We provide true deployment freedom designed to match your main platform license. Find the configuration that corresponds to your current plan below.
Trendz for Private Cloud
Get full access to Metric Explorer, Anomaly Detection, Predictions, and more – all directly inside your ThingsBoard Private Cloud.
Trendz for Public Cloud
Seamlessly activate Trendz on your ThingsBoard Cloud and start exploring telemetry, building metrics, and detecting anomalies with no code.
Trendz for Self-Hosted
Integrate the full AI-driven Trendz experience on your server. Activate your add-on and unlock analytics, predictions, anomaly detection, and more.
Comprehensive IoT Analytics Solutions for Your Business
A complete ecosystem for IoT data analytics. Leverage automated insights and custom reporting to stay ahead in a connected world
Business Logic & KPI Builder
- Create KPIs, derived metrics, conditional formulas, and logic blocks
- Centralize logic and reuse calculations across views and dashboards
- Validate results instantly on sample data
- Save any calculation to ThingsBoard telemetry for automation
Automated Monitoring & Deviations Tracking
- Identify unusual behavior, performance drops, drifts, and spikes
- Use ready-made algorithms or customize thresholds and conditions
- Visualize anomalies inside Trendz or save them to ThingsBoard
- Trigger ThingsBoard alarms for real-time reactions
Forecasting & Future Behavior Insights
- Predict failures, loads, consumption, or performance KPIs
- Validate accuracy with real vs predicted comparisons
- View long- and short-term forecasts instantly
- Save predictions to ThingsBoard to drive preventive maintenance dashboards
Natural Language Analytics & Auto-Generation
- Ask questions in plain language and get instant analytical answers
- Generate formulas, KPIs, and metrics by description
- Modify existing logic with AI suggestions
- Ideal for rapid prototyping and quick investigations
Scalable Aggregates & Time-Based Summaries
- Convert millions of telemetry points into clear summaries
- Aggregate hourly, daily, weekly, or with custom intervals
- Power reports, performance KPIs, and trend dashboards
- Use aggregated data directly in Trendz visualizations, dashboards, and logic
Context-Aware Device Behavior Classification
- Define operating modes, quality levels, statuses, or health states
- Transform raw telemetry into clear, human-readable state labels
- Use states to enrich Trendz analytics, comparisons, KPIs, and dashboards
- Visualize state transitions in Trendz Views and combine them with other metrics
Interactive Data Investigation Tools
- Instantly explore telemetry with zoom, filters, breakdowns, and overlays
- Compare multiple metrics, assets, or devices side-by-side
- Highlight patterns, correlations, and anomalies visually
- Use visual tools as a starting point before building KPIs or models
Scenario Testing with Calculated Fields
- Change input parameters to see how KPIs or metrics would react
- Test best-case, worst-case, or custom operational scenarios
- Validate business assumptions without affecting real data
- Use simulations to prepare decisions, budgets, or maintenance strategies
Smart Formula-Based Optimization
- Optimize KPIs such as efficiency, cost, consumption, or performance
- Automatically compute the best parameter combination
- Use constraints and conditions to keep scenarios realistic
- Ideal for process tuning, energy optimization, and resource planning
Create your powerful IoT Analytics Solutions
Try Trendz for free with the Free plan, connect it to your ThingsBoard, or submit a request and we will help you choose the best option.
Frequently asked questions
IoT analytics is the process of converting raw sensor data into meaningful business insights. While standard dashboards show what is happening right now, IoT analytics helps you understand why it is happening and predicts what will happen next using statistical functions and calculated fields.
ThingsBoard is excellent for real-time monitoring and device management. Trendz Analytics complements this by serving as one of the most powerful IoT analytics solutions available, adding model-driven analytics like anomaly detection, health scoring, and complex KPI modeling that basic dashboards cannot perform.
While many cloud providers offer generic tools, Trendz Analytics is specifically designed for real-time IoT data analytics within the ThingsBoard ecosystem. It processes incoming telemetry instantly, allowing teams to generate reports and trigger automated workflows without the delay of transferring data to external third-party clouds.
Yes, Trendz is a comprehensive predictive maintenance software tool. It uses historical data to identify early signs of equipment degradation, allowing you to schedule repairs before a failure occurs, which significantly reduces downtime and maintenance costs.
Trendz acts as robust forecasting software by using built-in Machine Learning (ML) models to project future trends. You can predict energy consumption, future system loads, or the remaining useful life of an asset based on past telemetry patterns.
The accuracy of data analytics in IoT depends on the stability of your telemetry and the amount of historical data available to establish baselines. Trendz allows you to validate these models against real-world outcomes to ensure your forecasts are highly reliable for planning.
Trendz is a separate add-on product by ThingsBoard and is charged as an add-on in the scope of the main ThingsBoard license. Pricing depends on license type and deployment model — public/private Cloud, self-hosted, or perpetual license.
At a minimum, you need stable telemetry keys and an asset structure in ThingsBoard. To get the most out of IoT data analytics, such as health scoring or predictions, you need enough historical data to establish a baseline for the ML models.
Trendz automates much of the IoT analytics process through "Topology Discovery," which automatically learns your device and asset relationships from ThingsBoard. This allows you to build complex KPI models and Metric Explorers without manually re-mapping your entire network.
Trendz is a ThingsBoard add-on and is designed to work with ThingsBoard telemetry and the device/entity model you already have. Optional external context (such as weather or business system inputs) and workflow integrations (ticketing/CMMS/work orders, etc.) are added using ThingsBoard's built-in Integrations and Rule Engine.
Yes, Trendz is a native add-on that works within the ThingsBoard identity and access model. Your existing SSO and RBAC settings will apply to your IoT analytics dashboards, ensuring that data remains secure and auditable.