CO2 Display lite Temperature and humidity sensor
CO2 Display lite Temperature and humidity sensor
MClimate
- Platform
- ThingsBoard
- Hardware Type
- Sensors
- Connectivity
- LoRaWAN
- Industry
- Smart Cities, Smart Buildings, Environmental Monitoring, Healthcare, Industrial Manufacturing
- Use Case
- Environment Monitoring, Smart Office, Health Care, Air Quality Monitoring, Waste Management
Introduction
The MClimate CO2 Display lite the lite version is equipped with temperature and humidity sensor, LUX sensor and NDIR CO2 sensor. Featuring smaller 1.54” e-ink screen the device is showing the current levels of CO2 as well as historical trends. The data from the CO2 Display lite can be used in any LoRaWAN® compatible system, incl. Building Management Systems to control demand-based ventilation. Sensor information can be exposed as datapoints in Modbus, BACnet and KNX systems through the use of a special gateway.
Prerequisites
To continue with this guide we will need the following:
- CO2 Display lite Temperature and humidity sensor
-
LoRaWAN® gateway (in our case UG56 LoRaWAN® Gateway)
-
Configured integration on networks server and ThingsBoard
-
ThingsBoard account at
YOUR_TB_HOST
Device connection
Device configuration
To connect and send data we should configure the device and network server. At first we are going to configure the device, and save required information for network server configuration. To add a device to network server and get information from it, we will need the following device parameters:
- Device EUI – device identifier
- Application EUI – Application identifier
- Application Key – Application key to identify device
To configure the device we also need to add it to a network server, so select the network server your gateway is connected to:
Add a device on the Chirpstack
We need to add a device on the Chirpstack.
To add a device, you can follow next steps:
- Login to Chirpstack server.
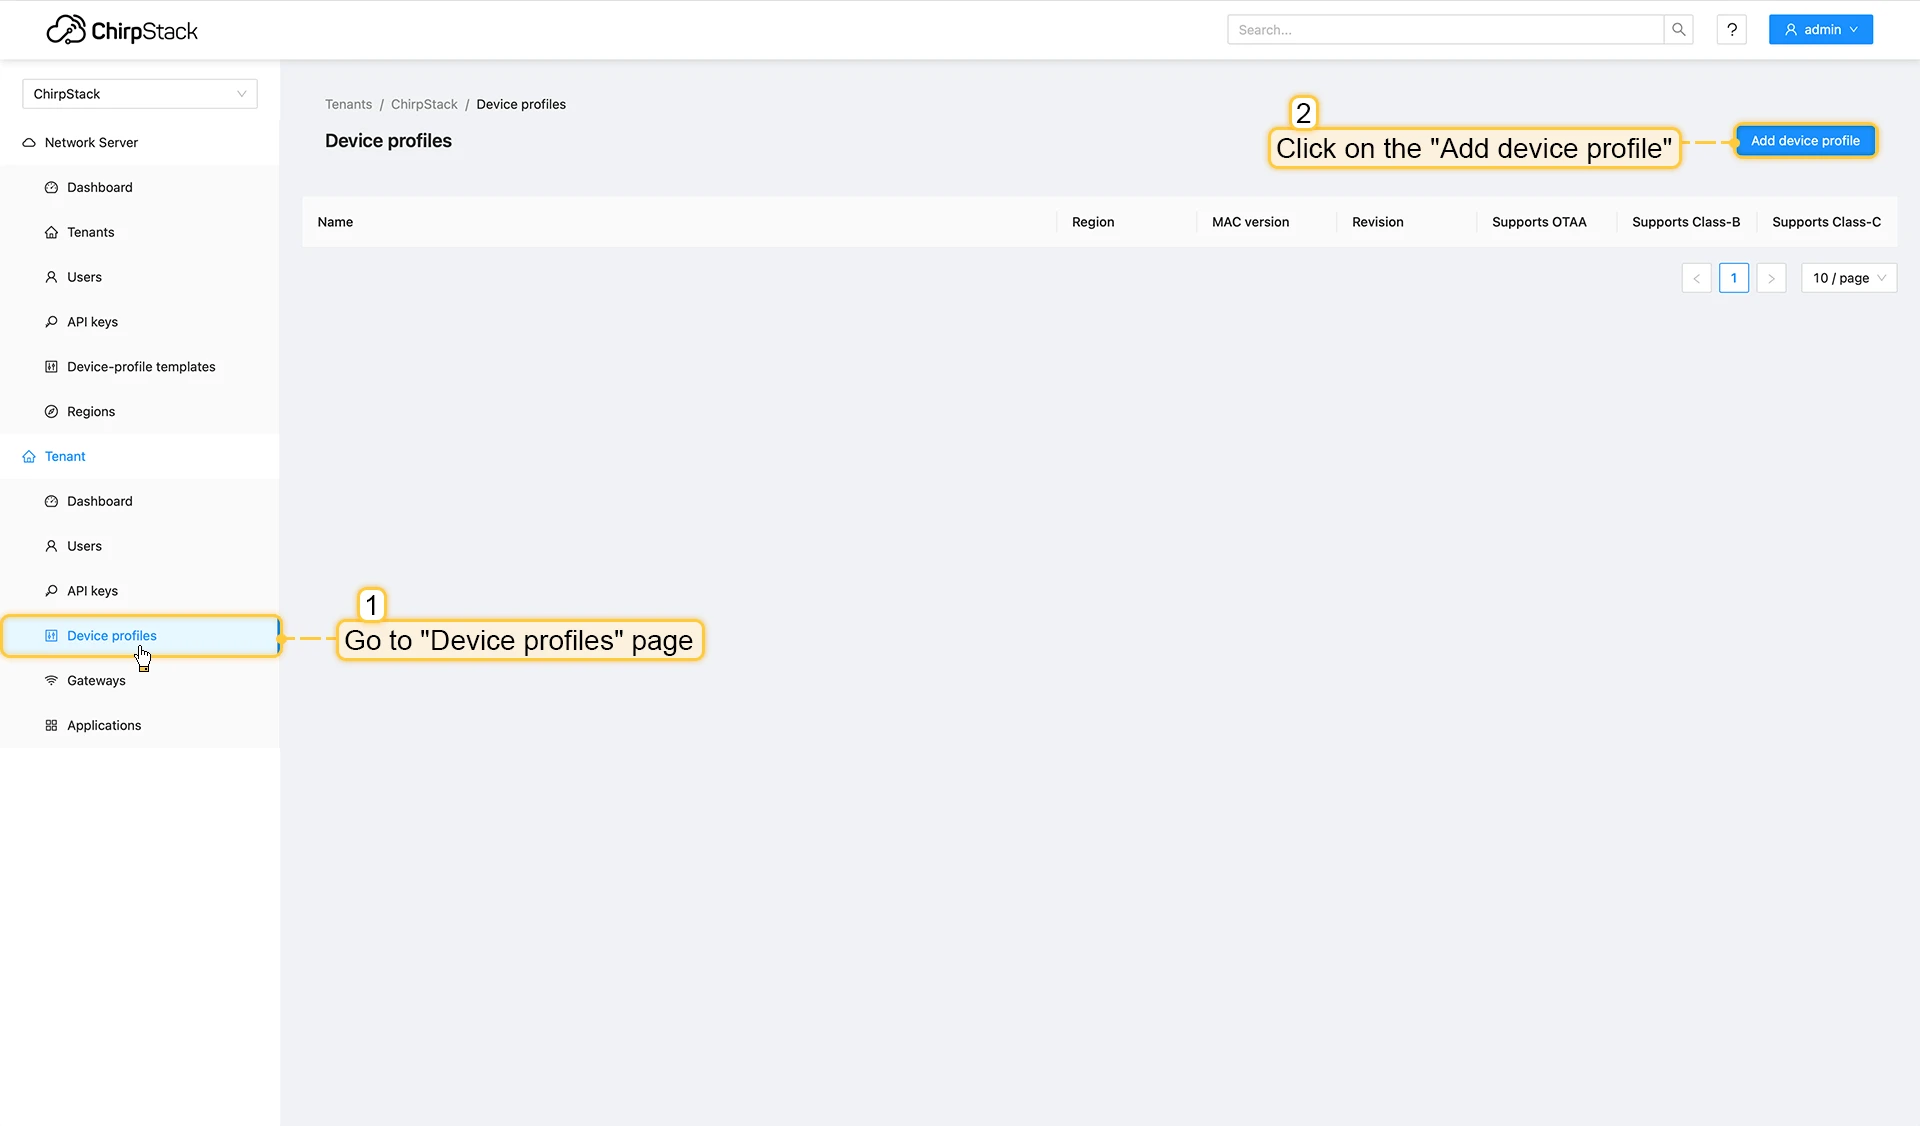
- Go to the Device profiles page and click on Add device profile button.
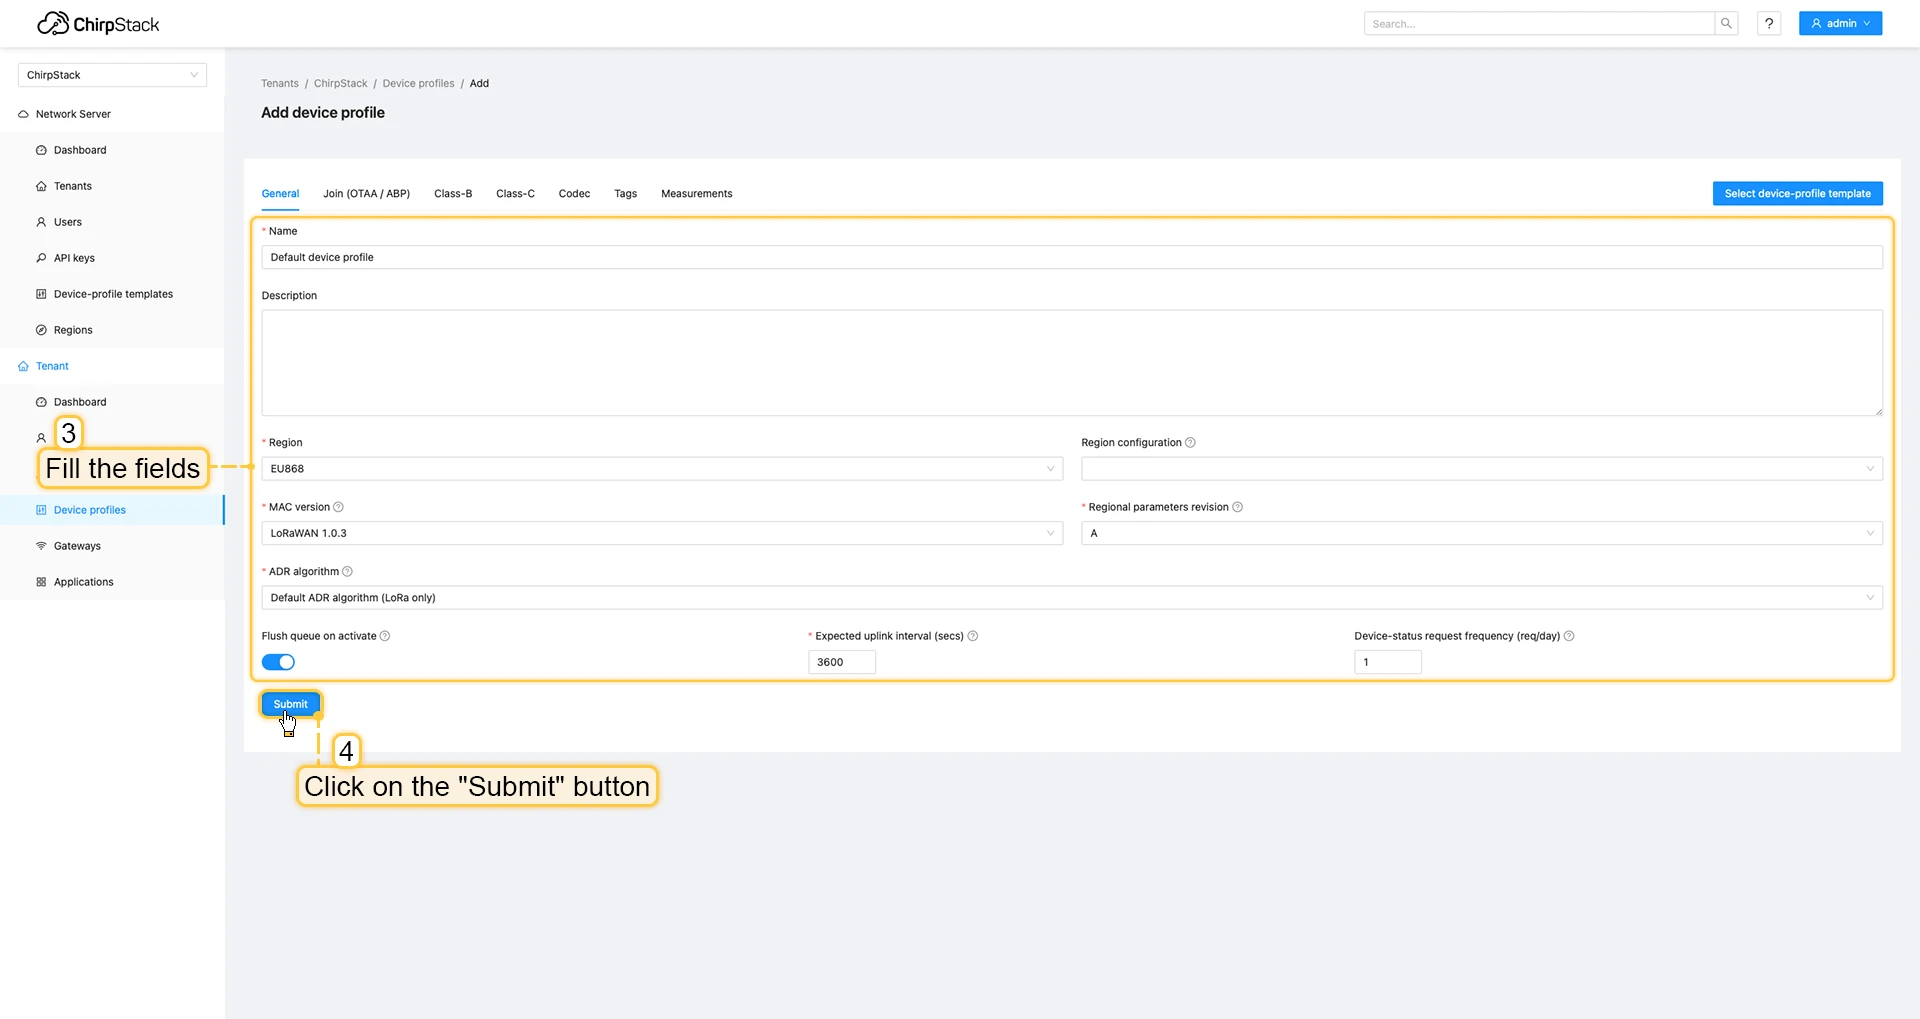
- Fill the fields and click on Submit button.
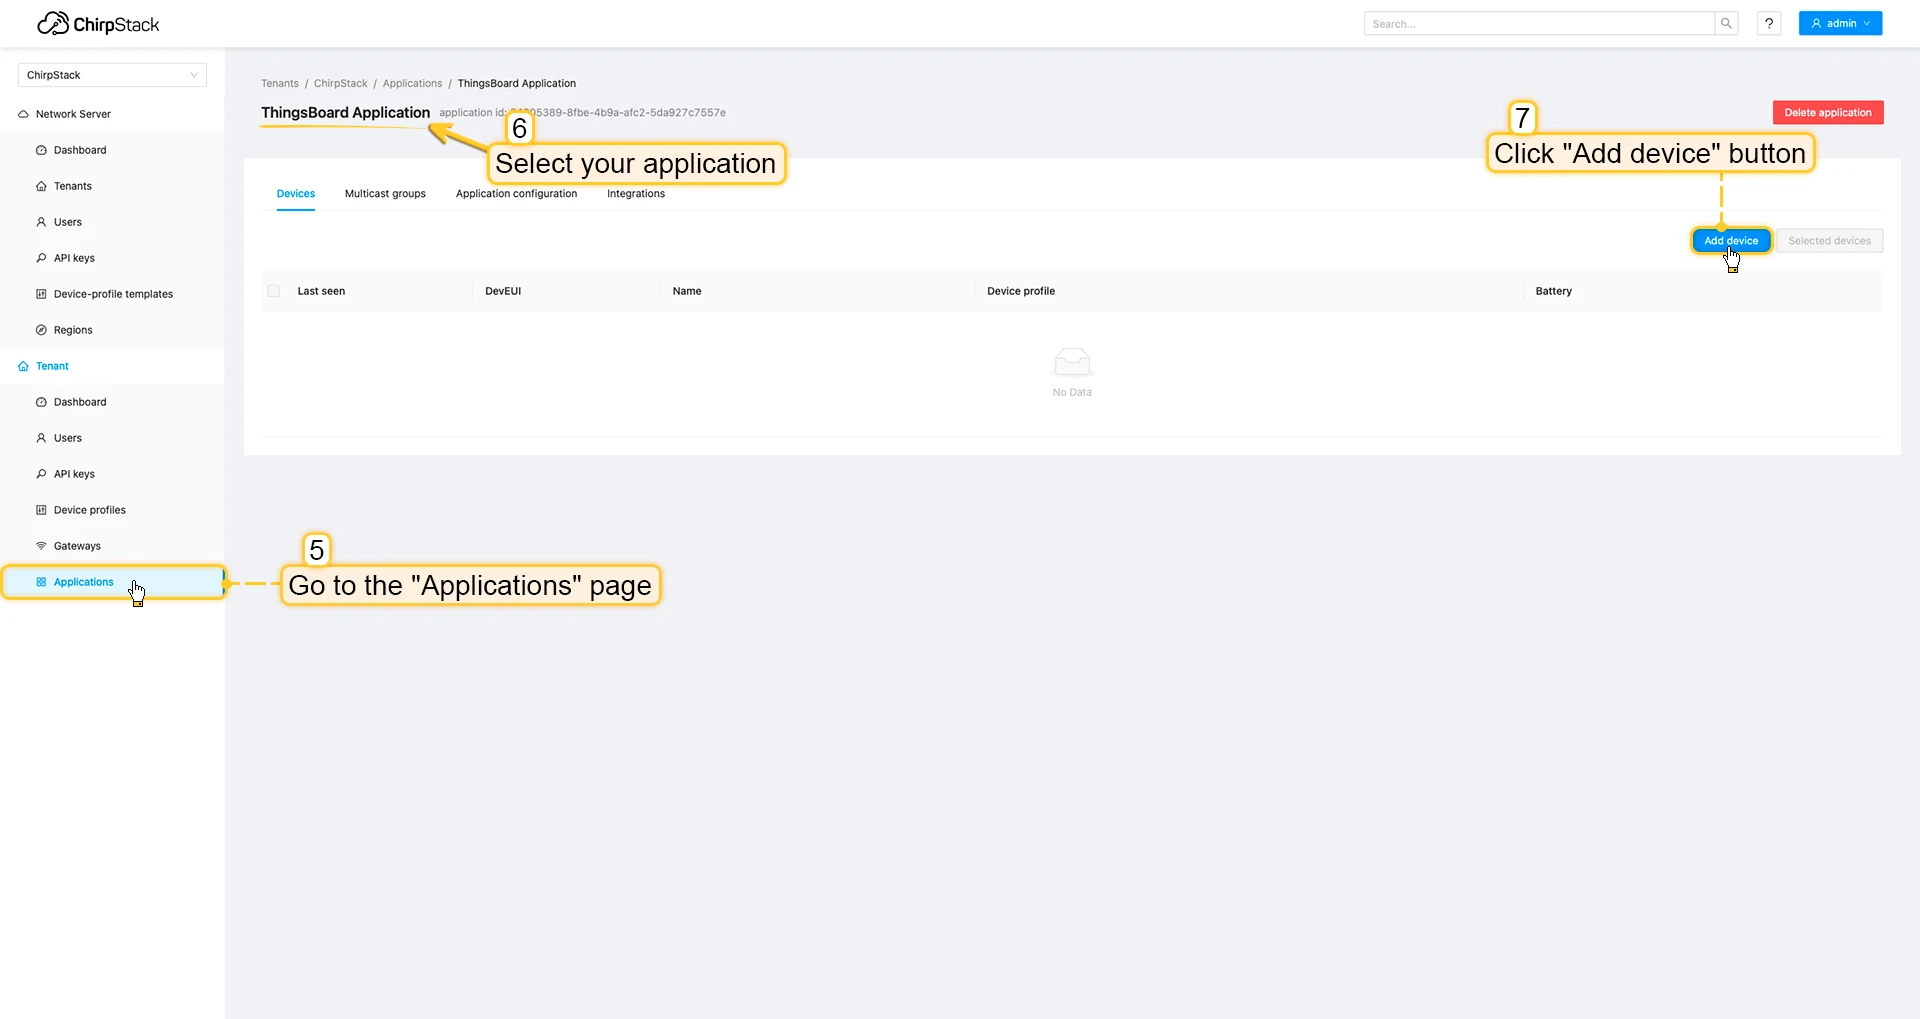
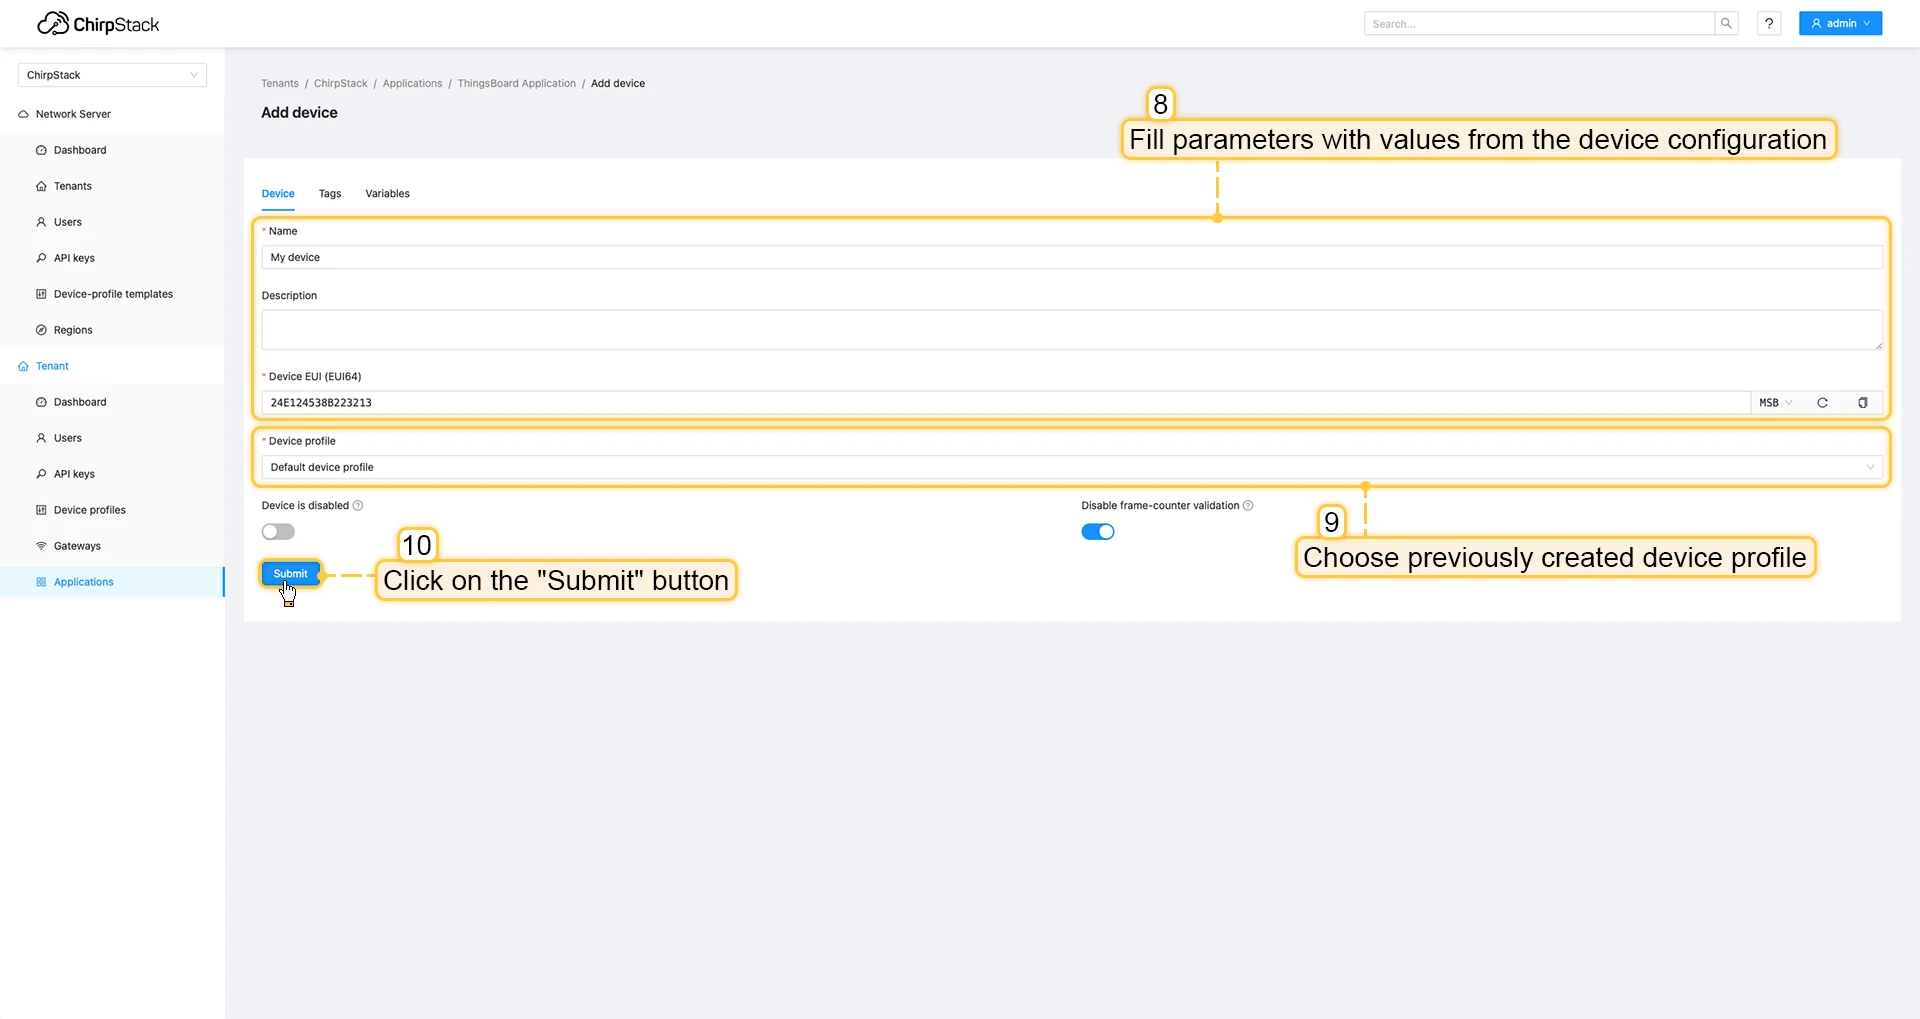
- Go to the Applications page, click on your application and press Add device button.
- Fill parameters with values from the device configuration. Then choose previously created device profile and click on Submit button.
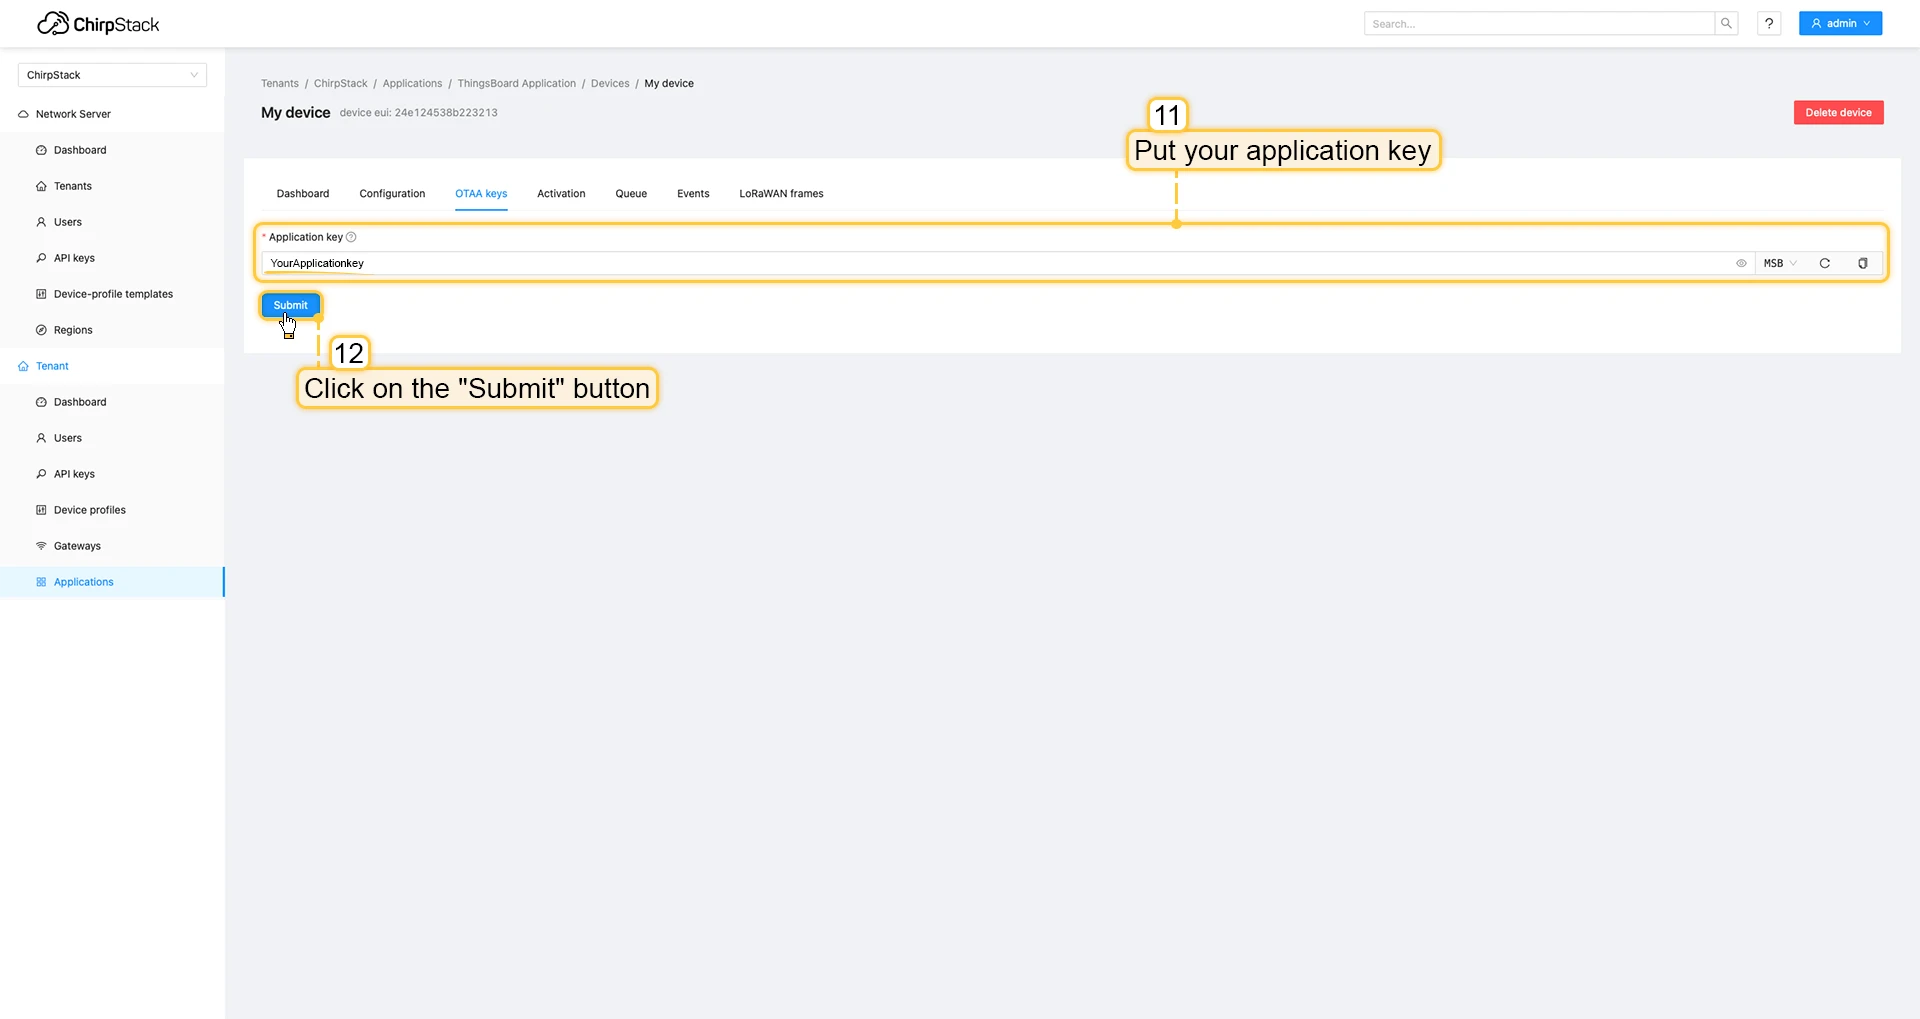
- Put your Application key to the field and click on Submit button to save the device.

Uplink converter in ThingsBoard integration
Step 1: Download the JSON fileDownload the JSON file with the uplink converter settings by clicking the button below.
Download uplink converter for ChirpStack integration.
Step 2: Import the Uplink converter into ThingsBoard
After downloading the file with the Uplink converter configuration, import it into ThingsBoard:
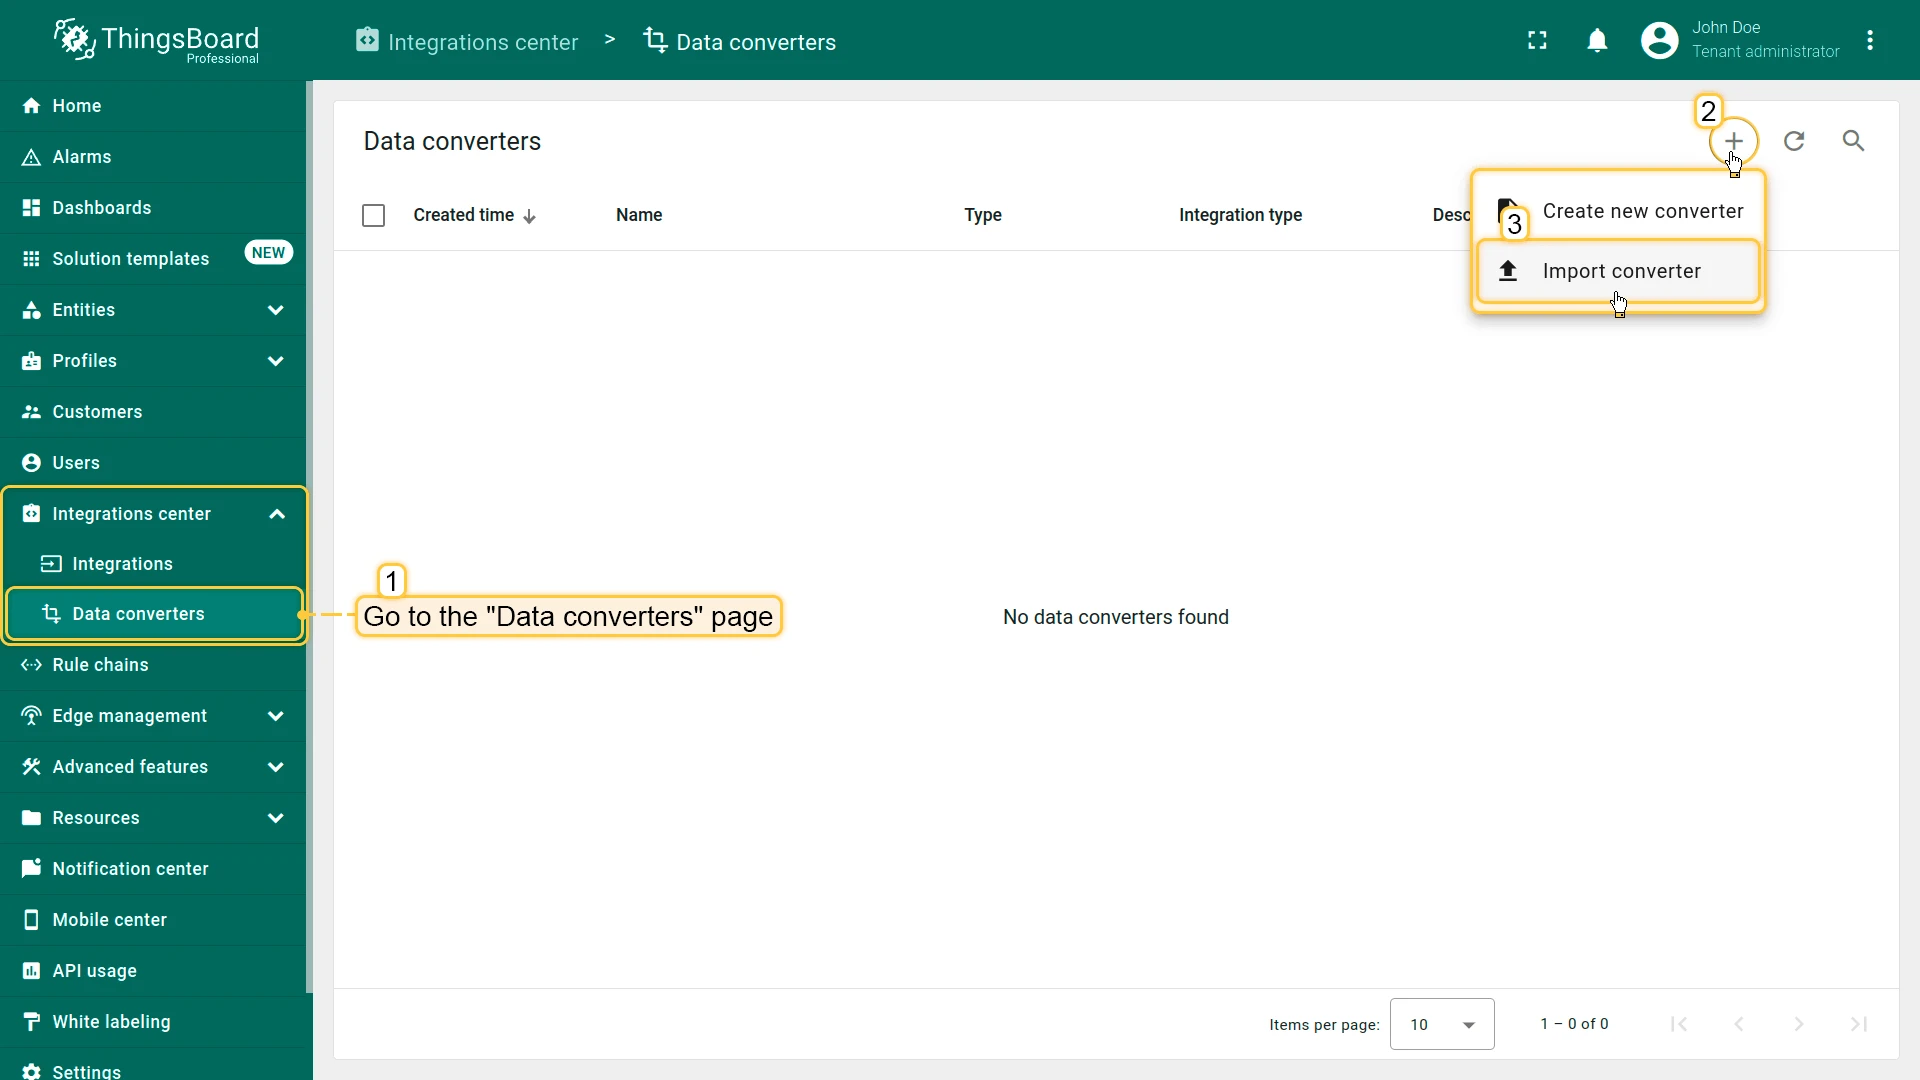
- Navigate to the “Data converters” page in the “Integration center” section.
- Click the ”+” icon in the top-right corner of the page and select “Import converter” from the drop-down menu.
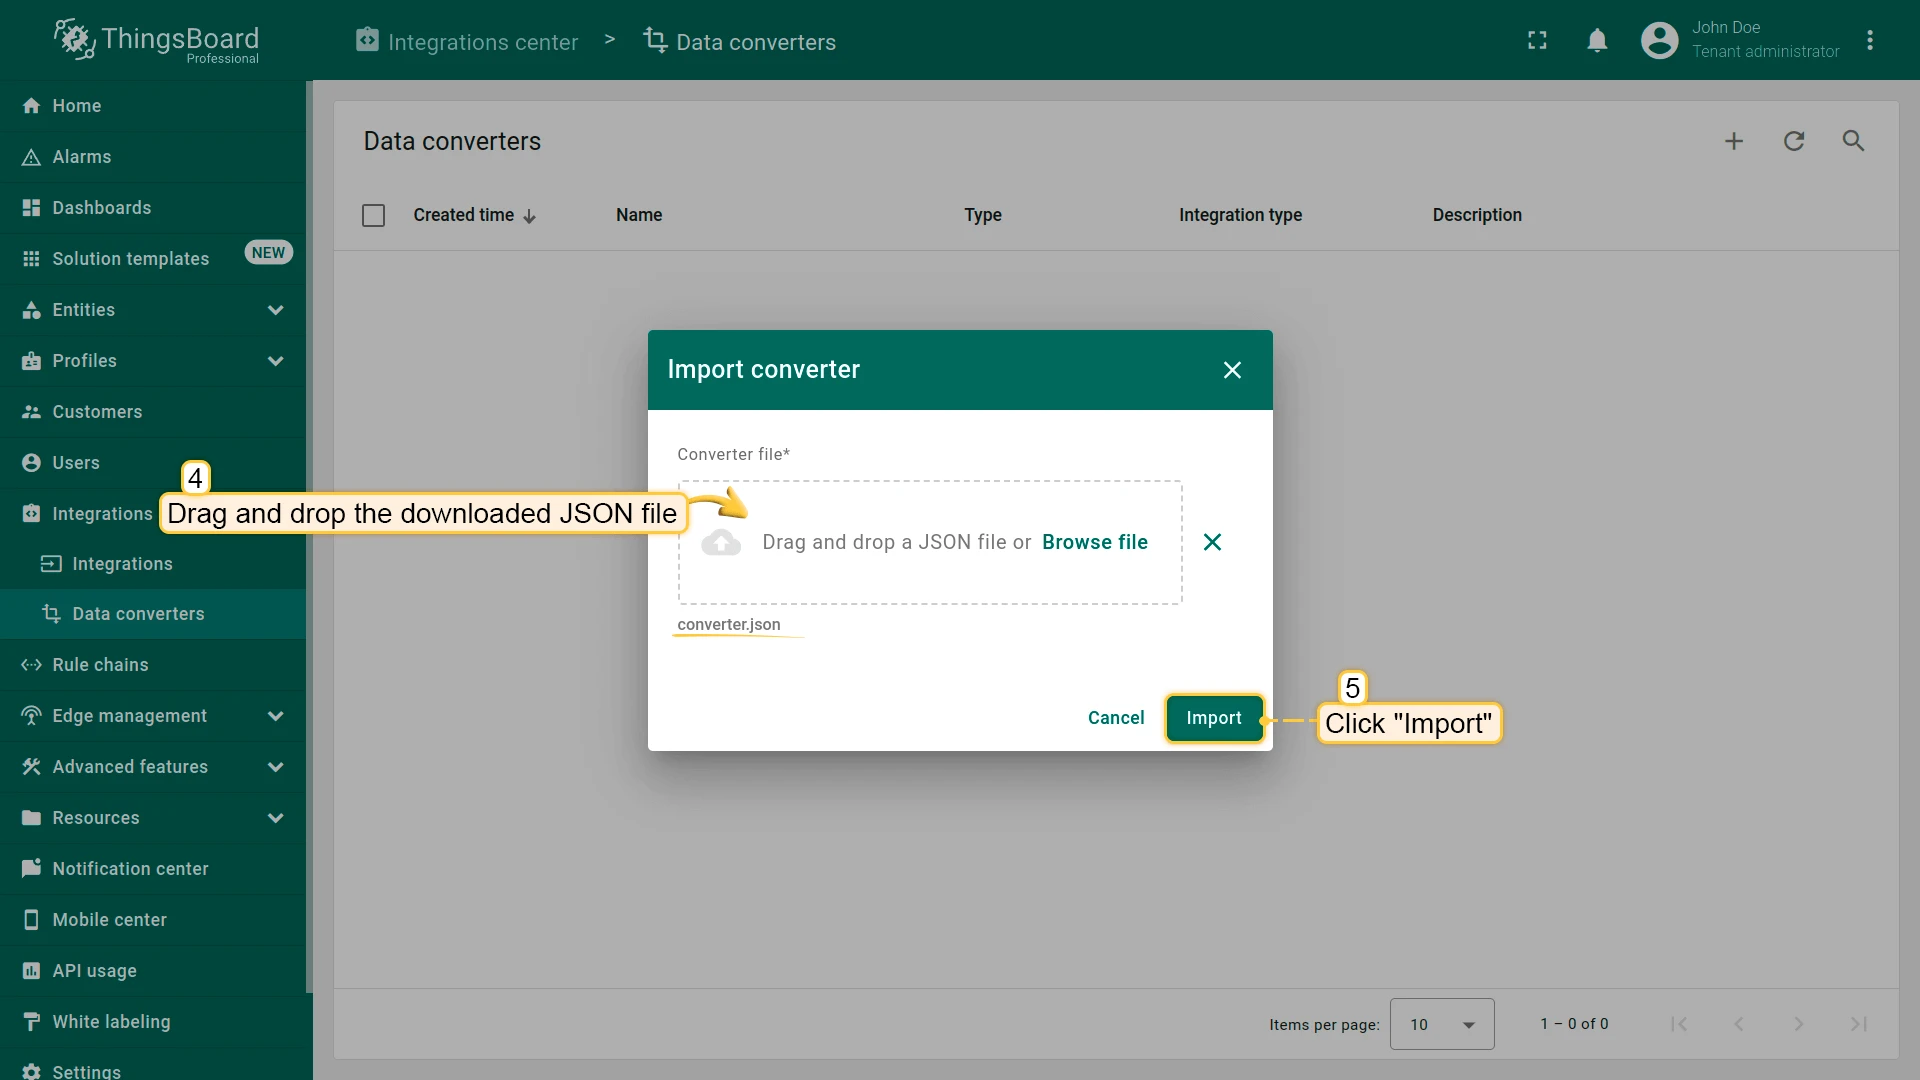
- Drag and drop the downloaded JSON file (containing the uplink converter configuration) into the import window, then click “Import”.
- The uplink converter is now successfully imported.

Step 3: Replace the Uplink converter in the ChirpStack integration
Now, let’s update your ChirpStack integration to use the new uplink converter:
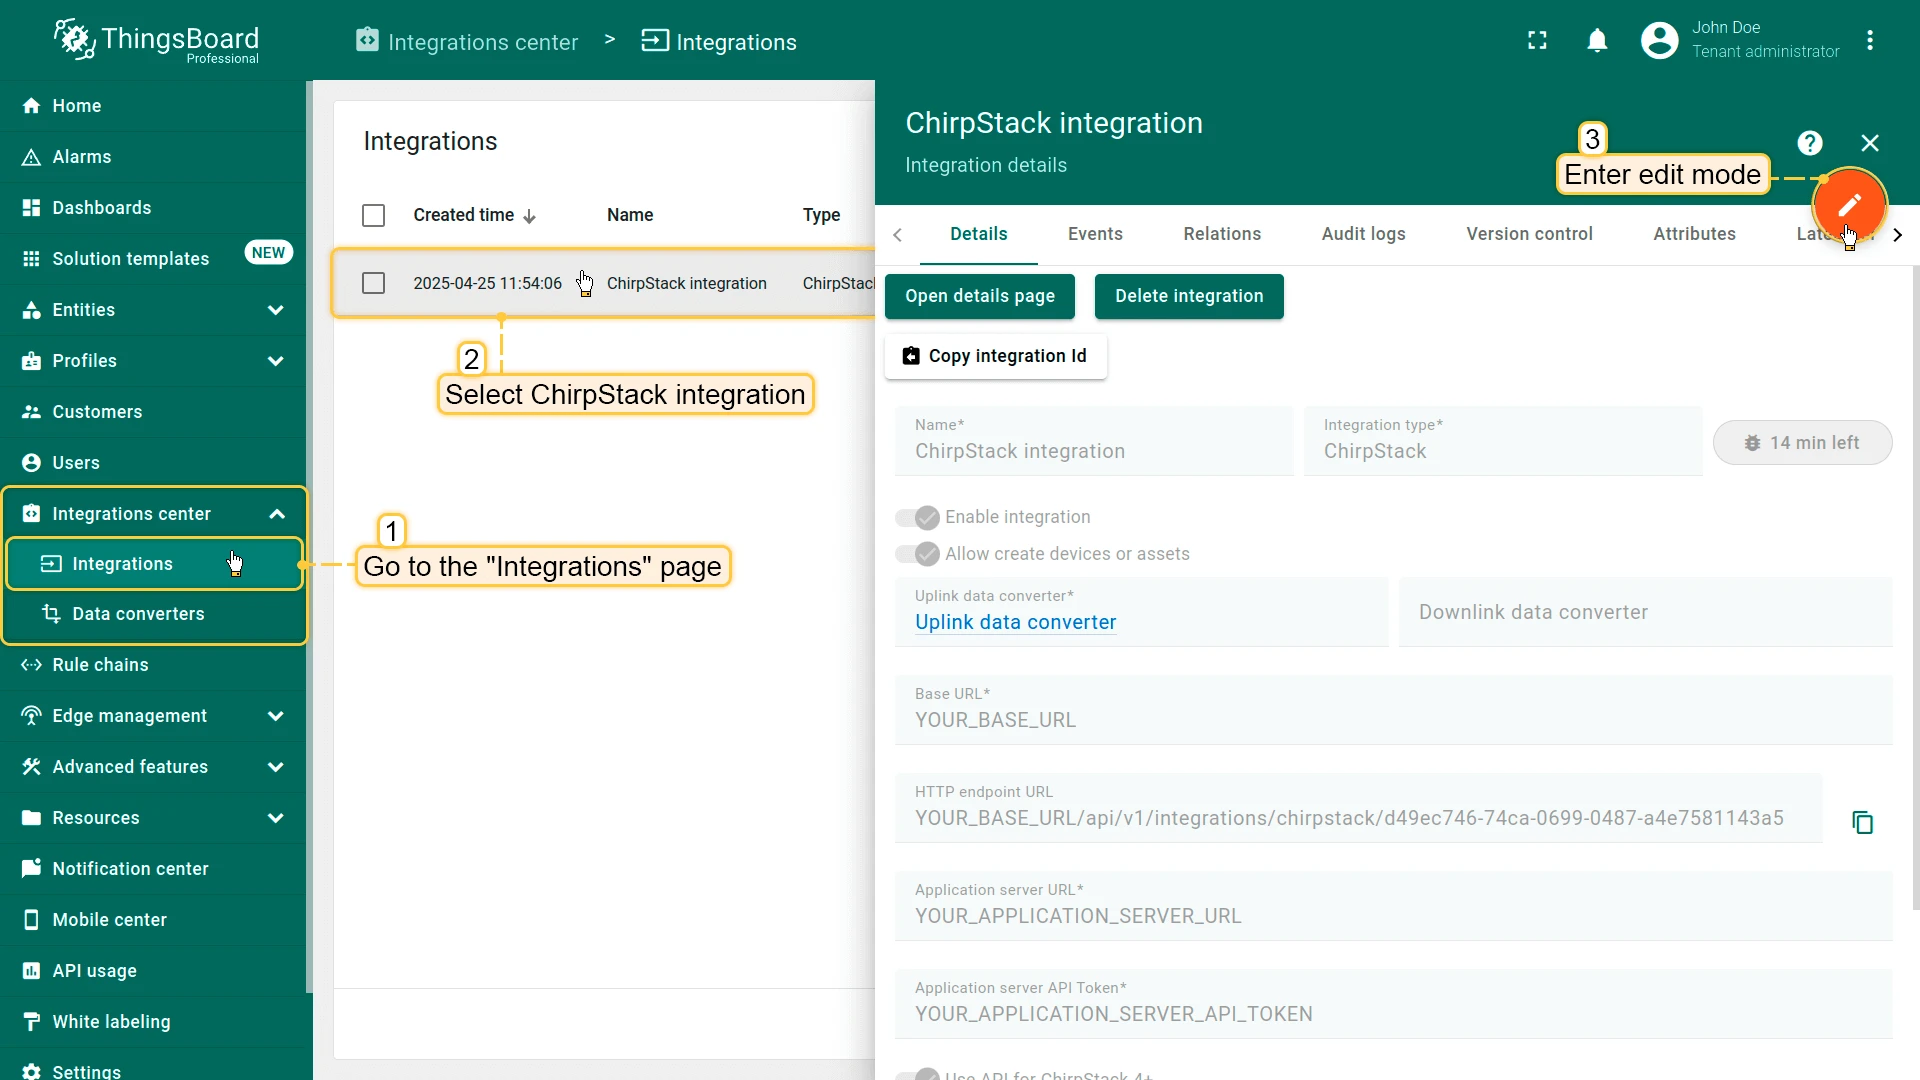
- Go to the “Integrations” page in the “Integration center” section.
- Click on your ChirpStack integration to open its details window.
- Enter edit mode by clicking the orange pencil button in the top-right corner.
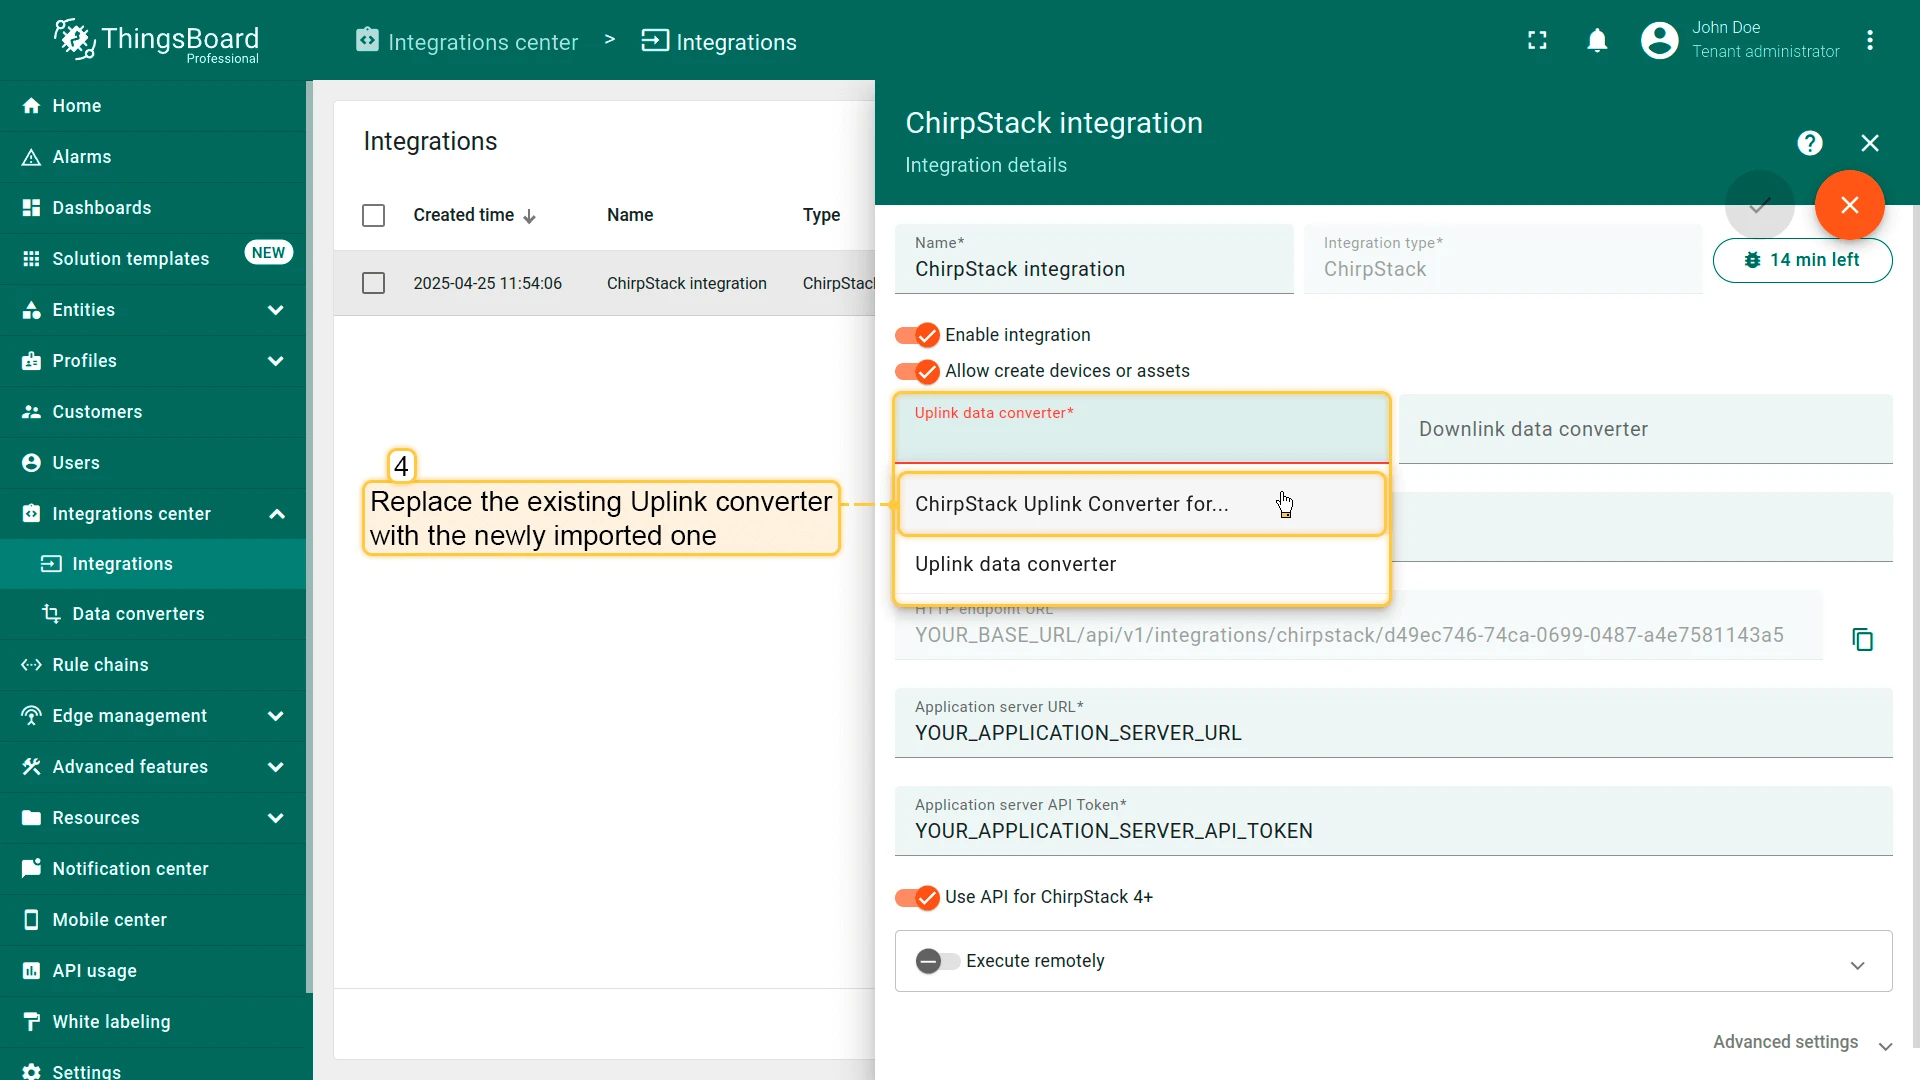
- Replace the existing uplink converter with the imported one.
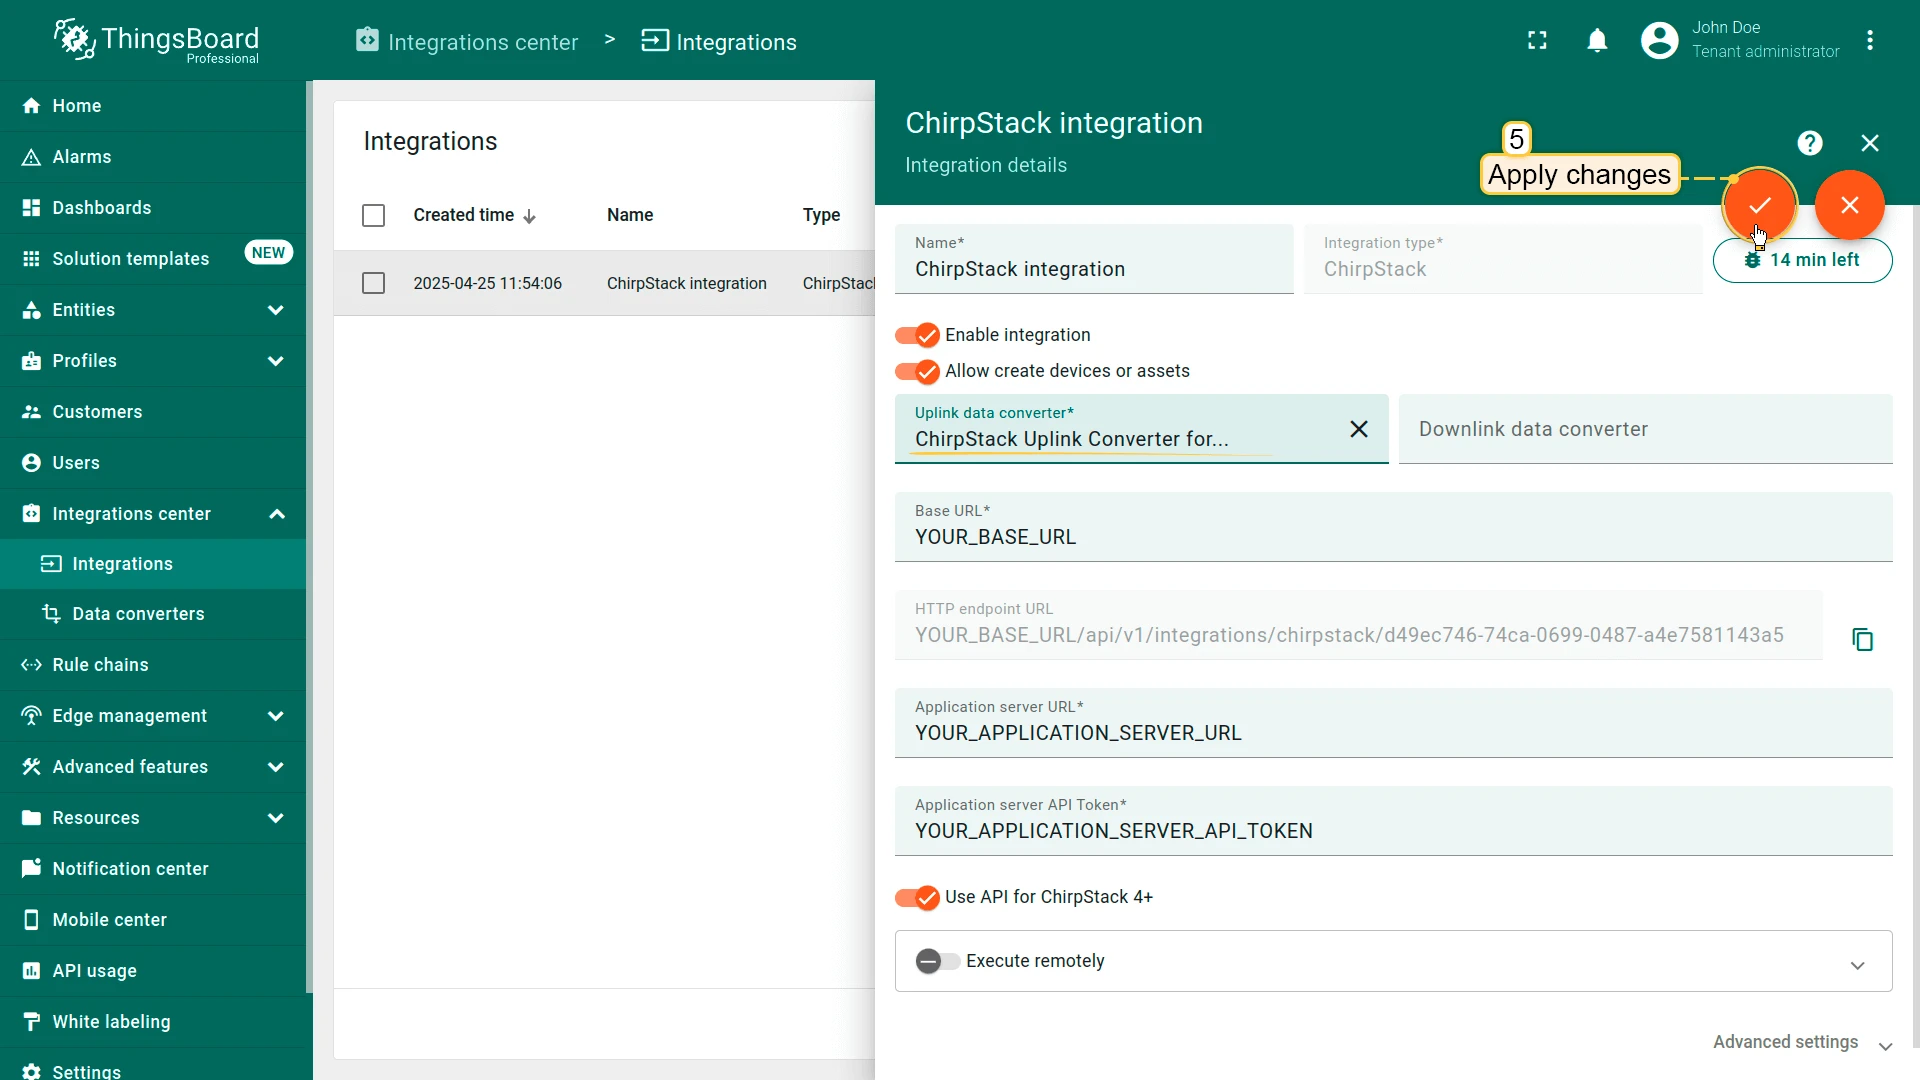
- Don’t forget to save your changes!
Add a device on The Things Stack Community Edition
We need to add a device on The Things Stack Community Edition.
To add a device, you can follow next steps:
- Login to the cloud and open your console.
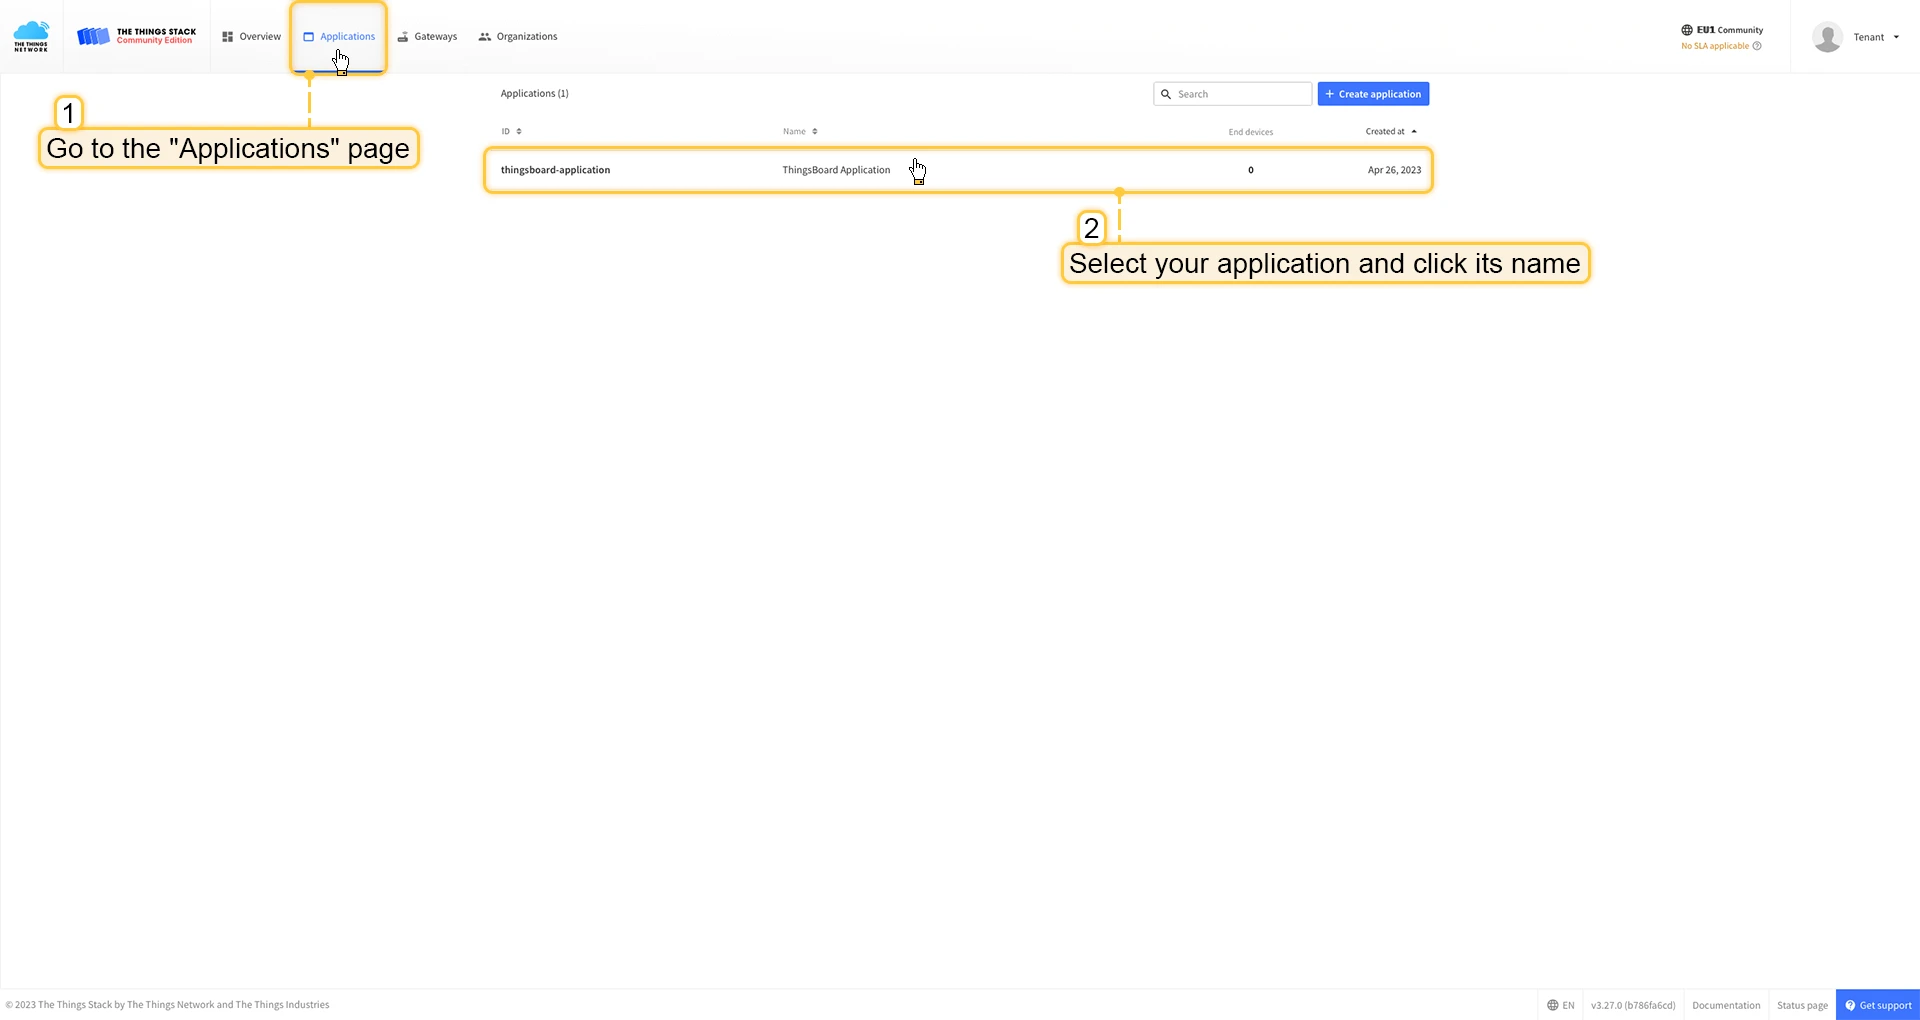
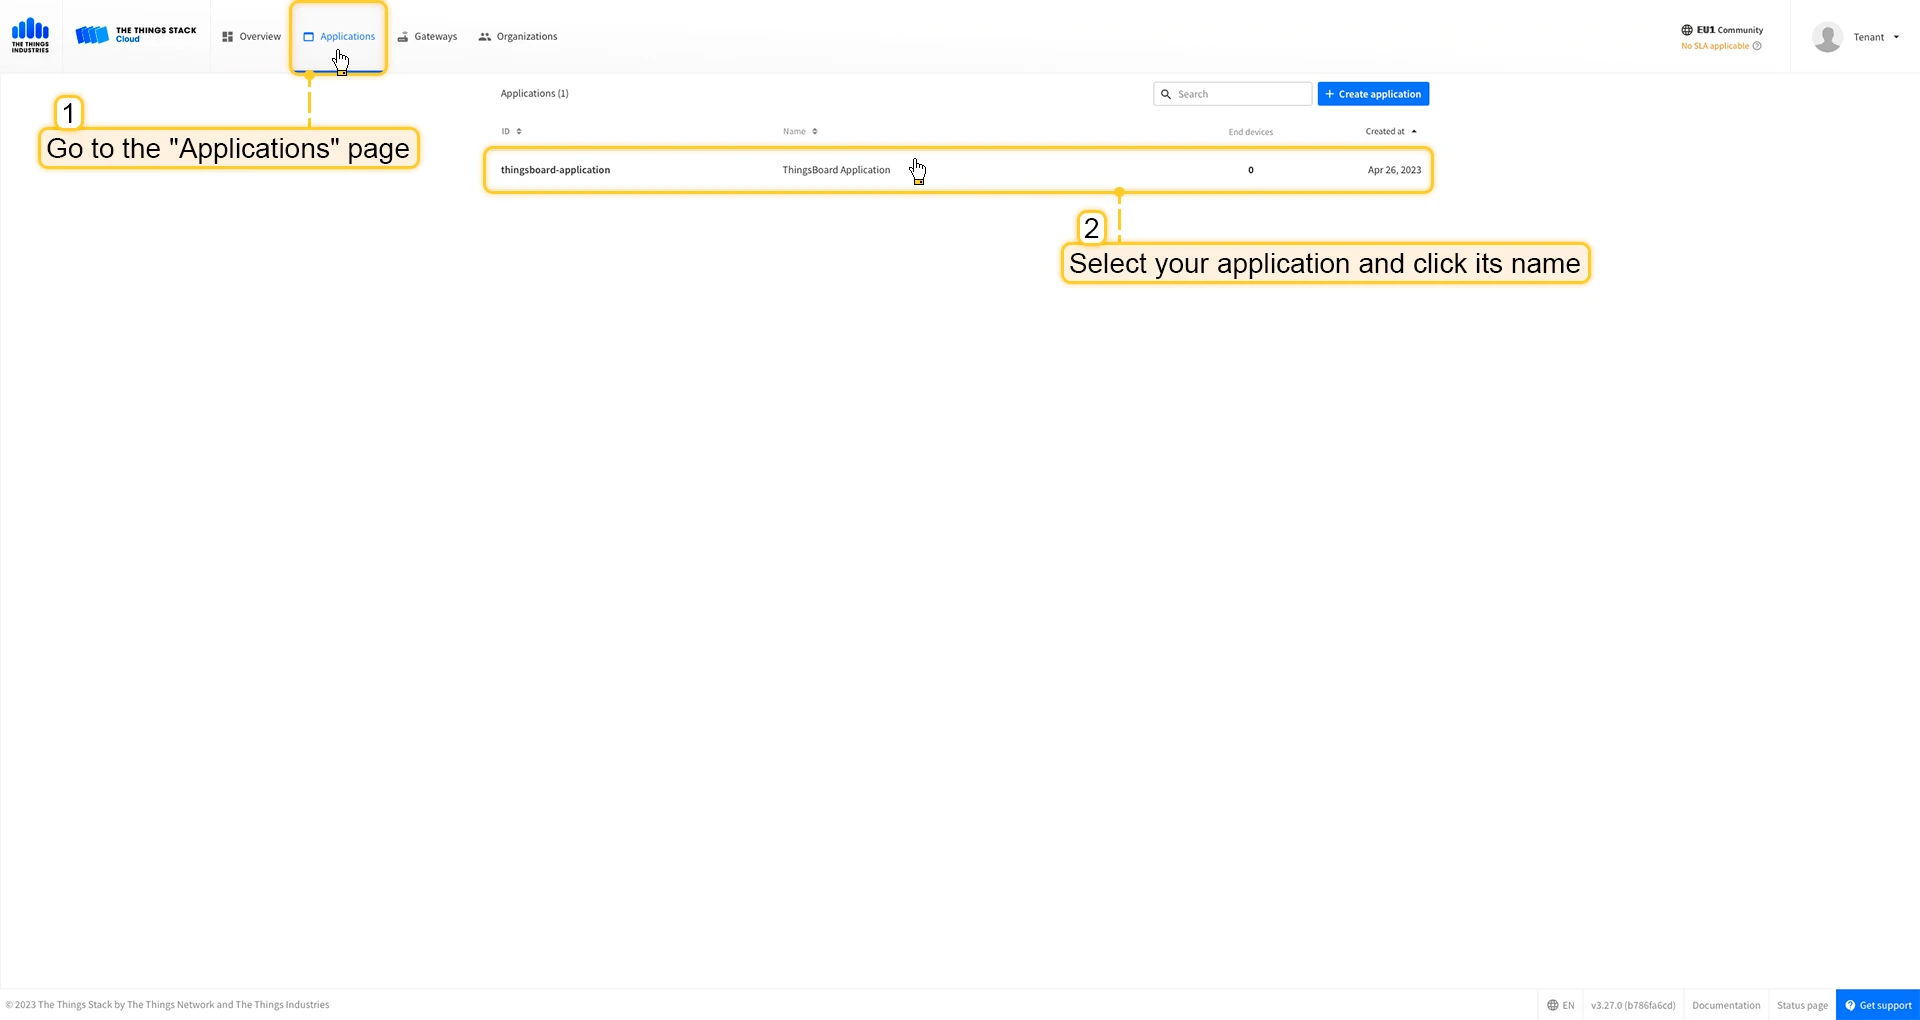
- Go to the Applications page. Then select your application and click on its name.
- Click on the Register end device button.
- Put the APP EUI value to the JoinEUI field. Press the Confirm button.
- Fill the rest parameters and press Register end device button.


Uplink converter in ThingsBoard integration
Step 1: Download the JSON fileDownload the JSON file with the uplink converter settings by clicking the button below.
Download uplink converter for The Things Stack integration.
Step 2: Import the Uplink converter into ThingsBoard
After downloading the file with the Uplink converter configuration, import it into ThingsBoard:
- Navigate to the “Data converters” page in the “Integration center” section.
- Click the ”+” icon in the top-right corner of the page and select “Import converter” from the drop-down menu.
- Drag and drop the downloaded JSON file (containing the uplink converter configuration) into the import window, then click “Import”.
- The uplink converter is now successfully imported.

Step 3: Replace the Uplink converter in the The Things Stack integration
Now, let’s update your The Things Stack integration to use the new uplink converter:
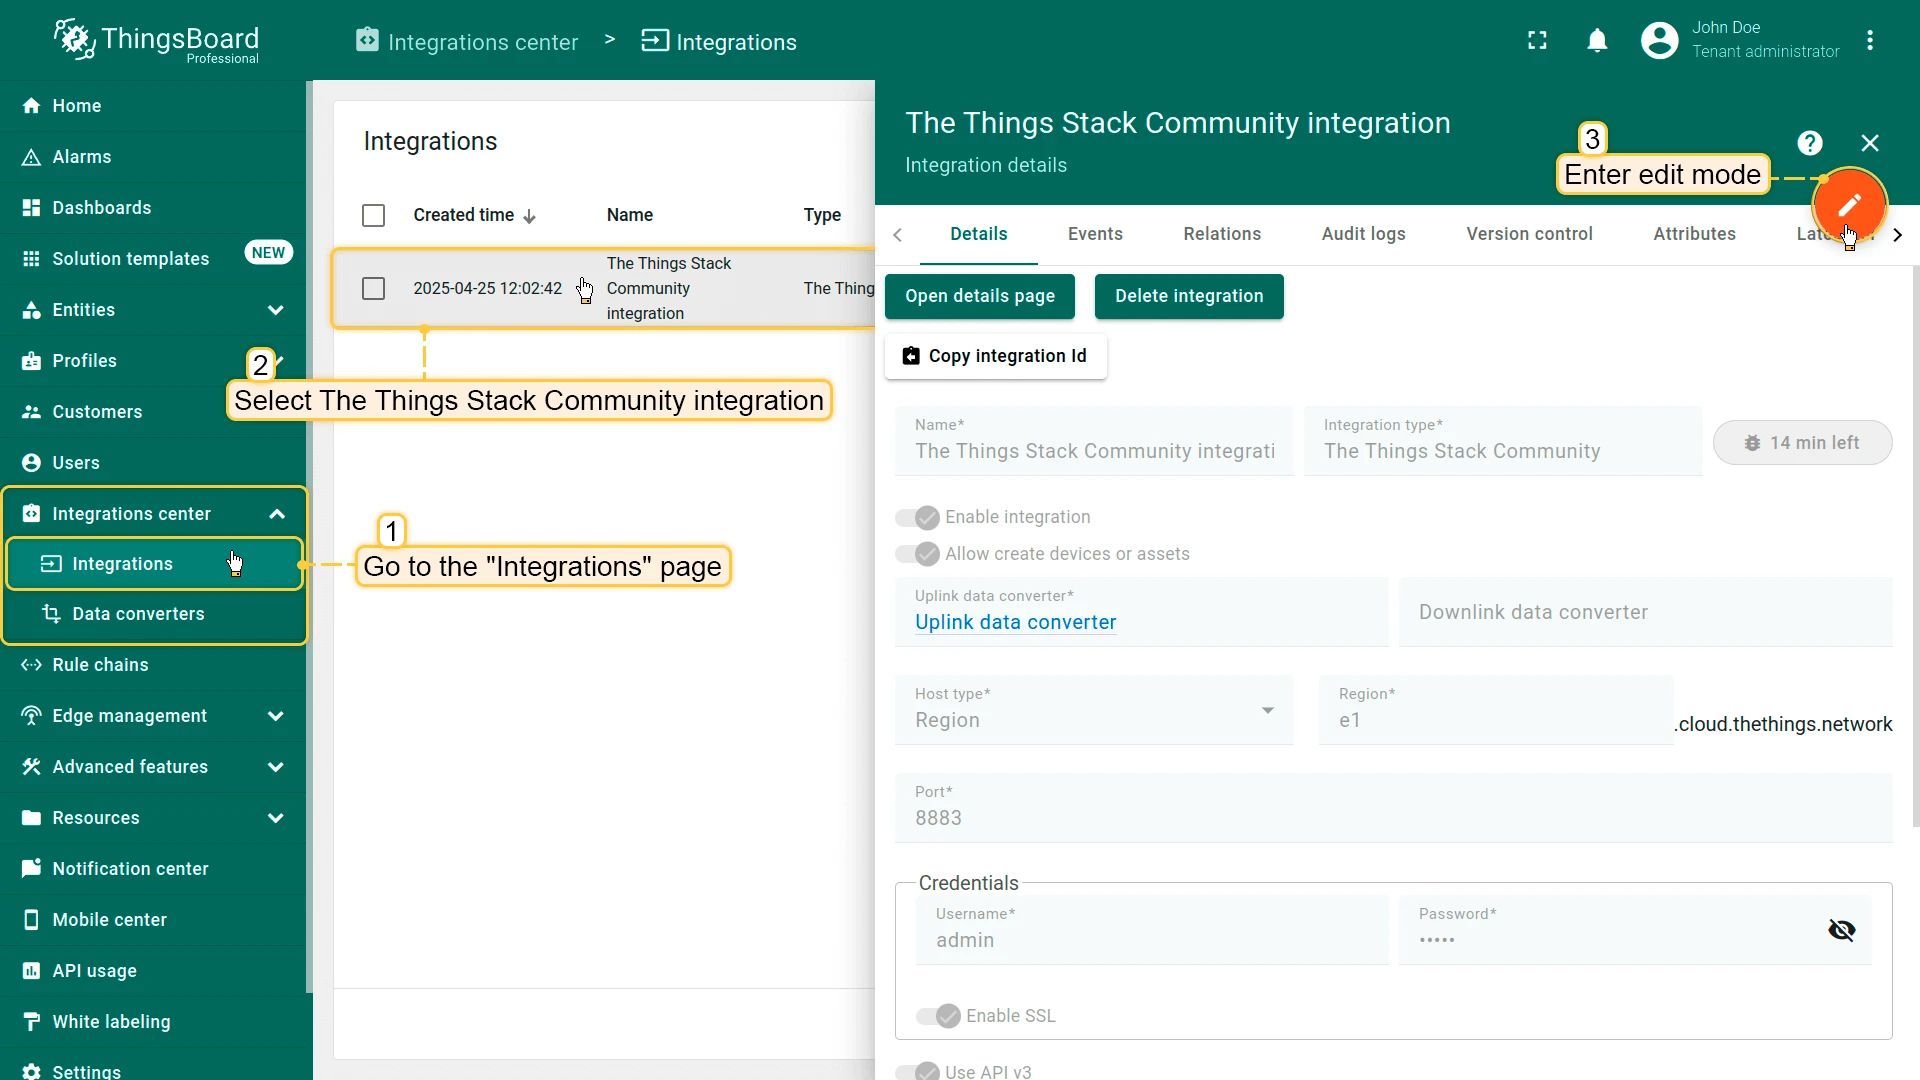
- Go to the “Integrations” page in the “Integration center” section.
- Click on your The Things Stack integration to open its details window.
- Enter edit mode by clicking the orange pencil button in the top-right corner.
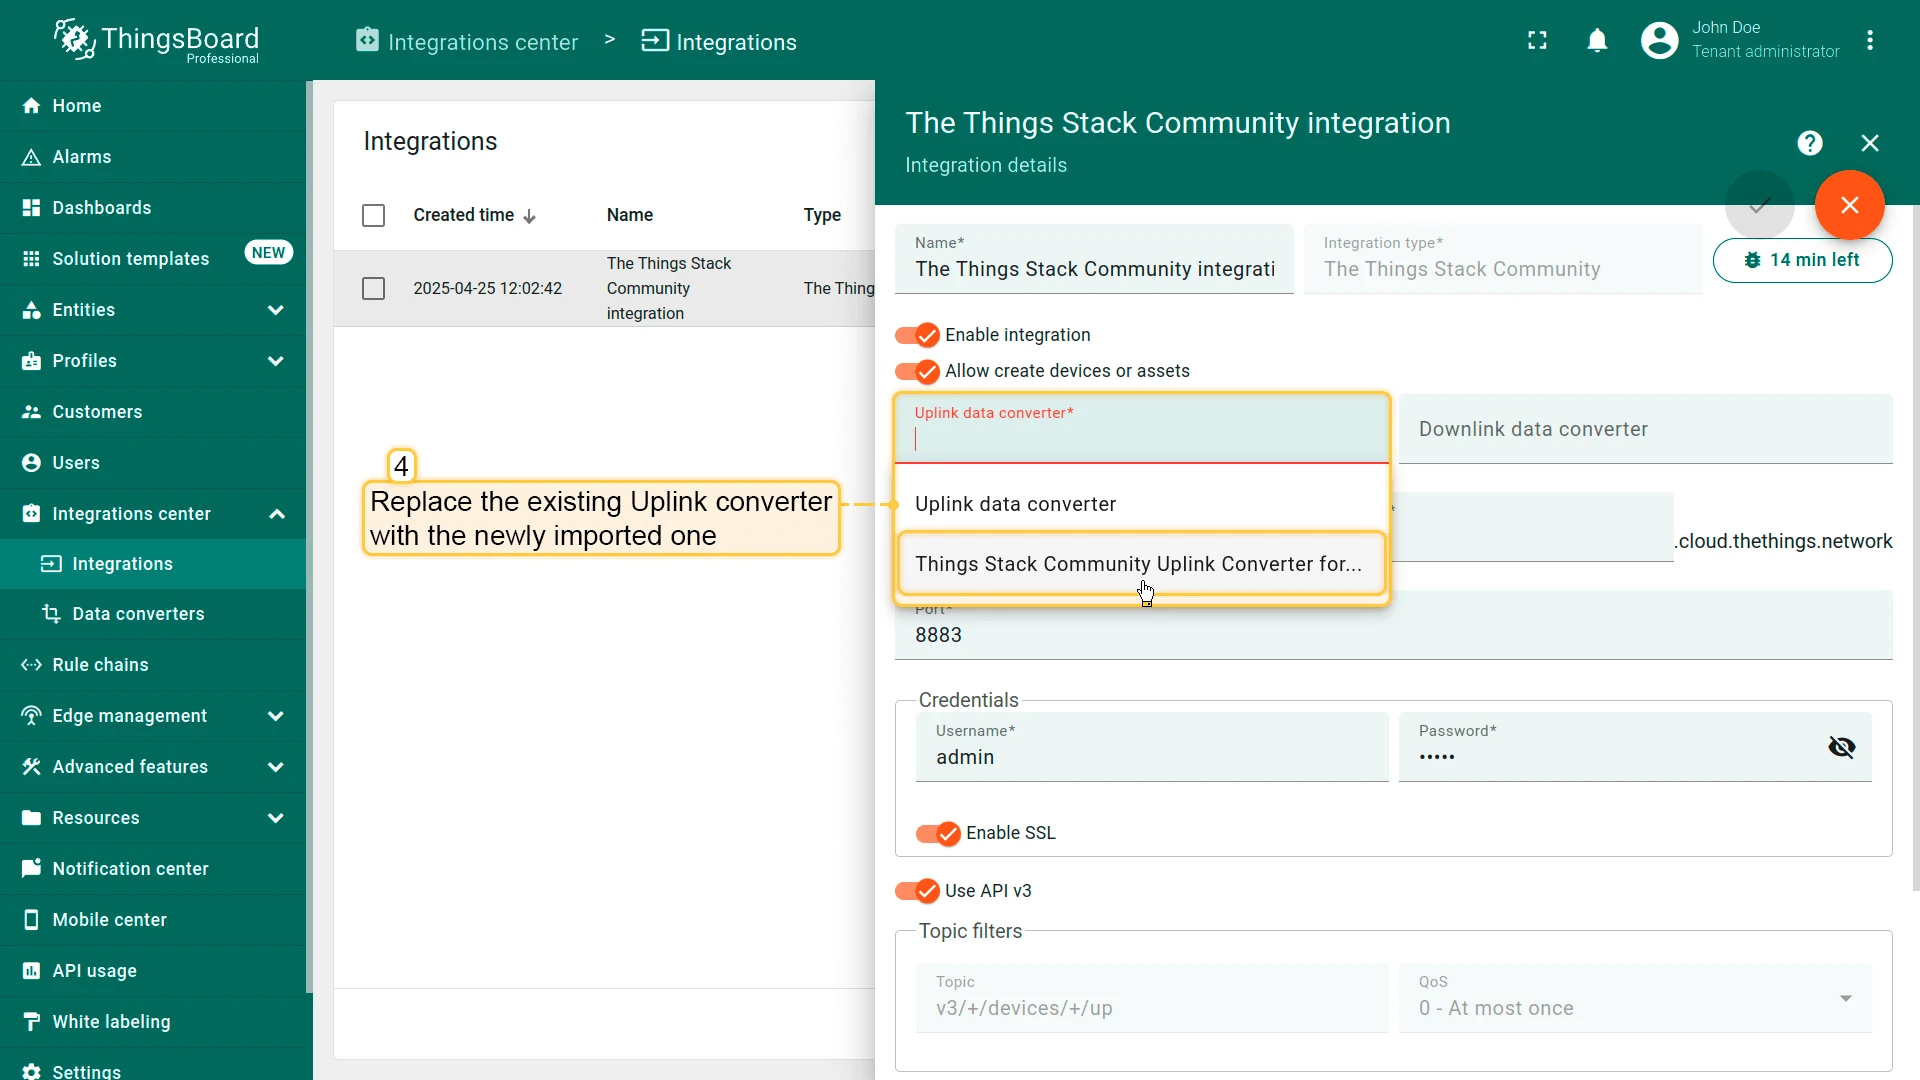
- Replace the existing uplink converter with the imported one.
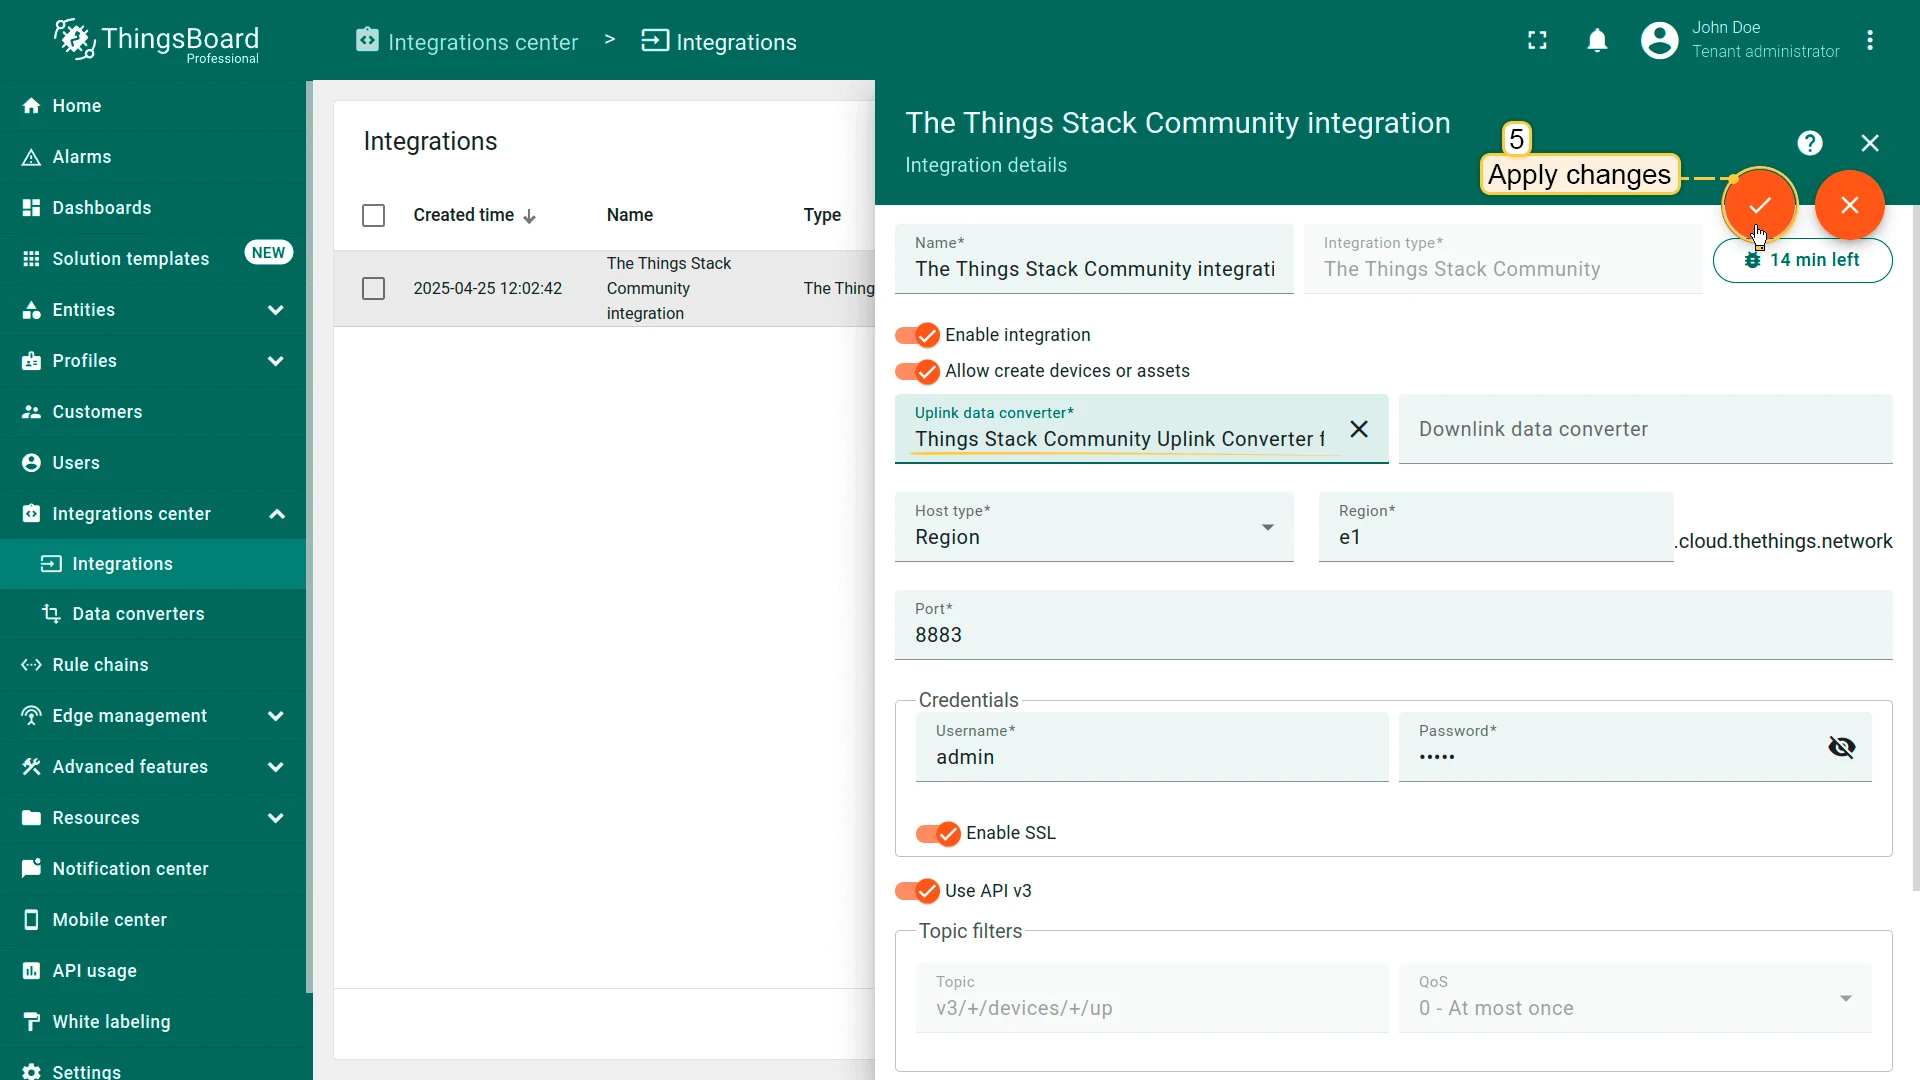
- Don’t forget to save your changes!
Add a device on The Things Industries
We need to add a device on The Things Industries cloud.
To add a device, you can follow next steps:
- Login to the cloud and open your console.
- Go to the Applications page. Then select your application and click on its name.
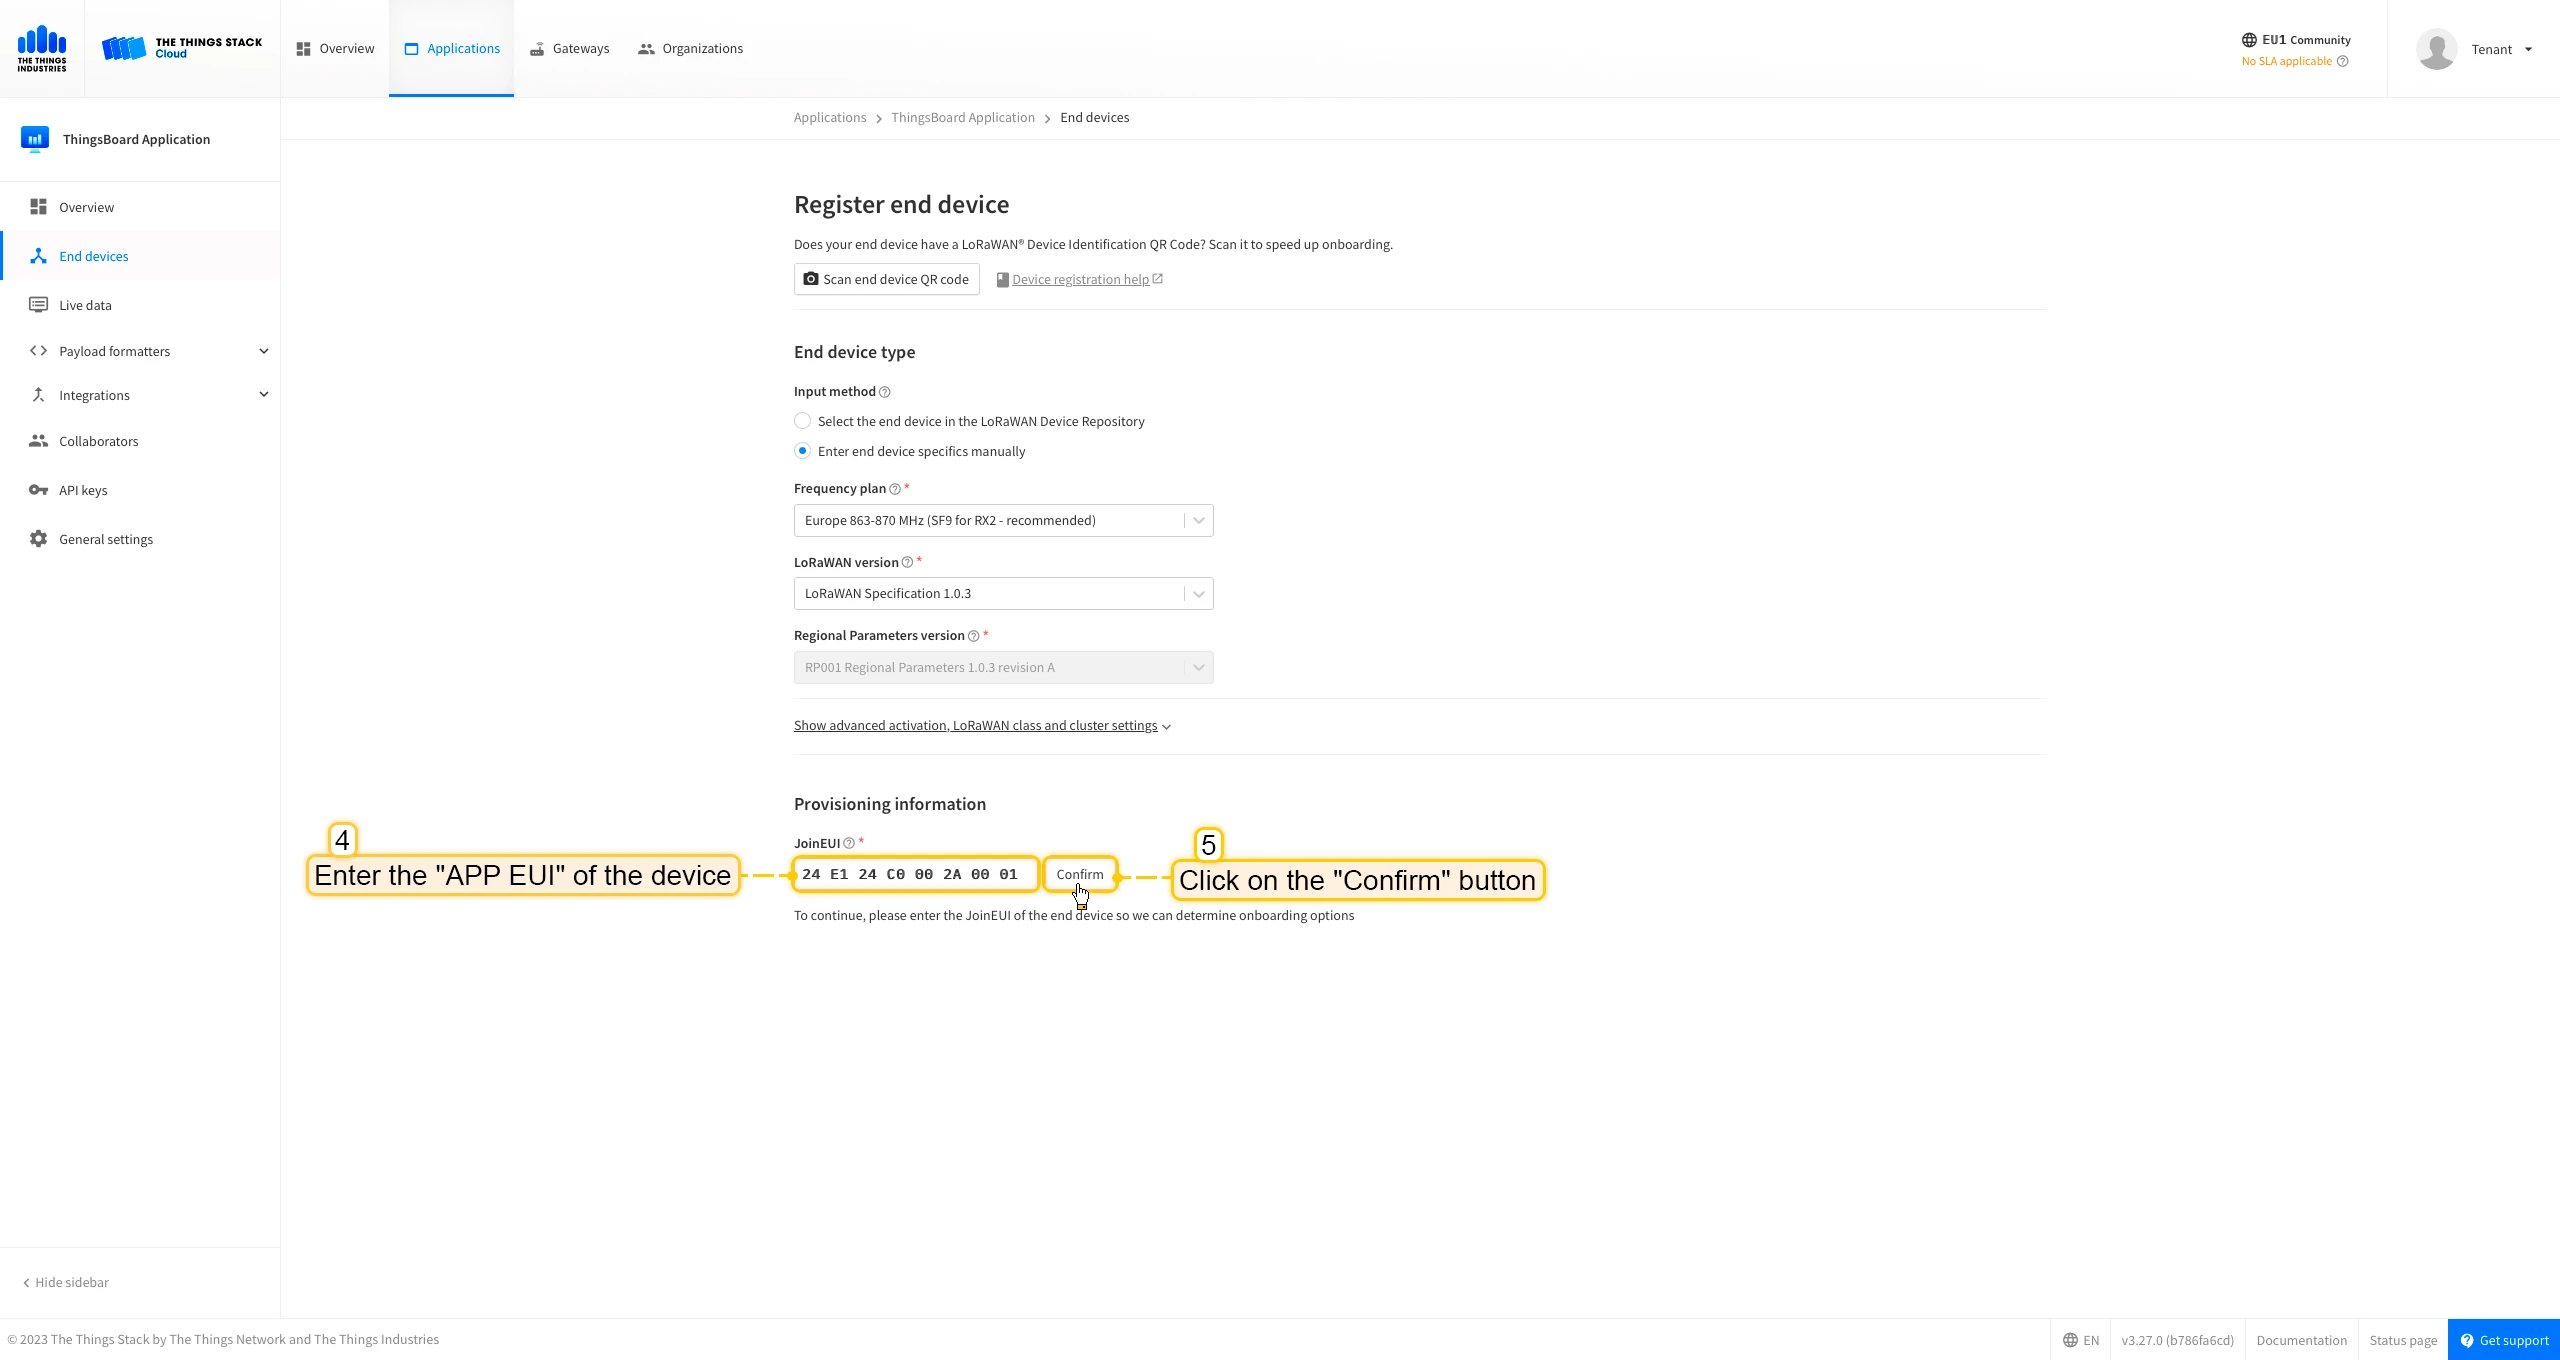
- Click on the Register end device button.
- Put the APP EUI value to the JoinEUI field. Press the Confirm button.
- Fill the rest parameters and press Register end device button.


Uplink converter in ThingsBoard integration
Step 1: Download the JSON fileDownload the JSON file with the uplink converter settings by clicking the button below.
Download uplink converter for The Things Industries integration.
Step 2: Import the Uplink converter into ThingsBoard
After downloading the file with the Uplink converter configuration, import it into ThingsBoard:
- Navigate to the “Data converters” page in the “Integration center” section.
- Click the ”+” icon in the top-right corner of the page and select “Import converter” from the drop-down menu.
- Drag and drop the downloaded JSON file (containing the uplink converter configuration) into the import window, then click “Import”.
- The uplink converter is now successfully imported.

Step 3: Replace the Uplink converter in the The Things Industries integration
Now, let’s update your The Things Industries integration to use the new uplink converter:
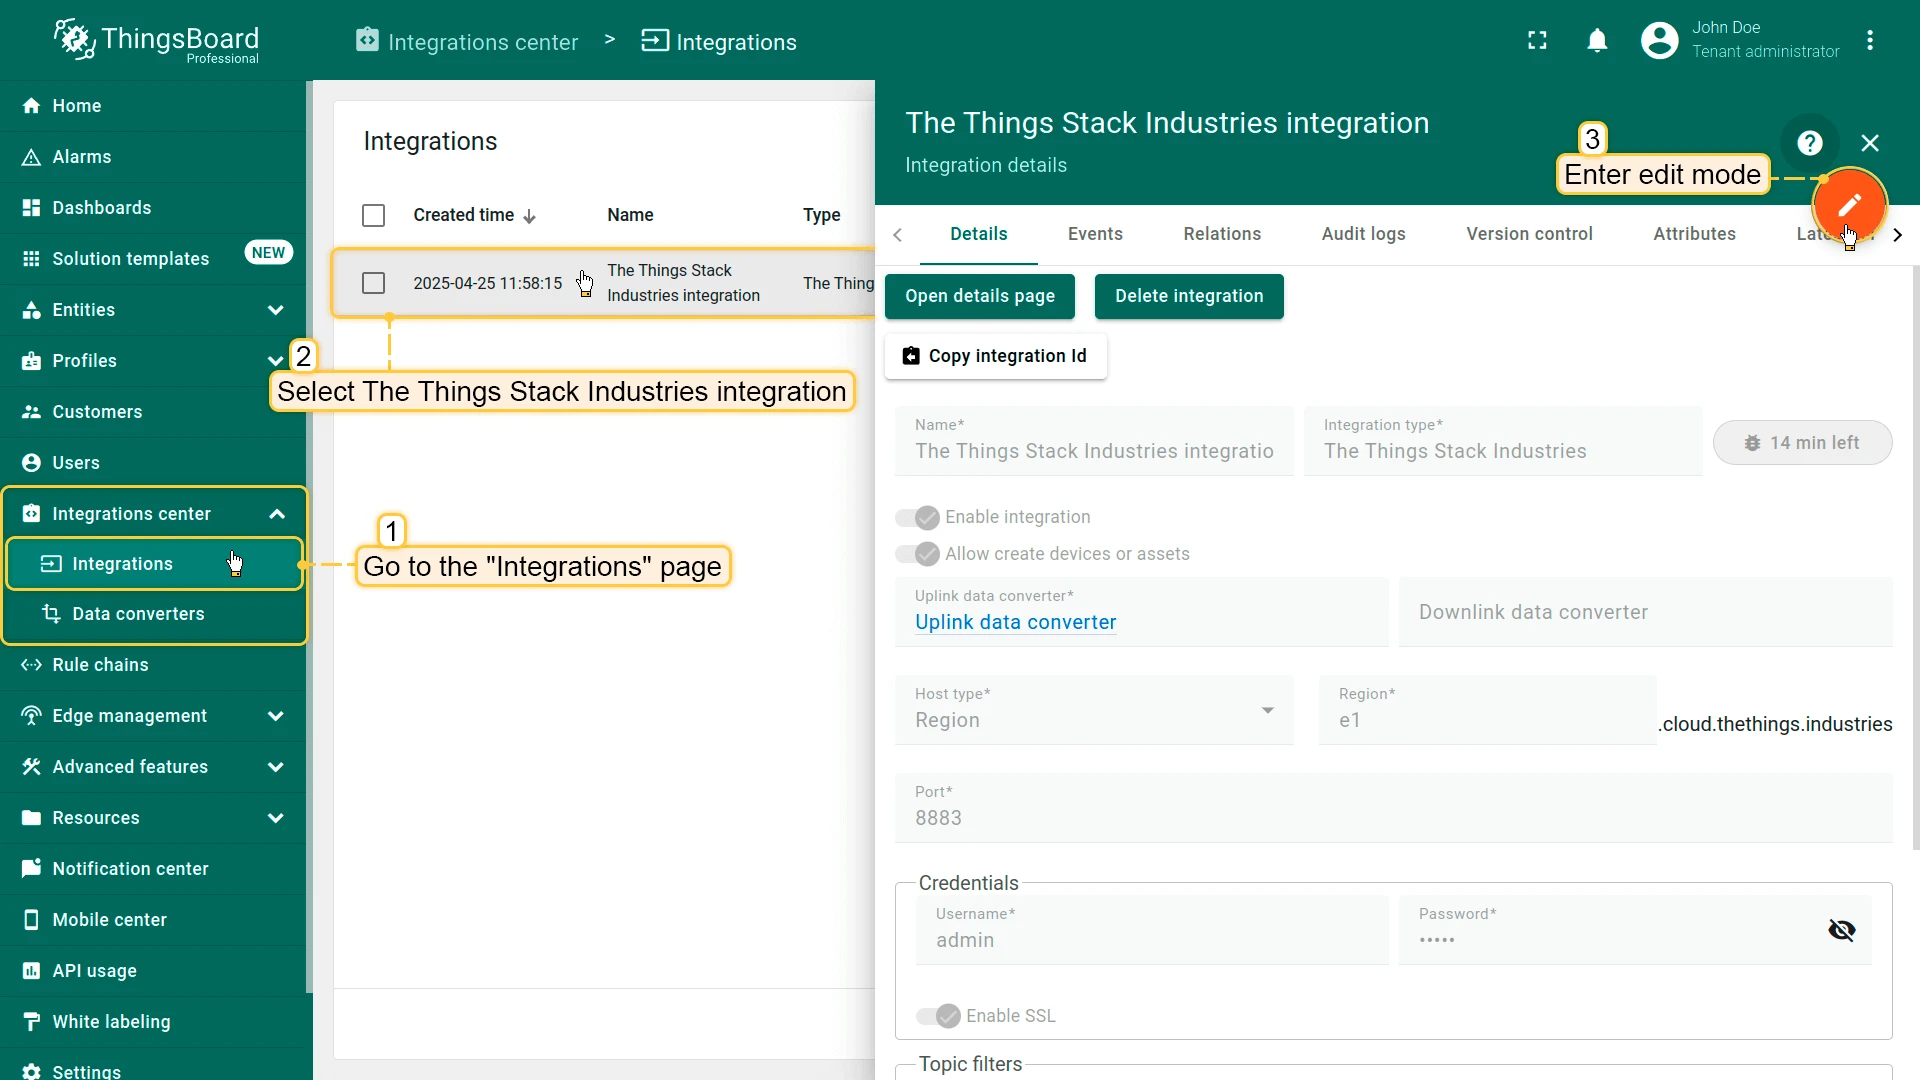
- Go to the “Integrations” page in the “Integration center” section.
- Click on your The Things Industries integration to open its details window.
- Enter edit mode by clicking the orange pencil button in the top-right corner.
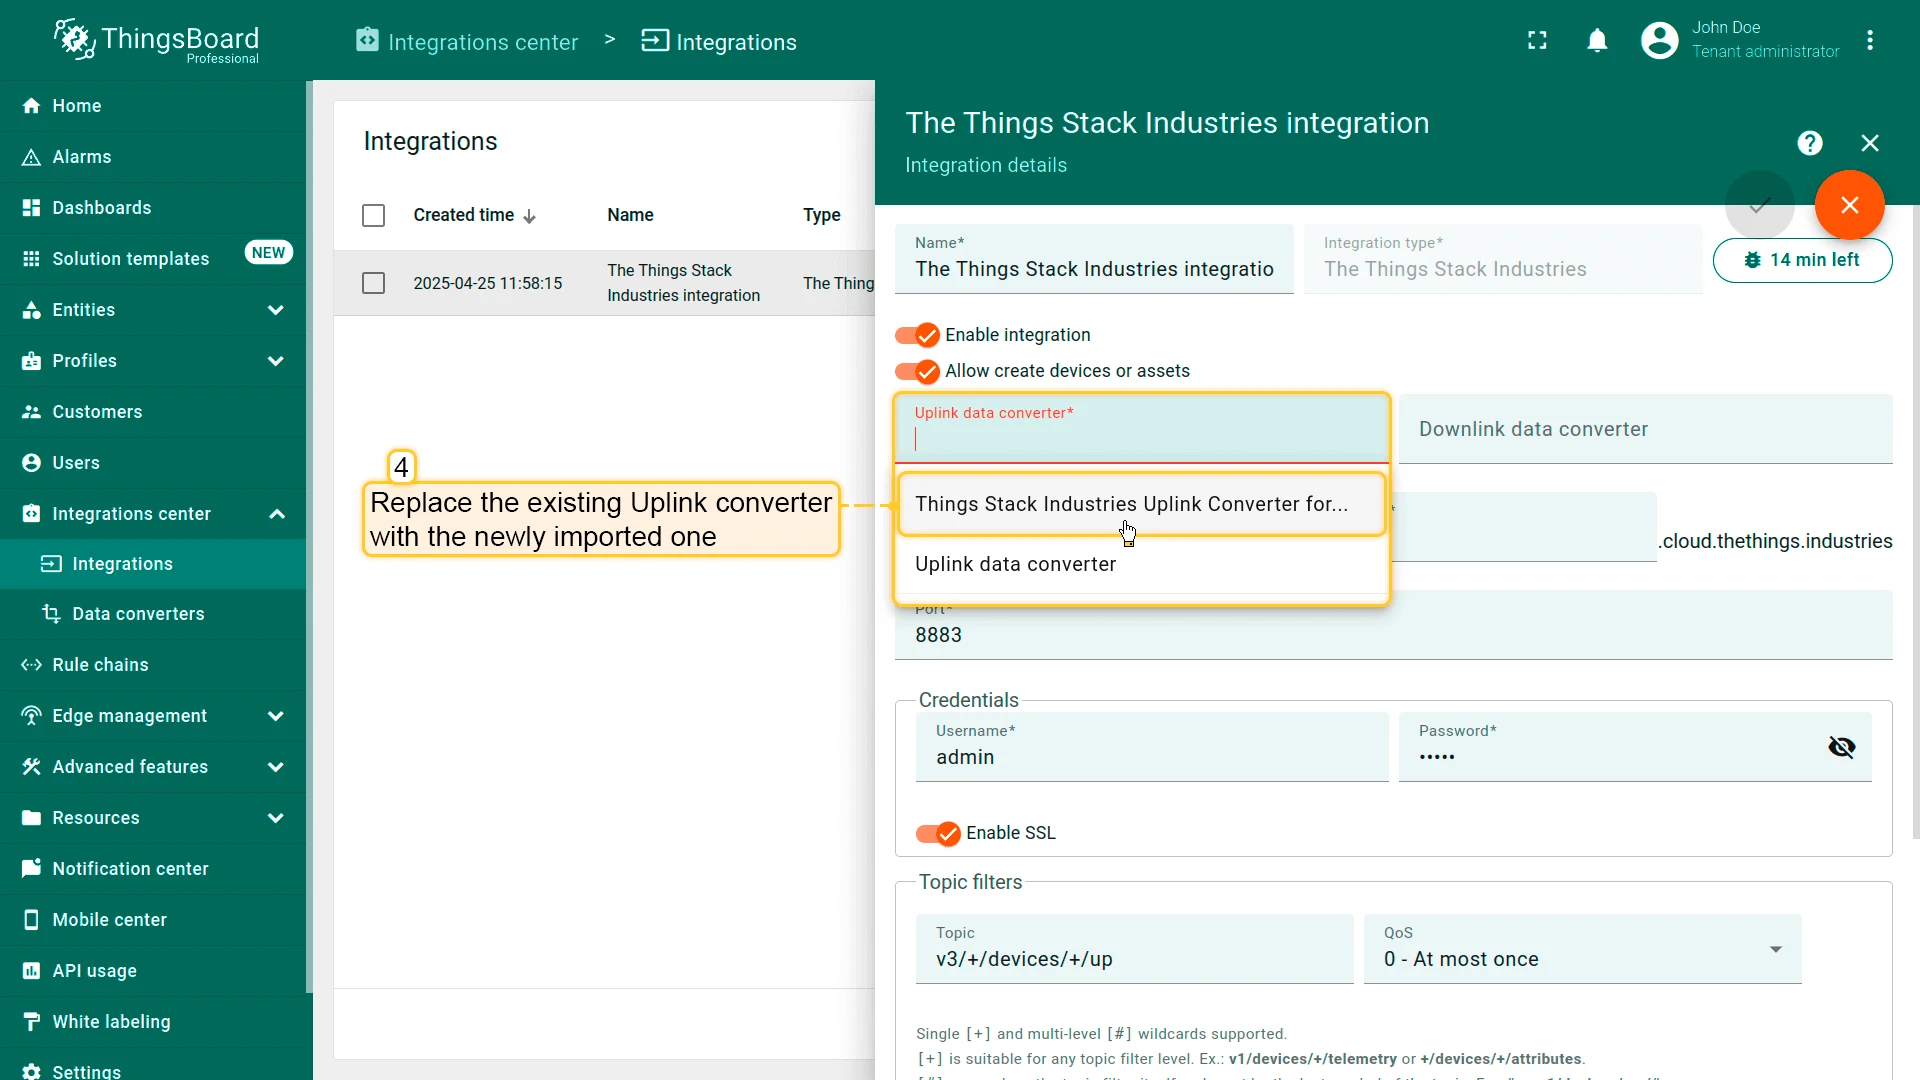
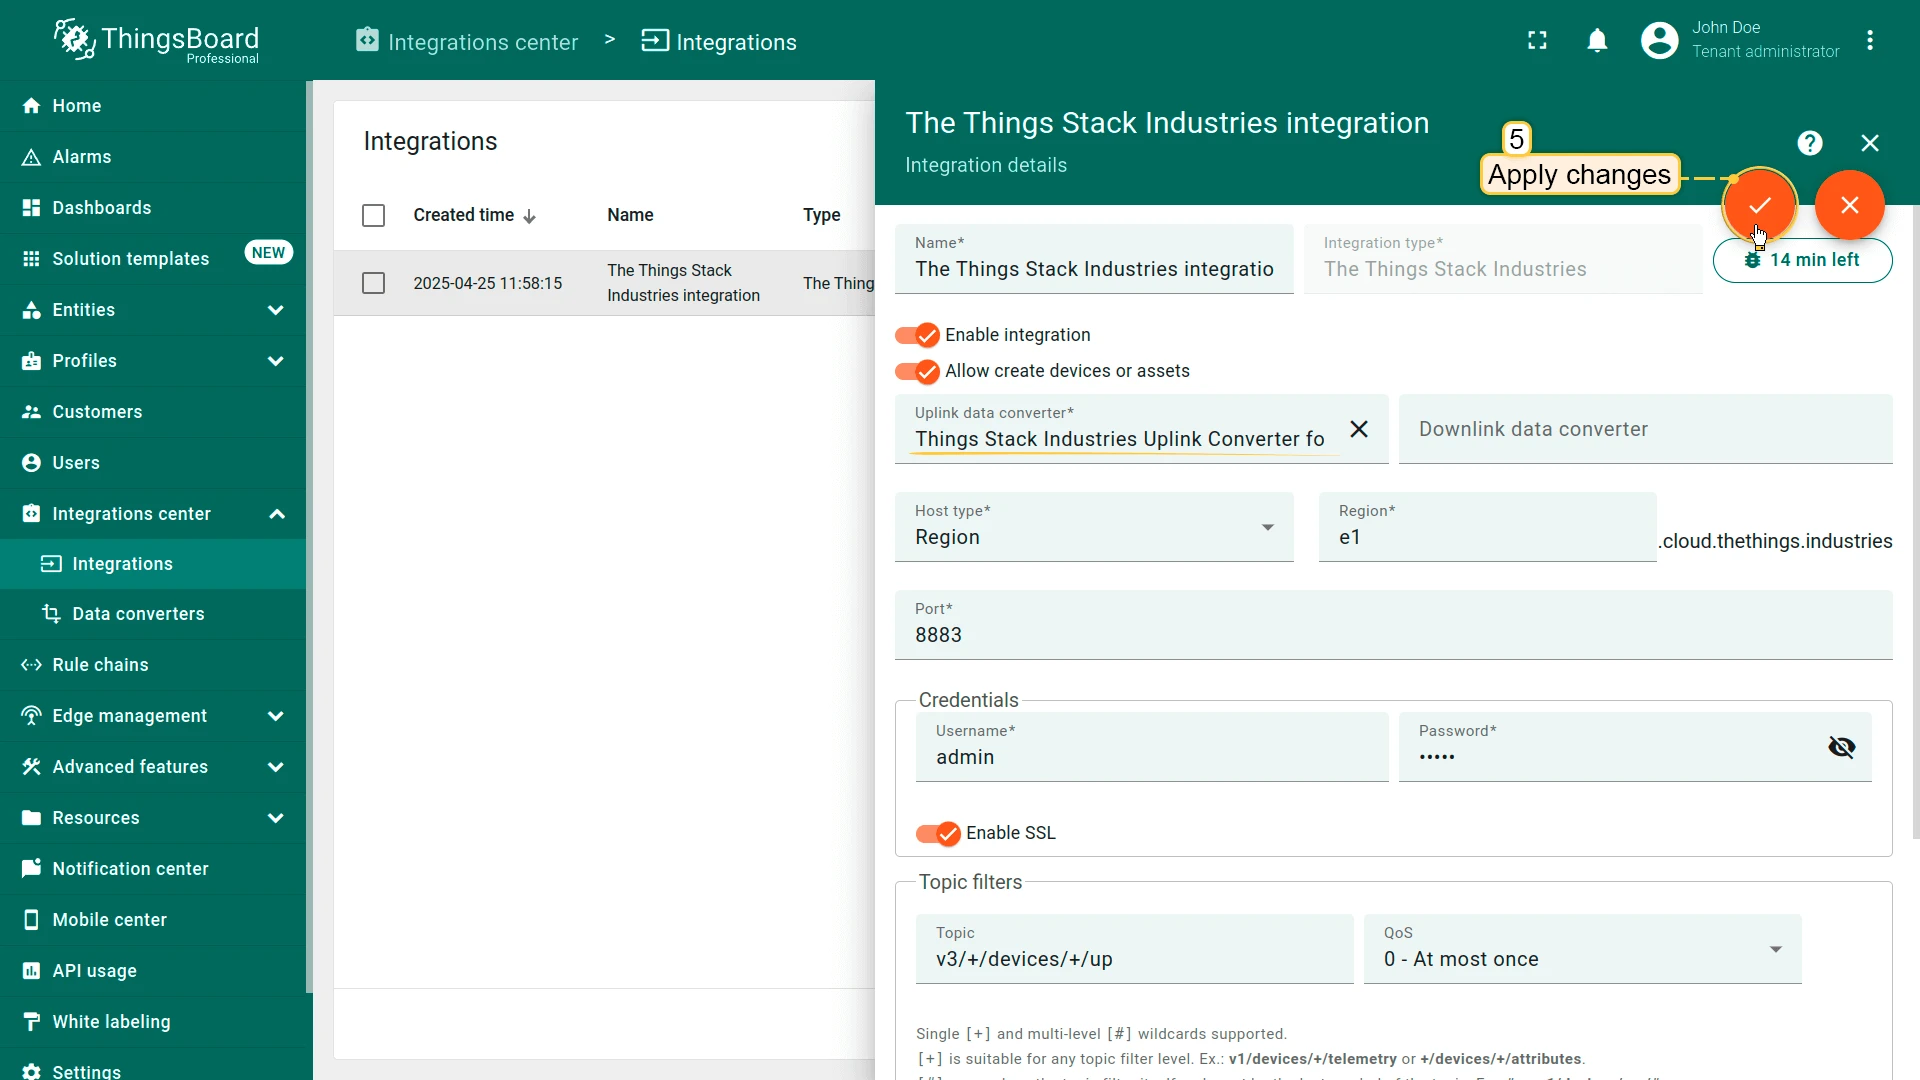
- Replace the existing uplink converter with the imported one.
- Don’t forget to save your changes!
Add a device on the Loriot
We need to add a device on the Loriot.
To add a device, you can follow next steps:
- Login to Loriot server. We use eu2.loriot.io, but it depends on chosen region during registration.
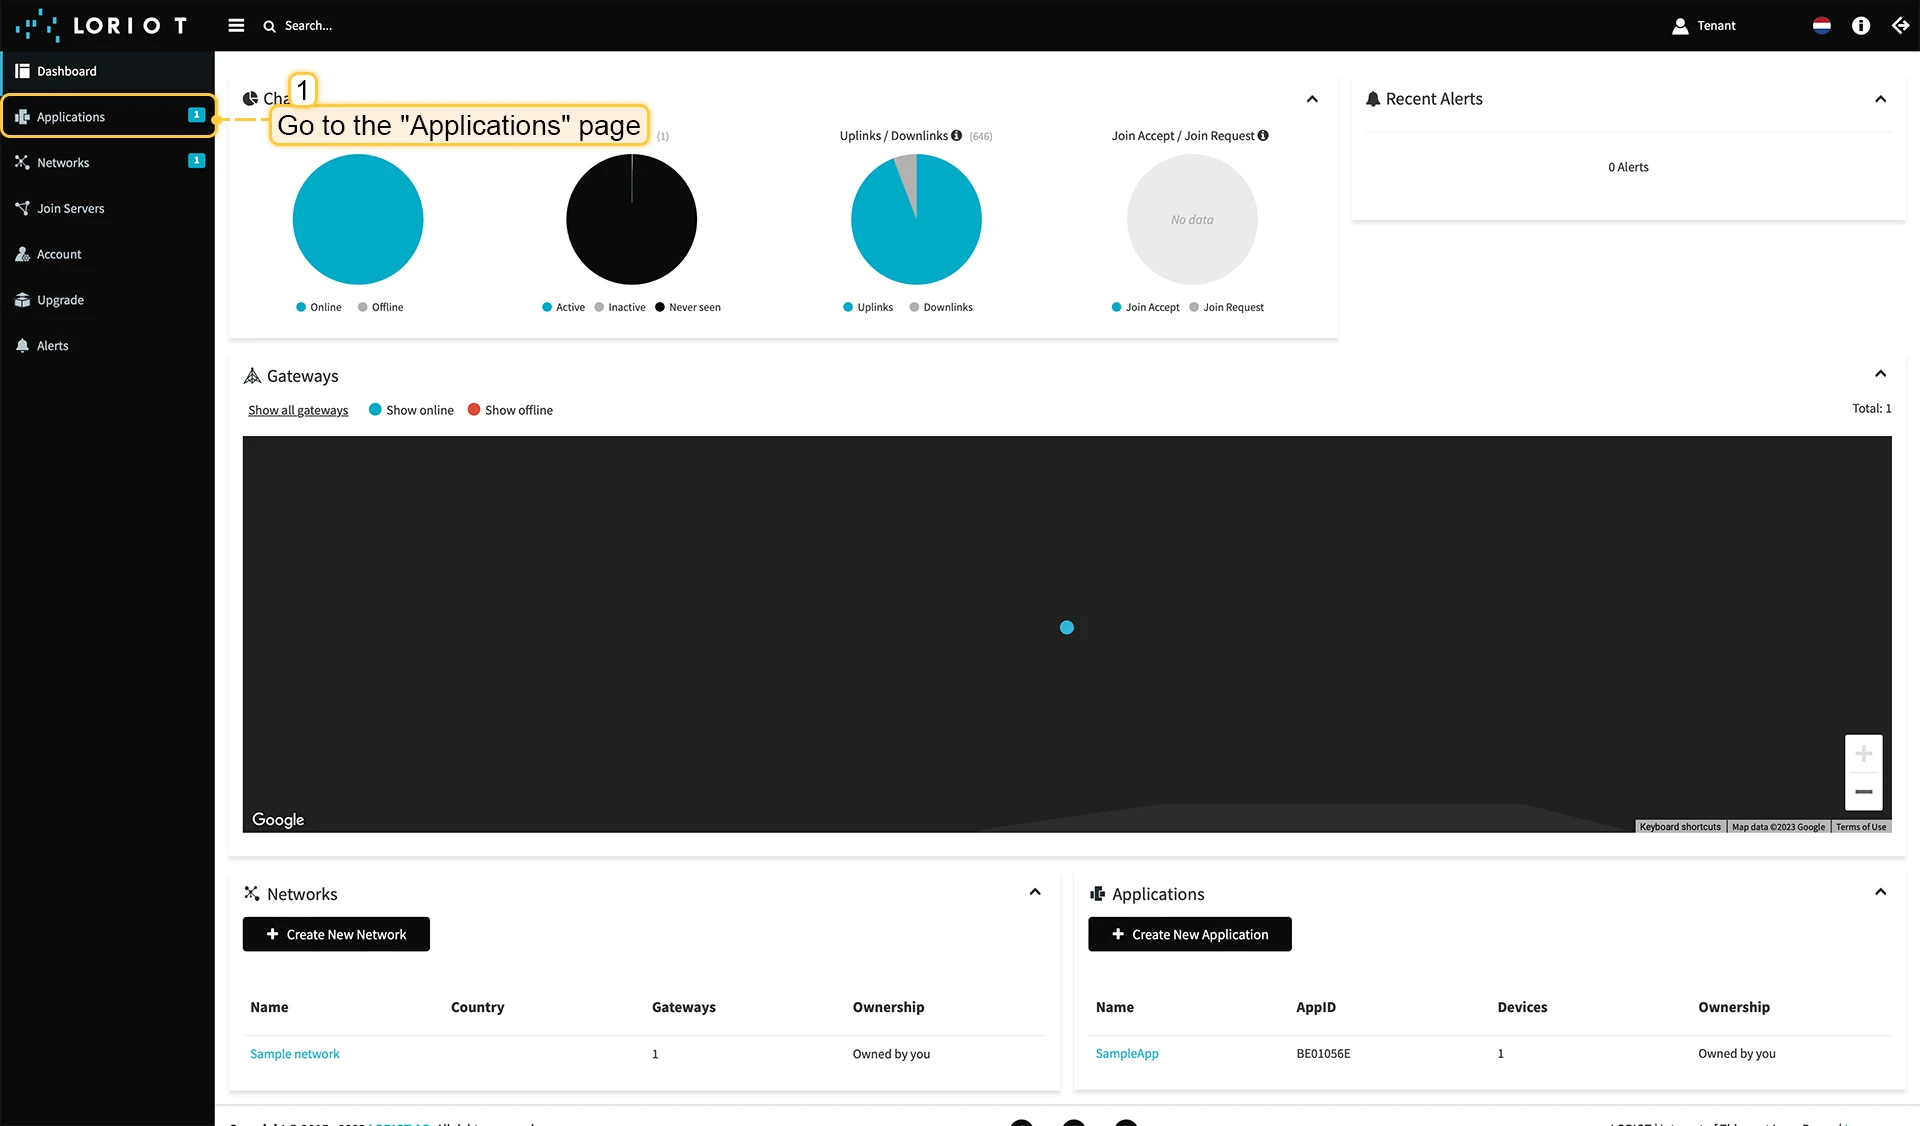
- Go to the “Applications” page in left menu.
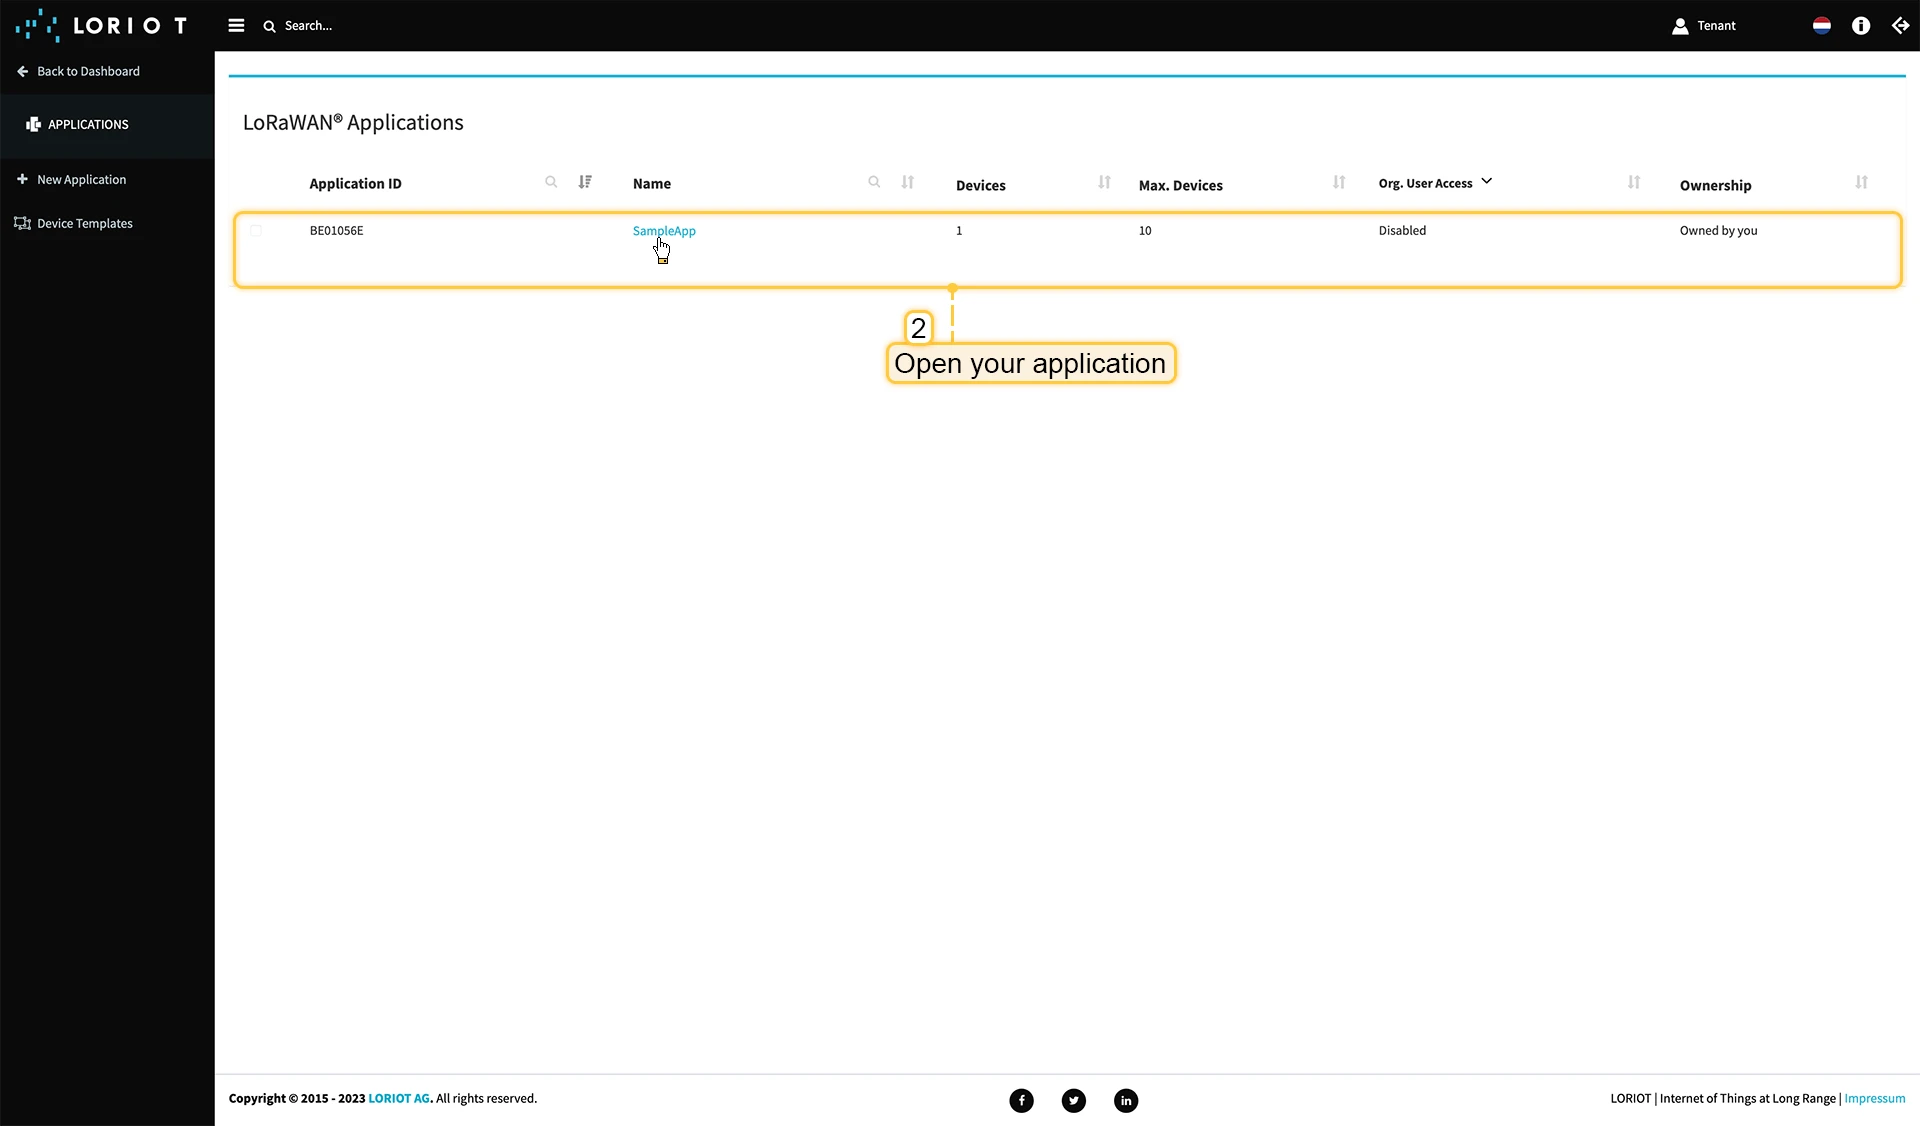
- Open your application, in our case it is “SampleApp”.
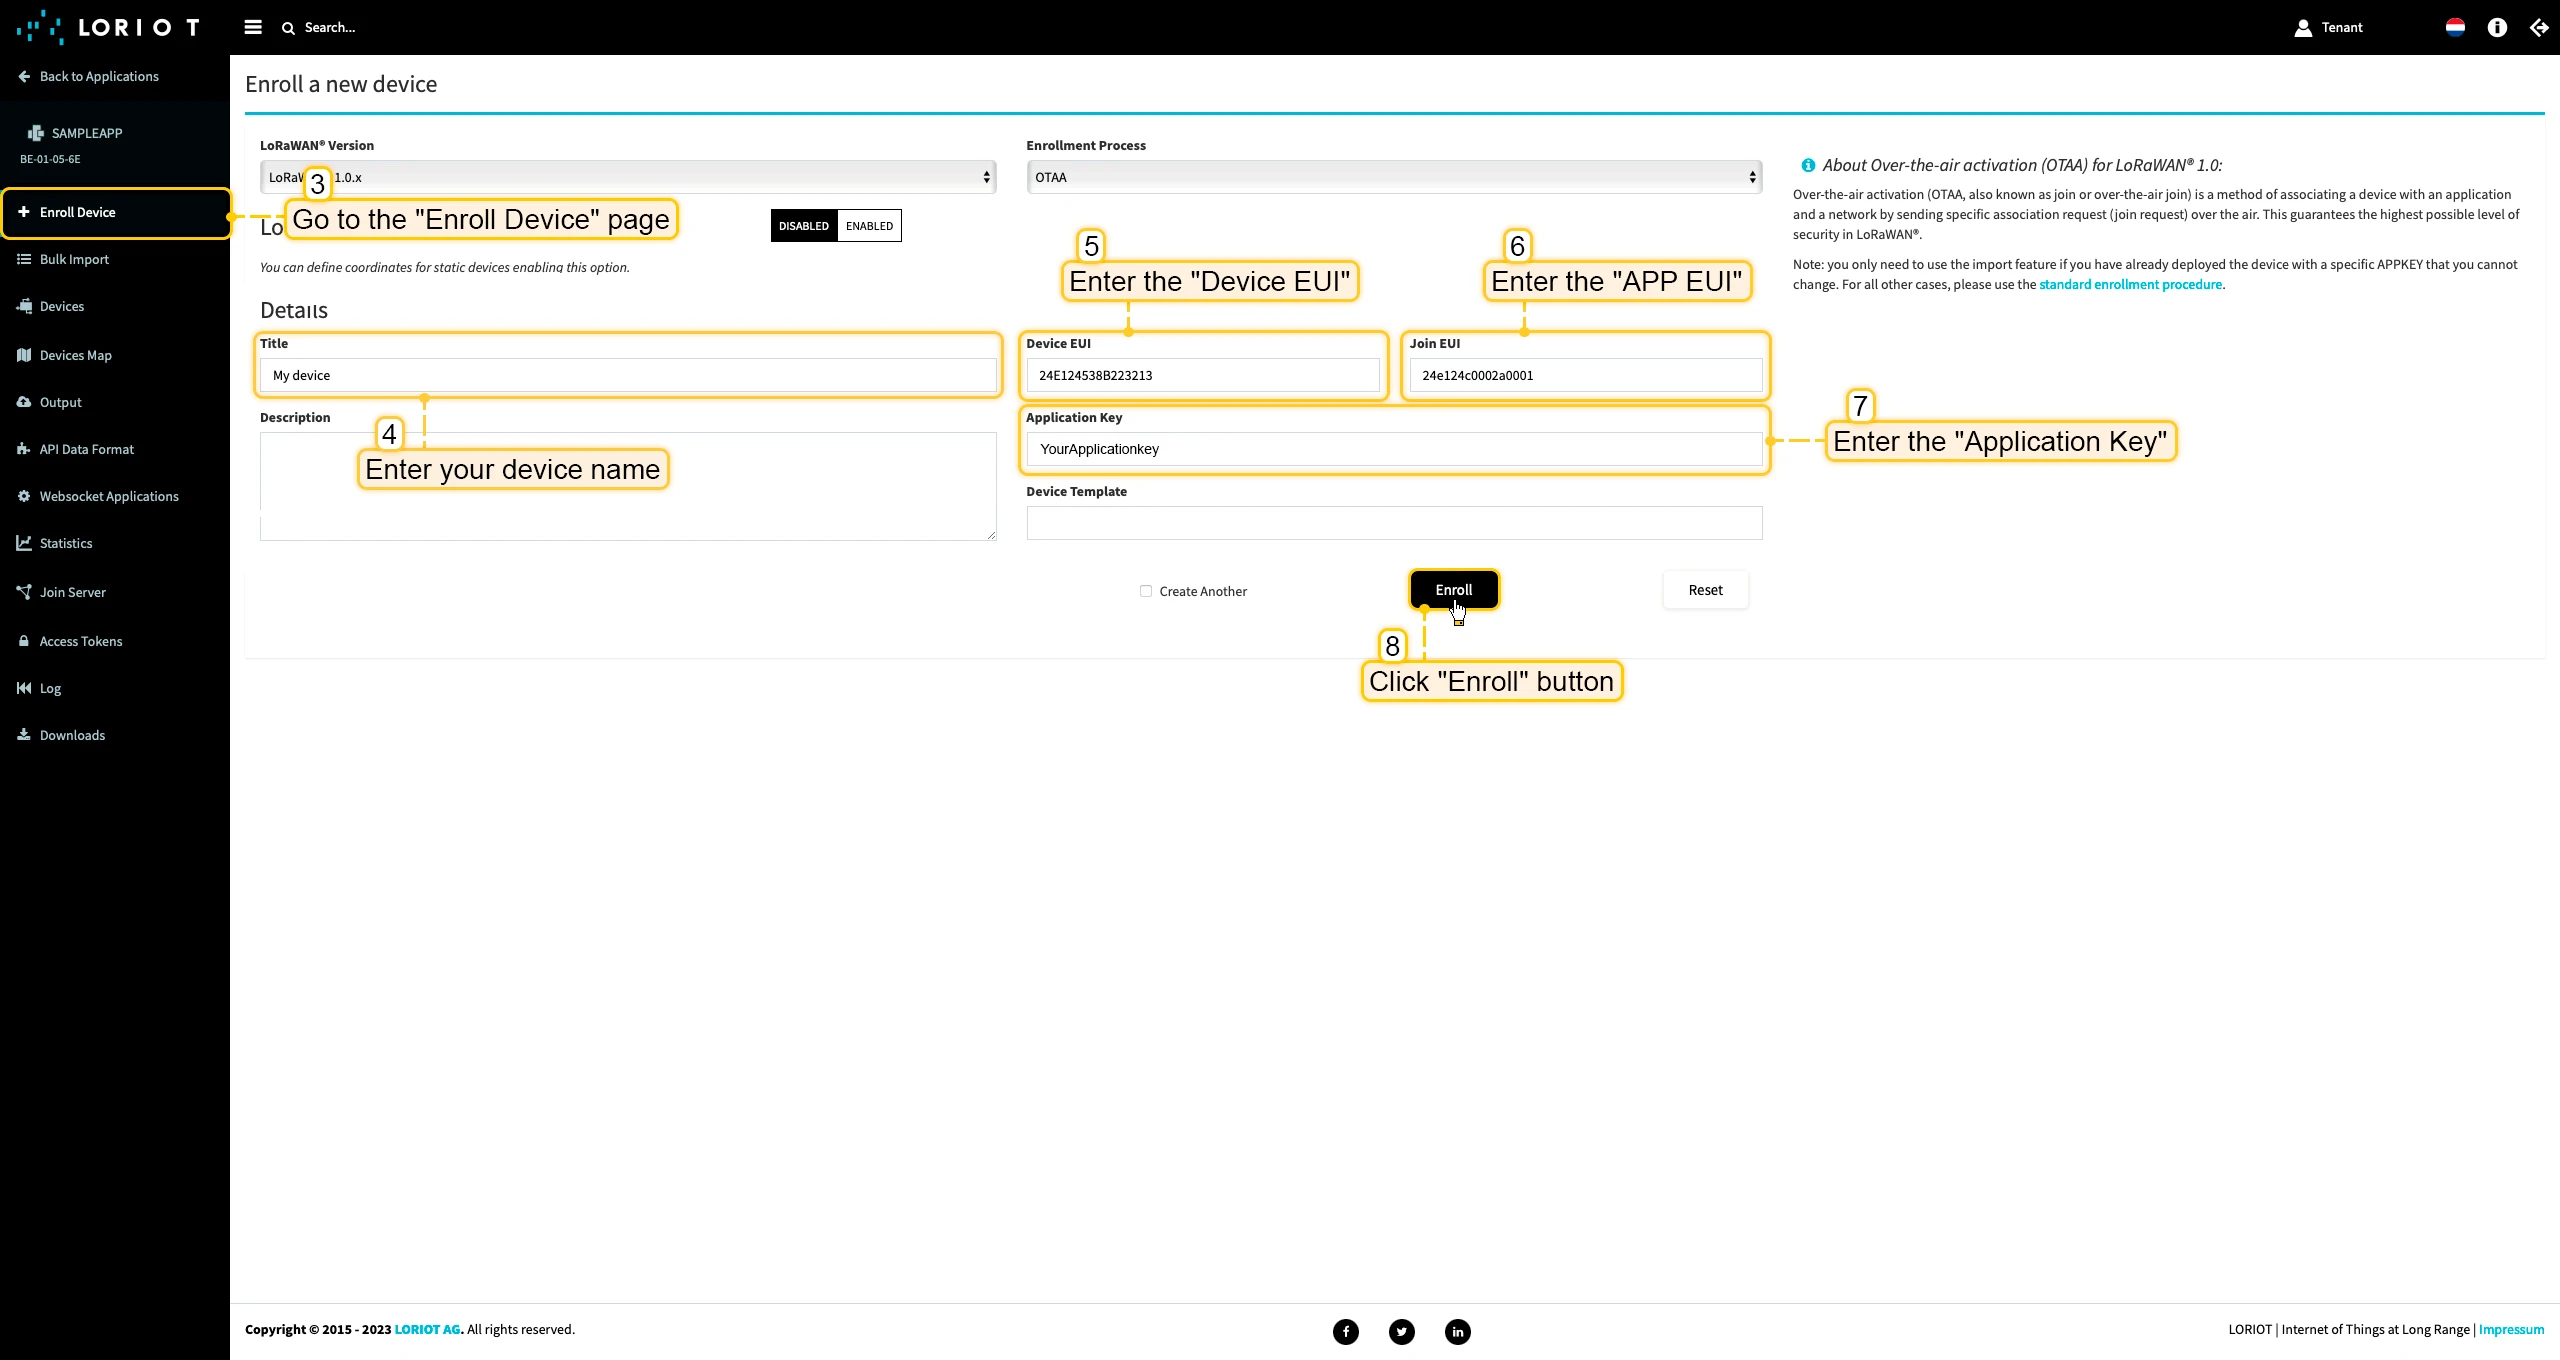
- Go to the “Enroll Device” page. Fill in the fields, with a configuration from your device. Then click the “Enroll” button.

Uplink converter in ThingsBoard integration
Step 1: Download the JSON fileDownload the JSON file with the uplink converter settings by clicking the button below.
Download uplink converter for Loriot integration.
Step 2: Import the Uplink converter into ThingsBoard
After downloading the file with the Uplink converter configuration, import it into ThingsBoard:
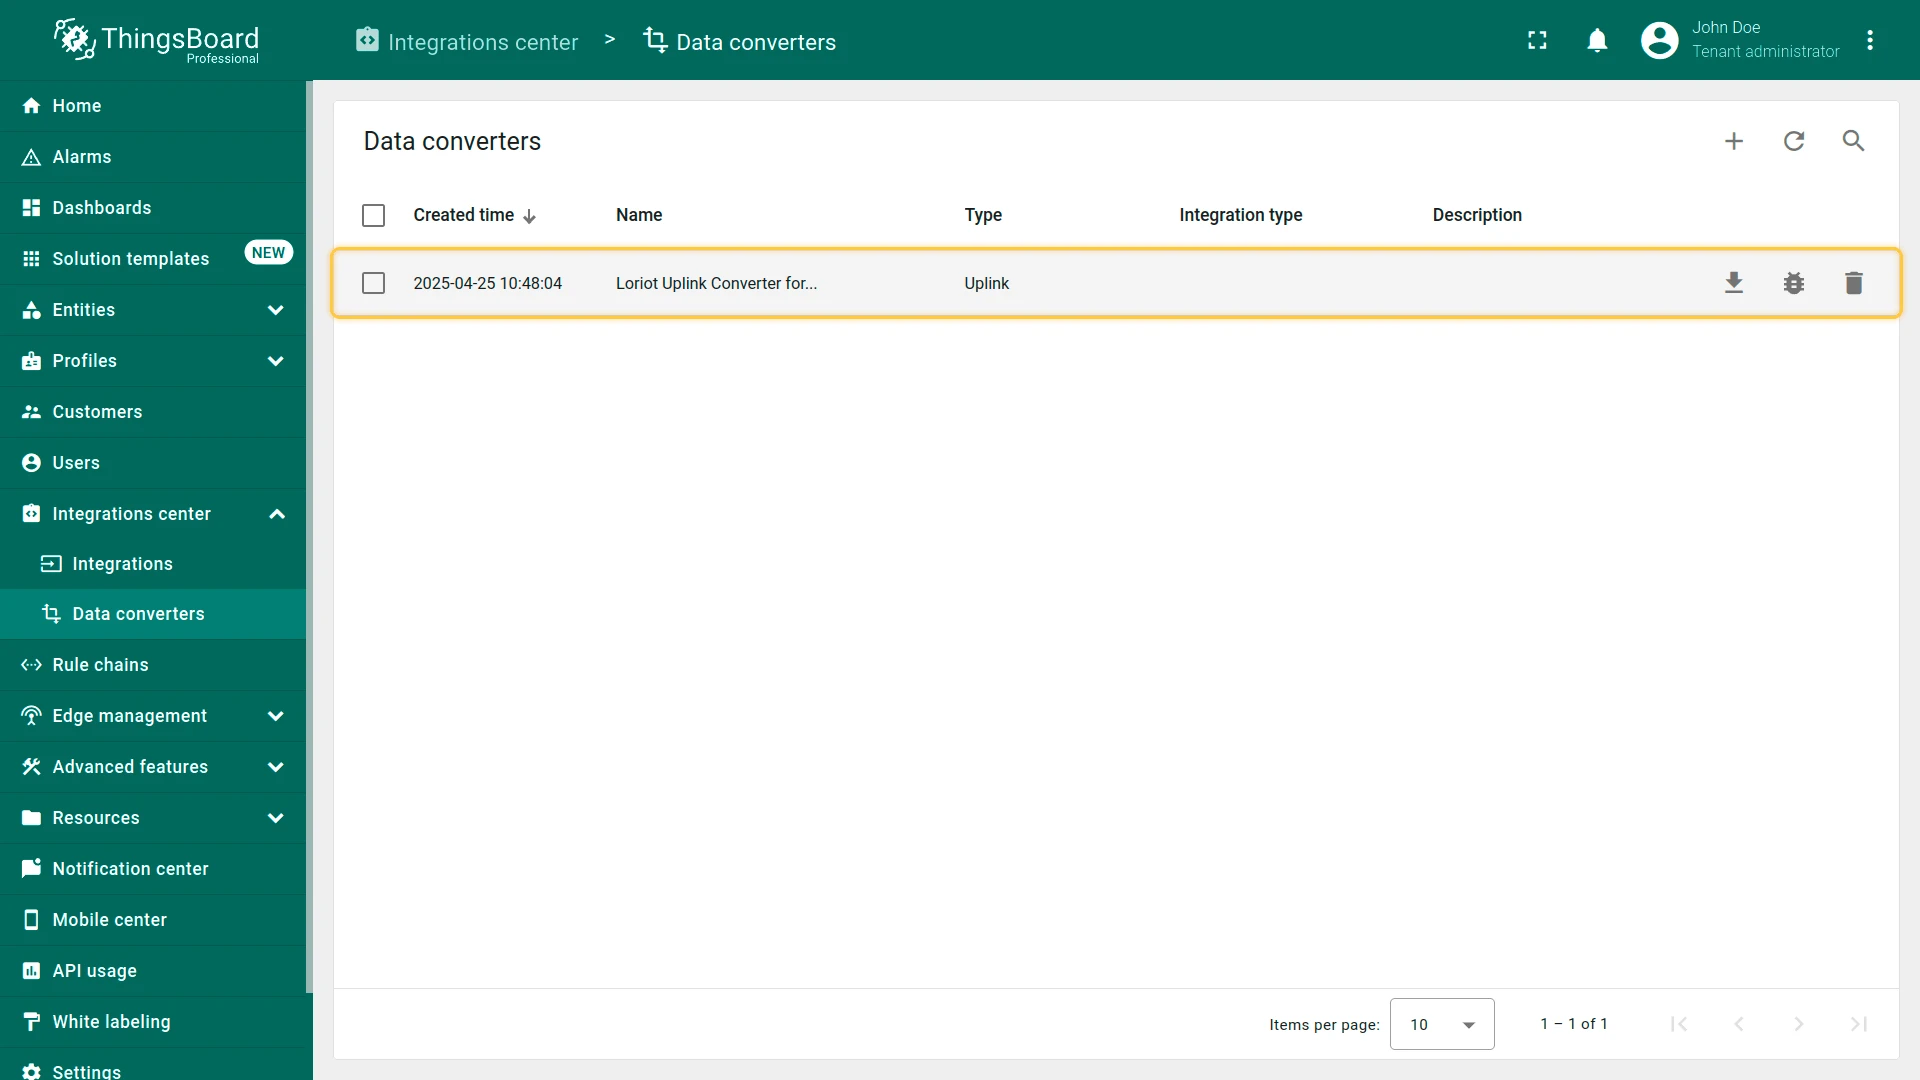
- Navigate to the “Data converters” page in the “Integration center” section.
- Click the ”+” icon in the top-right corner of the page and select “Import converter” from the drop-down menu.
- Drag and drop the downloaded JSON file (containing the uplink converter configuration) into the import window, then click “Import”.
- The uplink converter is now successfully imported.
Step 3: Replace the Uplink converter in the Loriot integration
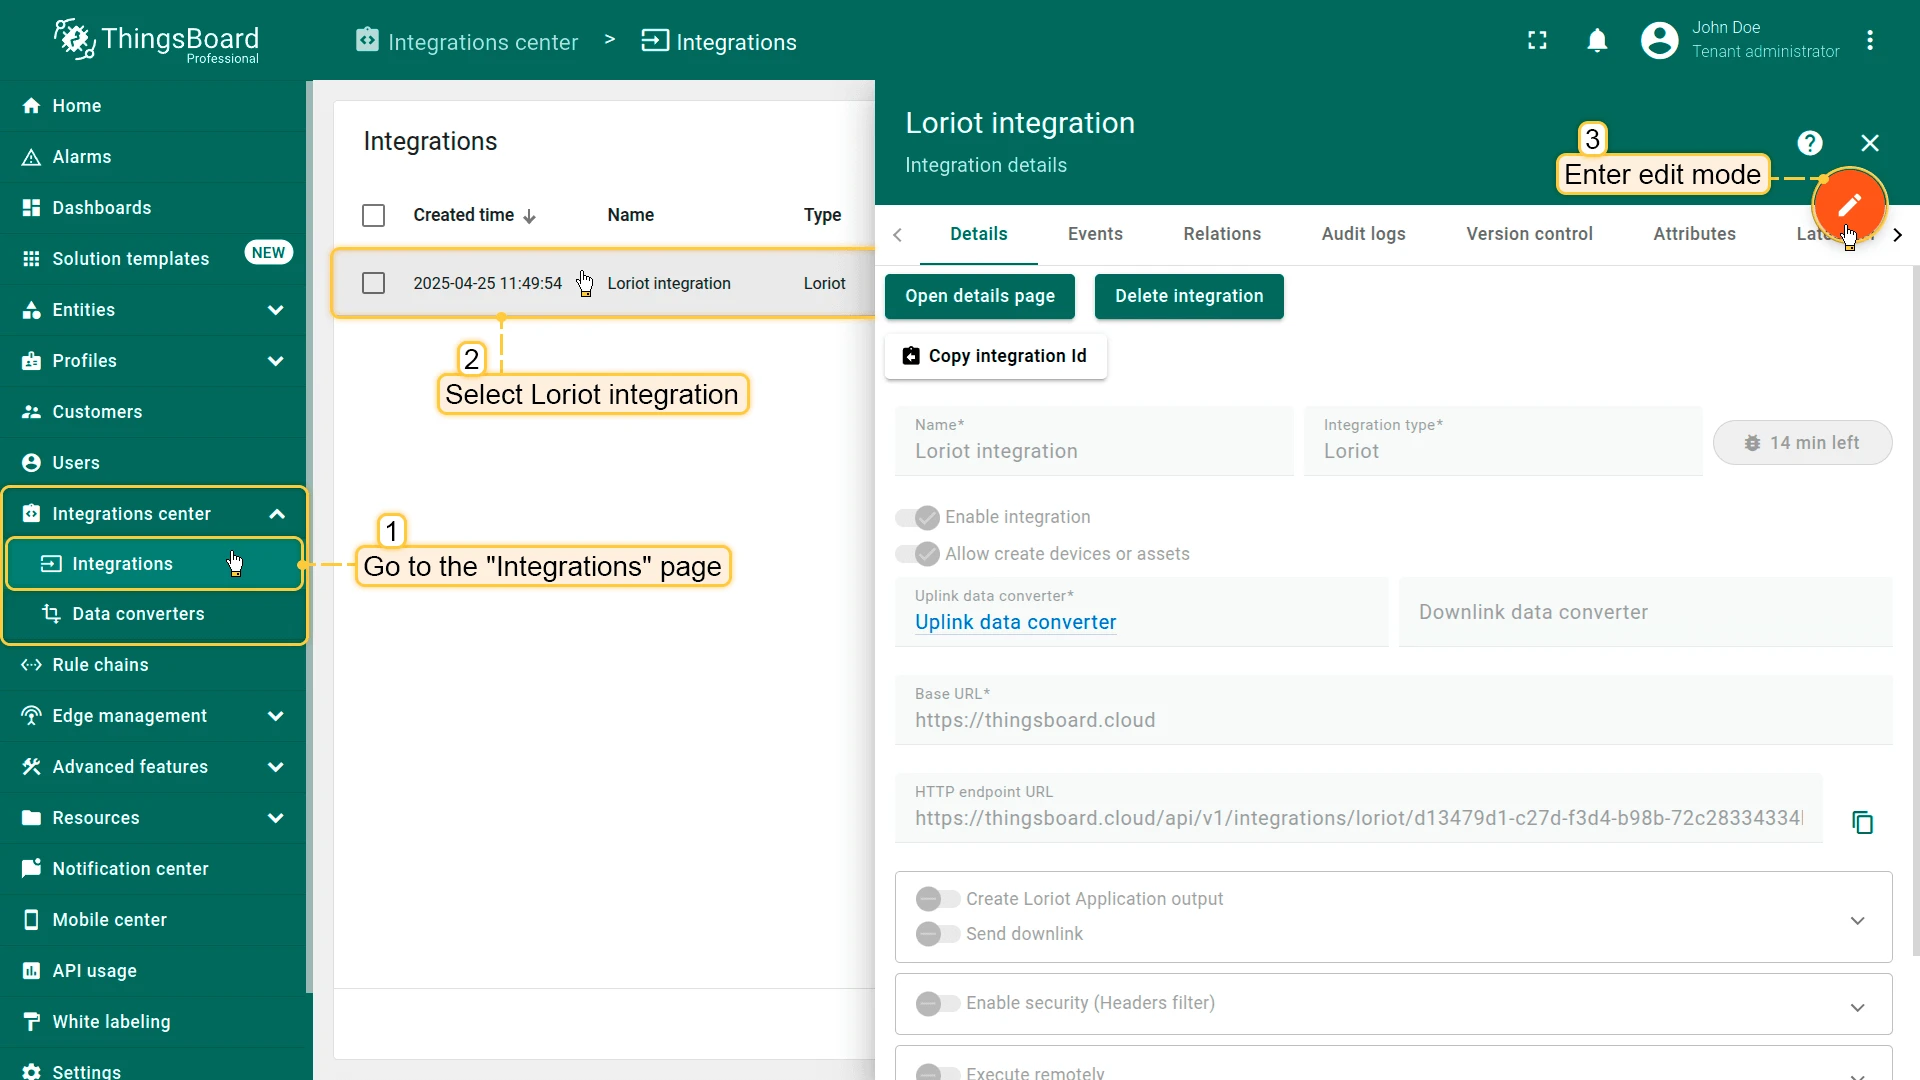
Now, let’s update your Loriot integration to use the new uplink converter:
- Go to the “Integrations” page in the “Integration center” section.
- Click on your Loriot integration to open its details window.
- Enter edit mode by clicking the orange pencil button in the top-right corner.
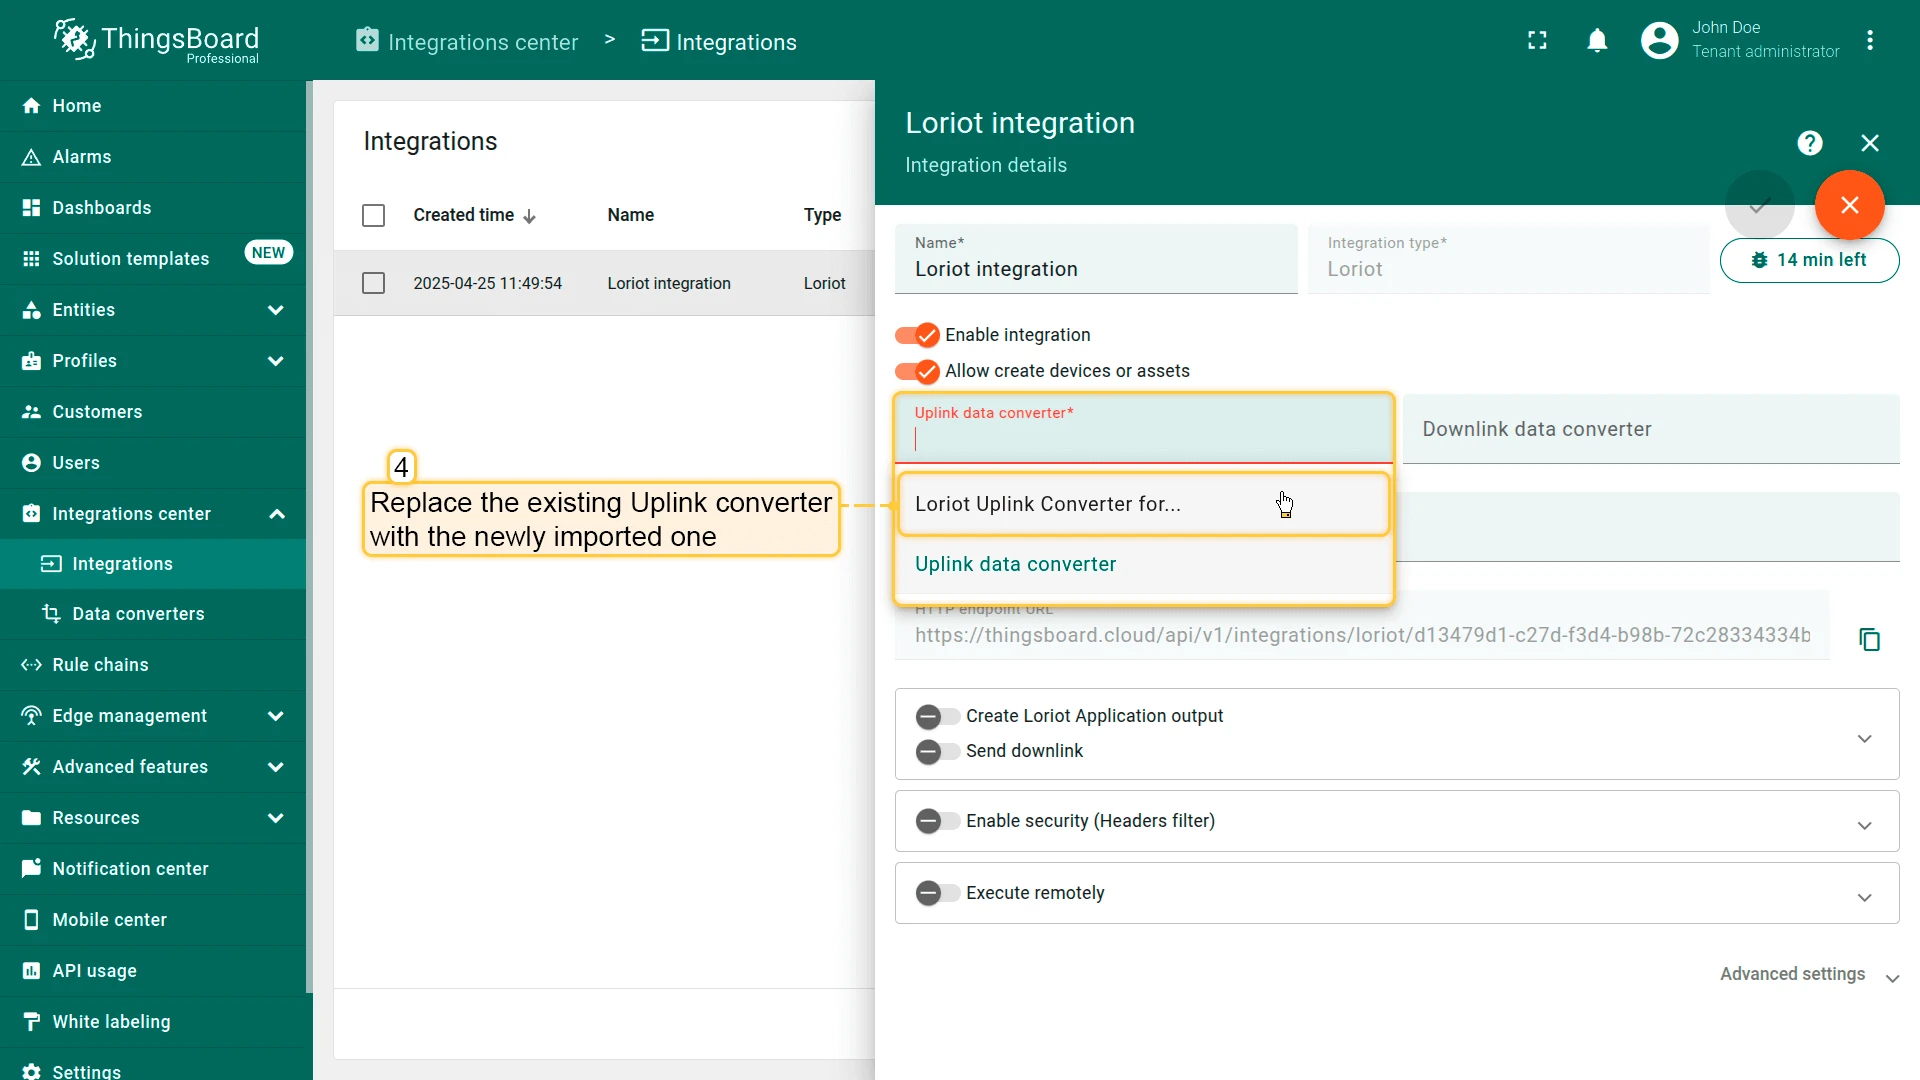
- Replace the existing uplink converter with the imported one.
- Don’t forget to save your changes!

Check data on ThingsBoard
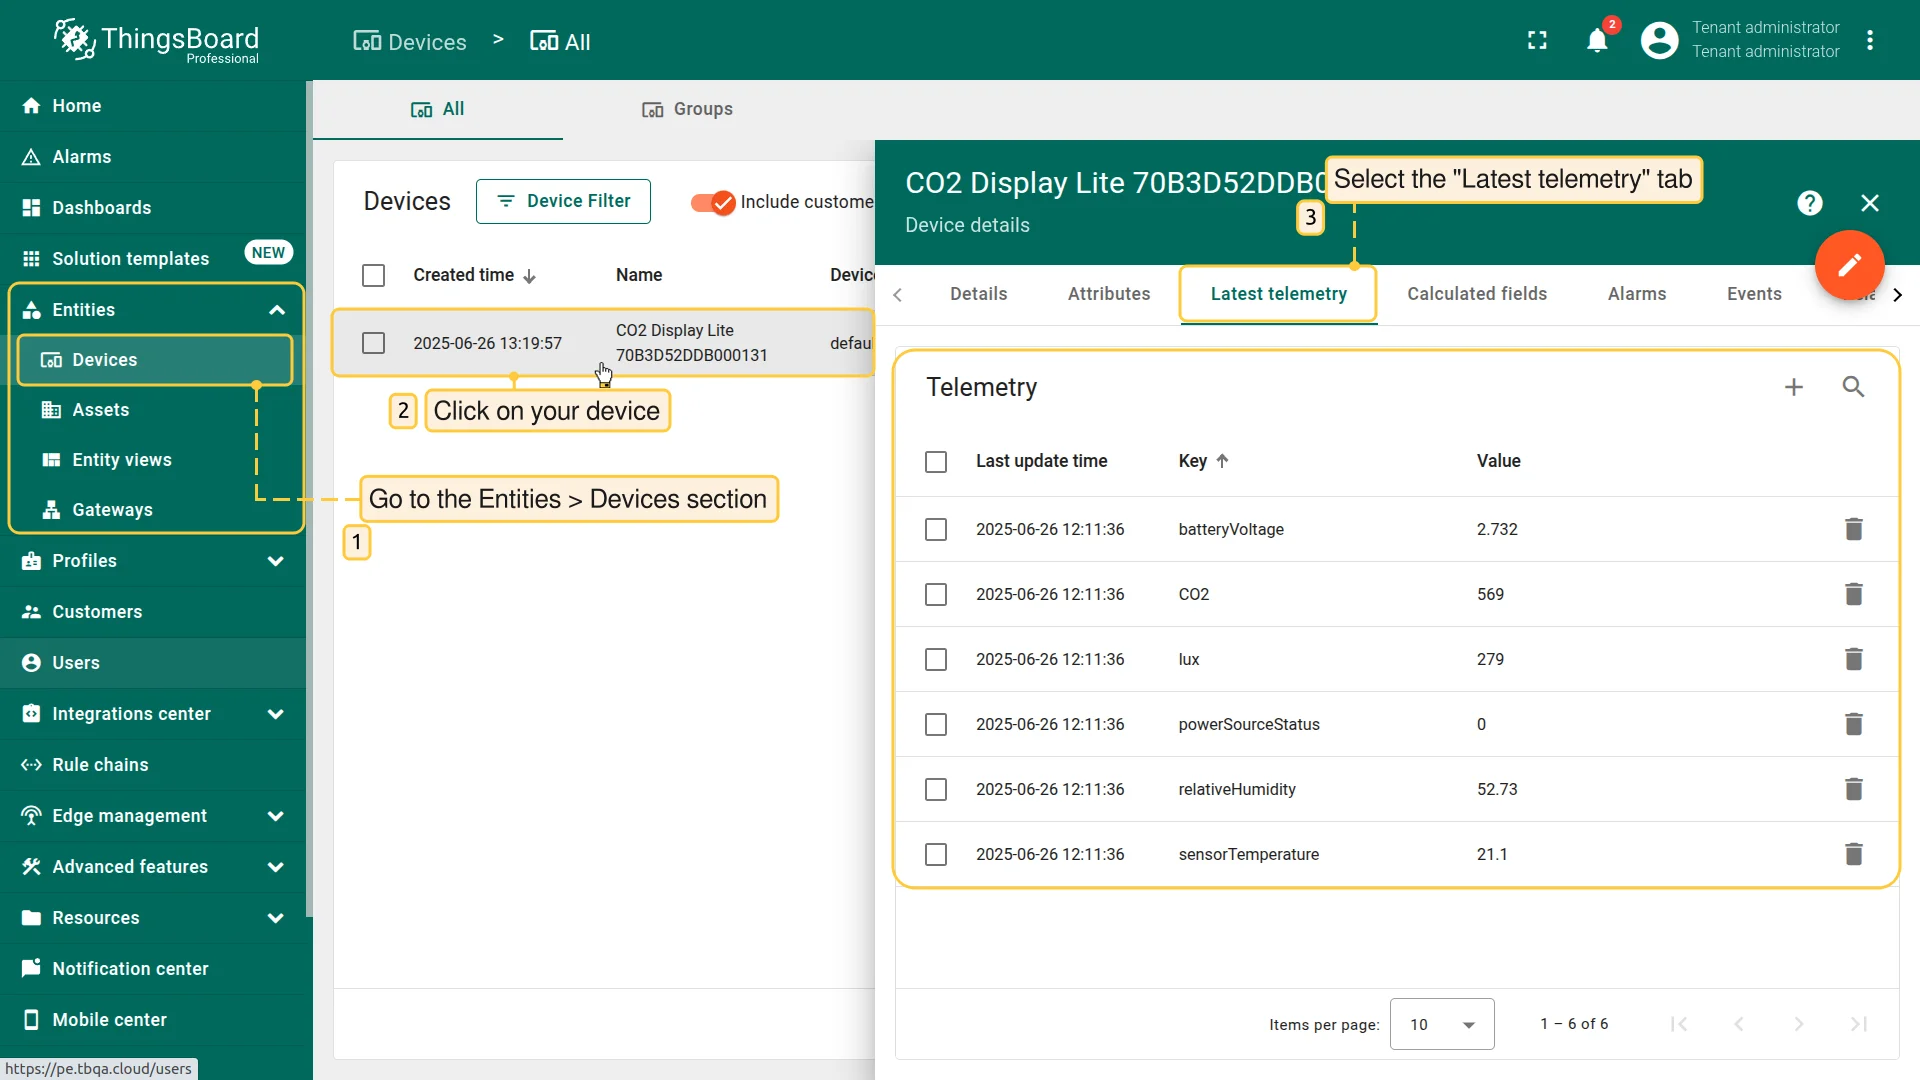
After the device is connected to the network server and ThingsBoard, you can check received and converted data on the platform for this device.
To do this, open Entities menu section and select Devices. Click on the device name to open the device details page. Go to the Latest telemetry tab to see the latest telemetry data received from the device.
Conclusion
Now you can easily connect your CO2 Display lite Temperature and humidity sensor and start sending data to ThingsBoard.
To go further, explore the ThingsBoard documentation to learn more about key features, such as creating dashboards to visualize your telemetry, or setting up alarm rules to monitor device behavior in real time.