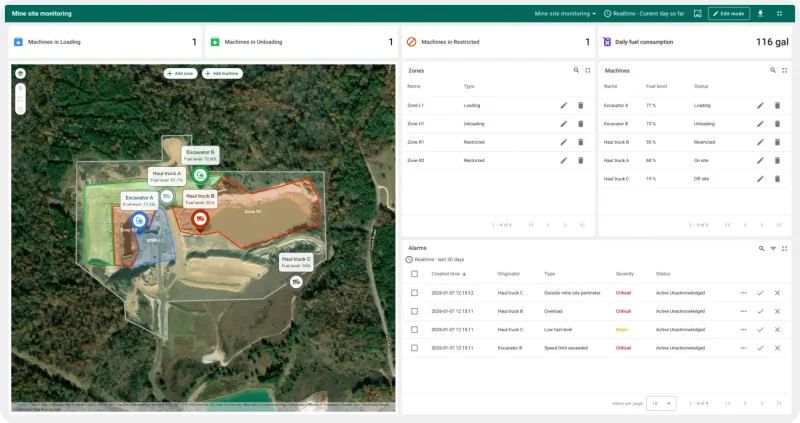
This dashboard displays a full satellite map of the mine with real-time overlays for each vehicle. Vehicles are color-coded by type and zone, while the right panel shows a live machine list with fuel status and operational state. KPIs summarize daily consumption, number of vehicles in each zone, and triggered alarms. It enables full operational awareness at a glance.
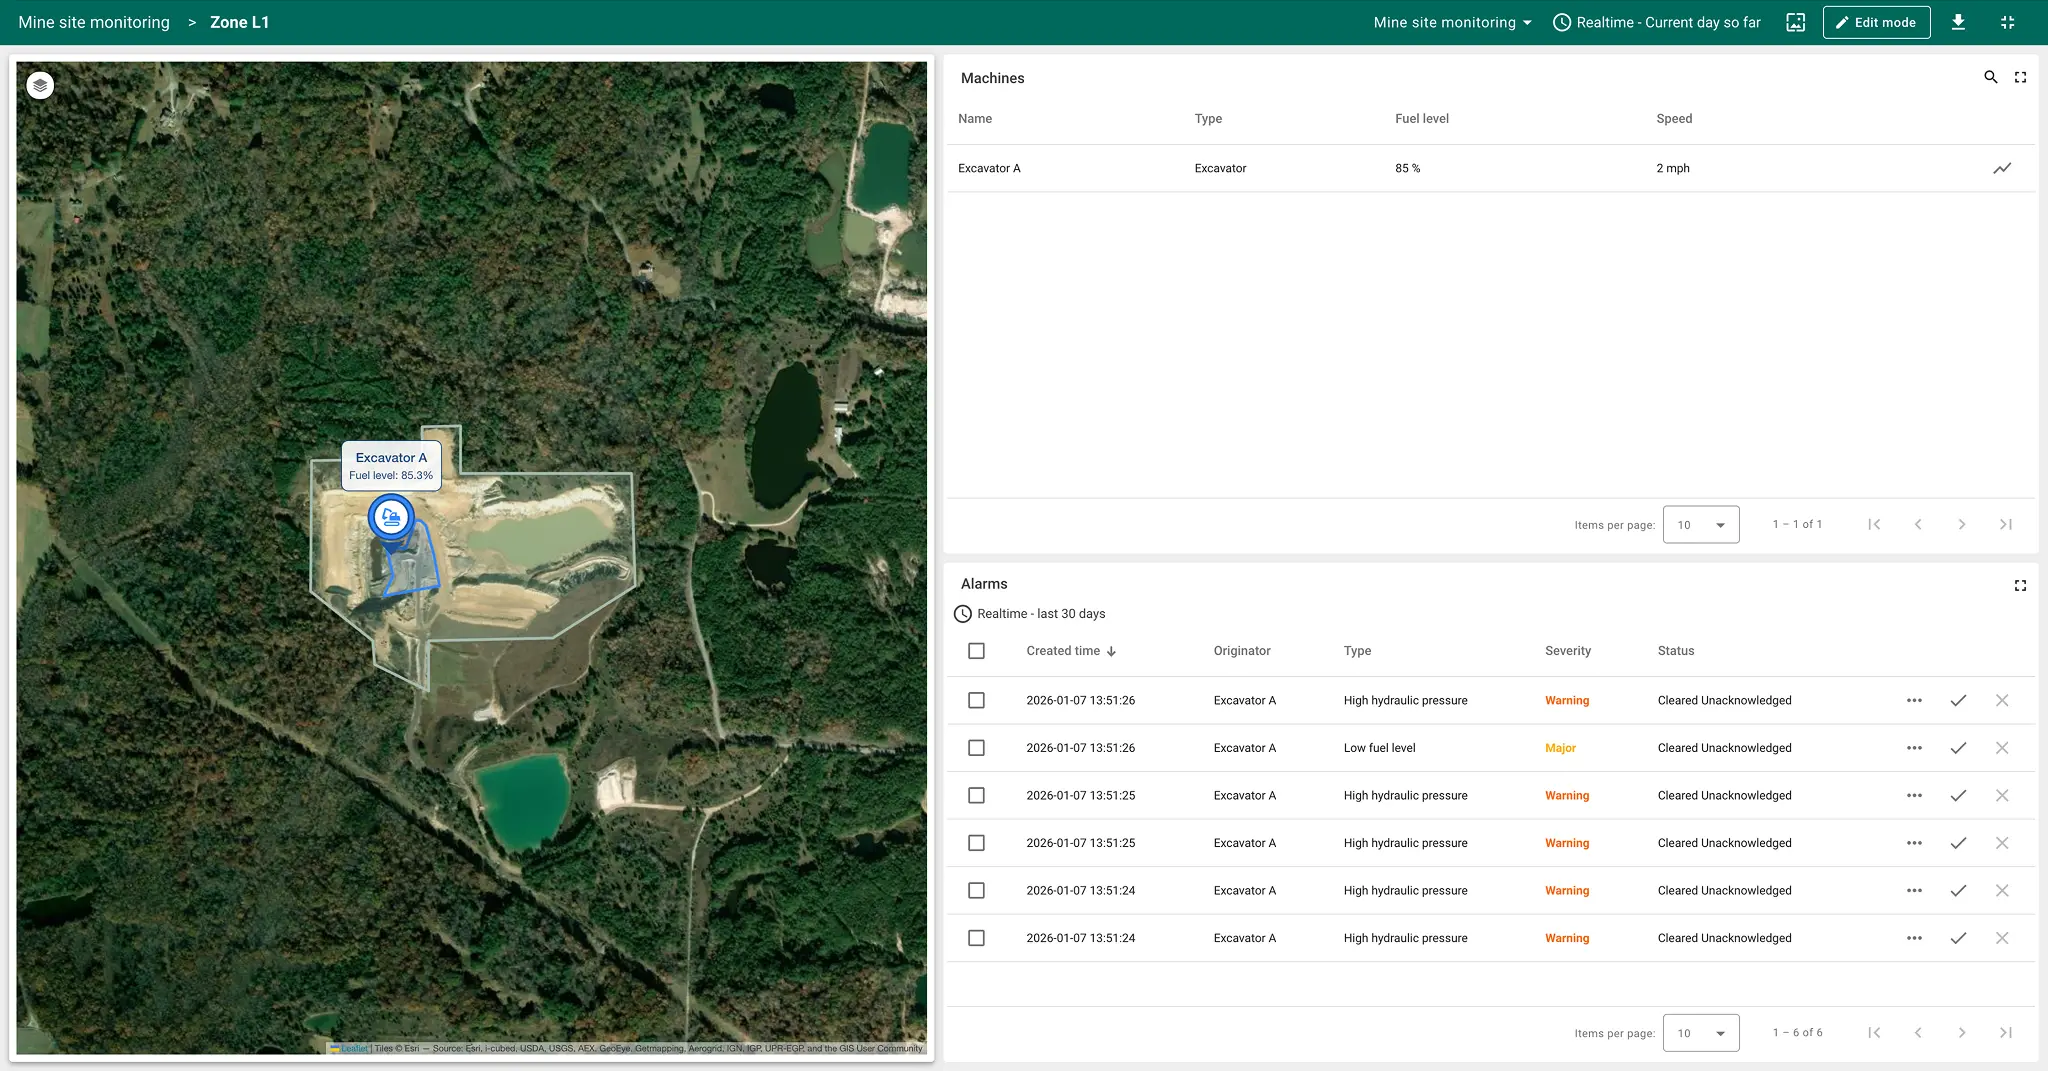
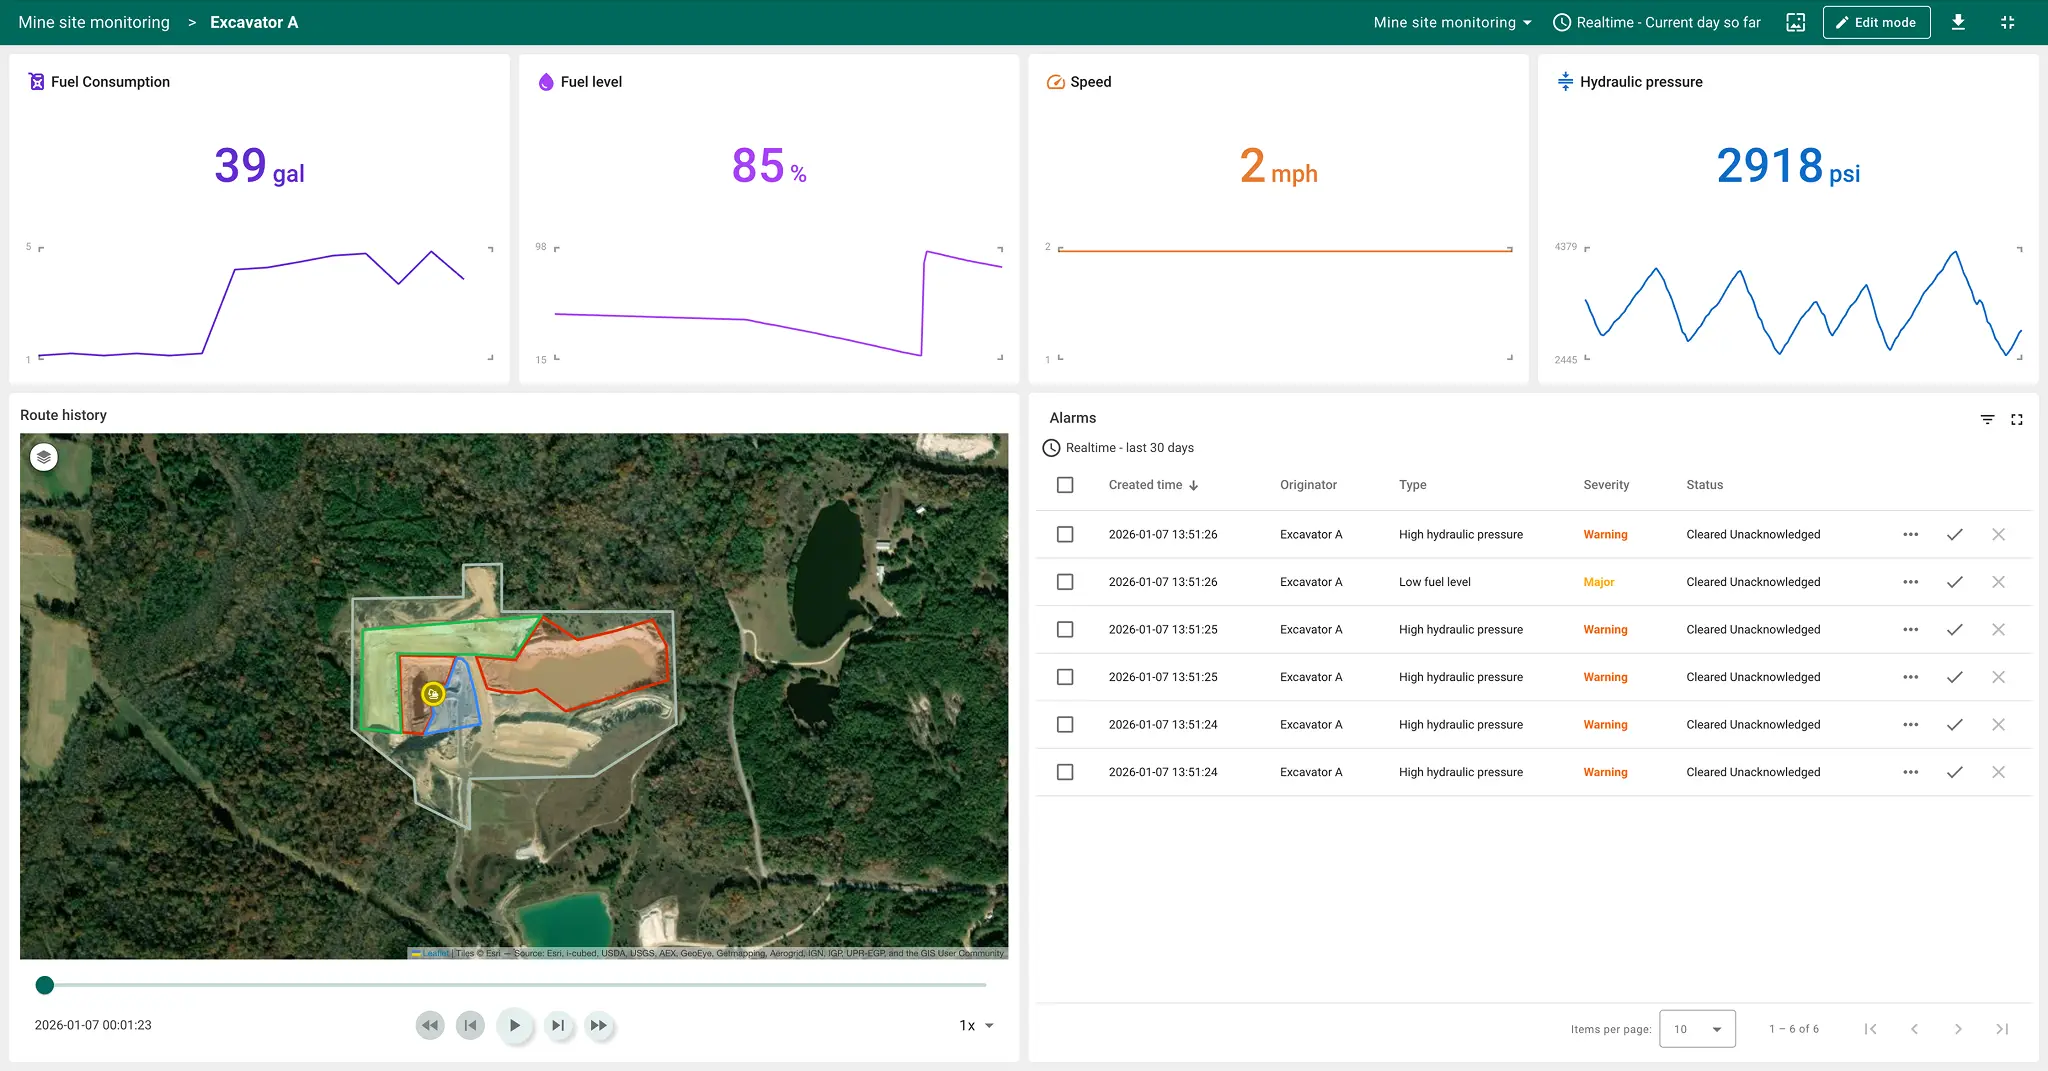
Focused on Excavator A, this dashboard tracks its speed, fuel level, and operational alarms. The map zooms into the loading zone, while the sidebar lists alarms for low fuel and hydraulic pressure. Operators can easily monitor zone-specific performance and address machine-level issues in context.
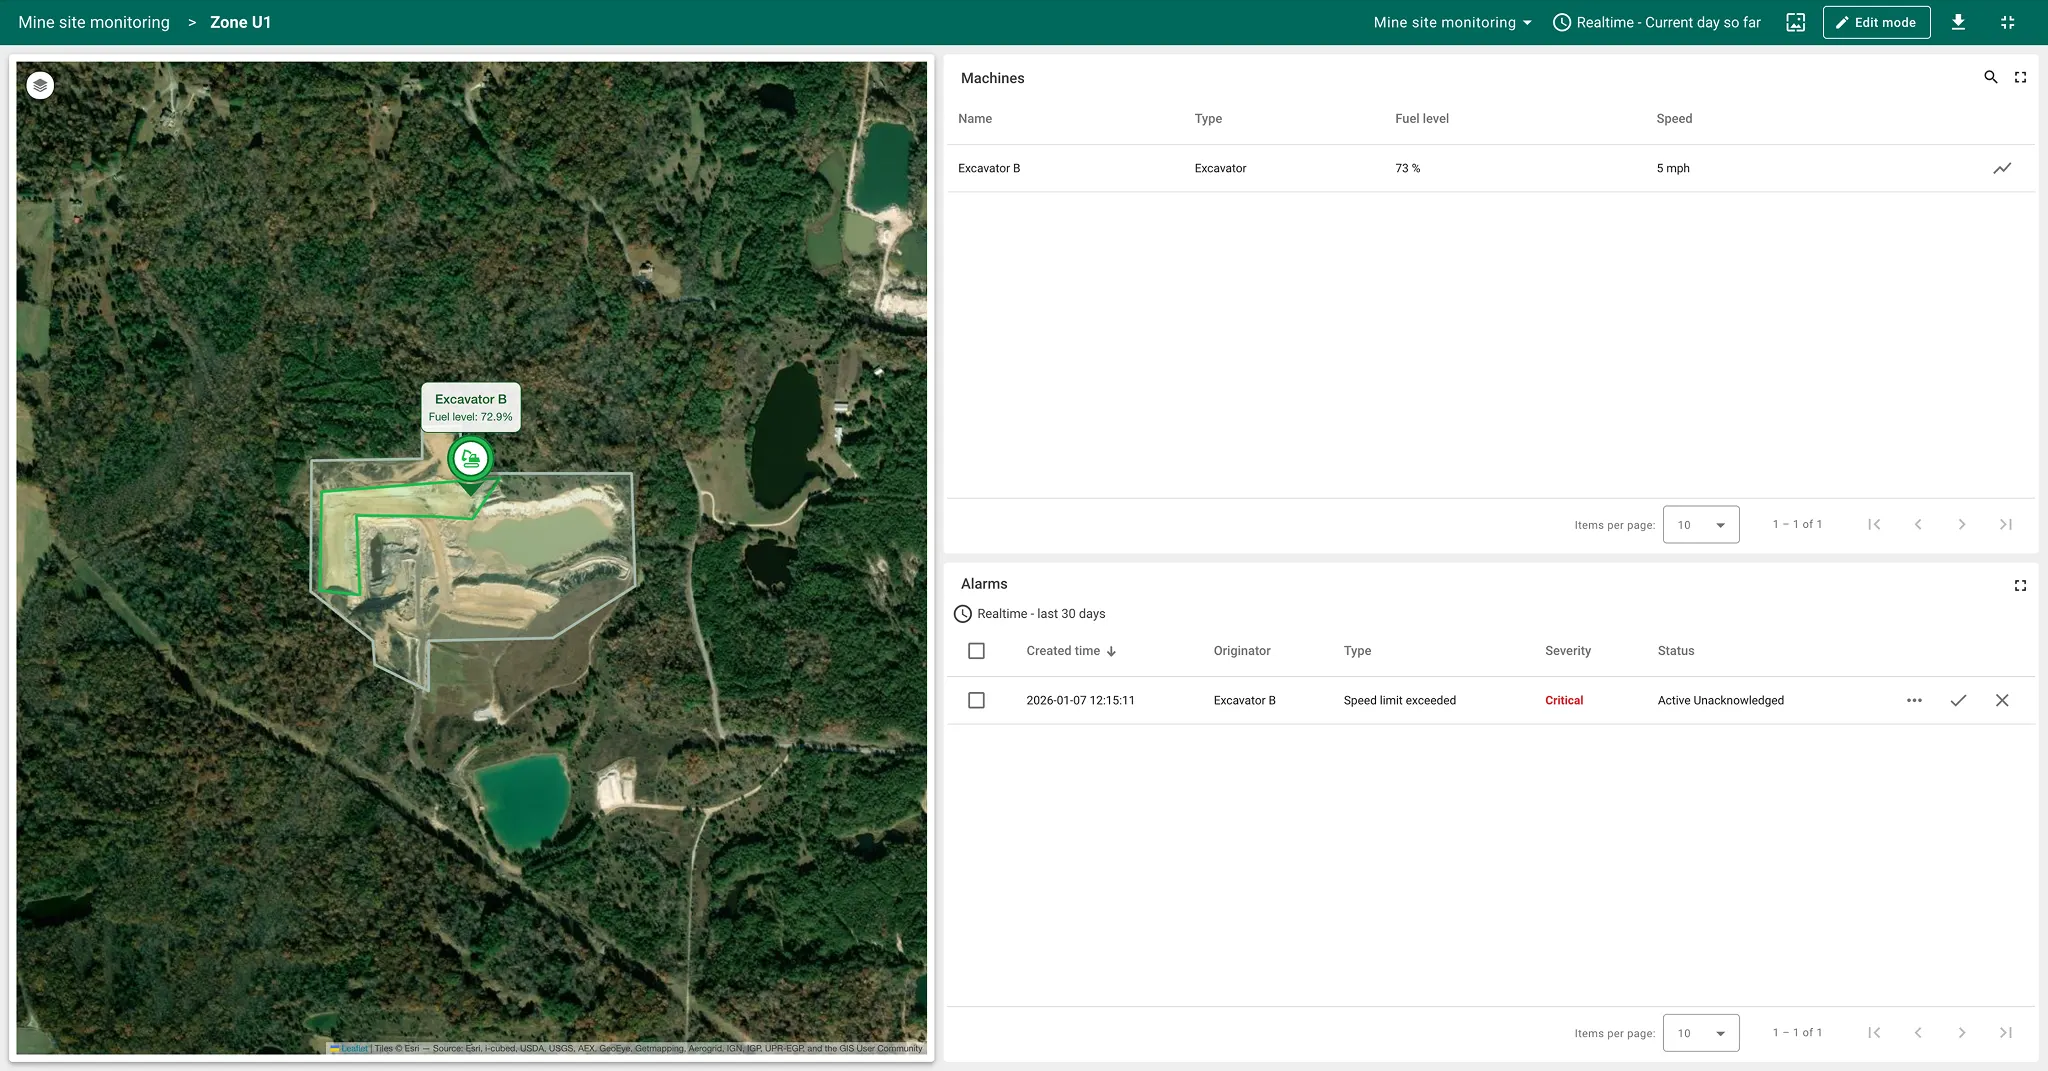
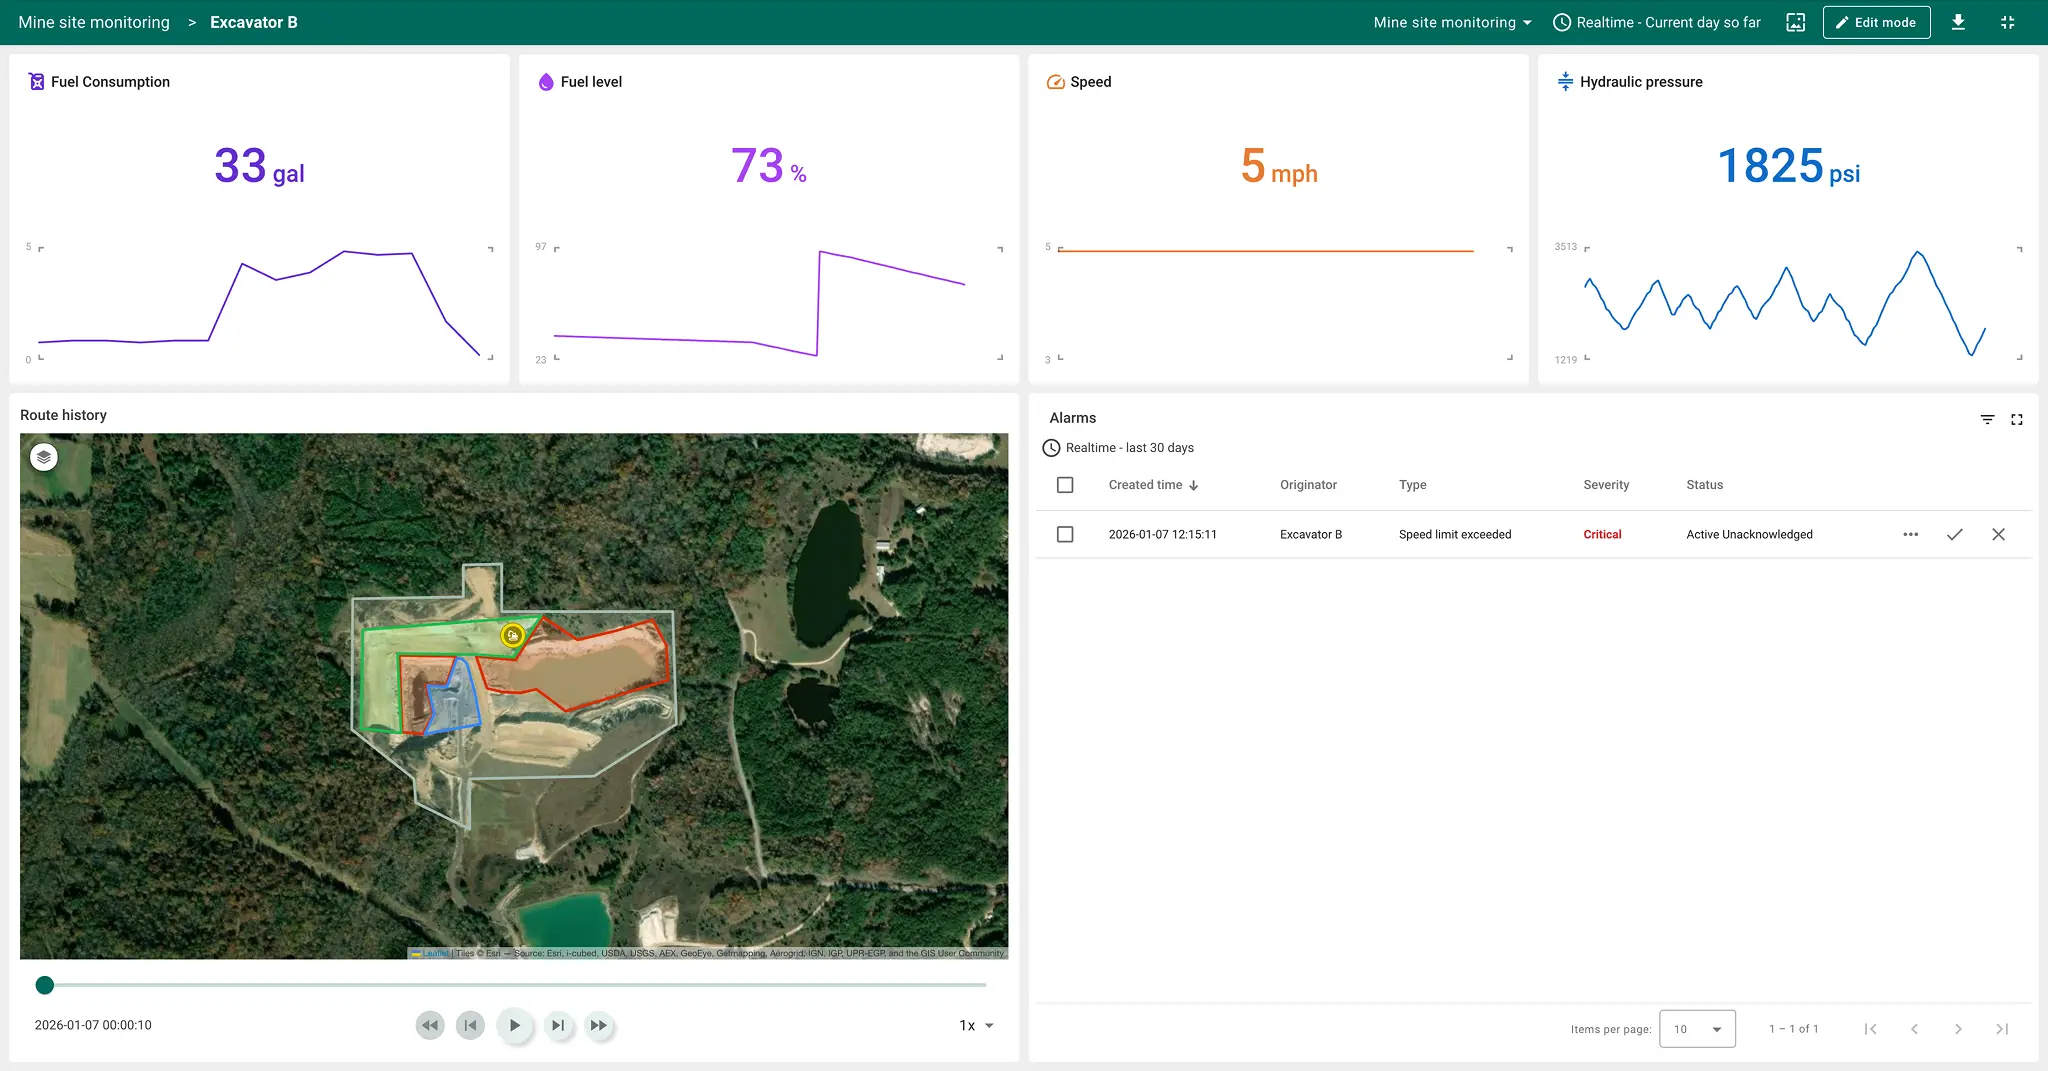
Displays Excavator B actively working in the unloading area with fuel and minor speed violations. Alarms are logged instantly. This dashboard provides quick access to machine status and zone compliance — a key element for high-traffic unloading areas.
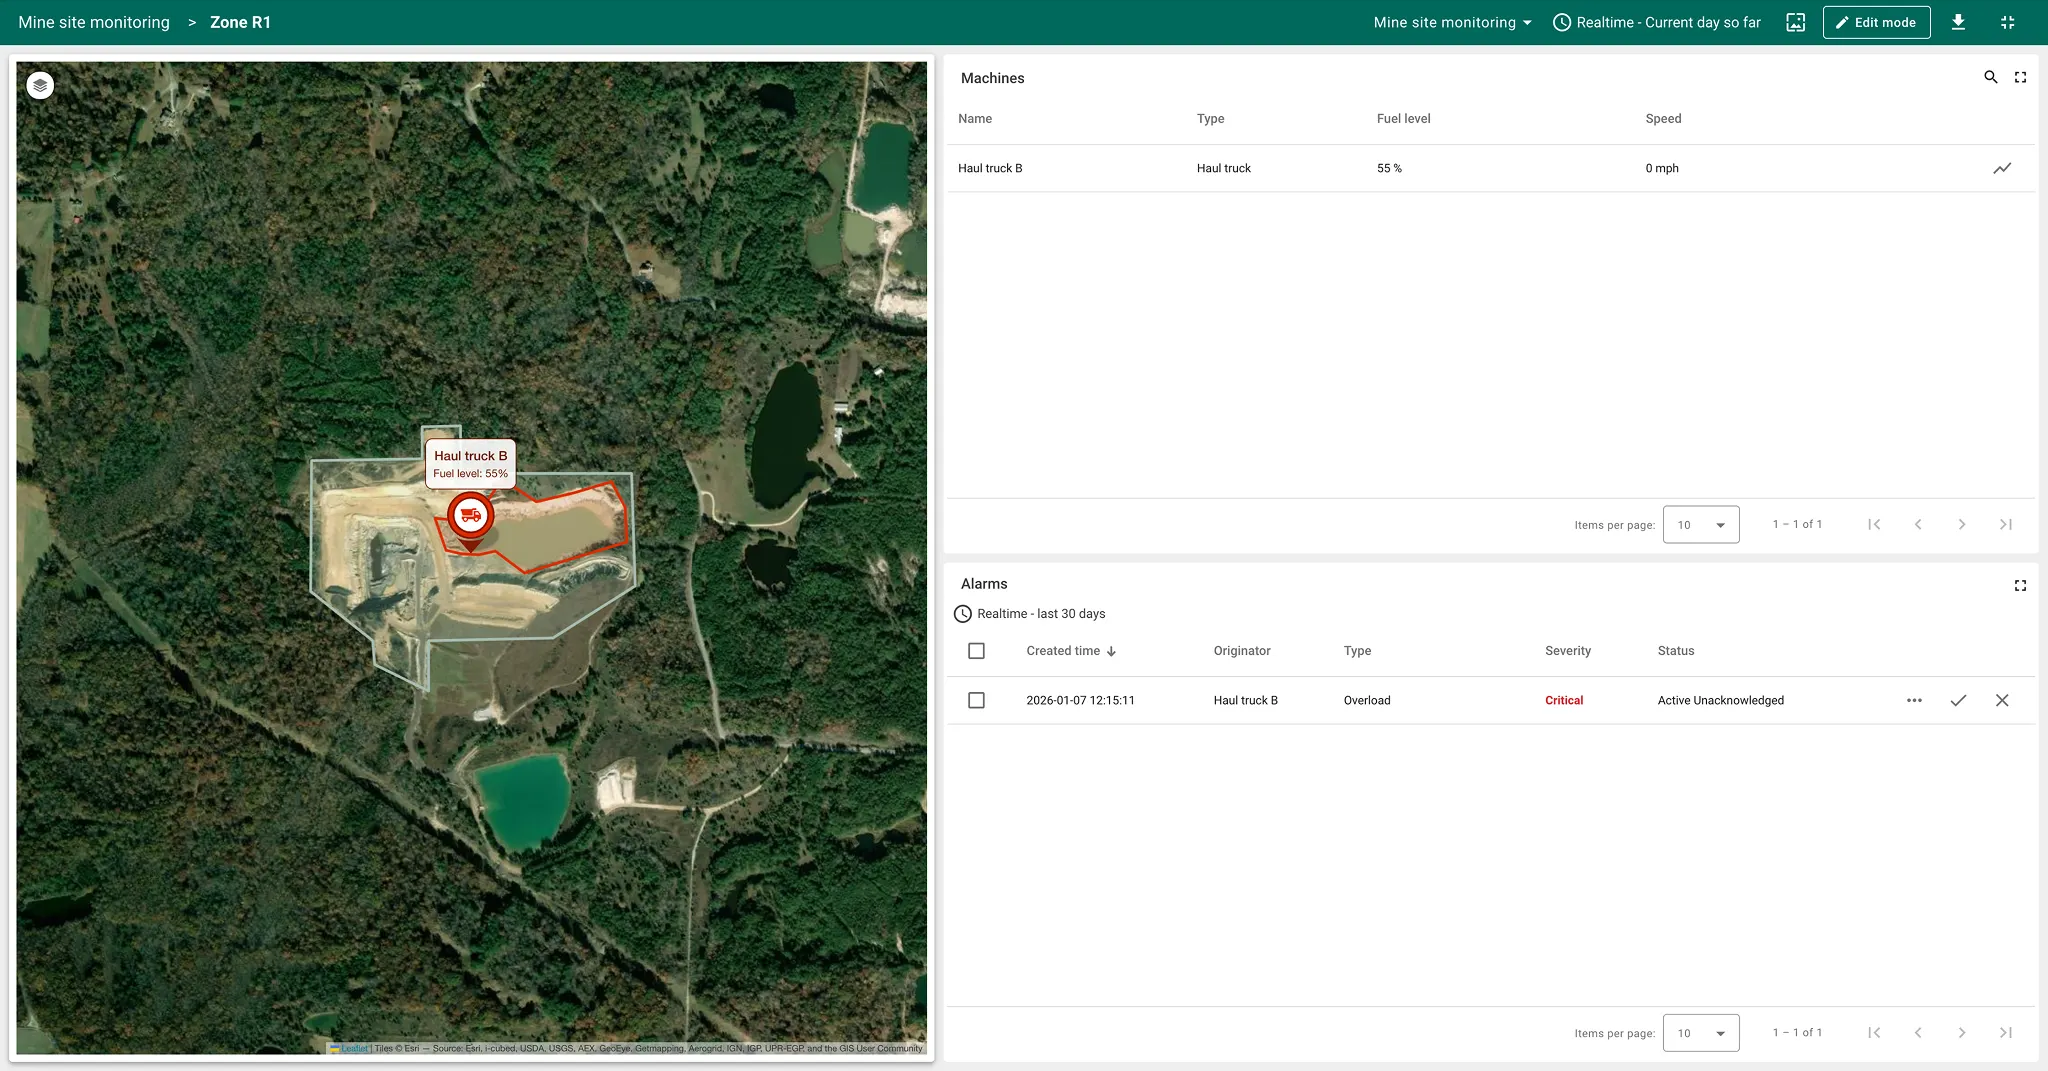
This screen shows Haul Truck B parked in a restricted zone, triggering a critical overload alarm. The map provides immediate zone context, and the alarm panel flags violations in real time. This visual enforcement helps prevent unsafe operation or zone breaches.
A telemetry-rich screen featuring fuel usage, fuel level, pressure, and route playback. Historical data and live metrics provide clear insight into machine performance and workload, while alarm logs support proactive maintenance.
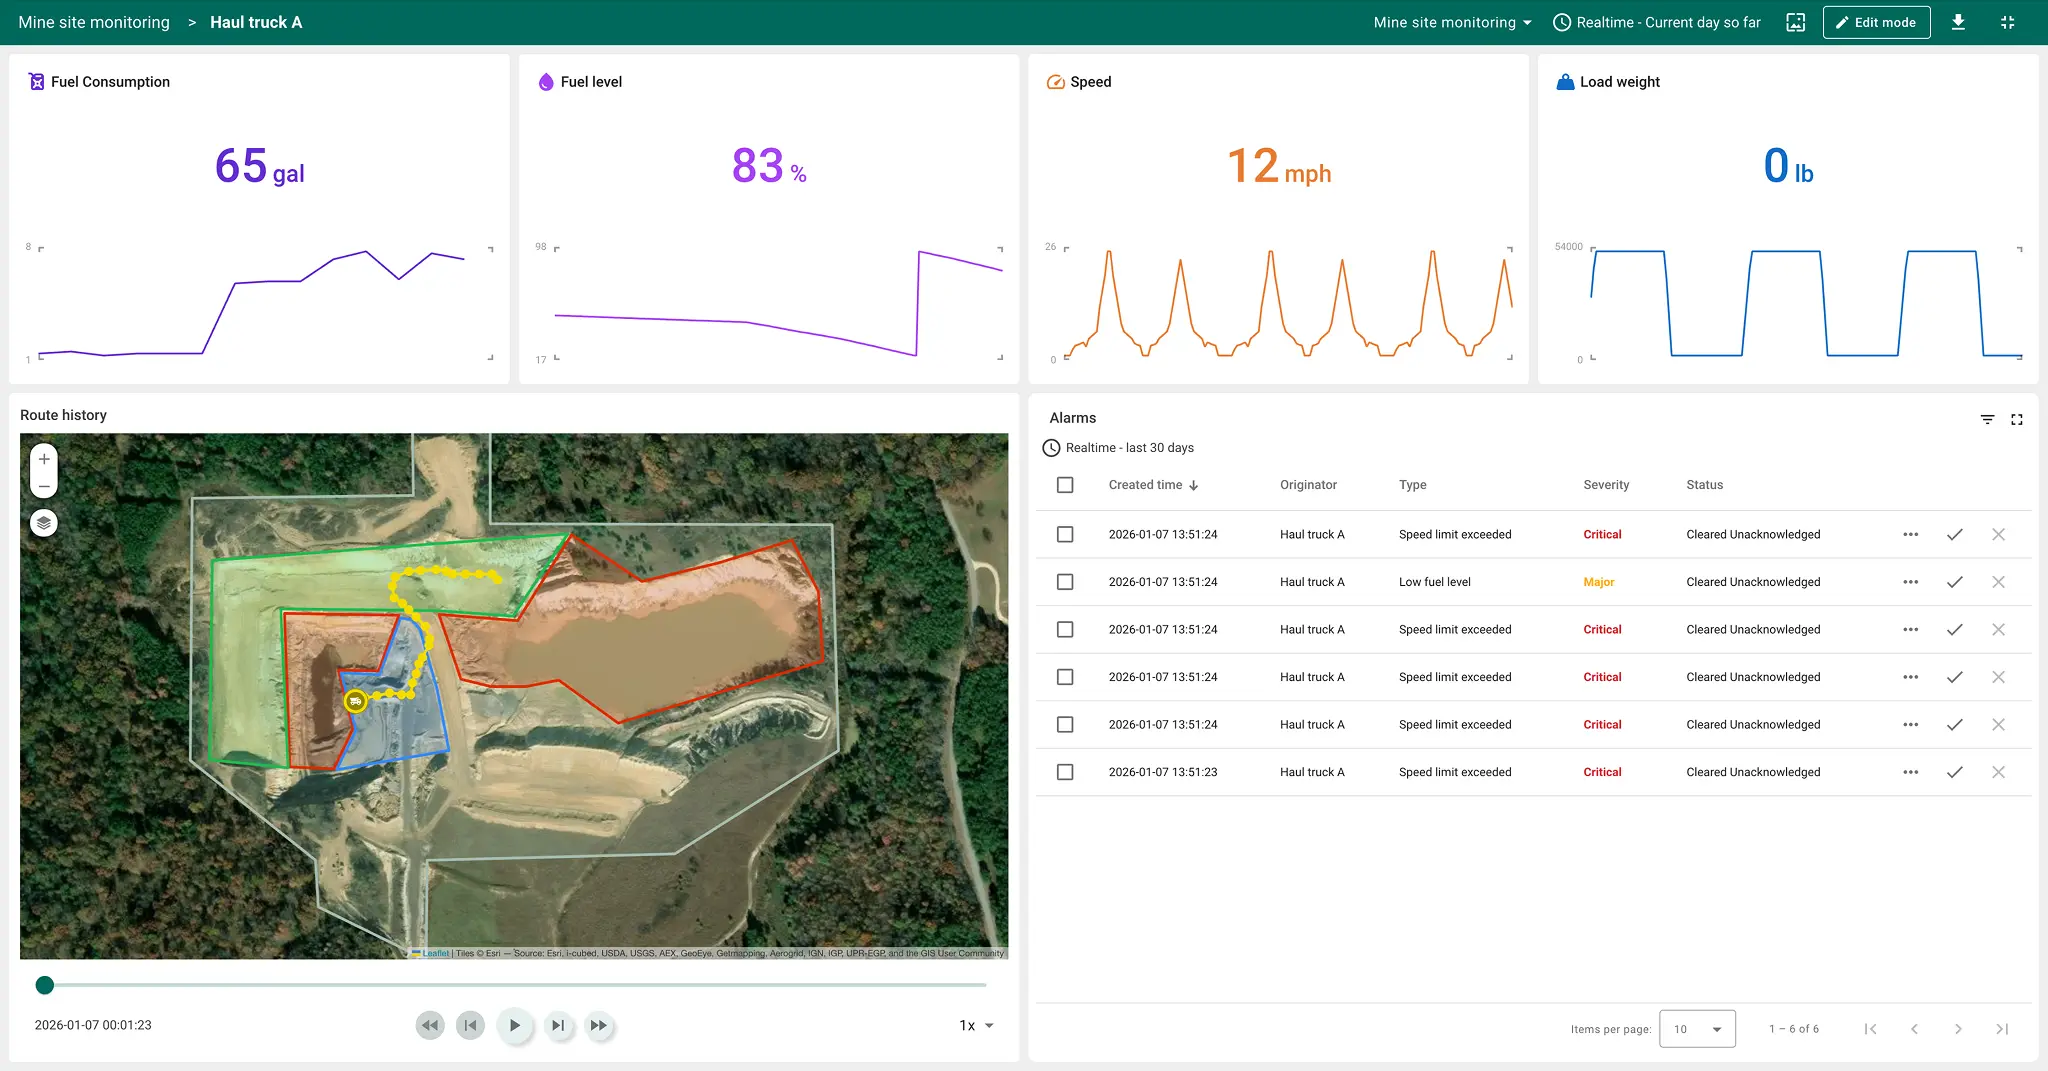
Highlights repeated speed limit violations, fuel burn, and load data. The route history is shown with all zone transitions. This enables supervisors to analyze driver behavior, optimize travel paths, and reduce excess wear or unsafe driving.
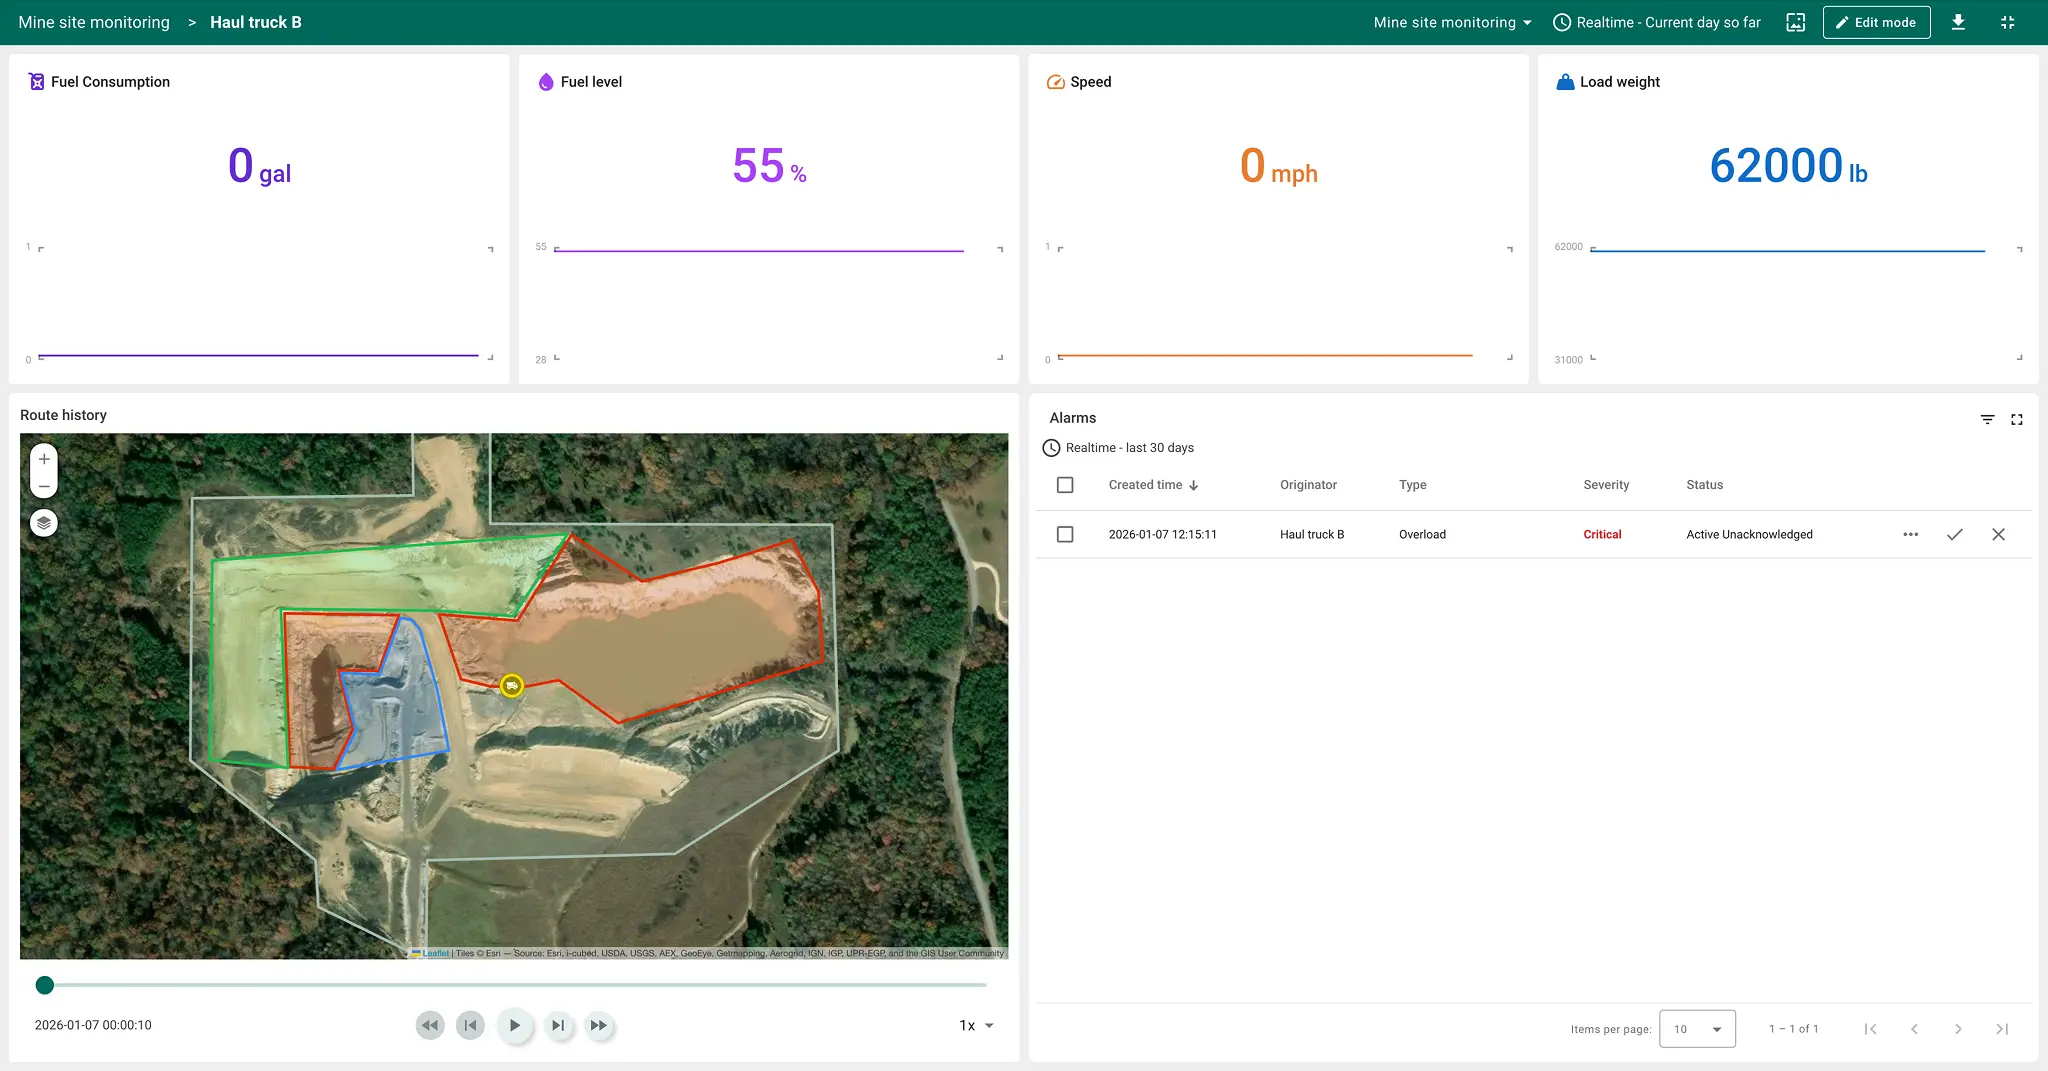
Shows a vehicle in a restricted zone with 28-ton load and no movement. An active overload alarm is triggered. This dashboard is essential for spotting inefficient use of assets or safety violations that need immediate action.
Monitors hydraulic pressure, movement, and fuel trends. Alarm logs indicate repeated pressure spikes. Used in tandem with maintenance schedules, this helps detect early signs of mechanical stress.
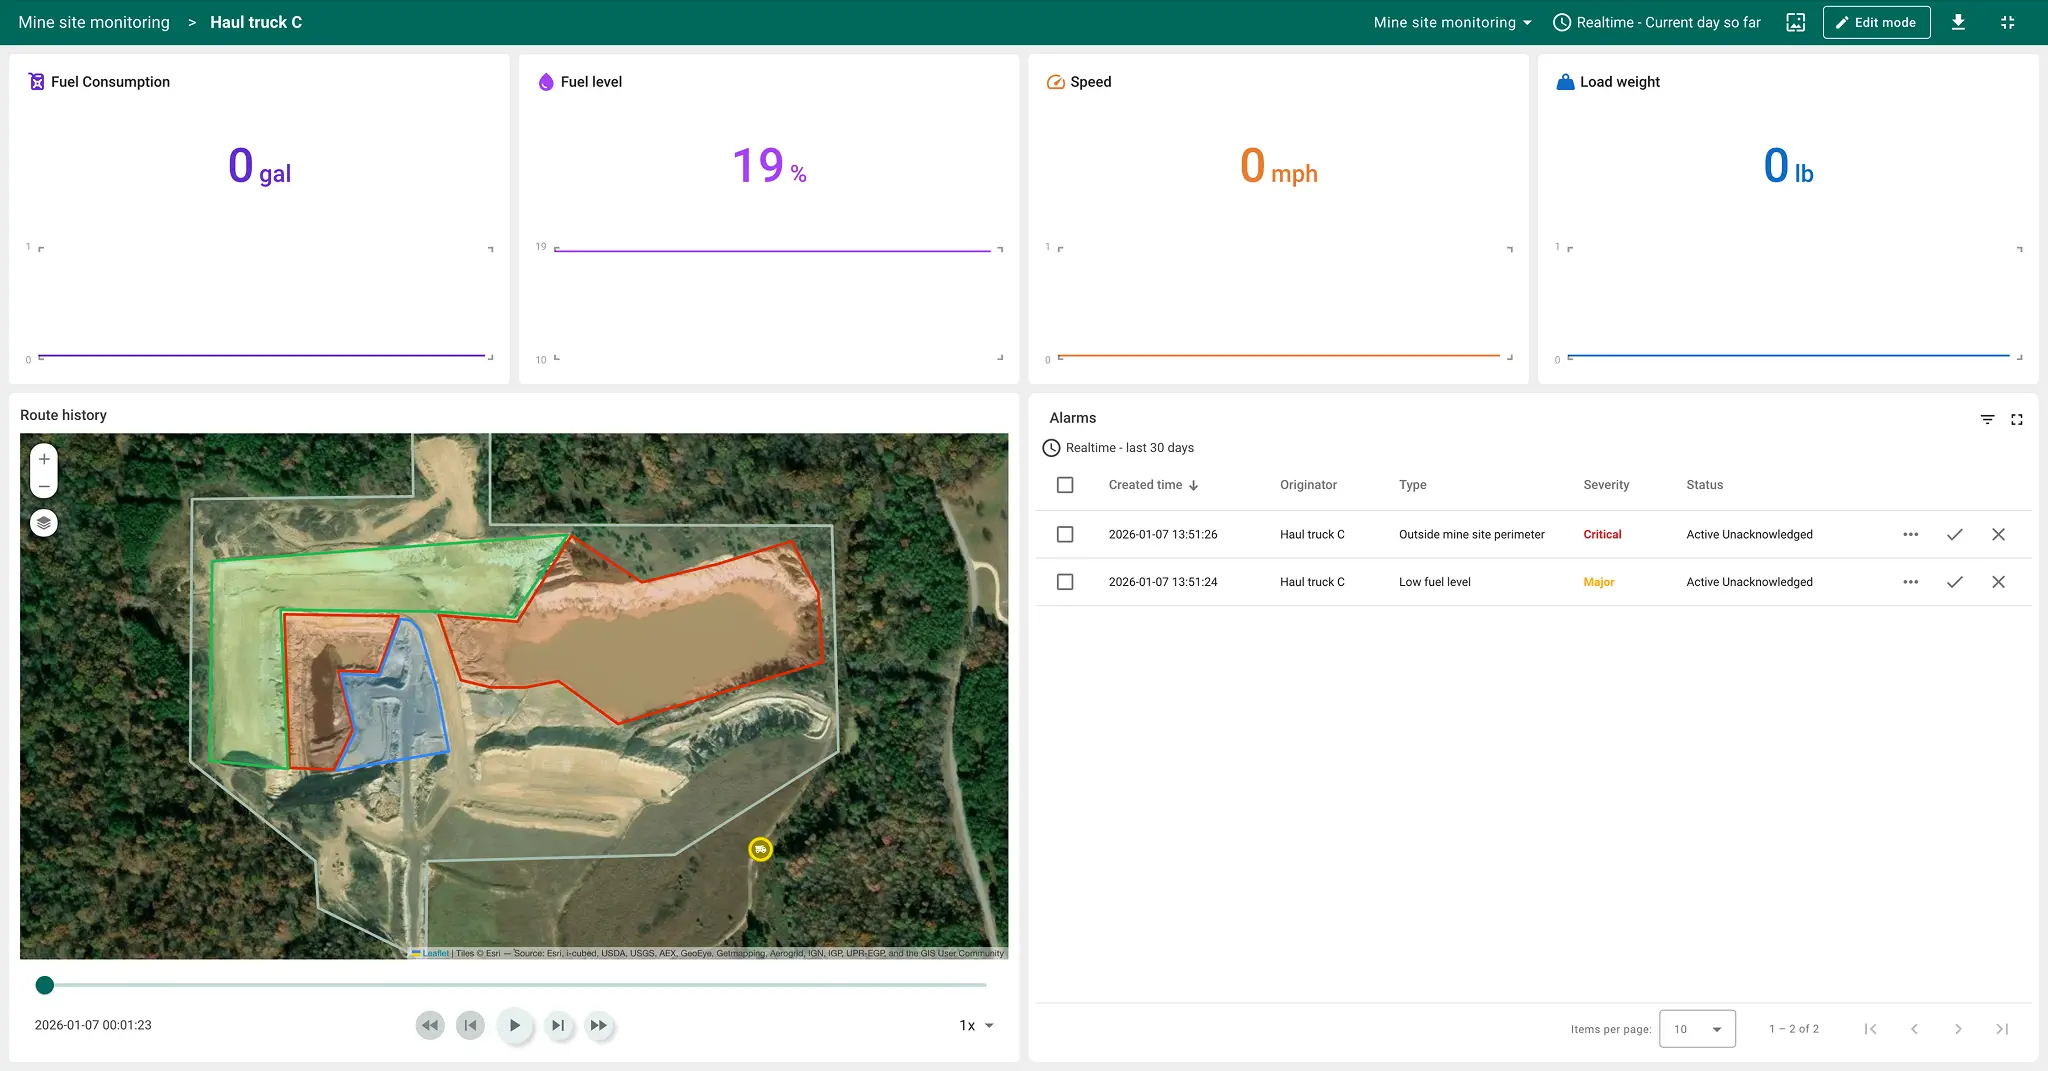
Vehicle is detected outside of the mine’s geofence, triggering a critical perimeter breach alarm. Combined with a low-fuel warning, the system prompts immediate resolution — reducing risk and ensuring operational boundaries are respected.
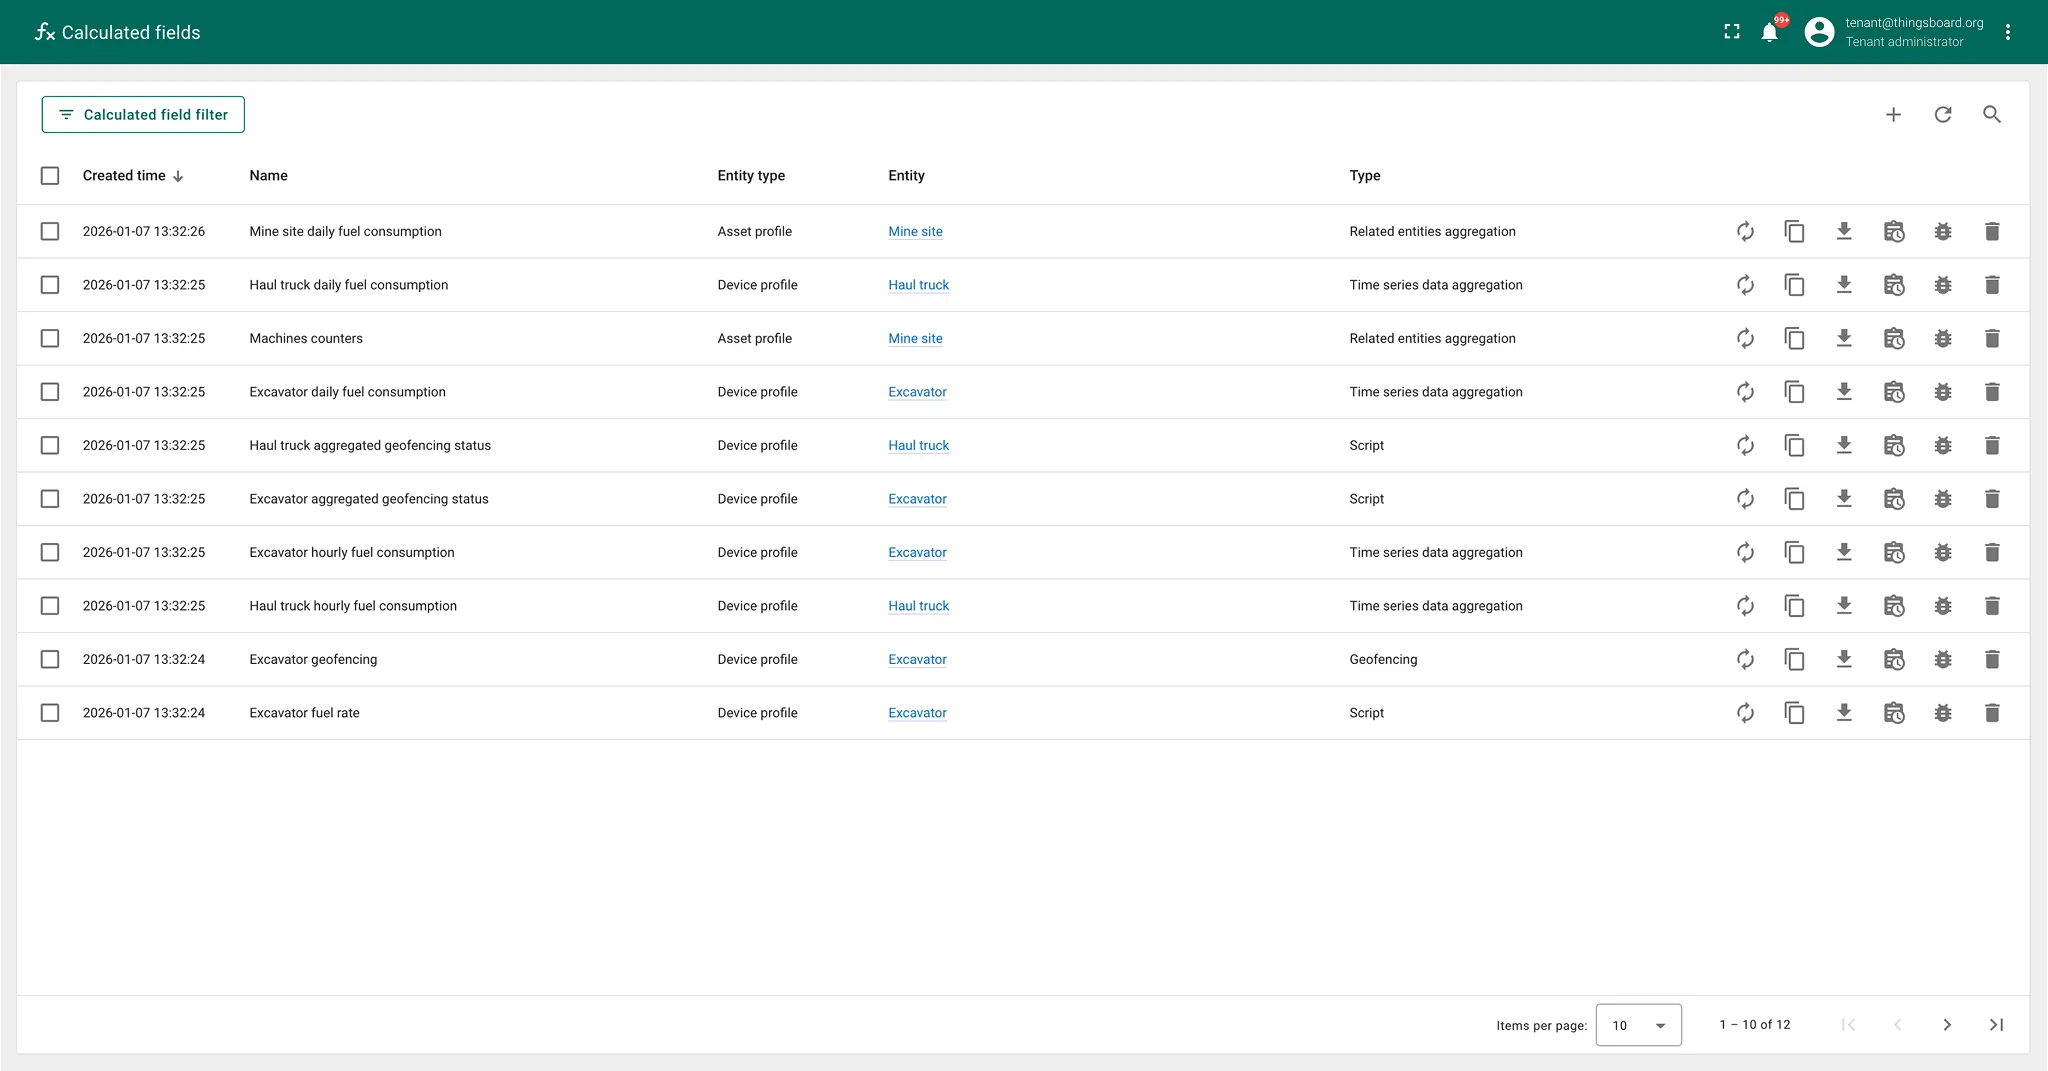
The admin interface shows all backend logic built through calculated fields — fuel formulas, geofence status, speed over limits, etc. Everything is visual, editable, and instantly applied to the data model — zero Rule Chains required. This low-code logic layer drastically reduces setup complexity and speeds up scaling across fleets.
Main Overview Dashboard
This dashboard displays a full satellite map of the mine with real-time overlays for each vehicle. Vehicles are color-coded by type and zone, while the right panel shows a live machine list with fuel status and operational state. KPIs summarize daily consumption, number of vehicles in each zone, and triggered alarms. It enables full operational awareness at a glance.
Zone L1 – Loading Area
Focused on Excavator A, this dashboard tracks its speed, fuel level, and operational alarms. The map zooms into the loading zone, while the sidebar lists alarms for low fuel and hydraulic pressure. Operators can easily monitor zone-specific performance and address machine-level issues in context.
Zone U1 – Unloading Area
Displays Excavator B actively working in the unloading area with fuel and minor speed violations. Alarms are logged instantly. This dashboard provides quick access to machine status and zone compliance — a key element for high-traffic unloading areas.
Zone R1 – Restricted Area
This screen shows Haul Truck B parked in a restricted zone, triggering a critical overload alarm. The map provides immediate zone context, and the alarm panel flags violations in real time. This visual enforcement helps prevent unsafe operation or zone breaches.
Excavator B – Machine Dashboard
A telemetry-rich screen featuring fuel usage, fuel level, pressure, and route playback. Historical data and live metrics provide clear insight into machine performance and workload, while alarm logs support proactive maintenance.
Haul Truck A – Behavior Dashboard
Highlights repeated speed limit violations, fuel burn, and load data. The route history is shown with all zone transitions. This enables supervisors to analyze driver behavior, optimize travel paths, and reduce excess wear or unsafe driving.
Haul Truck B – Idle & Overload State
Shows a vehicle in a restricted zone with 28-ton load and no movement. An active overload alarm is triggered. This dashboard is essential for spotting inefficient use of assets or safety violations that need immediate action.
Excavator A – Performance Analysis
Monitors hydraulic pressure, movement, and fuel trends. Alarm logs indicate repeated pressure spikes. Used in tandem with maintenance schedules, this helps detect early signs of mechanical stress.
Haul Truck C – Out-of-Zone Alert
Vehicle is detected outside of the mine’s geofence, triggering a critical perimeter breach alarm. Combined with a low-fuel warning, the system prompts immediate resolution — reducing risk and ensuring operational boundaries are respected.
Calculated Fields Panel
The admin interface shows all backend logic built through calculated fields — fuel formulas, geofence status, speed over limits, etc. Everything is visual, editable, and instantly applied to the data model — zero Rule Chains required. This low-code logic layer drastically reduces setup complexity and speeds up scaling across fleets.