This unified dashboard provides a comprehensive real-time view of voltage, amperage, frequency, and energy consumption across all three floors. Operators can monitor Smart Meters A, B, and C, analyze, compare performance, and detect anomalies instantly. Alarm widgets notify users about critical events like low or high voltage, while interactive charts and tables offer full control and insight — all from a single interface.
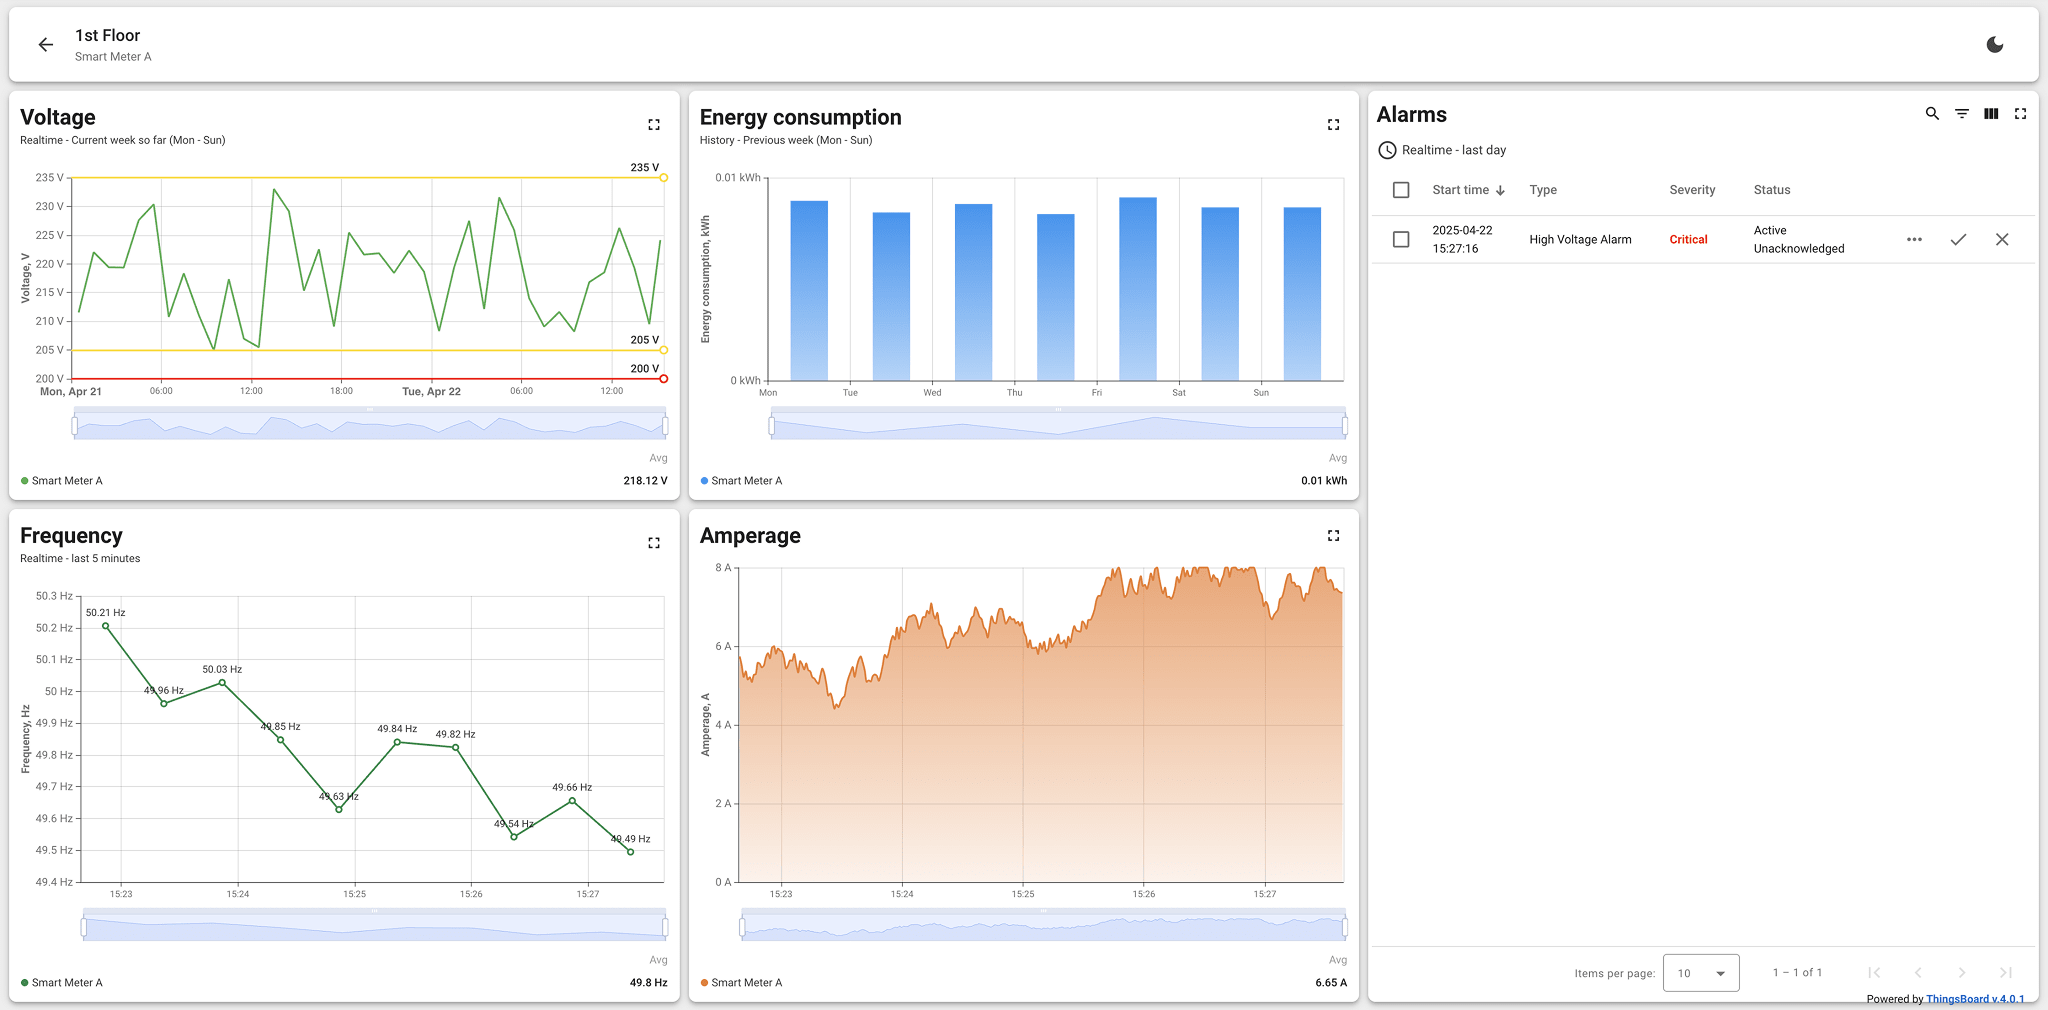
This dashboard provides full visibility into voltage, frequency, amperage, and energy consumption for Smart Meter A. Real-time charts help detect instability in power supply, while a historical consumption graph supports weekly analysis. The frequency dip and critical high-voltage alarm enable timely diagnostics and response.
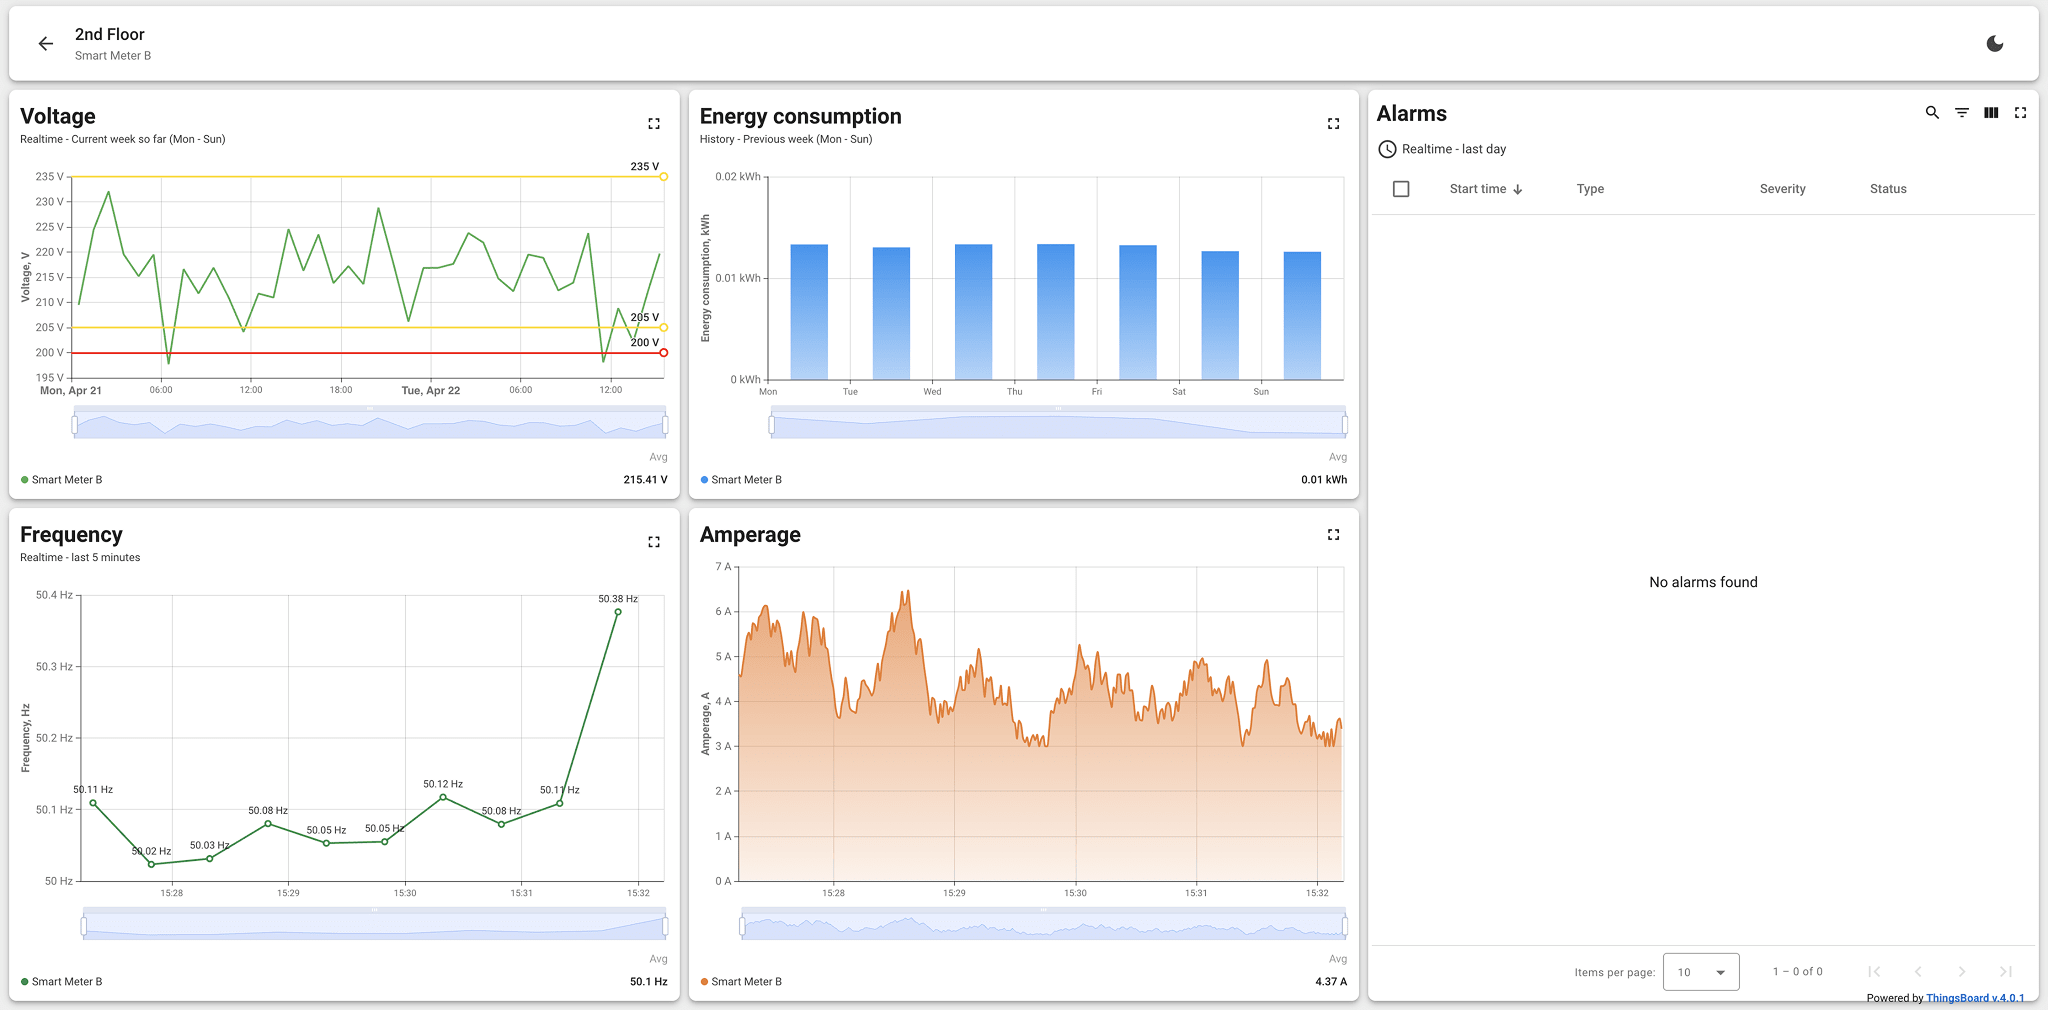
This dashboard provides full visibility into voltage, frequency, amperage, and energy consumption for Smart Meter B. Real-time charts help detect instability in power supply, while a historical consumption graph supports weekly analysis. The frequency dip and critical high-voltage alarm enable timely diagnostics and response.
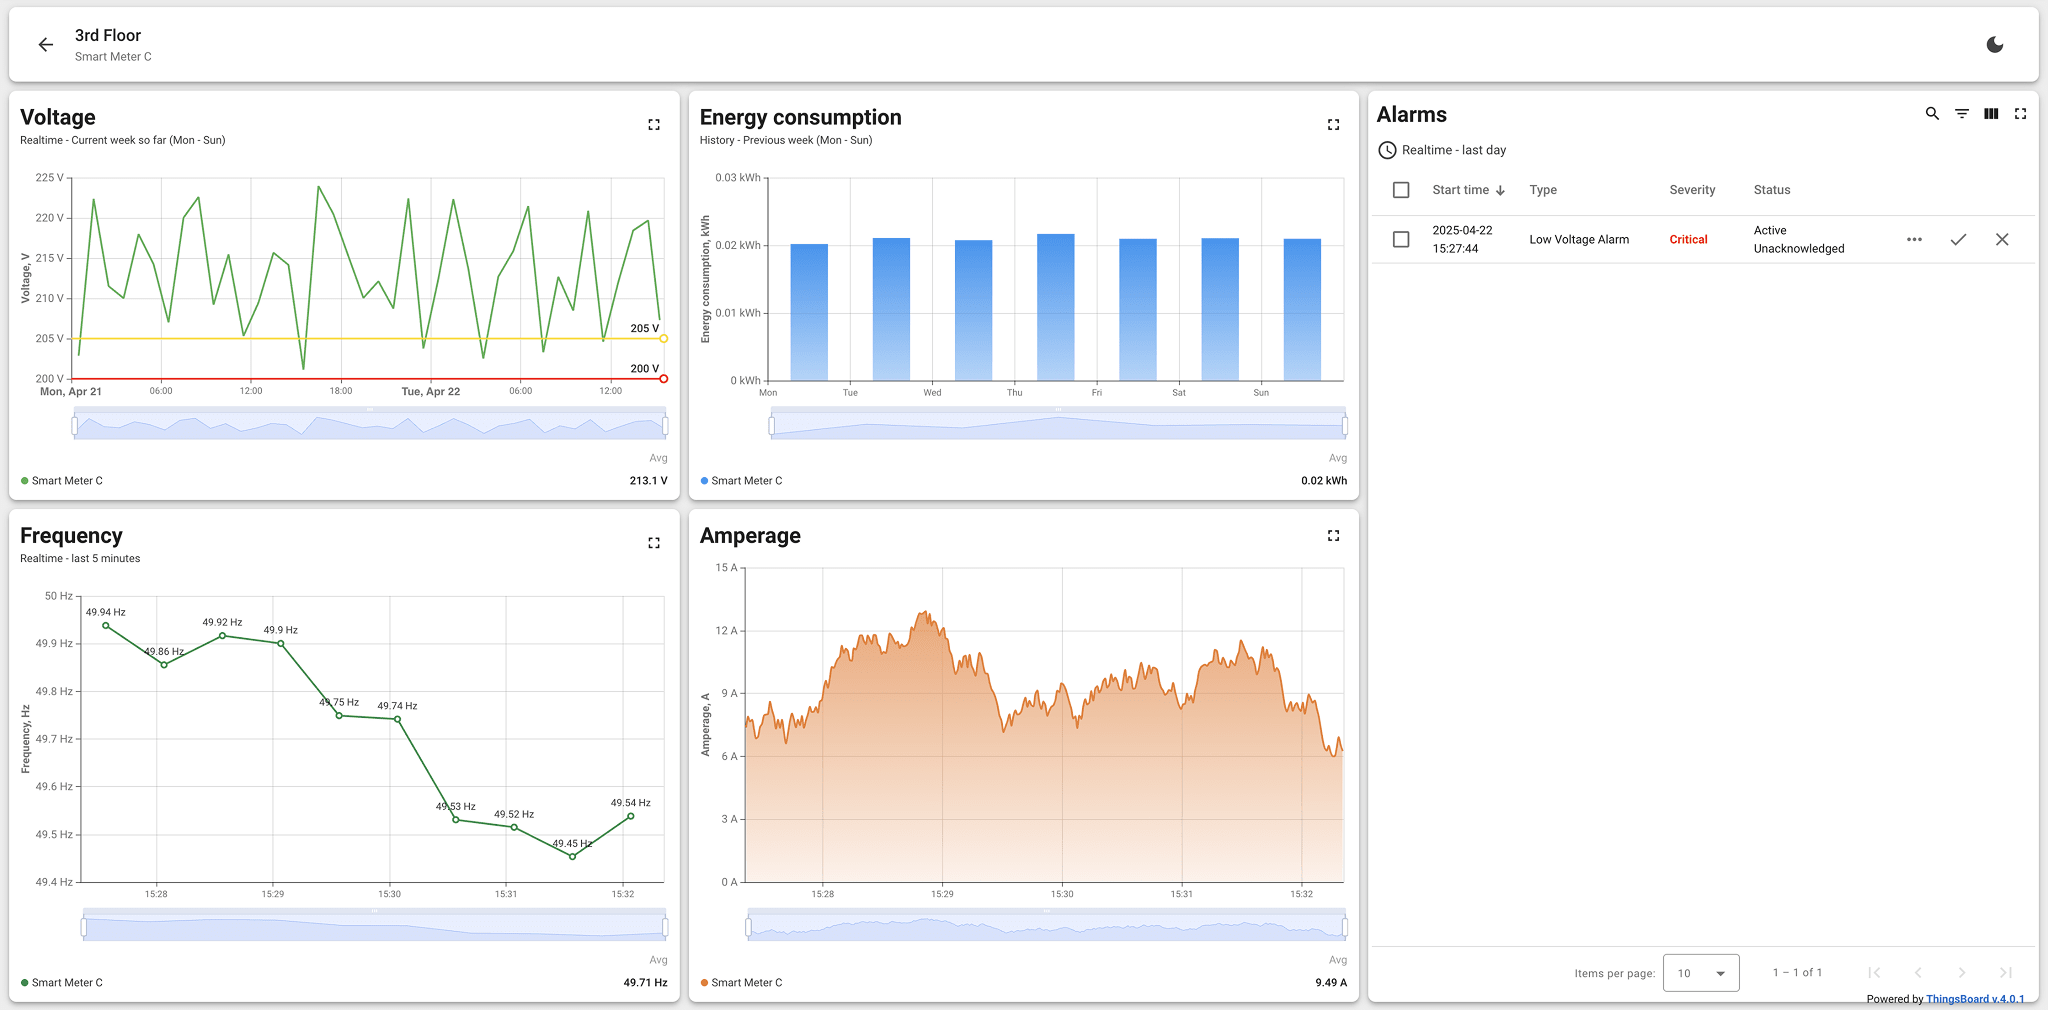
This dashboard provides full visibility into voltage, frequency, amperage, and energy consumption for Smart Meter C. Real-time charts help detect instability in power supply, while a historical consumption graph supports weekly analysis. The frequency dip and critical high-voltage alarm enable timely diagnostics and response.
With a single click on the theme icon in the top right corner, users can switch between light and dark modes. This flexibility enhances user comfort in various lighting conditions, improves focus, and reduces eye strain — especially during night shifts or long monitoring sessions. The dark theme preserves full dashboard functionality, including charts, alerts, and controls.
Smart energy state
This unified dashboard provides a comprehensive real-time view of voltage, amperage, frequency, and energy consumption across all three floors. Operators can monitor Smart Meters A, B, and C, analyze, compare performance, and detect anomalies instantly. Alarm widgets notify users about critical events like low or high voltage, while interactive charts and tables offer full control and insight — all from a single interface.

Smart Meter A — 1st Floor state
This dashboard provides full visibility into voltage, frequency, amperage, and energy consumption for Smart Meter A. Real-time charts help detect instability in power supply, while a historical consumption graph supports weekly analysis. The frequency dip and critical high-voltage alarm enable timely diagnostics and response.
Smart Meter B — 2nd Floor state
This dashboard provides full visibility into voltage, frequency, amperage, and energy consumption for Smart Meter B. Real-time charts help detect instability in power supply, while a historical consumption graph supports weekly analysis. The frequency dip and critical high-voltage alarm enable timely diagnostics and response.
Smart Meter C — 3rd Floor state
This dashboard provides full visibility into voltage, frequency, amperage, and energy consumption for Smart Meter C. Real-time charts help detect instability in power supply, while a historical consumption graph supports weekly analysis. The frequency dip and critical high-voltage alarm enable timely diagnostics and response.
Theme toggle mode
With a single click on the theme icon in the top right corner, users can switch between light and dark modes. This flexibility enhances user comfort in various lighting conditions, improves focus, and reduces eye strain — especially during night shifts or long monitoring sessions. The dark theme preserves full dashboard functionality, including charts, alerts, and controls.


