Rock Pi 4 Model B
Rock Pi 4 Model B
Radxa
- Platform
- ThingsBoard
- Hardware Type
- Single-board computers
- Connectivity
- Ethernet, WIFI, Bluetooth
- Chip
- Rockchip RK3399
- Industry
- Smart Cities, Smart Buildings, Retail, Industrial Manufacturing, Healthcare
- Use Case
- Smart energy, Environment Monitoring, Smart Office, Smart Retail, Smart Farming, Fleet Tracking, Health Care, Air Quality Monitoring, Waste Management, Tank Level Monitoring
Introduction
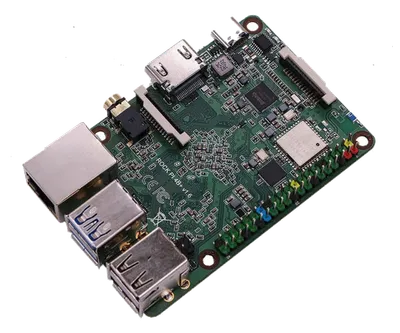
Rock Pi 4 Model B is a powerful single-board computer with a Rockchip RK3399 processor, up to 4GB LPDDR4 RAM, and up to 128GB eMMC flash storage. It also features Gigabit Ethernet, WIFI, Bluetooth 5. 0, and a variety of connectors for peripherals and expansion. The board is suitable for a wide range of applications, including AI, IoT, and multimedia.
In this guide, we will learn how to create device on Thingsboard, install required libraries and tools. After this we will modify our code and upload it to the device, and check the results of our coding and check data on ThingsBoard using imported dashboard. Our device will synchronize with ThingsBoard using client and shared attributes requests functionality. Of course, we will control our device using provided functionality like shared attributes or RPC requests.
Prerequisites
To continue with this guide, we will need the following:
-
Rock Pi 4 Model B
Create device on ThingsBoard
For simplicity, we will provide the device manually using the UI.
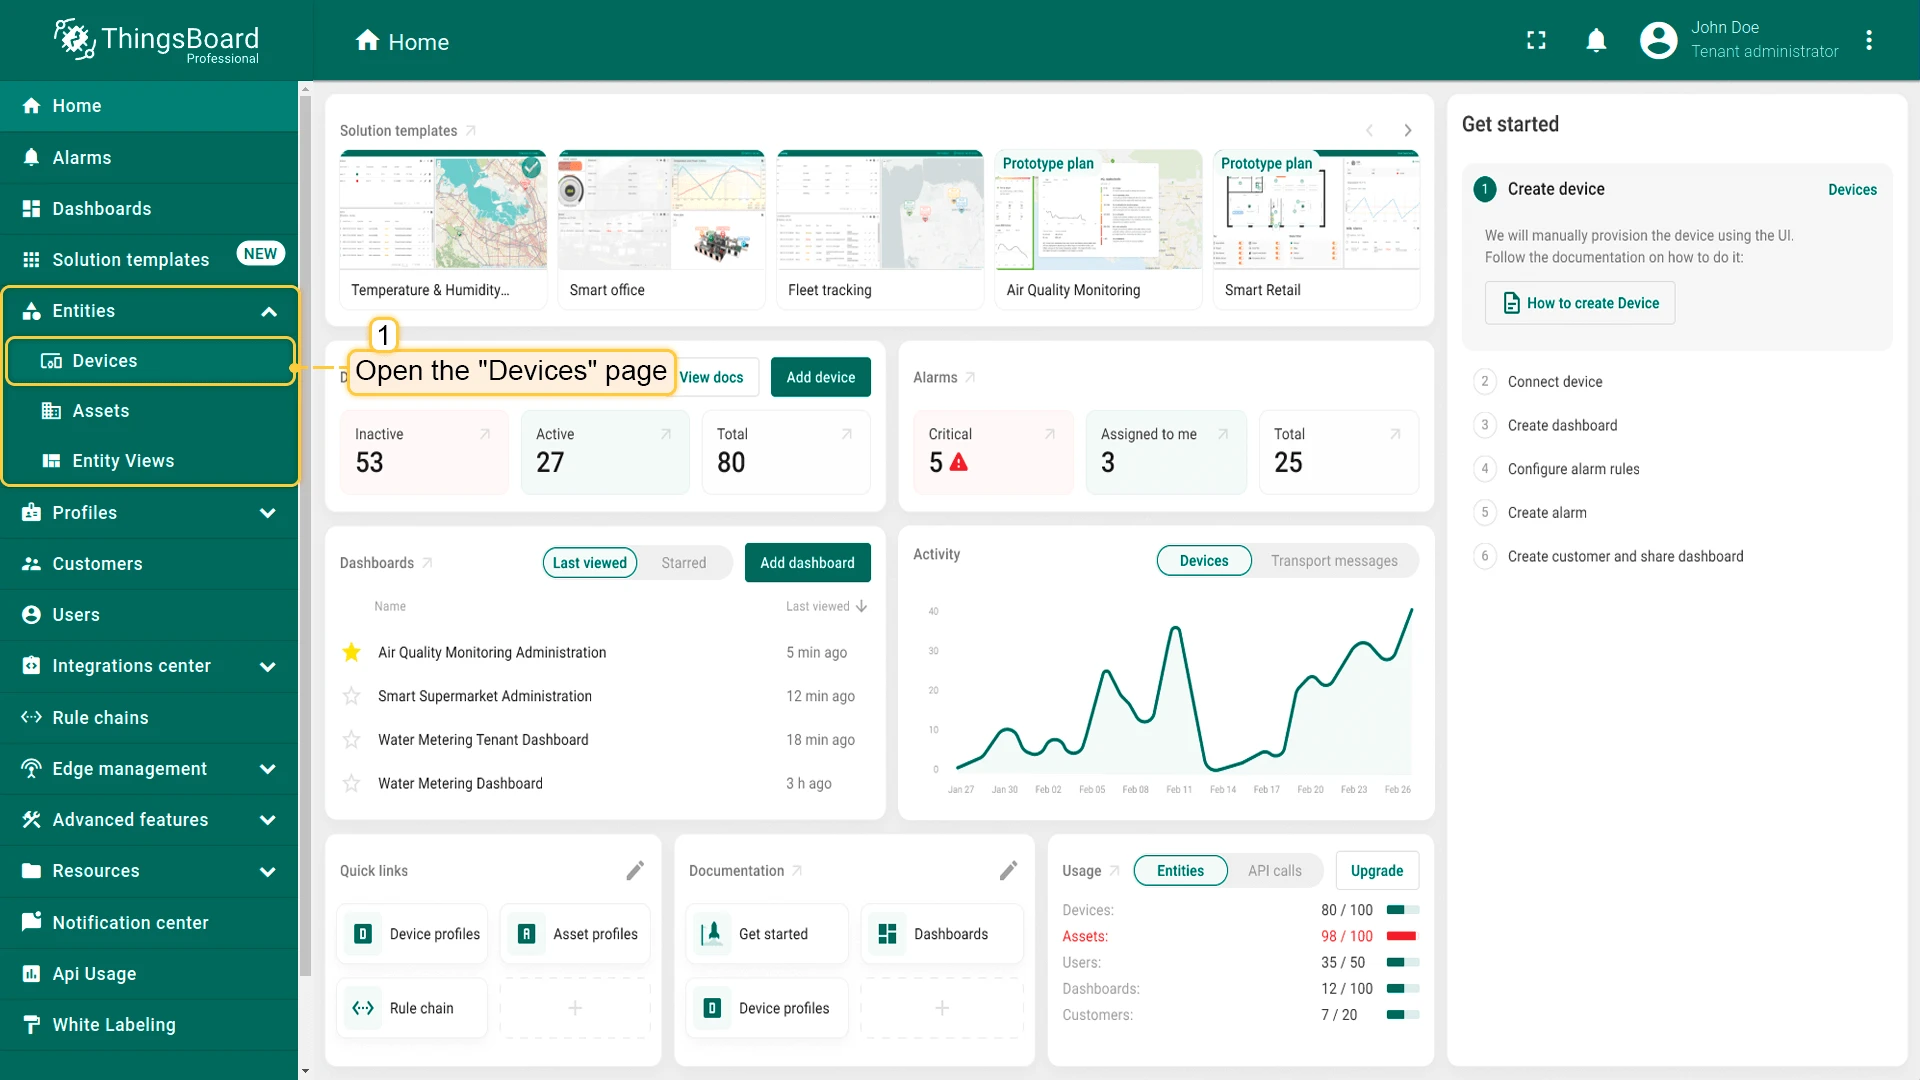
- Log in to your ThingsBoard instance and go to the Entities > Devices section.
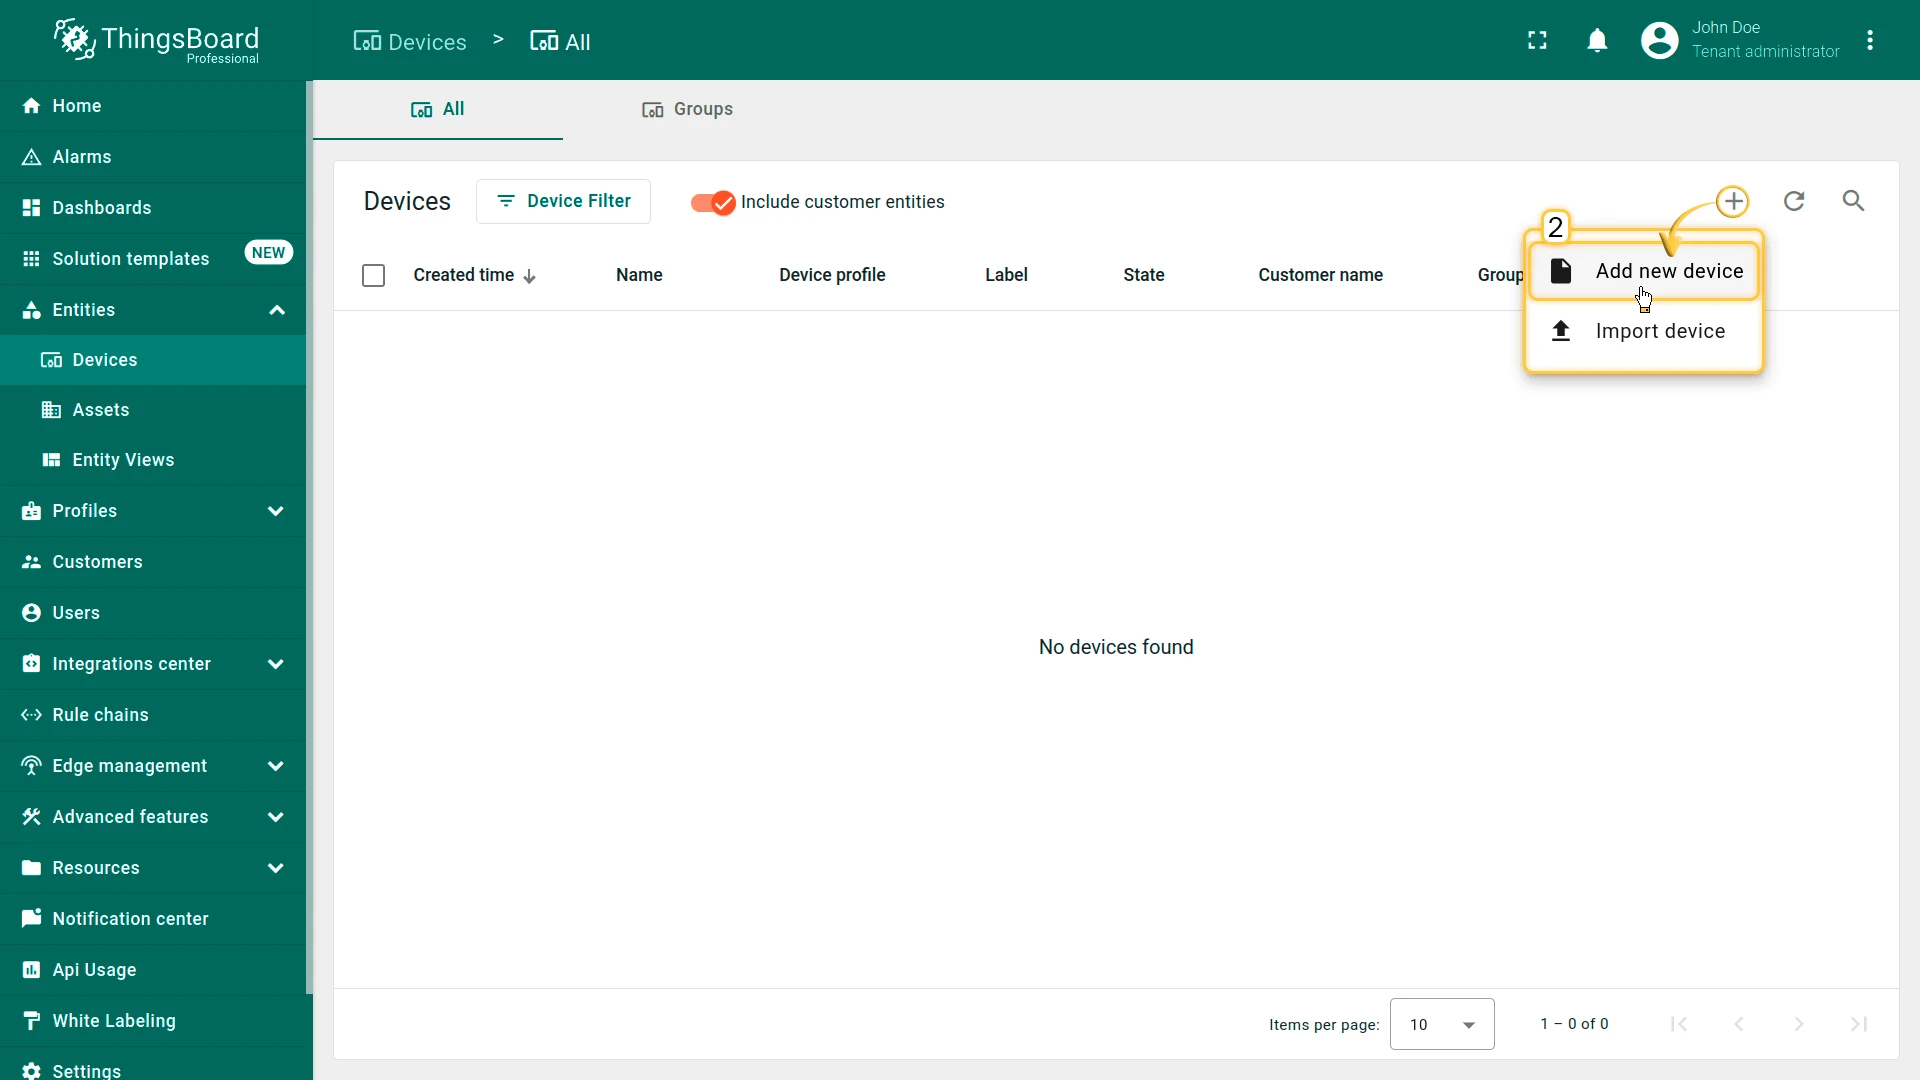
- By default, you navigate to the device group “All”. Click the “+” button in the top-right corner and select Add new device.
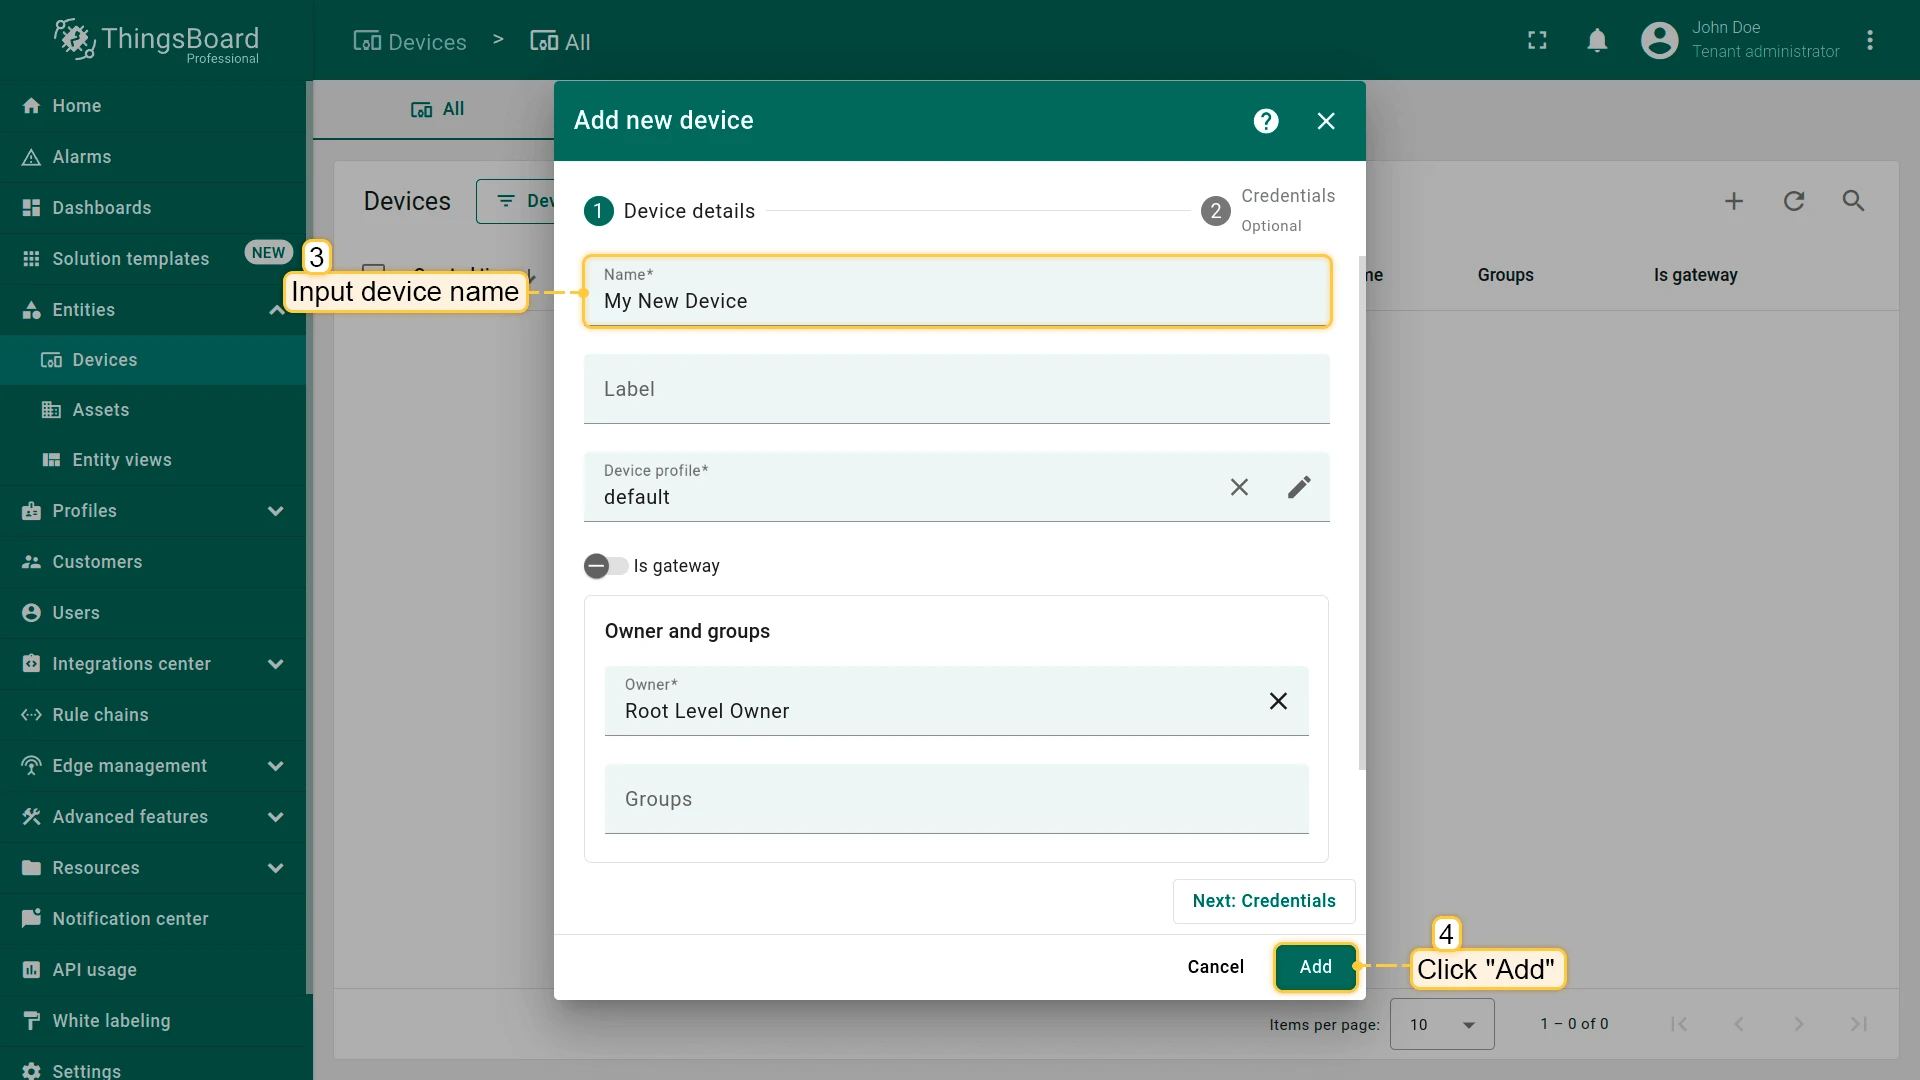
- Enter a device name, for example “My Device”. You can leave all other fields with their default values. Click Add to add the device.
- Your first device has been added.
Install required libraries and tools
To install the thingsboard-python-client-sdk, use the command below.
We recommend installing packages outside the global environment:
pip3 install tb-mqtt-clientAlso, you should have tools that allow editing code. For example, you can use the Nano editor, which comes pre-installed, or install any other code editor you prefer.
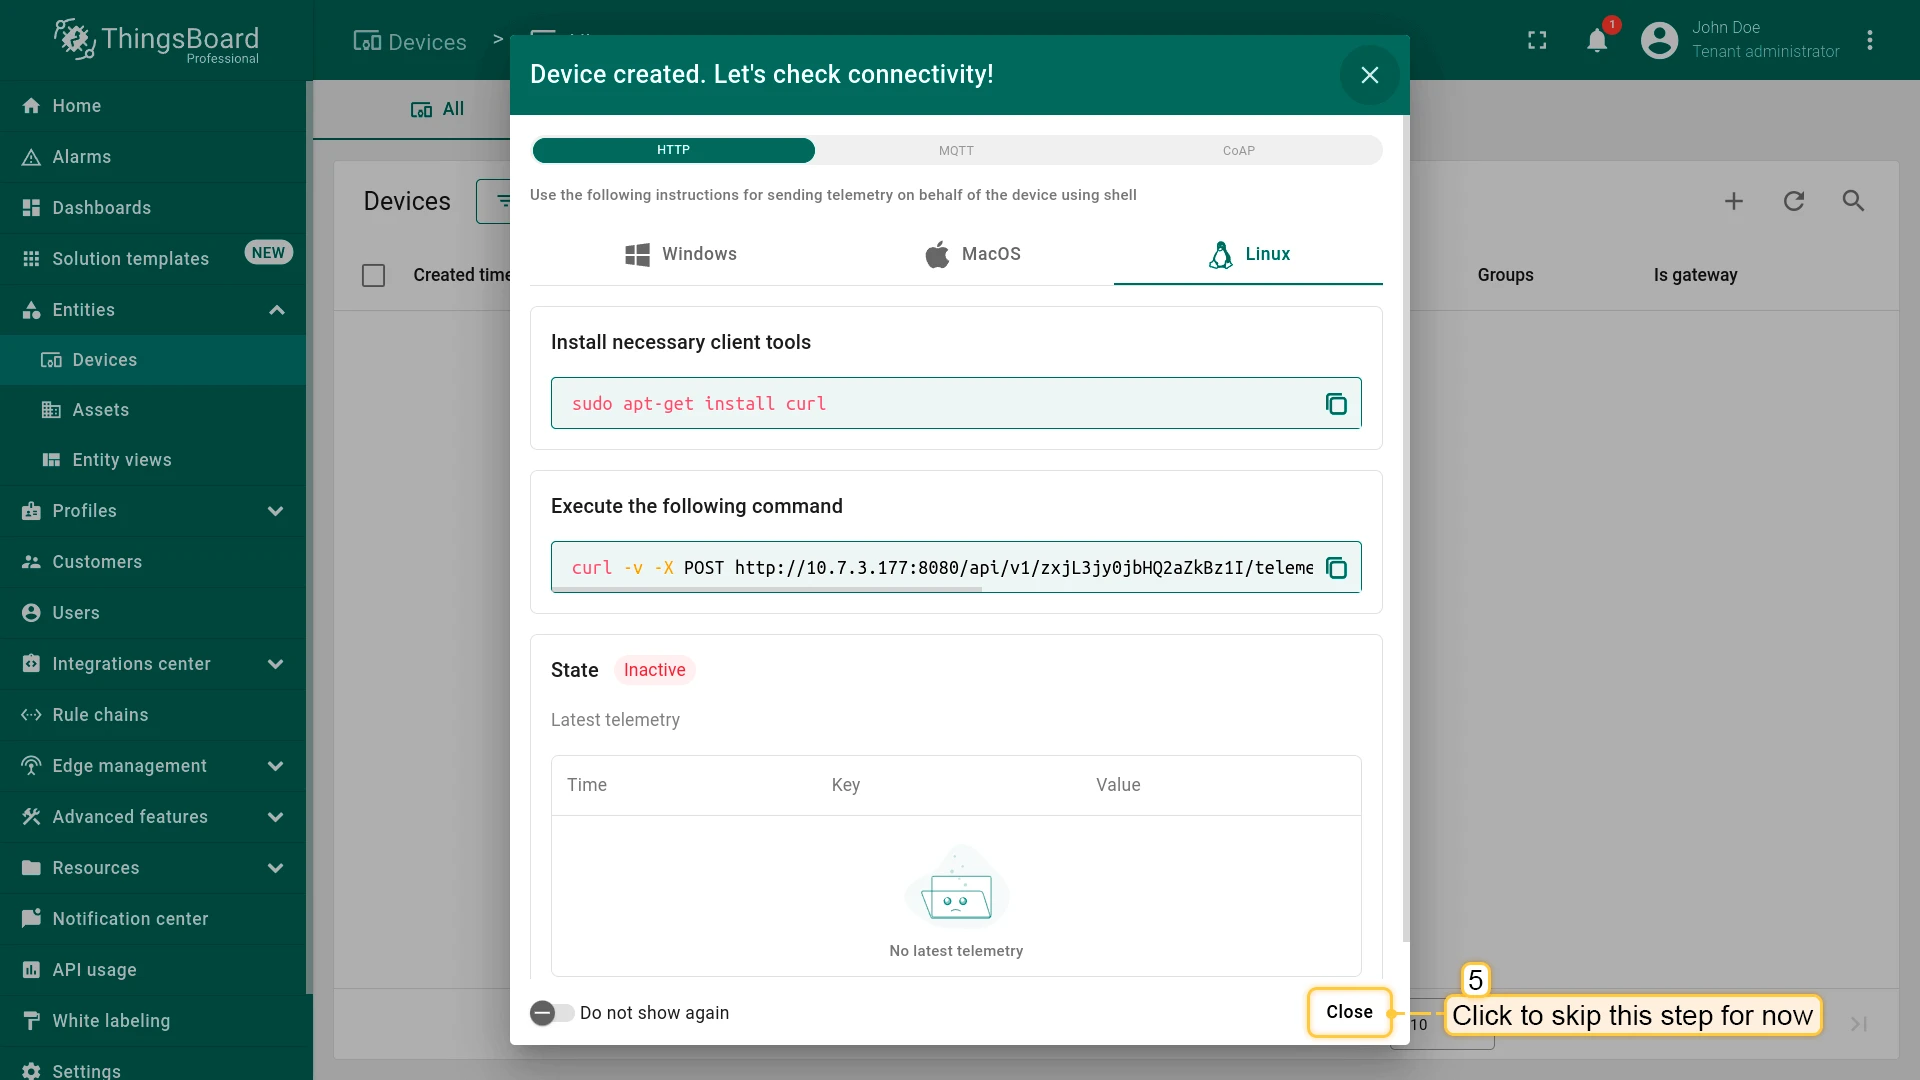
Connect device to ThingsBoard
To connect your device, you’ll first need to get its credentials. While ThingsBoard supports a variety of device credentials, for this guide, we will use the default auto-generated credentials, which is an access token.
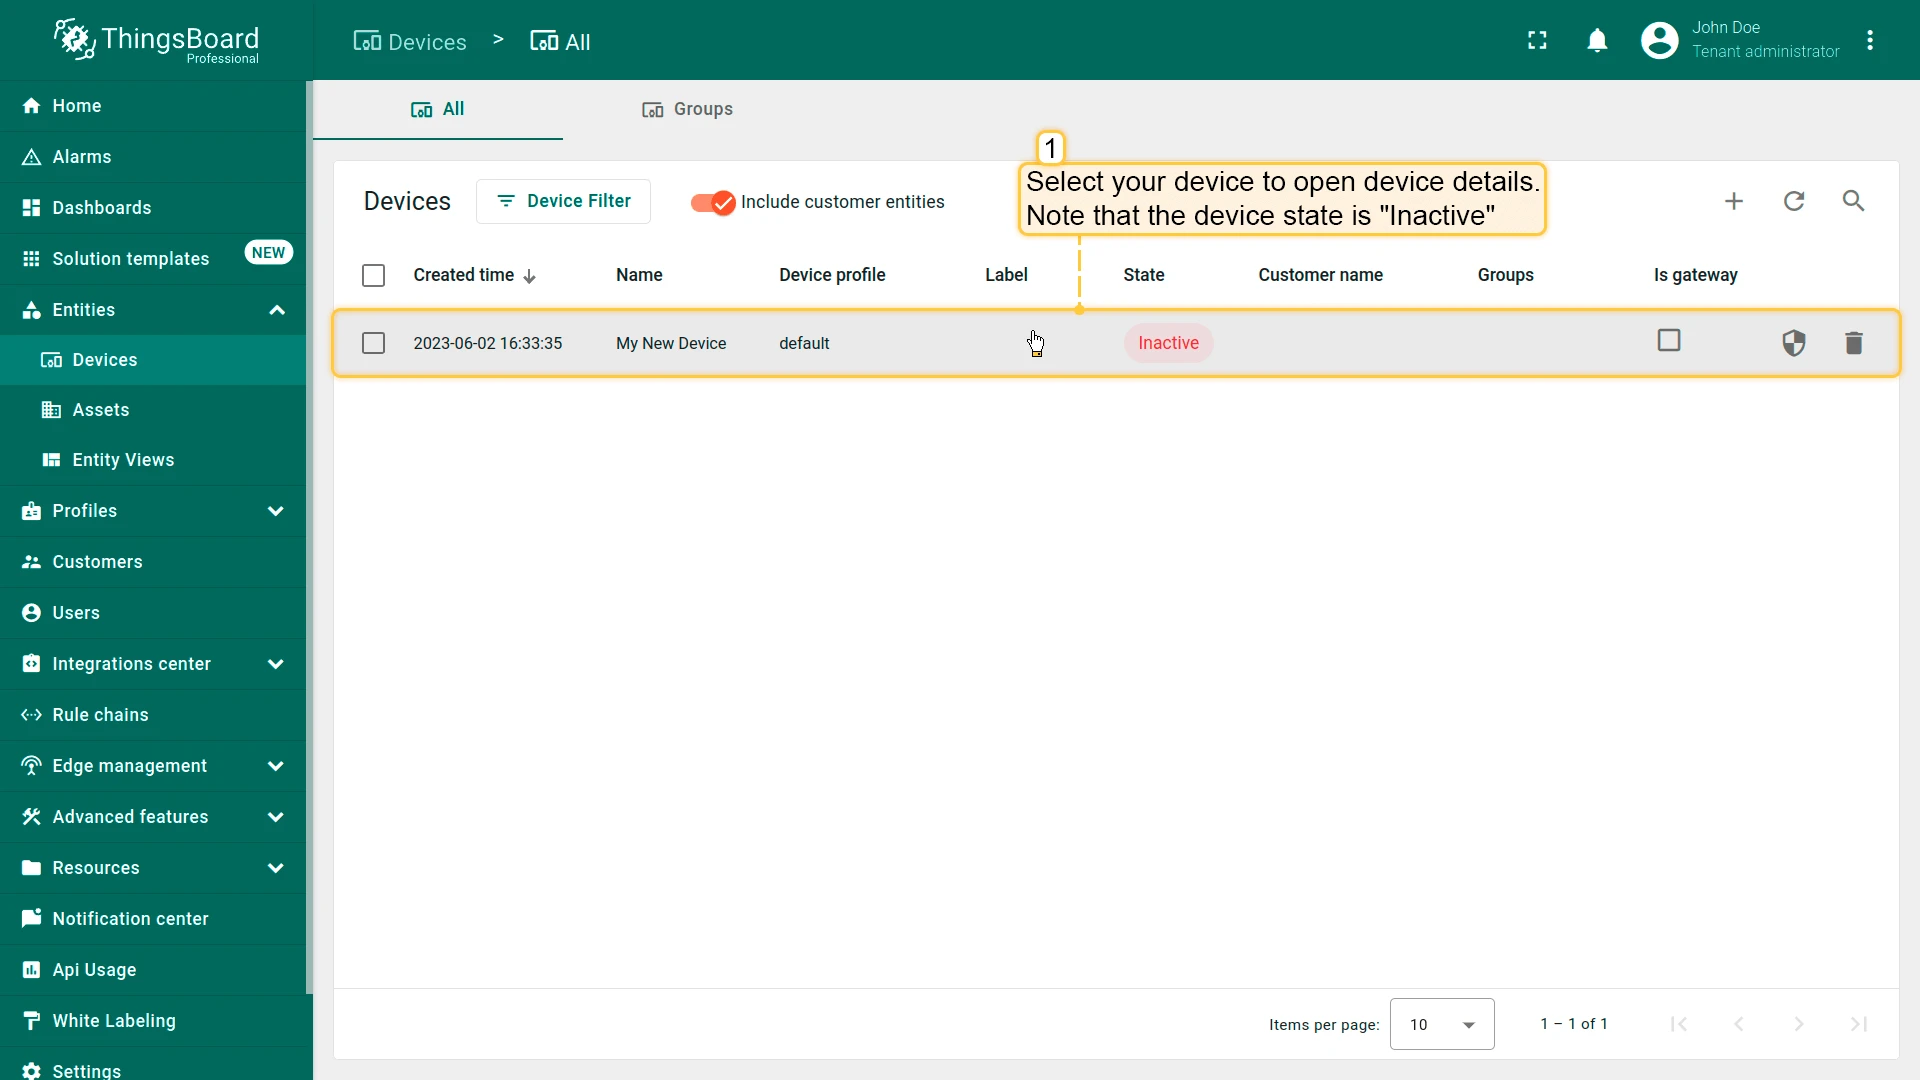
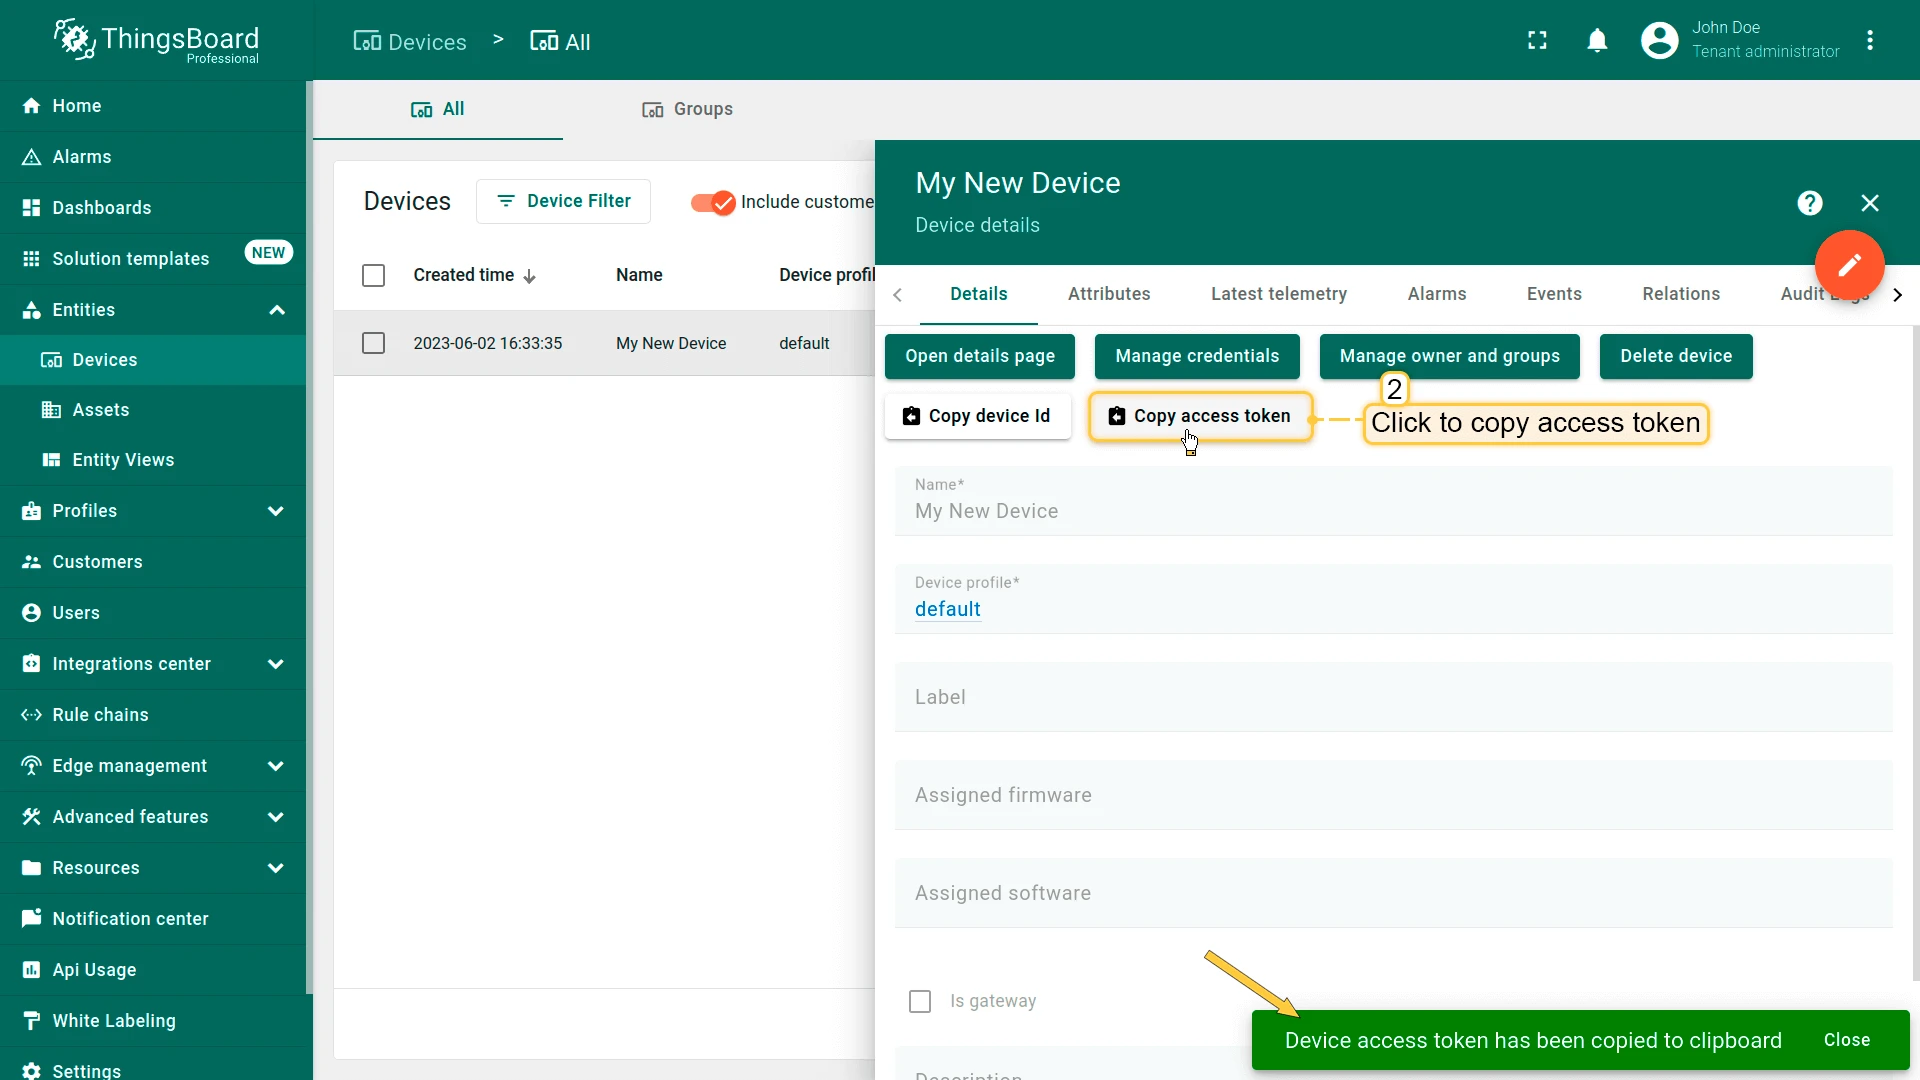
- Click on the device row in the table to open device details.
- Click “Copy access token”. The token will be copied to your clipboard. Please save it in a safe place.
Now you are ready to publish telemetry data on behalf of your device. We will use, as mentioned before, the
thingsboard-python-client-sdk library.
Let’s set up our project:
-
Create project folder:
Terminal window mkdir thingsboard_example && cd thingsboard_example -
Install packages:
Terminal window pip3 install tb-mqtt-client -
Create the main script:
Terminal window nano main.py -
Copy and paste the following code:
import logging.handlersimport timeimport osfrom tb_gateway_mqtt import TBDeviceMqttClientACCESS_TOKEN = "TEST_TOKEN"THINGSBOARD_SERVER = 'YOUR_TB_HOST'logging.basicConfig(level=logging.DEBUG)client = None# default blinking periodperiod = 1.0# callback function that will call when we will change value of our Shared Attributedef attribute_callback(result, _):print(result)# make sure that you paste YOUR shared attribute nameperiod = result.get('blinkingPeriod', 1.0)# callback function that will call when we will send RPCdef rpc_callback(id, request_body):# request body contains method and other parametersprint(request_body)method = request_body.get('method')if method == 'getTelemetry':attributes, telemetry = get_data()client.send_attributes(attributes)client.send_telemetry(telemetry)else:print('Unknown method: ' + method)def get_data():cpu_usage = round(float(os.popen('''grep 'cpu ' /proc/stat | awk '{usage=($2+$4)*100/($2+$4+$5)} END {print usage }' ''').readline().replace('\n', '').replace(',', '.')), 2)ip_address = os.popen('''hostname -I''').readline().replace('\n', '').replace(',', '.')[:-1]mac_address = os.popen('''cat /sys/class/net/*/address''').readline().replace('\n', '').replace(',', '.')processes_count = os.popen('''ps -Al | grep -c bash''').readline().replace('\n', '').replace(',', '.')[:-1]swap_memory_usage = os.popen("free -m | grep Swap | awk '{print ($3/$2)*100}'").readline().replace('\n', '').replace(',', '.')[:-1]ram_usage = float(os.popen("free -m | grep Mem | awk '{print ($3/$2) * 100}'").readline().replace('\n', '').replace(',', '.')[:-1])st = os.statvfs('/')used = (st.f_blocks - st.f_bfree) * st.f_frsizeboot_time = os.popen('uptime -p').read()[:-1]avg_load = (cpu_usage + ram_usage) / 2attributes = {'ip_address': ip_address,'macaddress': mac_address}telemetry = {'cpu_usage': cpu_usage,'processes_count': processes_count,'disk_usage': used,'RAM_usage': ram_usage,'swap_memory_usage': swap_memory_usage,'boot_time': boot_time,'avg_load': avg_load}print(attributes, telemetry)return attributes, telemetry# request attribute callbackdef sync_state(result, exception=None):global periodif exception is not None:print("Exception: " + str(exception))else:period = result.get('shared', {'blinkingPeriod': 1.0})['blinkingPeriod']def main():global clientclient = TBDeviceMqttClient(THINGSBOARD_SERVER, username=ACCESS_TOKEN)client.connect()client.request_attributes(shared_keys=['blinkingPeriod'], callback=sync_state)# now attribute_callback will process shared attribute request from serversub_id_1 = client.subscribe_to_attribute("blinkingPeriod", attribute_callback)sub_id_2 = client.subscribe_to_all_attributes(attribute_callback)# now rpc_callback will process rpc requests from serverclient.set_server_side_rpc_request_handler(rpc_callback)while not client.stopped:attributes, telemetry = get_data()client.send_attributes(attributes)client.send_telemetry(telemetry)time.sleep(60)if __name__=='__main__':if ACCESS_TOKEN != "TEST_TOKEN":main()else:print("Please change the ACCESS_TOKEN variable to match your device access token and run script again.")
In the code above, change values for the following variables - THINGSBOARD_SERVER, ACCESS_TOKEN to your credentials.
Necessary variables for connection:
| Variable name | Default value | Description |
|---|---|---|
| ACCESS_TOKEN | TEST_TOKEN | Your device access token |
| THINGSBOARD_SERVER | YOUR_TB_HOST | Your ThingsBoard host or ip address. |
-
Click Ctrl+O and Ctrl+X keys to save the file.
-
And finally, let’s start our script:
Terminal window python3 main.py
If you did everything right, you should see the following console output:
> INFO:tb_device_mqtt:connection SUCCESS>>> {'ip_address': '192.168.1.198', 'macaddress': '3c:06:30:44:e0:24'} {'cpu_usage': 6.6, 'processes_count': 8, 'disk_usage': 70.0, 'RAM_usage': 73.9, 'swap_memory_usage': 69.4, 'battery': 29, 'boot_time': 1675154176.0}>Let’s review and make an explanation for our code. In this step, we are interested in the get_data function.
Data packing and returning in the get_data function, so you can easily add new telemetry or attributes to the dictionary if you want to monitor more values:
...def get_data():       cpu_usage = round(float(os.popen('''grep 'cpu ' /proc/stat | awk '{usage=($2+$4)*100/($2+$4+$5)} END {print usage }' ''').readline().replace('\n', '').replace(',', '.')), 2)       ip_address = os.popen('''hostname -I''').readline().replace('\n', '').replace(',', '.')[:-1]       mac_address = os.popen('''cat /sys/class/net/*/address''').readline().replace('\n', '').replace(',', '.')       processes_count = os.popen('''ps -Al | grep -c bash''').readline().replace('\n', '').replace(',', '.')[:-1]       swap_memory_usage = os.popen("free -m | grep Swap | awk '{print ($3/$2)*100}'").readline().replace('\n', '').replace(',', '.')[:-1]       ram_usage = float(os.popen("free -m | grep Mem | awk '{print ($3/$2) * 100}'").readline().replace('\n', '').replace(',', '.')[:-1])       st = os.statvfs('/')       used = (st.f_blocks - st.f_bfree) * st.f_frsize       boot_time = os.popen('uptime -p').read()[:-1]       avg_load = (cpu_usage + ram_usage) / 2
       attributes = {           'ip_address': ip_address,           'macaddress': mac_address       }       telemetry = {           'cpu_usage': cpu_usage,           'processes_count': processes_count,           'disk_usage': used,           'RAM_usage': ram_usage,           'swap_memory_usage': swap_memory_usage,           'boot_time': boot_time,           'avg_load': avg_load       }       print(attributes, telemetry)       return attributes, telemetry...
Send data part, as you can see below, we send our attributes and telemetry data every 60 seconds (feel free to change it if you want more frequent data updating):
... while not client.stopped: attributes, telemetry = get_data() client.send_attributes(attributes) client.send_telemetry(telemetry) time.sleep(60)...Synchronize device state using client and shared attribute requests
The example code includes functionality to retrieve the device state from ThingsBoard during boot. The relevant code sections are shown below.
Attribute callback:
def sync_state(result, exception=None): global period if exception is not None: print("Exception: " + str(exception)) else: period = result.get('shared', {'blinkingPeriod': 1.0})['blinkingPeriod']Attribute request:
def main(): client = TBDeviceMqttClient("YOUR_TB_HOST", username="ACCESS_TOKEN") client.connect() client.request_attributes(shared_keys=['blinkingPeriod'], callback=sync_state) ...In order for the callback to receive the shared attribute data from ThingsBoard, the device must explicitly request it after connecting. This functionality allows the device to restore the correct attribute values after a reboot, preserving the actual state.
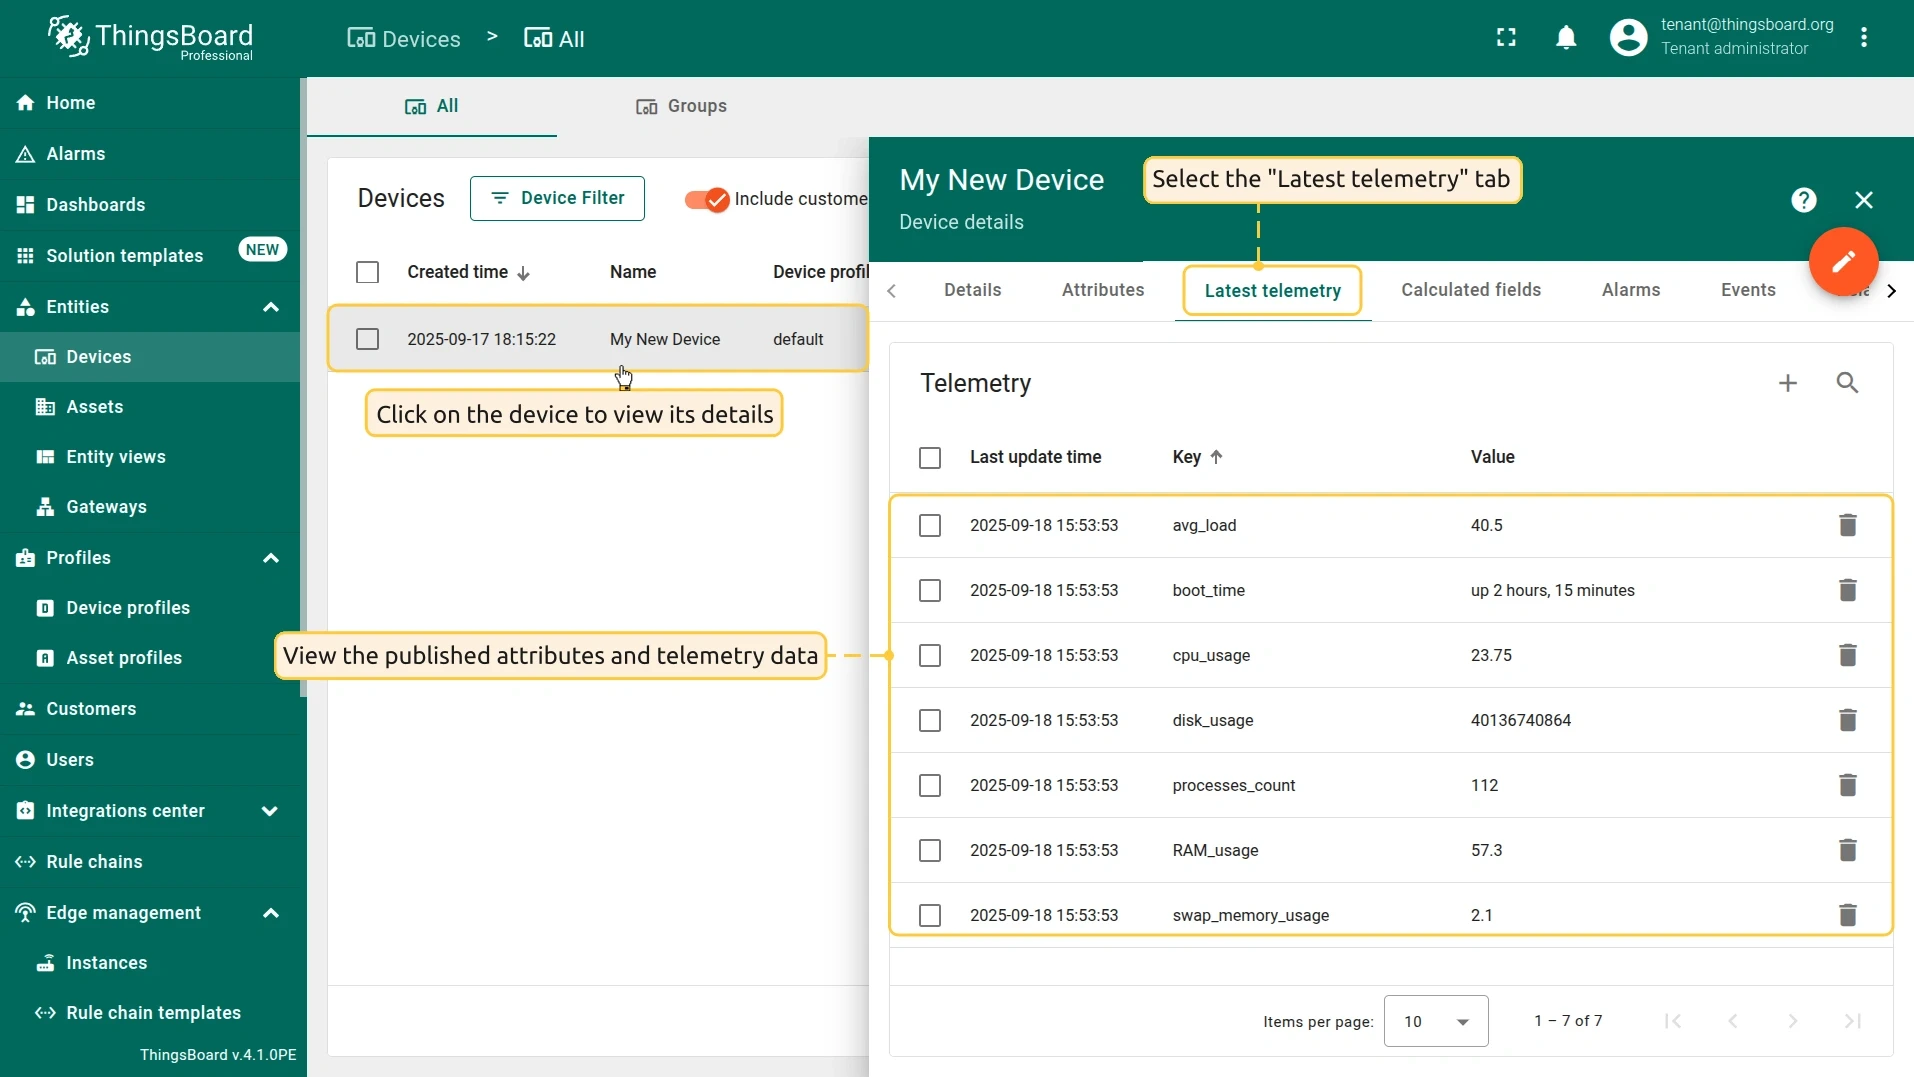
Check data on ThingsBoard
After successfully publishing the attributes and telemetry, the data should appear right away in the “Latest telemetry” tab:
- Click on the device to open the Device details page and select the “Latest telemetry” tab.
Let’s also display the single-board computer’s attributes and telemetry on a dashboard. To do this, you can either create your own dashboard using custom widgets or import a ready-made one.
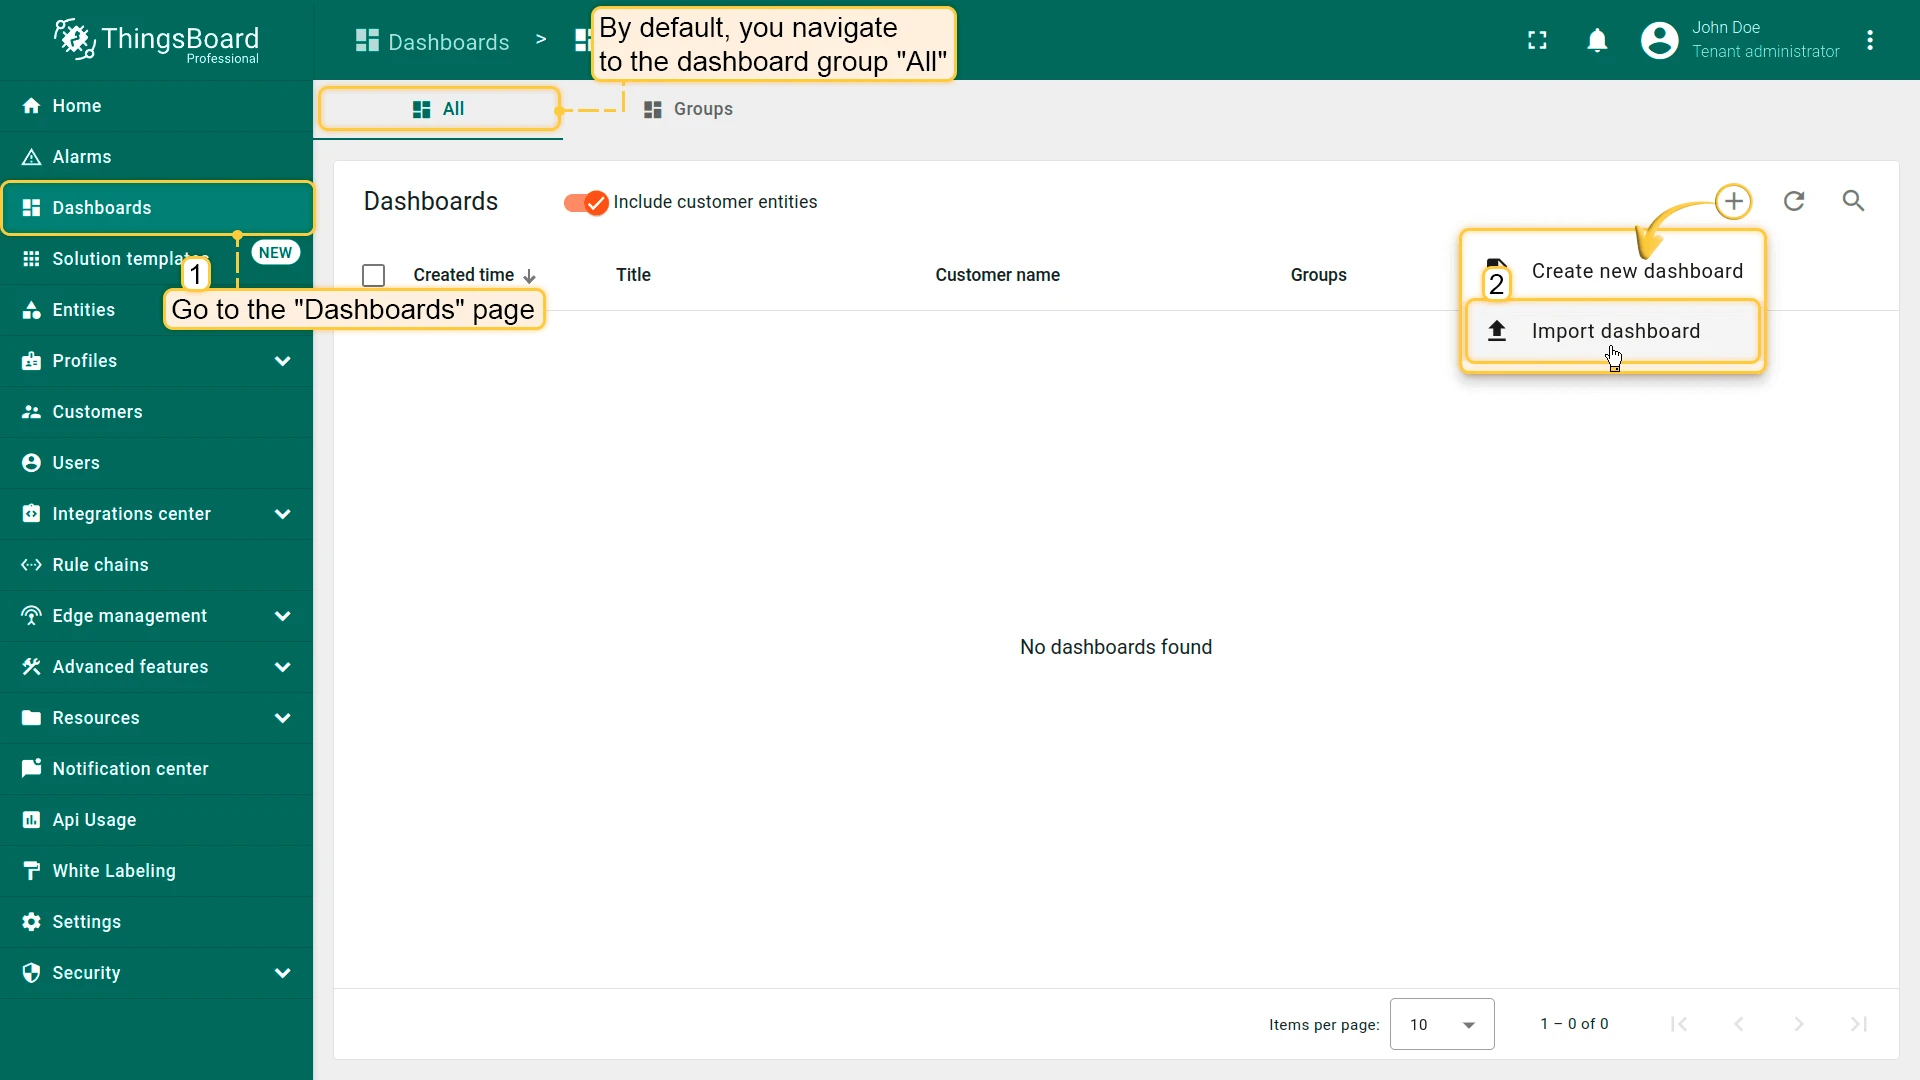
Import dashboard
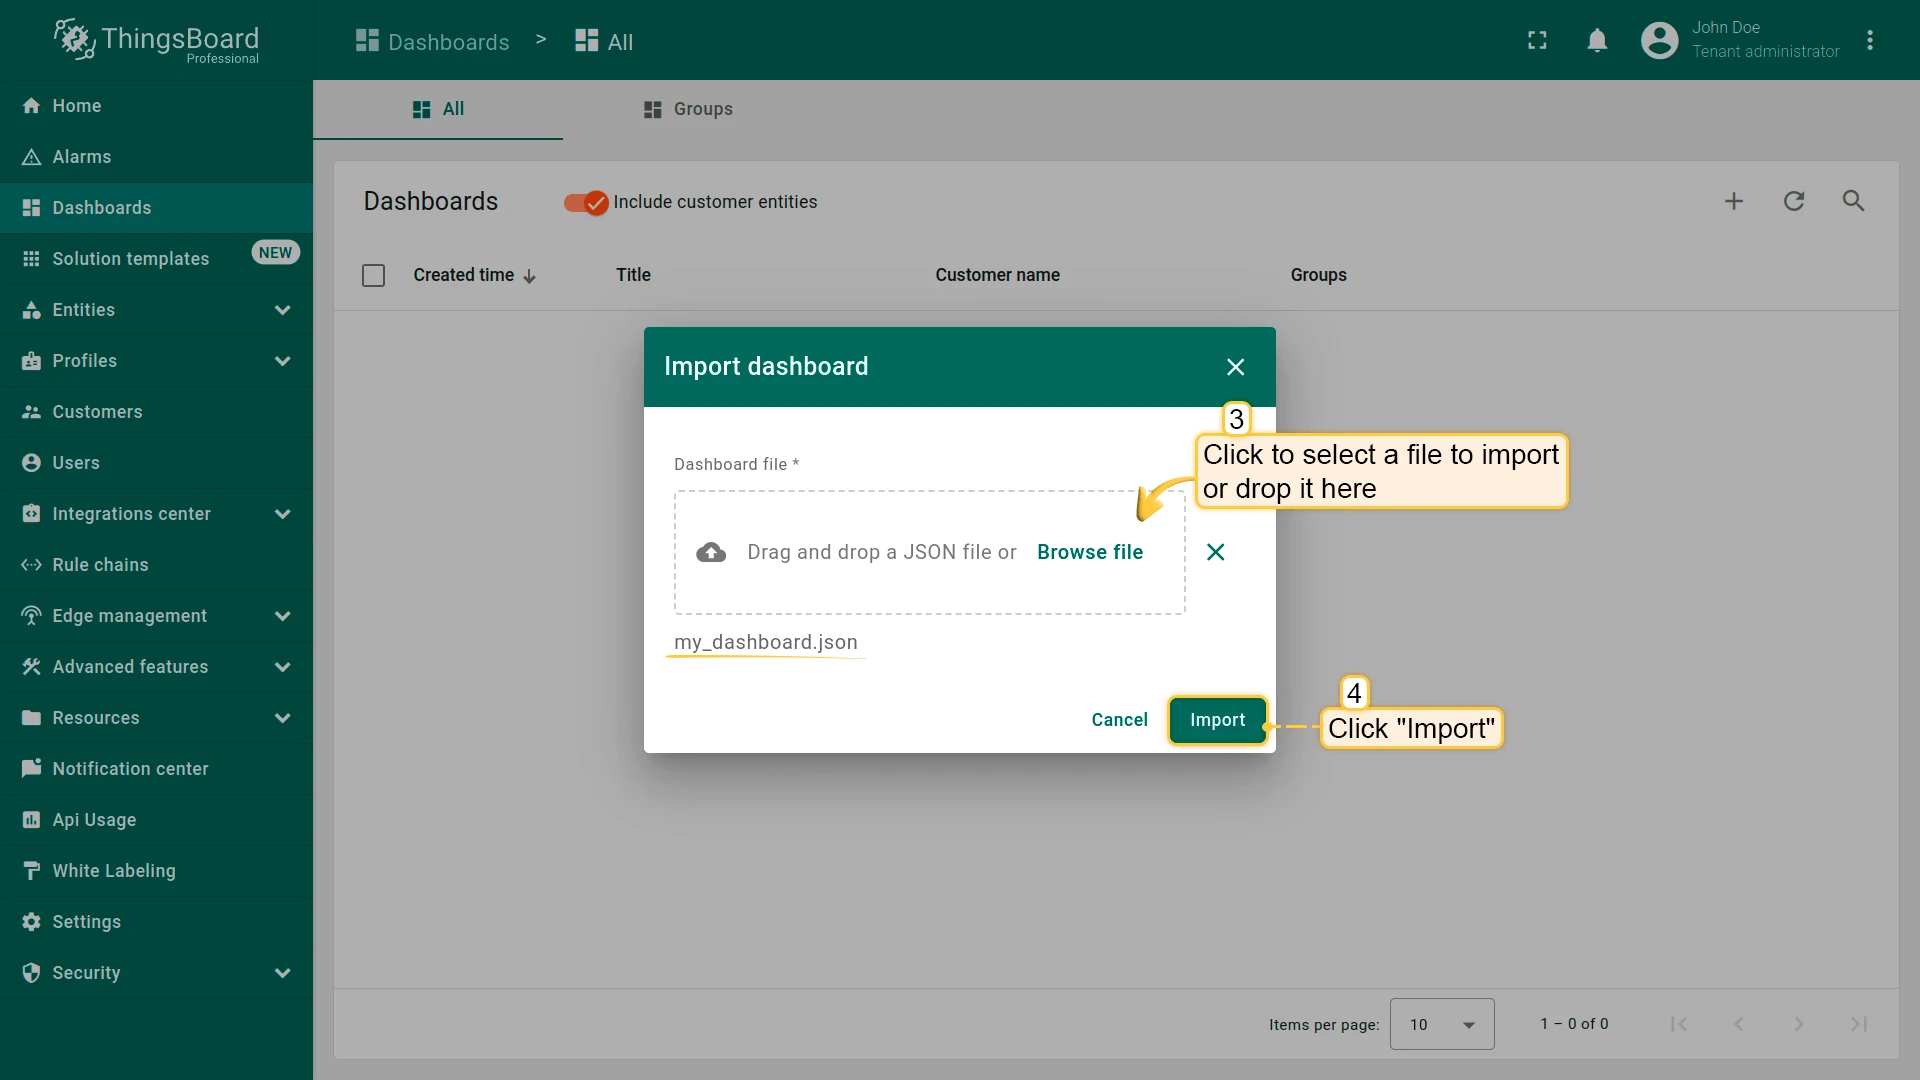
You are able to import a dashboard in JSON format. To import a dashboard, you should go to the Dashboard group and click the “+” button in the upper right corner of the page and choose “Import dashboard”. The dashboard import window should pop up, and you will be prompted to upload the JSON file and click “Import”.
Below, you can find the dashboard JSON file:
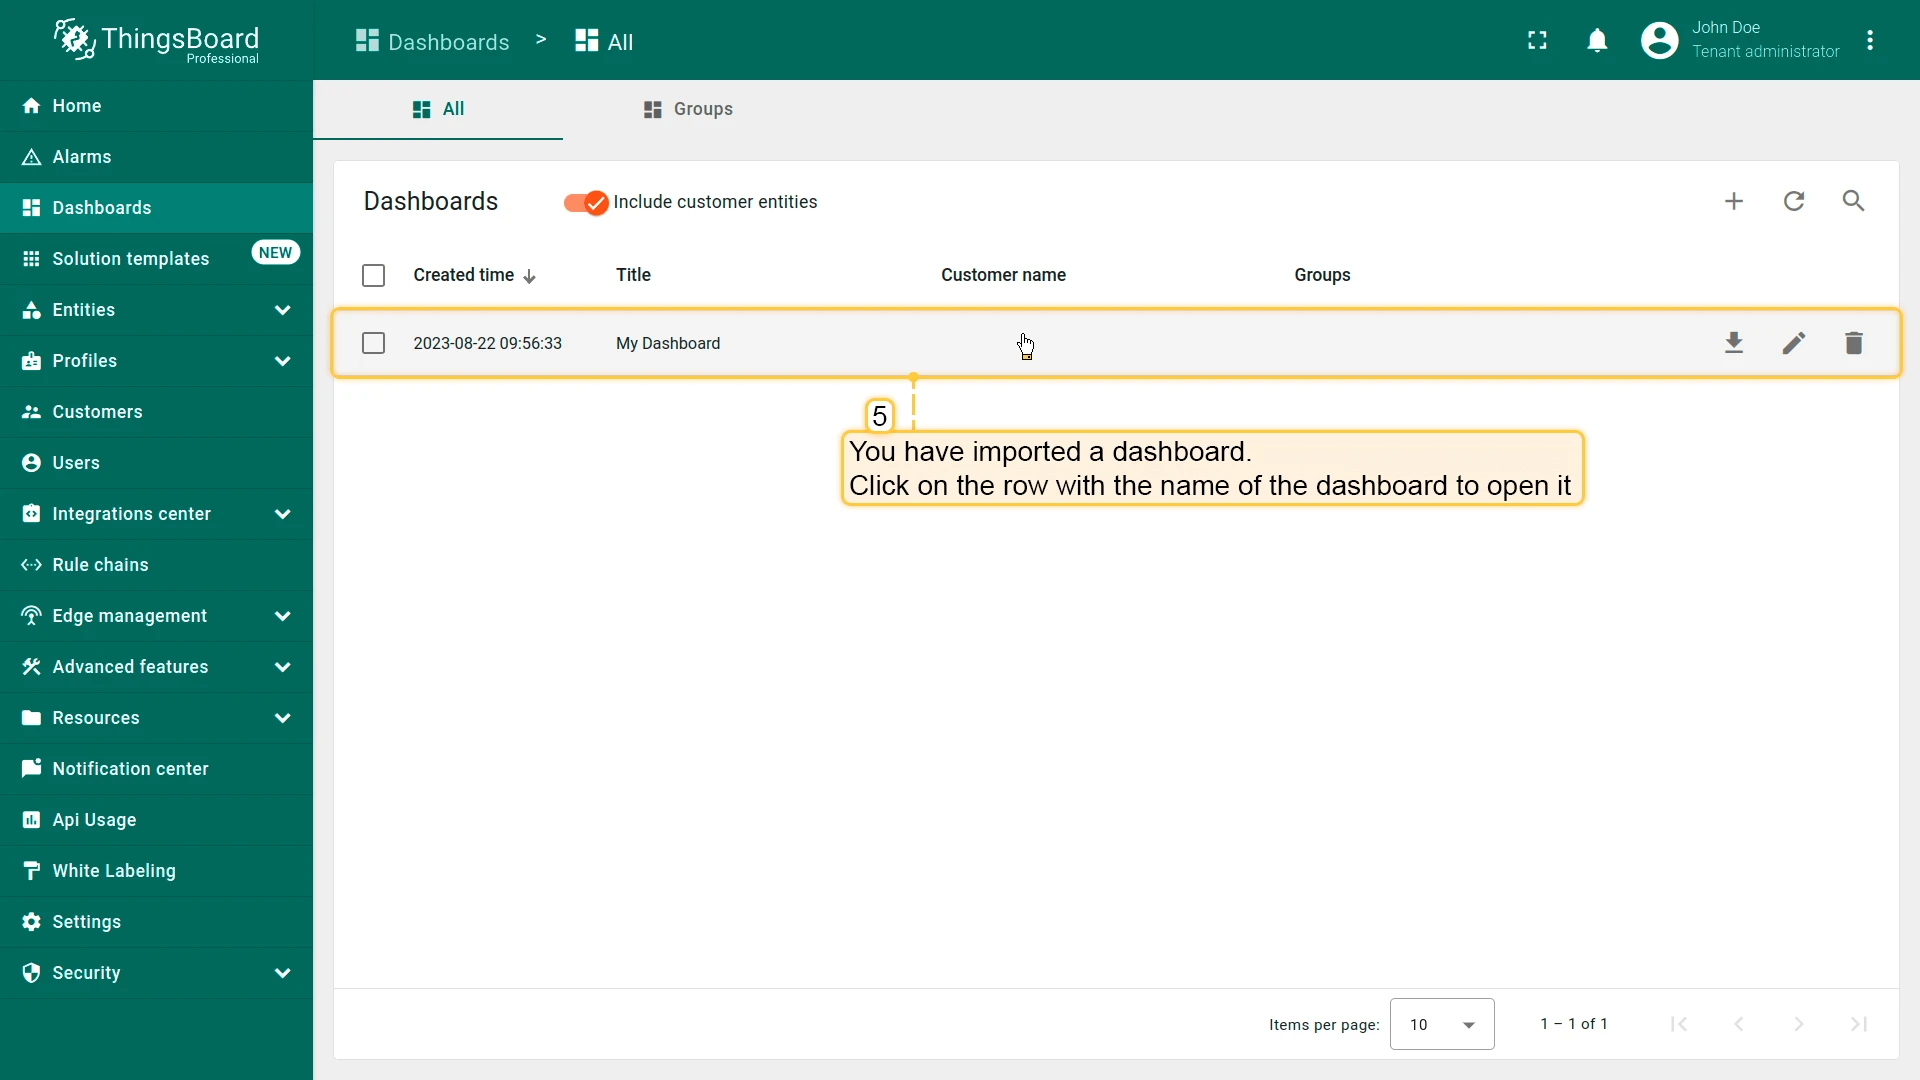
Check and control device data dashboardAfter importing, we should choose an entity alias for our device. To do this - we need to press the pen icon and select entity aliases, select alias “My device” and open it for editing by pressing the pen icon. Then, choose a device with name My device from dropdown list and save entity alias. Now, you should be able to see the data from the device.
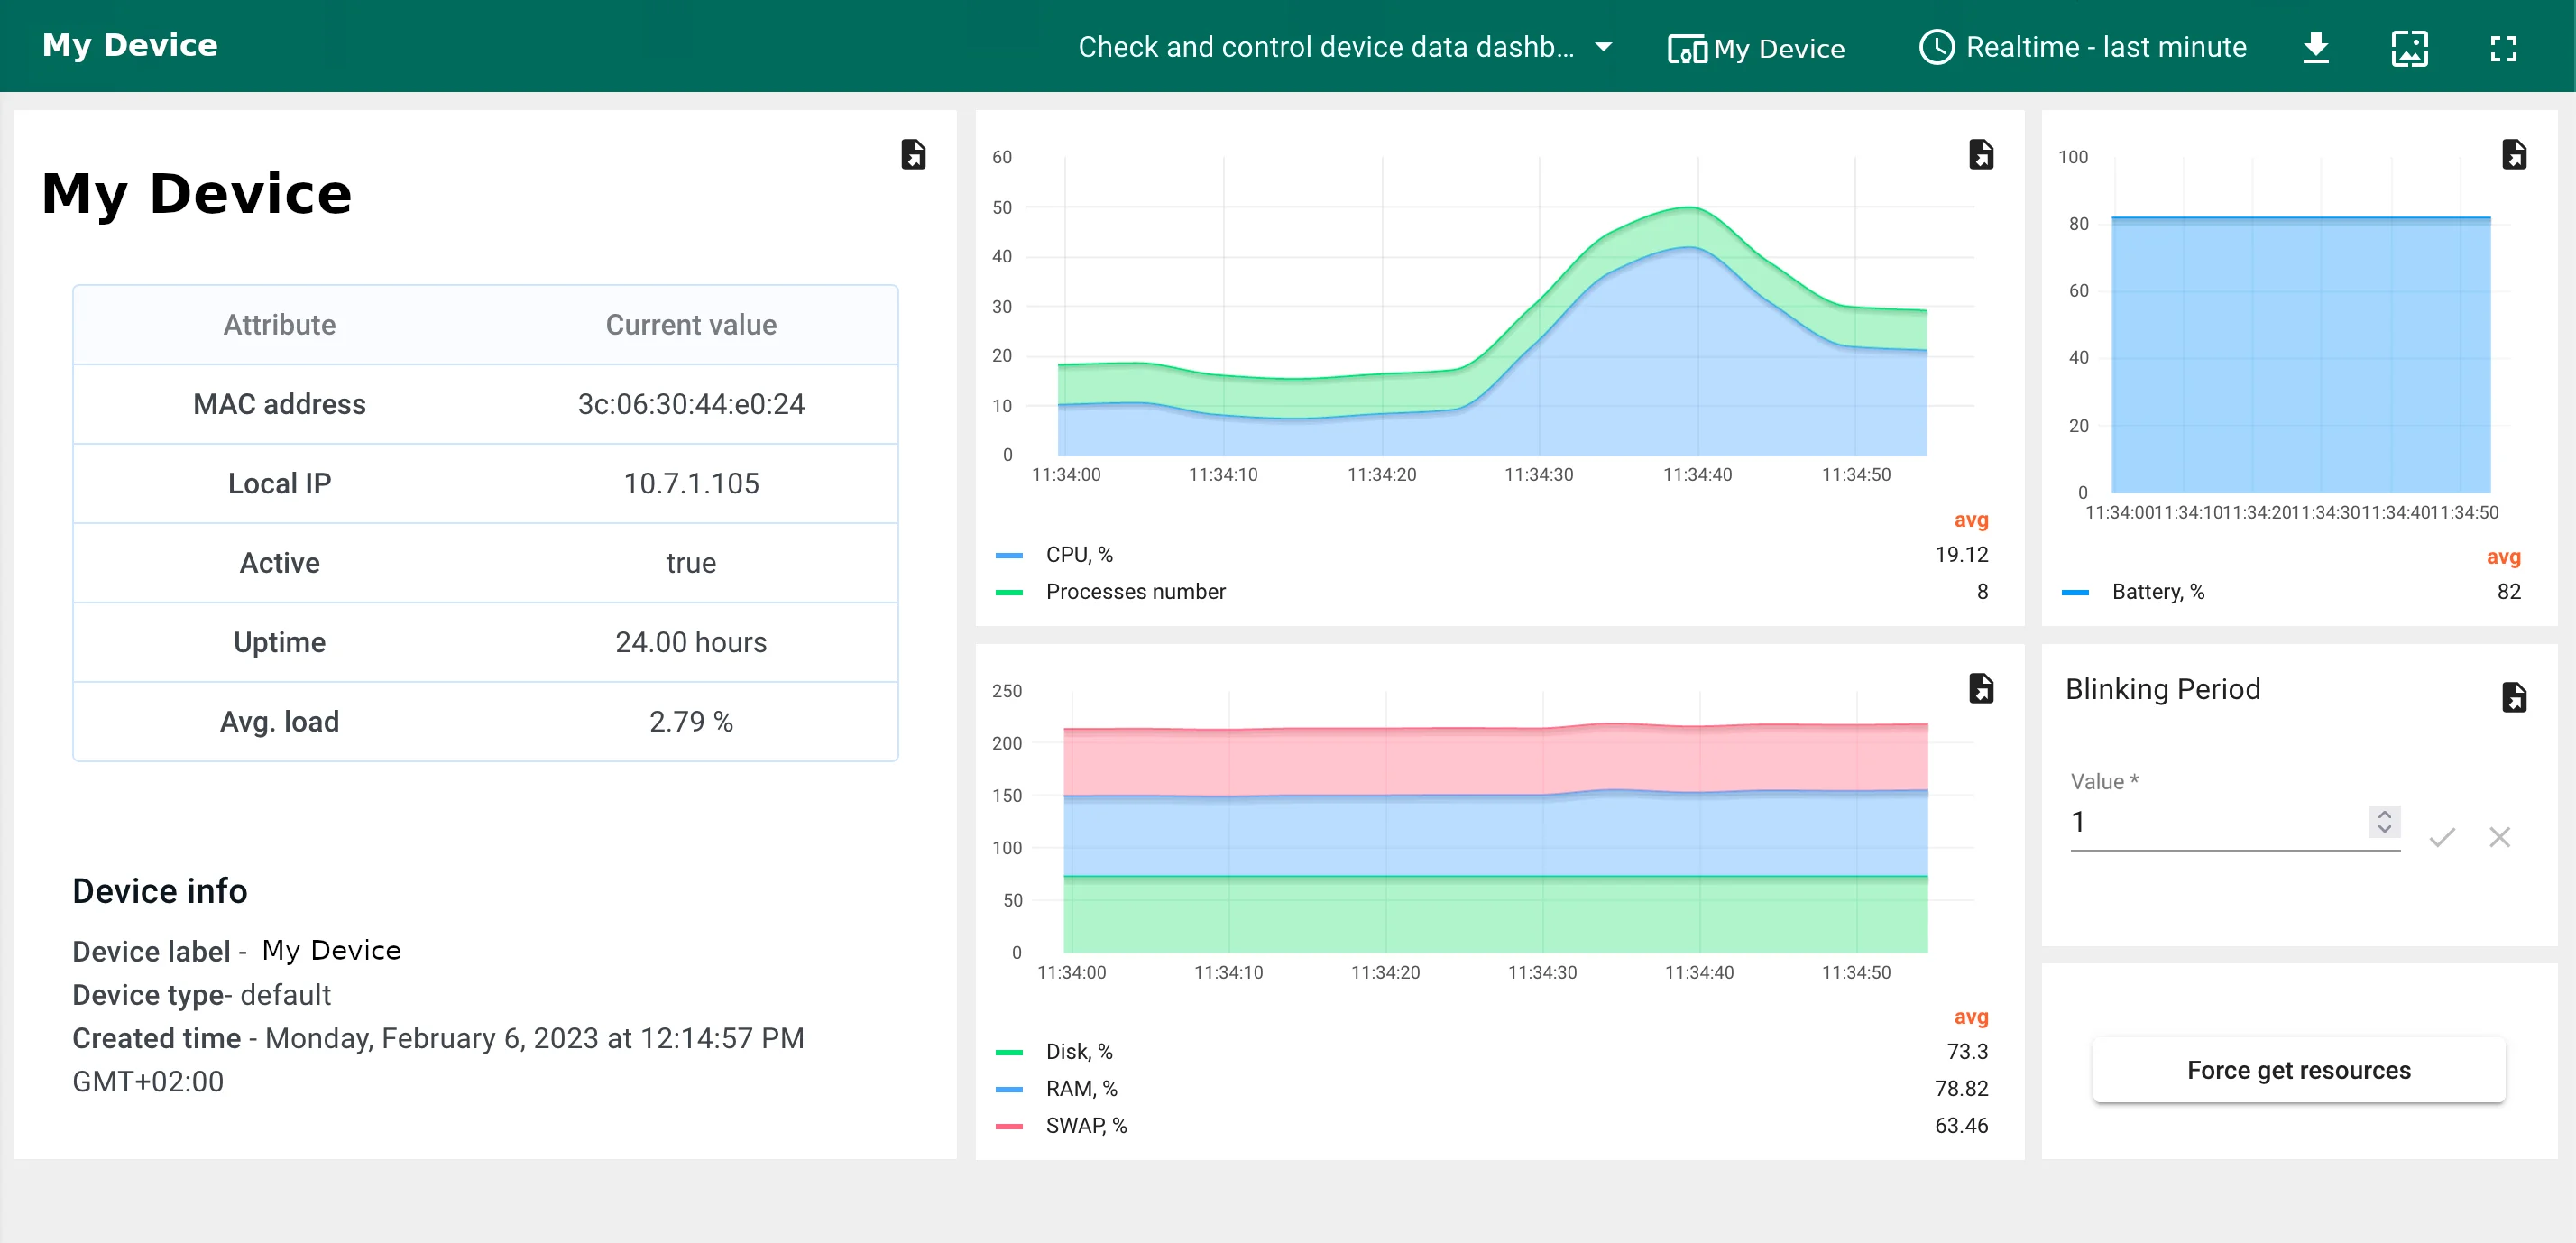
If you did everything right, you have to see the following dashboard:
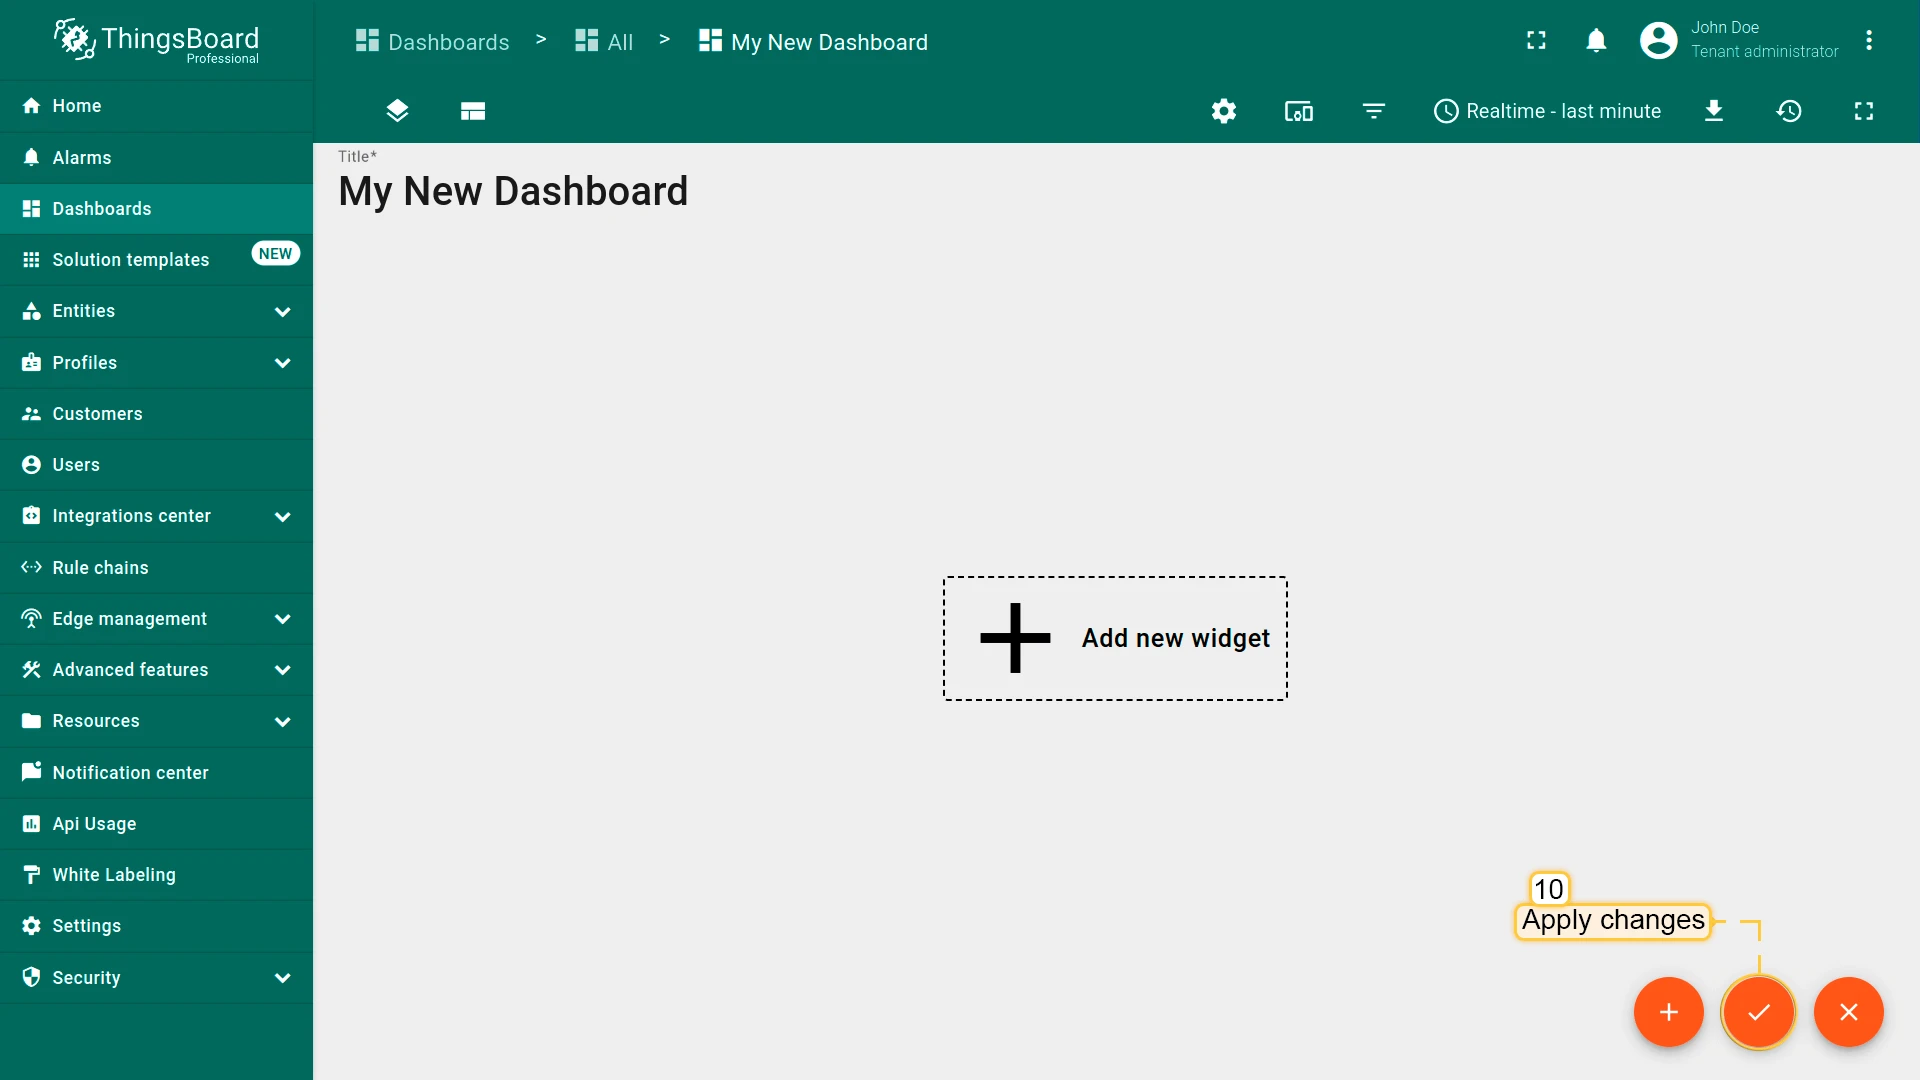
Create a New Dashboard
We will create a dashboard and add the most popular widgets. See the instructions below.
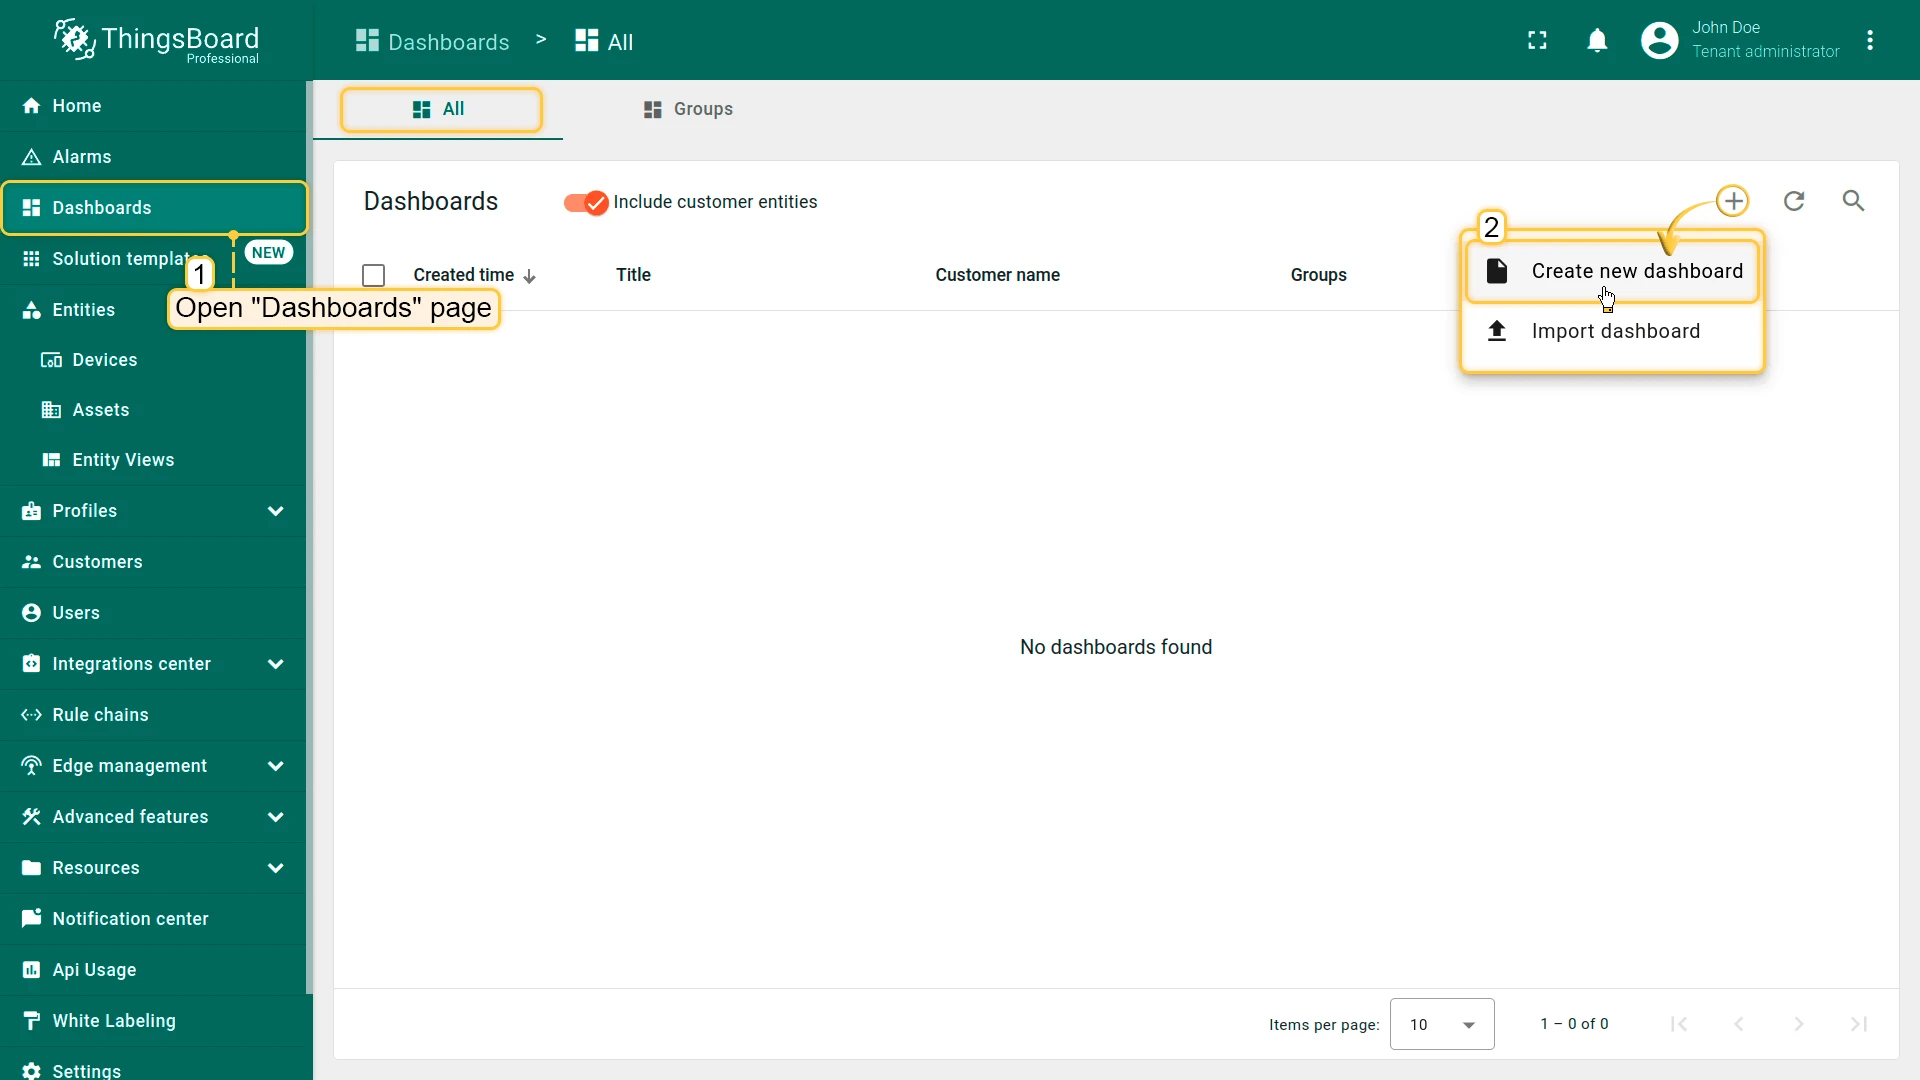
- Open the Dashboards page. Click on the ”+” icon in the top right corner. Select “Create new dashboard”
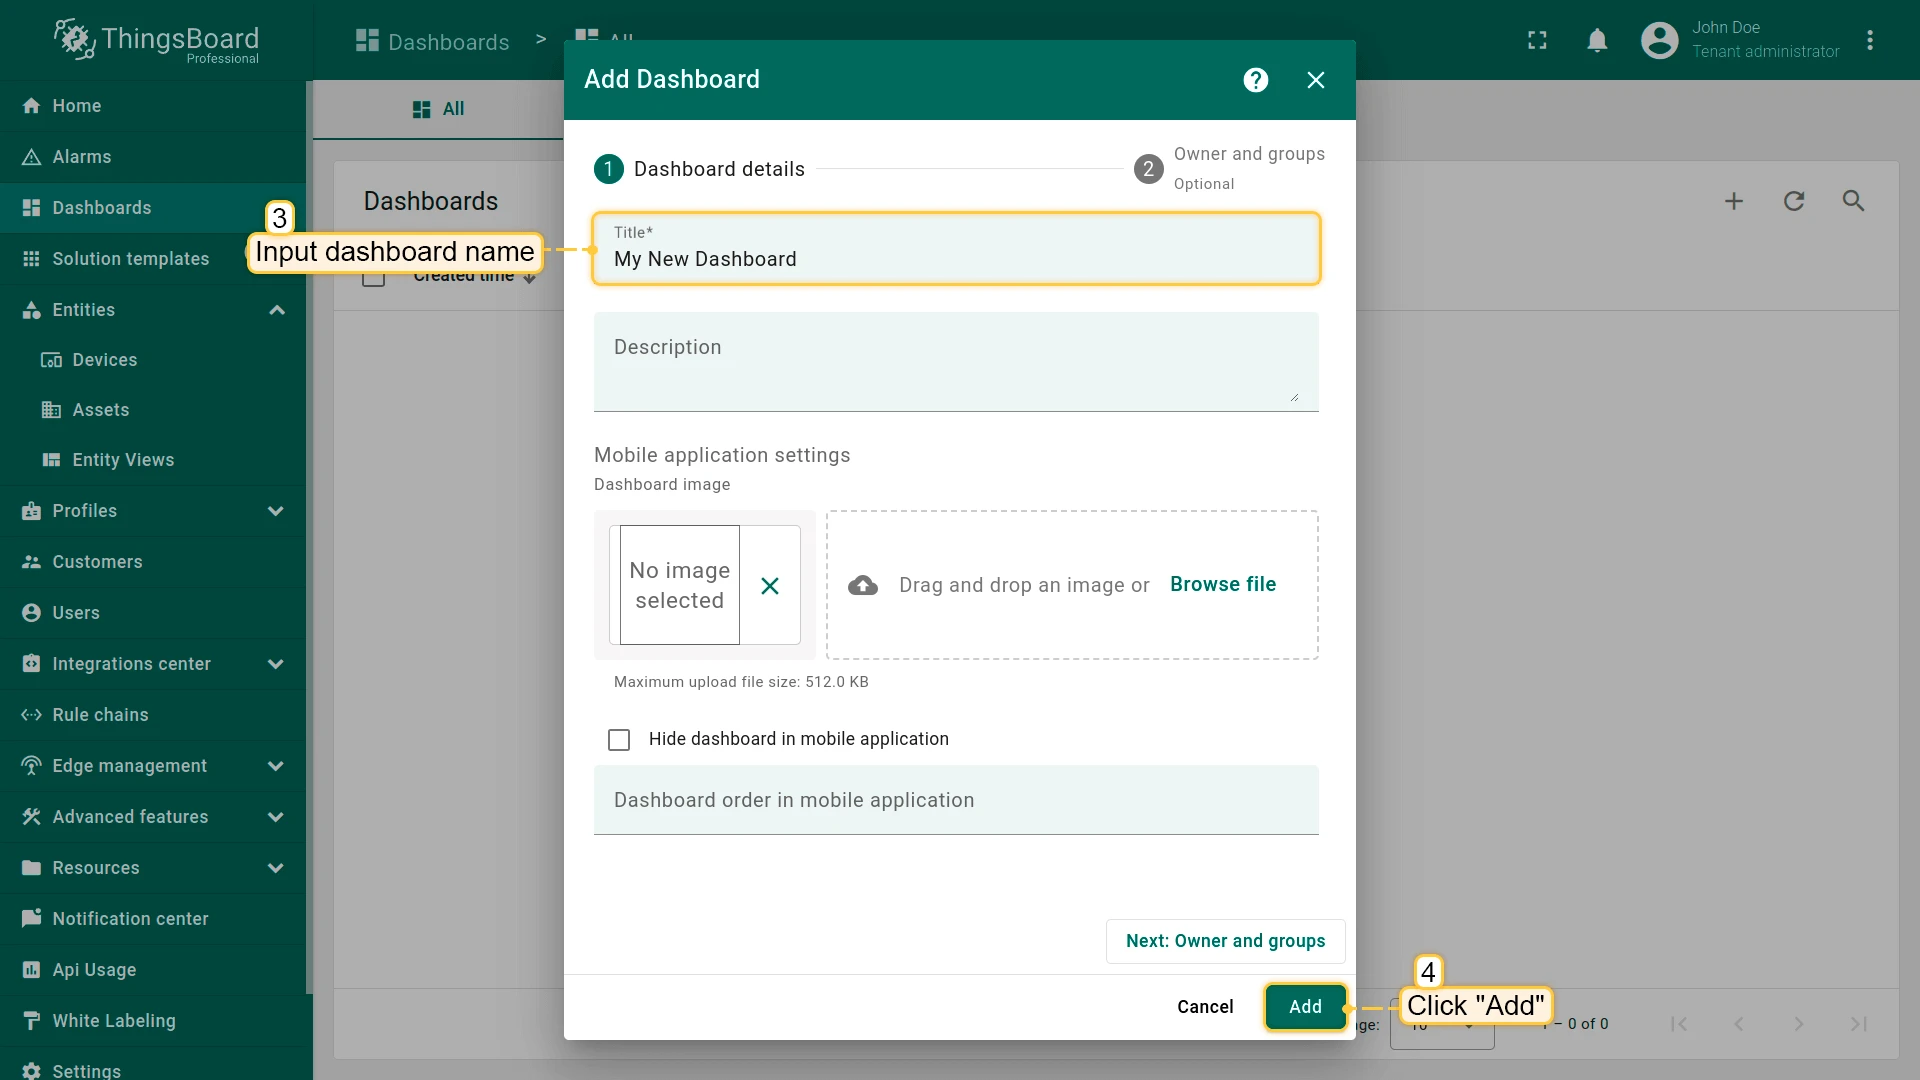
- Input dashboard name. For example, “My New Dashboard”. Click “Add” to add the dashboard
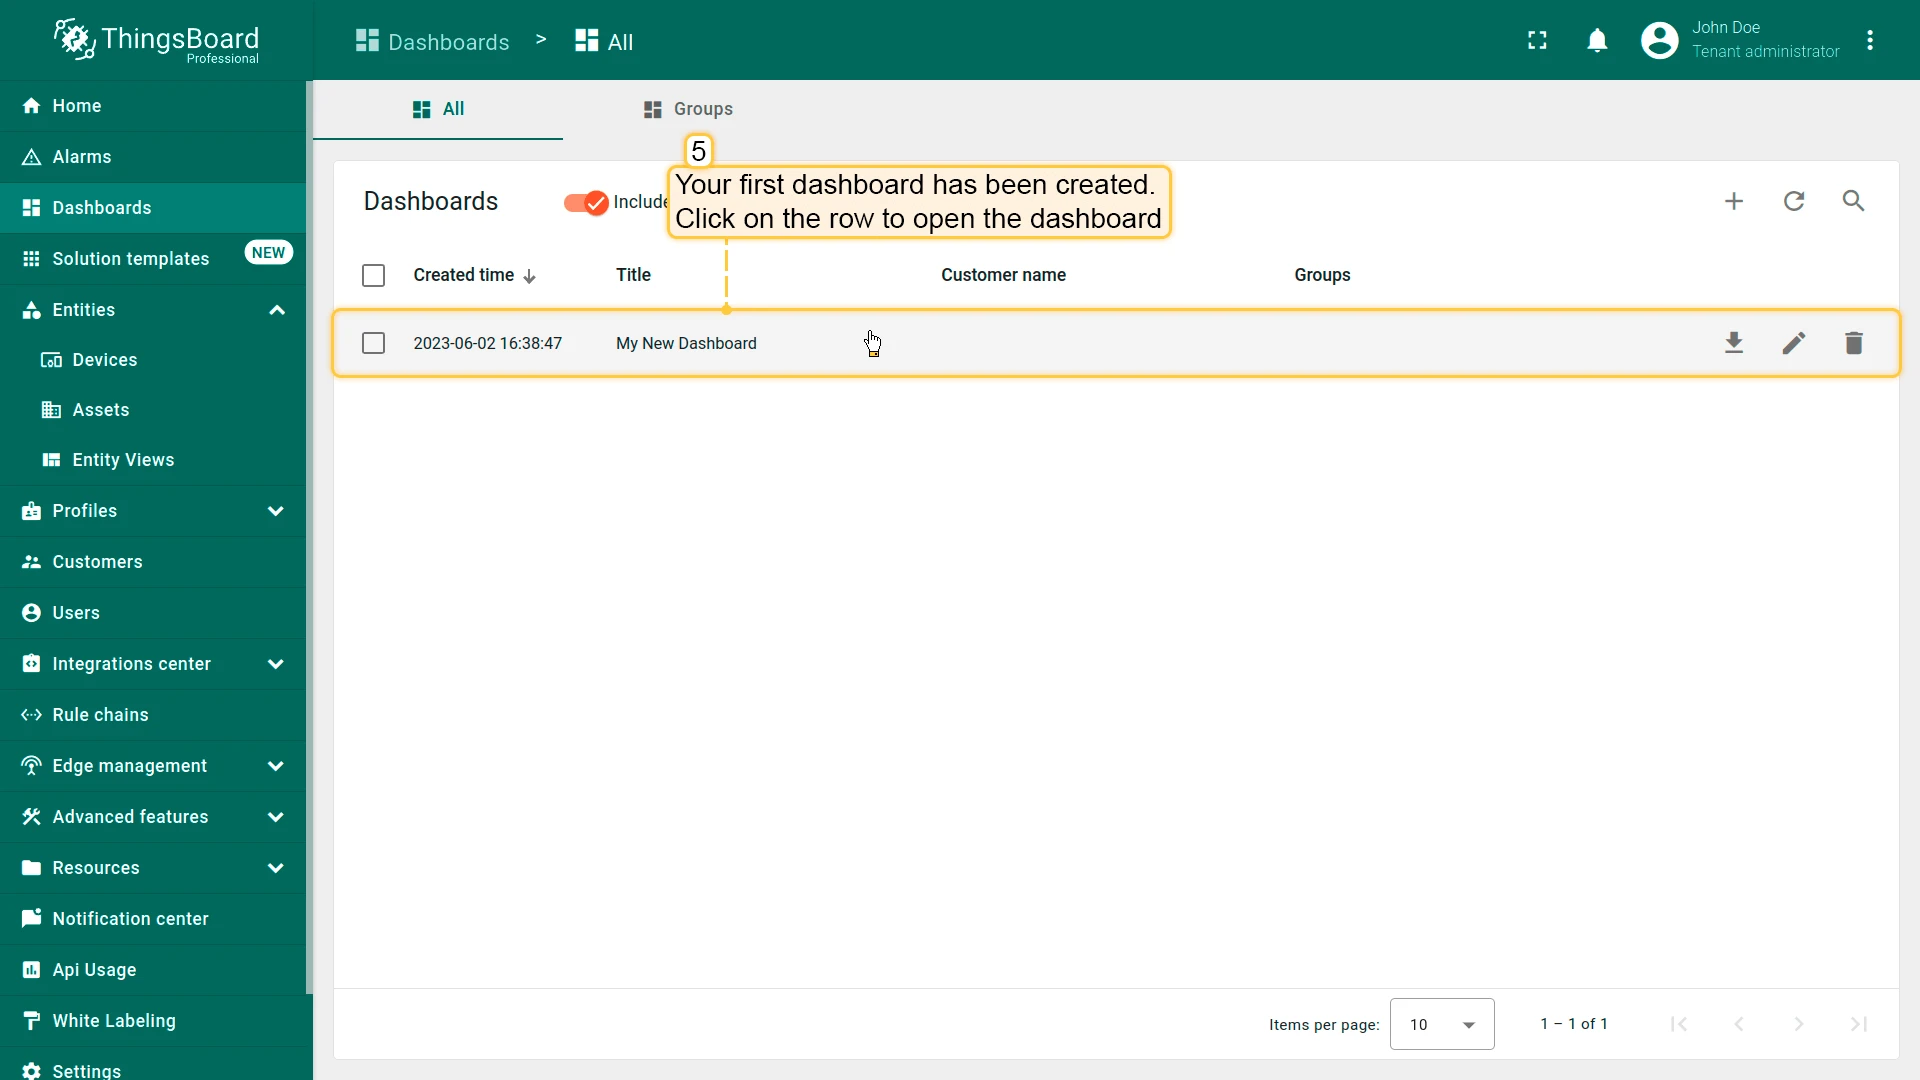
- Your dashboard should be listed first since the table sorts dashboards using the time of the creation by default. Click on the “Open dashboard” icon.
Add Entity Alias
Alias is a reference to a single entity or group of entities that are used in the widgets. An alias may be static or dynamic. We will use the ‘Single entity’ alias, referring to a single entity. In this case, ‘Rock Pi 4 Model B ’. It is possible to configure an alias that references multiple devices. For example, devices of a certain type or related to a certain asset. You may learn more about different aliases here.
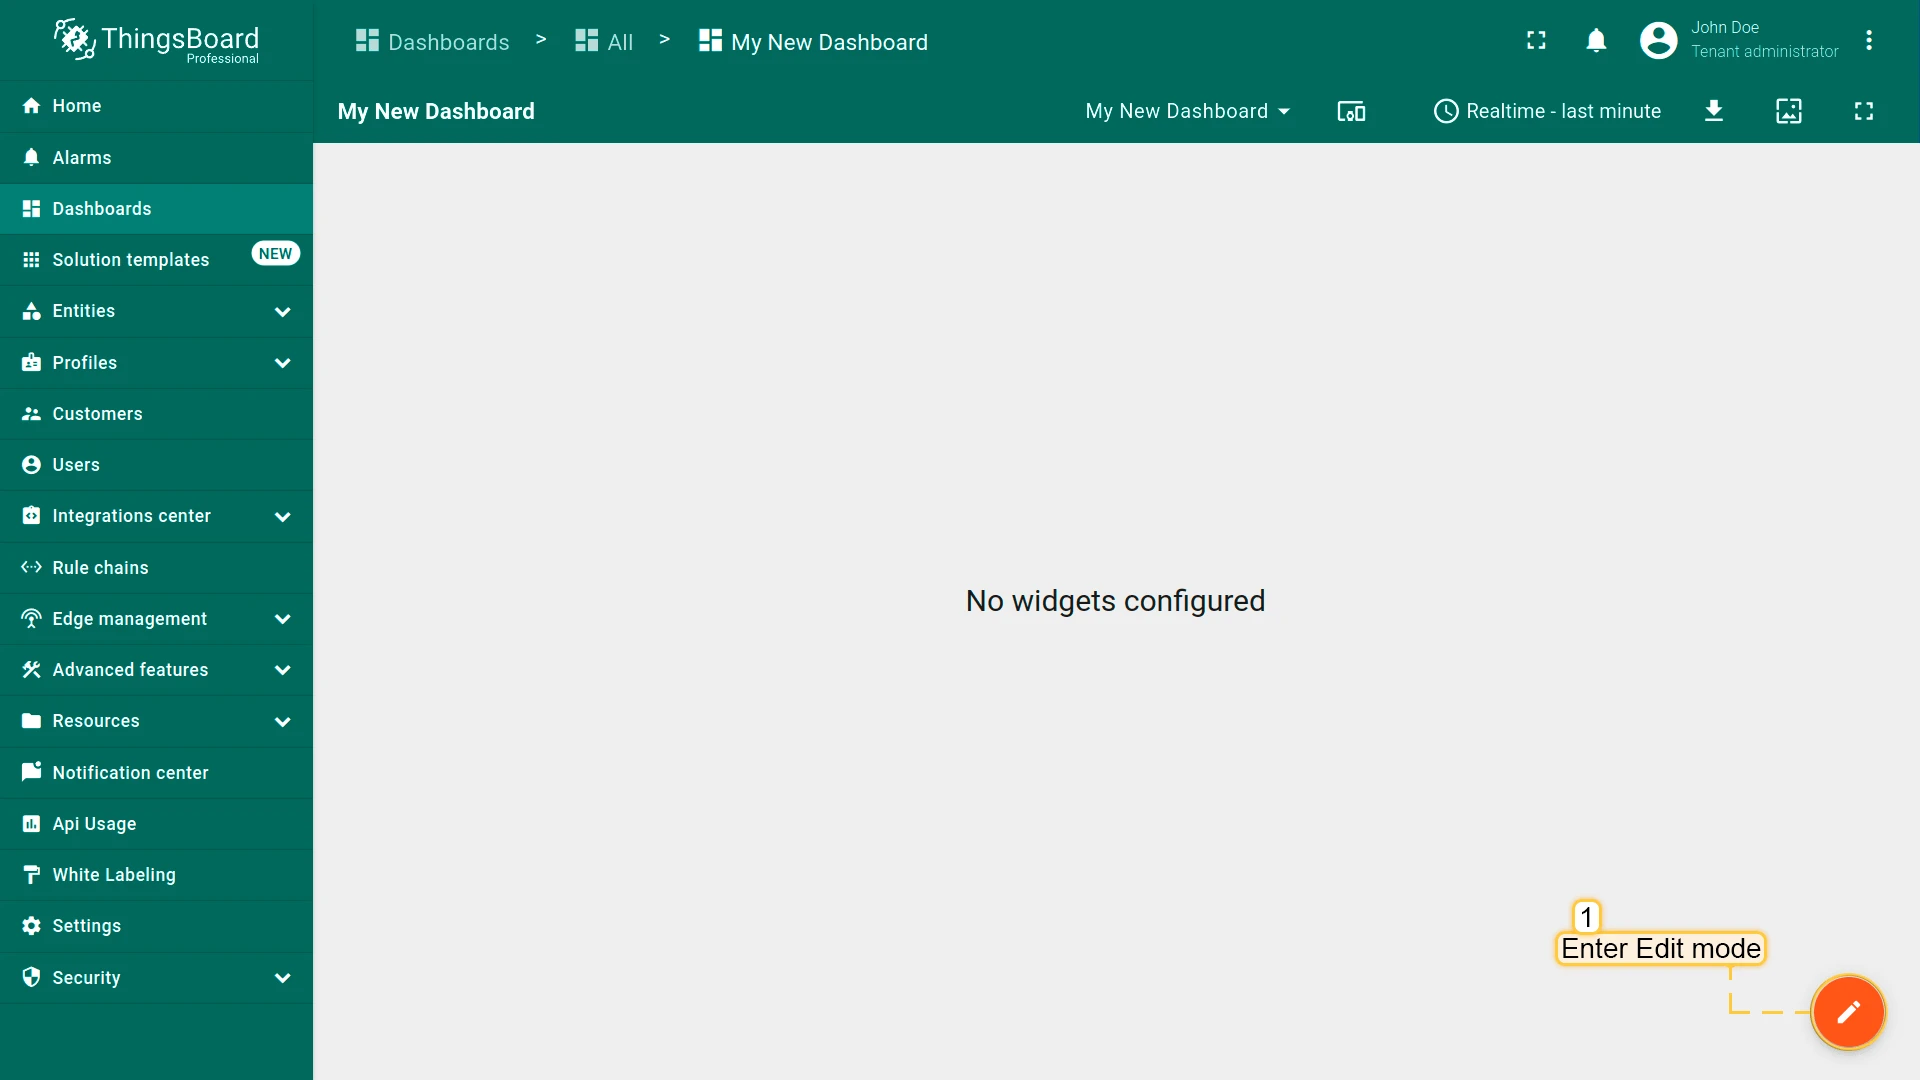
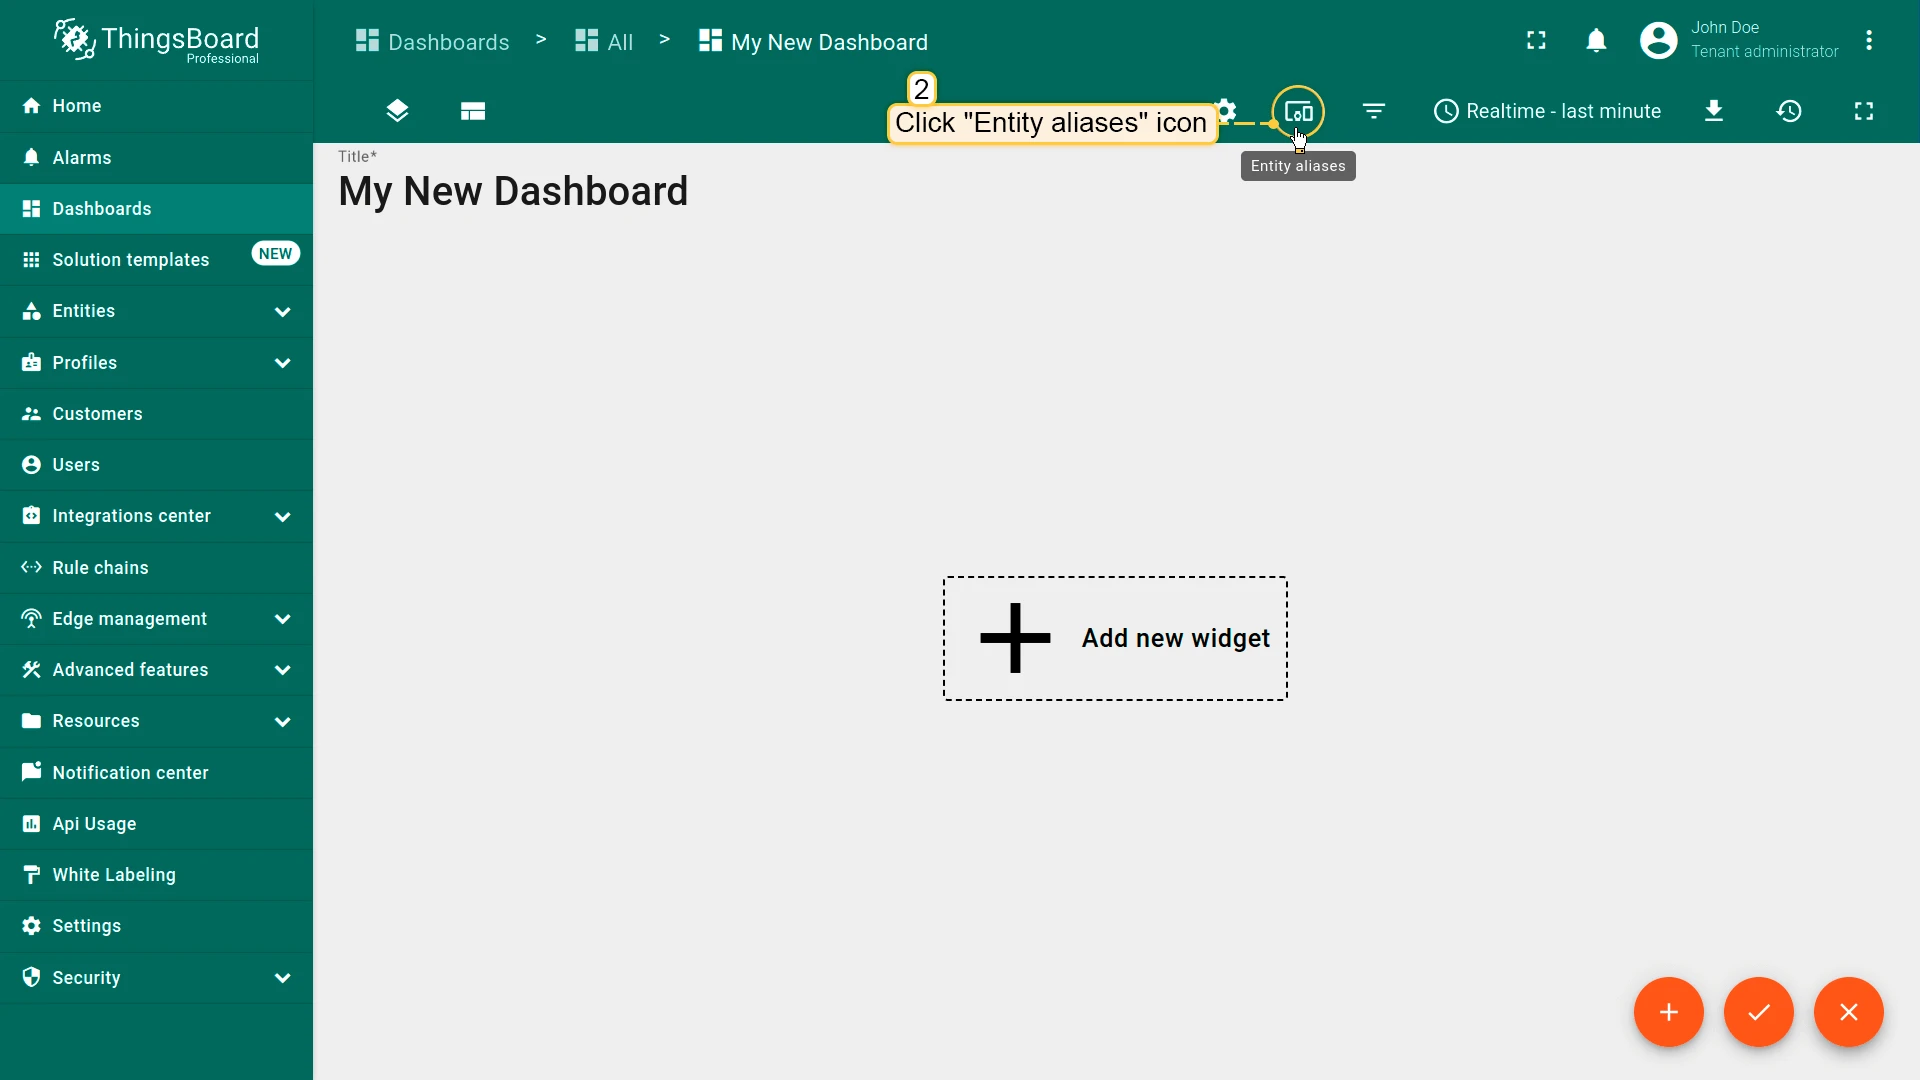
- Enter edit mode. Click on the pencil button in the bottom right corner
- Click the “Entity Aliases” icon in the top right part of the screen. You will see an empty list of Entity aliases
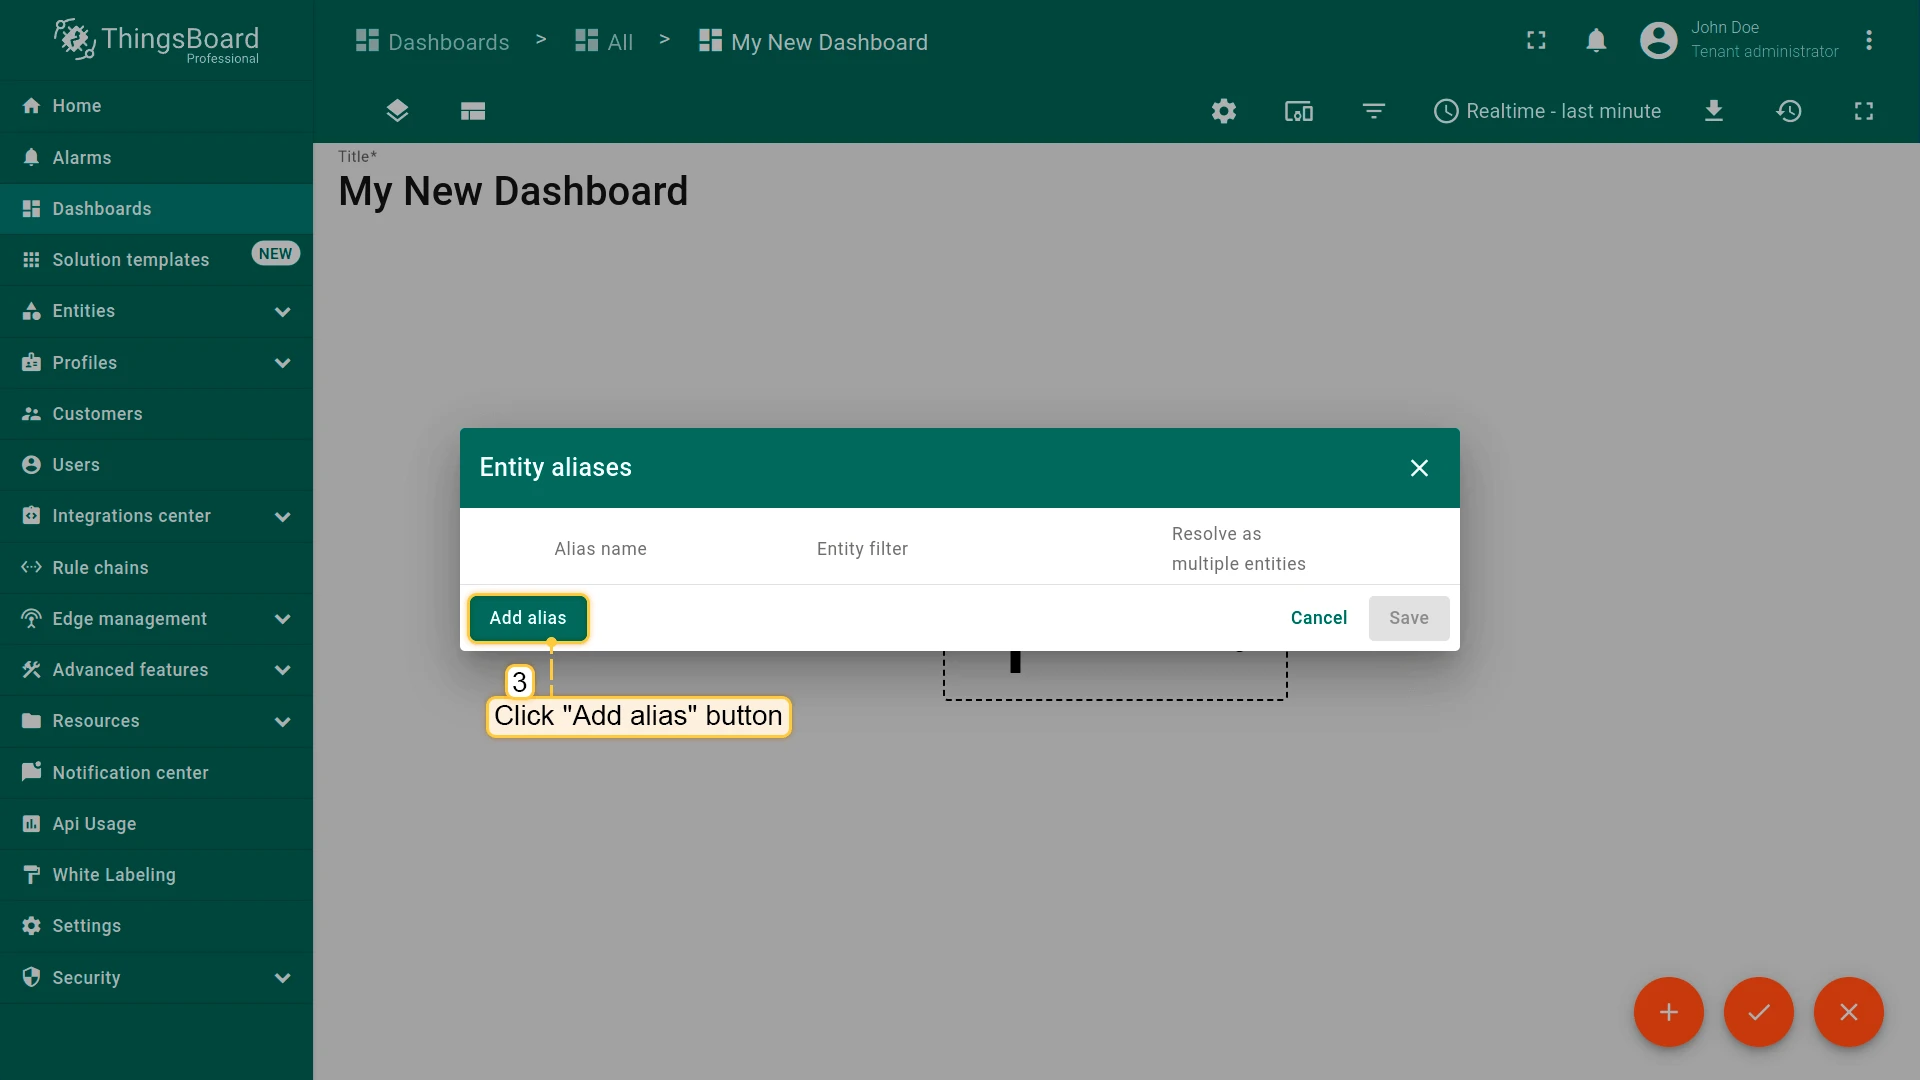
- Click “Add alias”
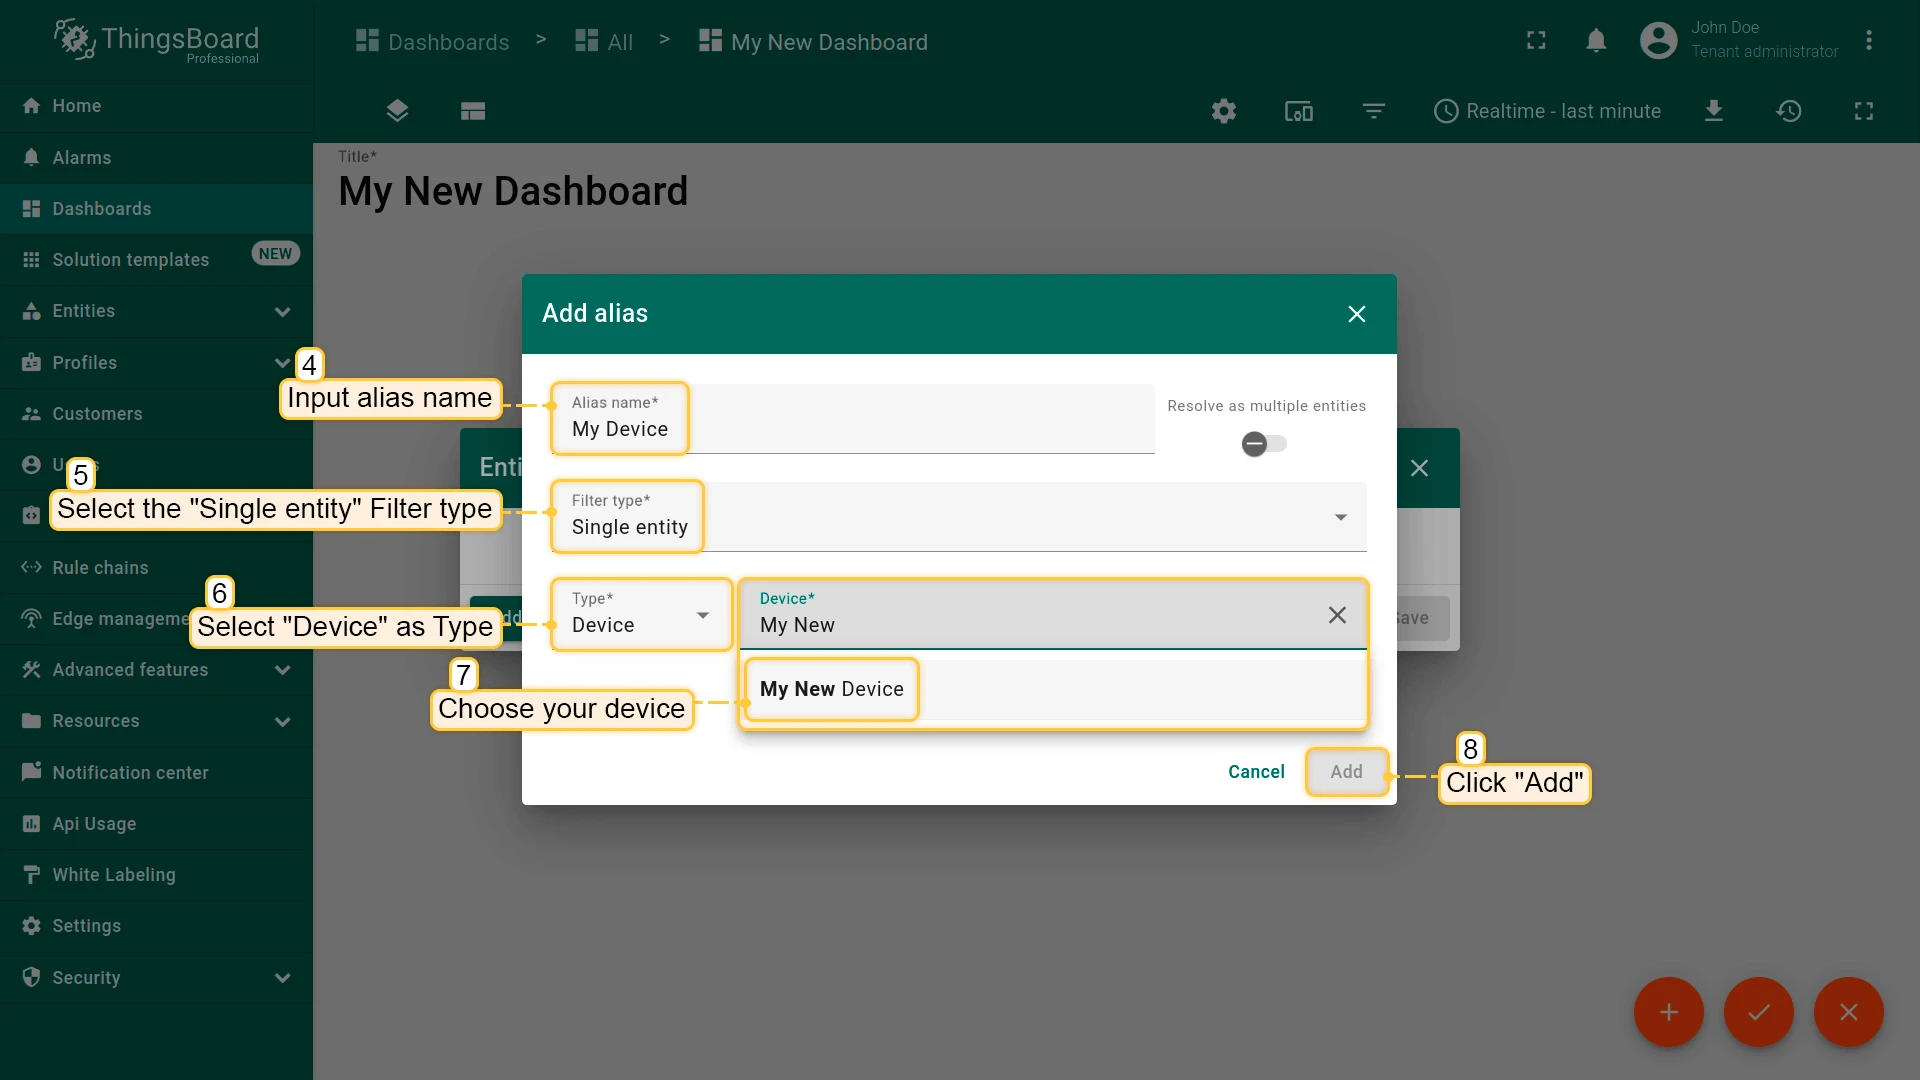
- Enter an alias name (for example, “My Device”). Choose “Single entity” as the Filter type, select “Device” for Type, and begin typing “My New” to trigger autocomplete suggestions
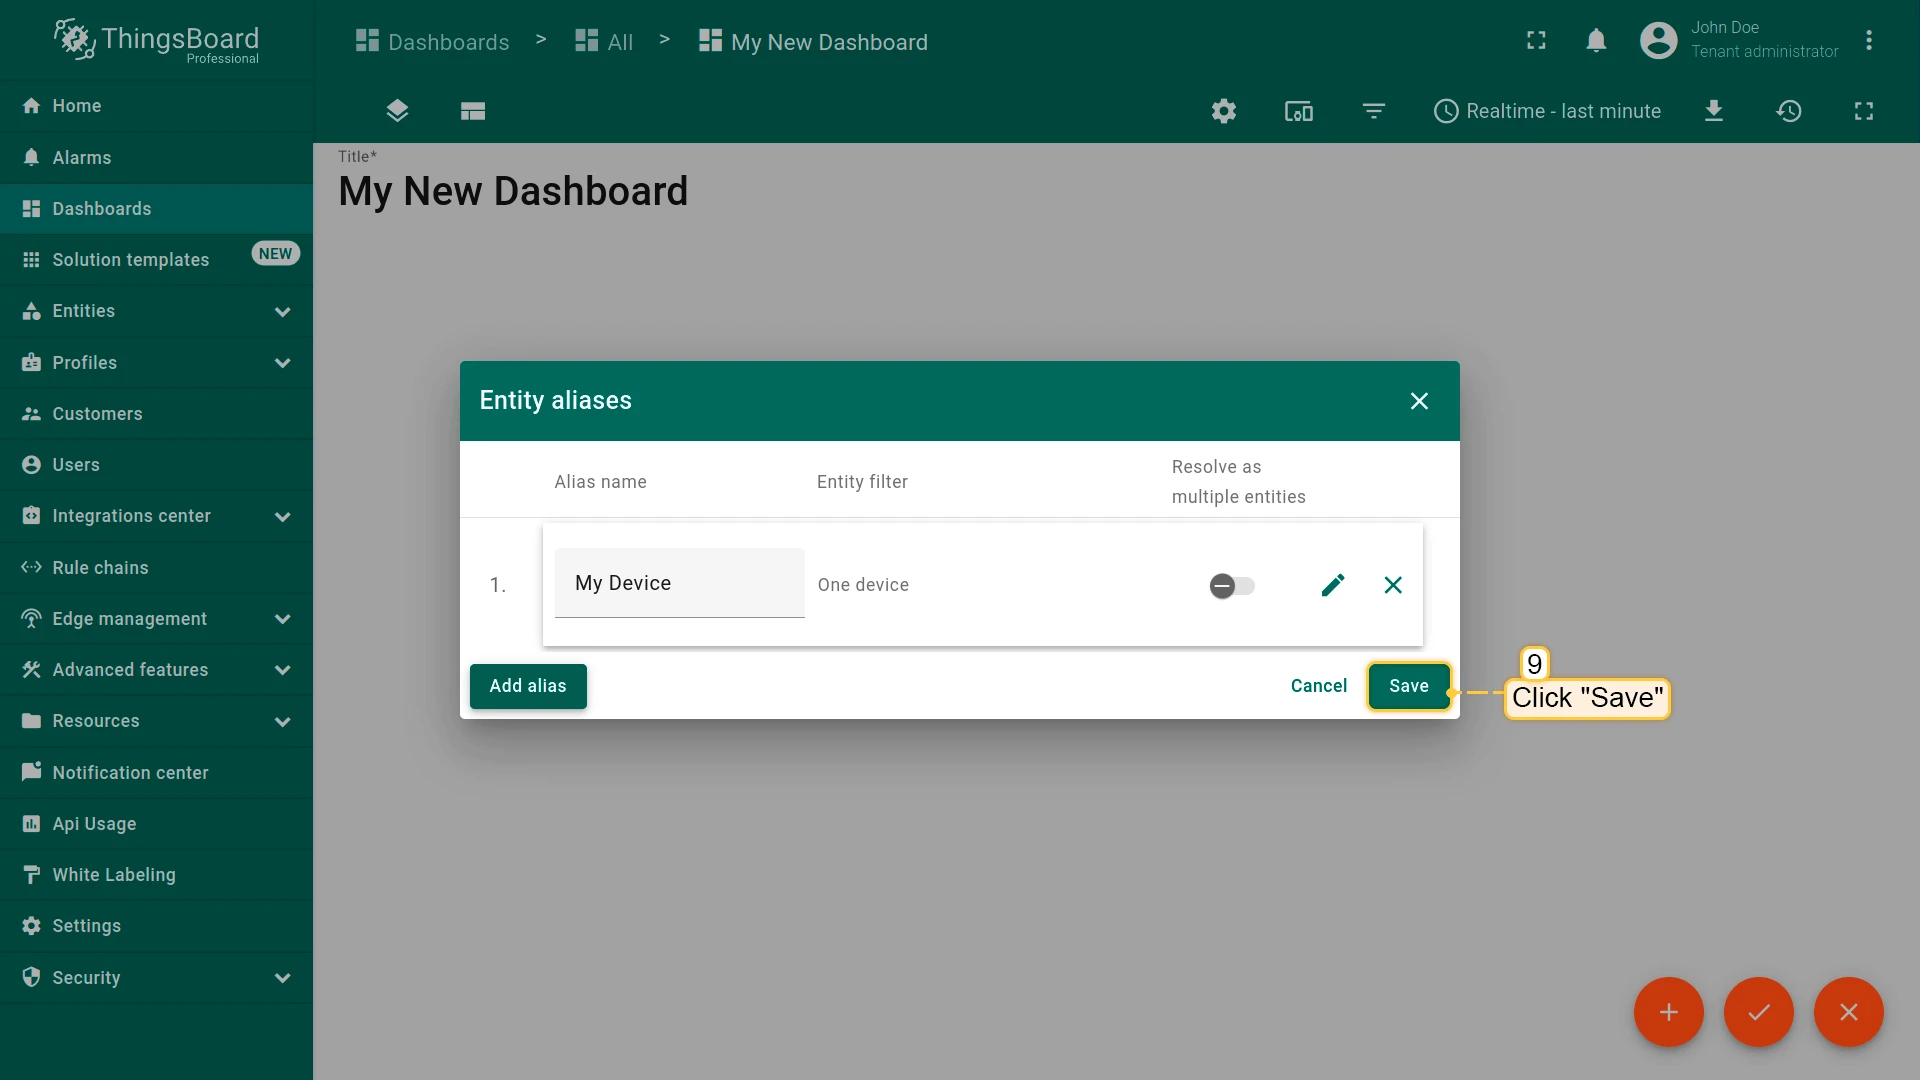
- Click “Add” and then “Save”
- Finally, click “Apply changes” in the dashboard editor to save the changes. Then you should enter edit mode again.
To add the new widget, we need to select it from the widget library. The widgets are grouped into widget bundles. Each widget has a data source. It is how the widget “knows” what data to display. We should configure the data source to see the latest value of our “cpu_usage” data that we sent during step 2.
- Enter the edit mode. Click the “Add new widget” button;
- Select the “Charts” widget bundle. Click on the header of the Entities widget. The “Add Widget” window will appear;
- Click “Add” to add the data source. A widget may have multiple data sources, but we will use only one;
- Select the “Rock Pi 4 Model B ” entity alias. Then click on the input field on the right. The auto-complete with available data points will appear. Select the “cpu_usage” data point and click “Add”;
- To enlarge the widget by dragging its bottom right corner. Feel free to explore advanced settings for additional widget modifications.
Control device using shared attributes
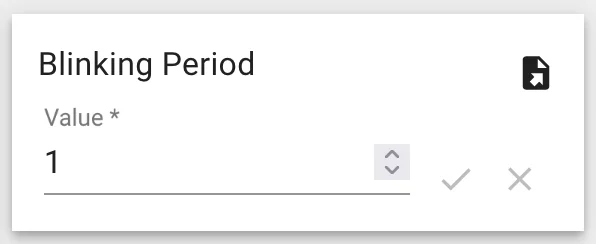
Also, we can change the period of the blinking using shared attribute update functionality.
This type of attribute is available only for Devices. It is similar to the Server-side attributes but has one important difference. The device firmware/application may request the value of the shared attribute(s) or subscribe to the updates of the attribute(s). The most common use case of shared attributes is to store device settings.
In order to run the code of this part of the guide, we recommend using Python 3.9 or above.
If you haven’t installed Python, please, follow the next steps:
sudo apt updatesudo apt install software-properties-commonsudo add-apt-repository ppa:deadsnakes/ppasudo apt install python3.9sudo apt-get install -y python3 git python3-pipAlso, we will need Adafruit-Blinka library. Please, use the following command to install it:
pip3 install Adafruit-BlinkaFor now, we are ready to write our code. In this part, we use new packages for blinking our LED in the blink function.
Also, we use the attibute_callback function, which will be called when we change the value of our shared attribute. And
finally, we bind our callback to subscriber in the main function.
import digitalioimport board
...
# default blinking periodperiod = 1.0
# callback function that will call when we will change value of our Shared Attributedef attribute_callback(client, result):    print(client, result)    # make sure that you paste YOUR shared attribute name    period = result.get('blinkingPeriod', 1.0)
def main():    ...    # make sure that you paste YOUR shared attribute name    sub_id_1 = client.subscribe_to_attribute("blinkingPeriod", attribute_callback)    sub_id_2 = client.subscribe_to_all_attributes(attribute_callback)    led = digitalio.DigitalInOut(board.PD14)    led.direction = digitalio.Direction.OUTPUT    ...    led.value = True    time.sleep(period)    led.value = False    time.sleep(period)
Also, if you are using the imported dashboard, you can change the blinking period using the following widget, which you can see in the bottom right corner of the dashboard:
Control device using RPC
ThingsBoard allows you to send Remote Procedure Calls (RPCs) from server-side applications to devices and vice versa. This feature enables you to send commands to/from devices and receive the results of command execution.
In this guide, we will configure an RPC command to get telemetry data from OrangePI immediately. If you are using the imported dashboard, there’s no need for additional configuration, as the dashboard already includes the following widget:
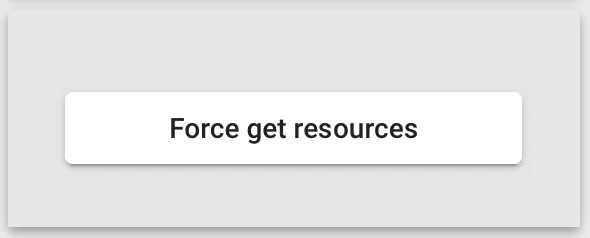
💡 If you’re creating a new dashboard, you can use the “RPC Button” widget for one-way RPC communication, which is located in the “Control widgets” bundle.
Now, we are ready to write the code. First, create an rpc_callback function that will be
triggered when the device receives an RPC request from the server. As in the example with shared attributes, we also need to bind our RPC callback function
to the subscriber within the main function.
client = None
...
# callback function that will call when we will send RPCdef rpc_callback(id, request_body):    # request body contains method and other parameters    print(request_body)    method = request_body.get('method')    if method == 'getTelemetry':        attributes, telemetry = get_data()        client.send_attributes(attributes)        client.send_telemetry(telemetry)    else:        print('Unknown method: ' + method)
...
def main():    ...
    # now rpc_request_response will process rpc requests from server    client.set_server_side_rpc_request_handler(rpc_callback)
    ...
When you click the RPC button, the device will immediately send telemetry (CPU %, Processes number, etc.). You can see this reflected in your dashboard, as shown in the chart below.
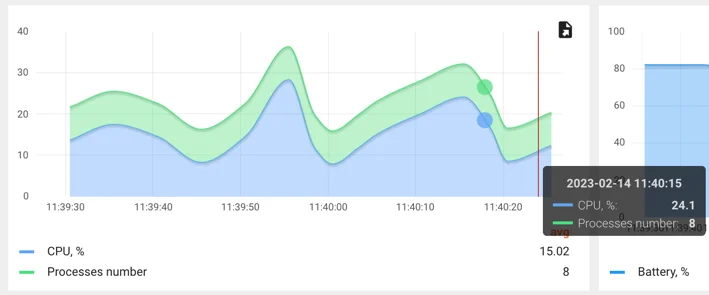
Also, if you did everything right, you should see the following console output:
{'method': 'getTelemetry', 'params': {}}Conclusion
Now you can easily connect your Rock Pi 4 Model B and start sending data to ThingsBoard.
To go further, explore the ThingsBoard documentation to learn more about key features, such as creating dashboards to visualize your telemetry, or setting up alarm rules to monitor device behavior in real time.