COMFORT v2 LoRaWAN® Leak Detection Sensor
COMFORT v2 LoRaWAN® Leak Detection Sensor
TEKTELIC
- Platform
- ThingsBoard
- Hardware Type
- Sensors
- Connectivity
- LoRaWAN
- Industry
- Smart Buildings, Smart Cities, Industrial Manufacturing
- Use Case
- Environment Monitoring, Smart Office
Introduction
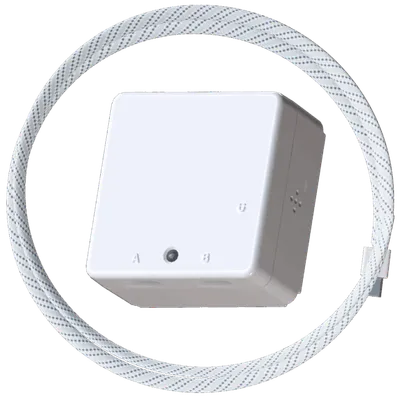
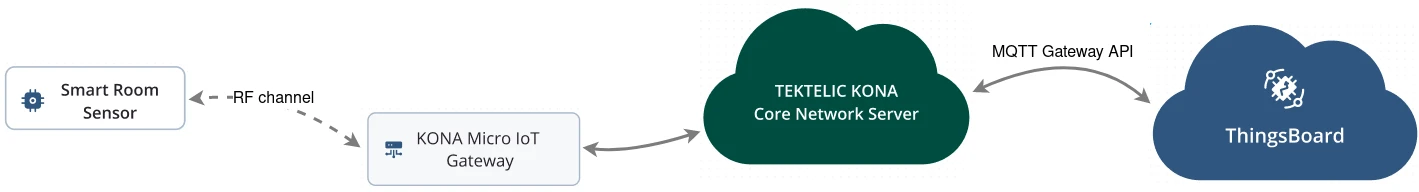
The COMFORT v2 LoRaWAN® Leak Detection Sensor from TEKTELIC is a compact indoor sensor that monitors water leaks via a wired probe and reports events over LoRaWAN. It is deployed using the TEKTELIC KONA Core Network Server, which has a built-in ThingsBoard integration that forwards sensor data to ThingsBoard via the MQTT Gateway API — automatically creating devices and telemetry entries on first uplink.
This guide walks through registering the gateway and sensor in the KONA Network Server, creating the ThingsBoard integration, and verifying received data.
Prerequisites
- TEKTELIC COMFORT v2 LoRaWAN® Leak Detection Sensor
- KONA Micro IoT Gateway
- Customer account on the TEKTELIC KONA Core Network Server (EU instance) — contact TEKTELIC support to obtain one
- ThingsBoard PE instance: use ThingsBoard Cloud or install a local PE server
Step 1: Register the gateway in the Network Server
-
Log in to the KONA Core Network Server. Create a new gateway group, then add a new gateway in the group.
Use the GW-ID from the sticker on the gateway body. For credentials, the default username is
TEK00XXYY(whereXXYYis the last 4 digits of the MAC address) and the default password is the 9-digit serial number.The Network Server provides a predefined list of gateway models — select Kona Micro EU GW or create a new model and set the frequency band and channel count to match your hardware.
-
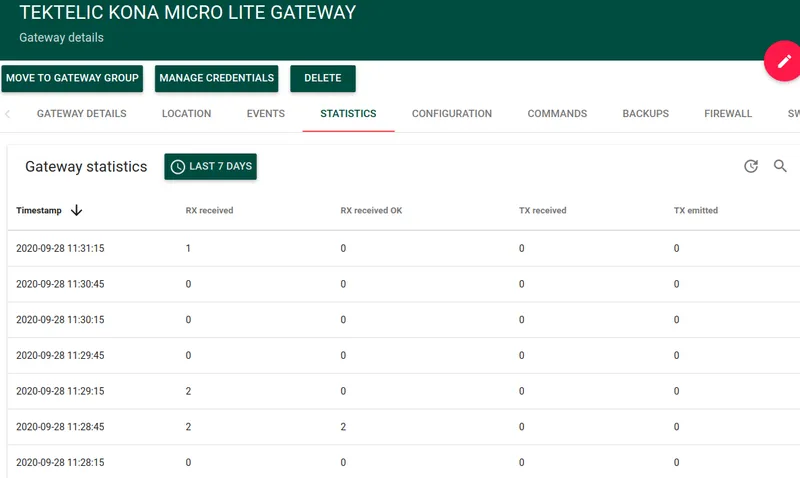
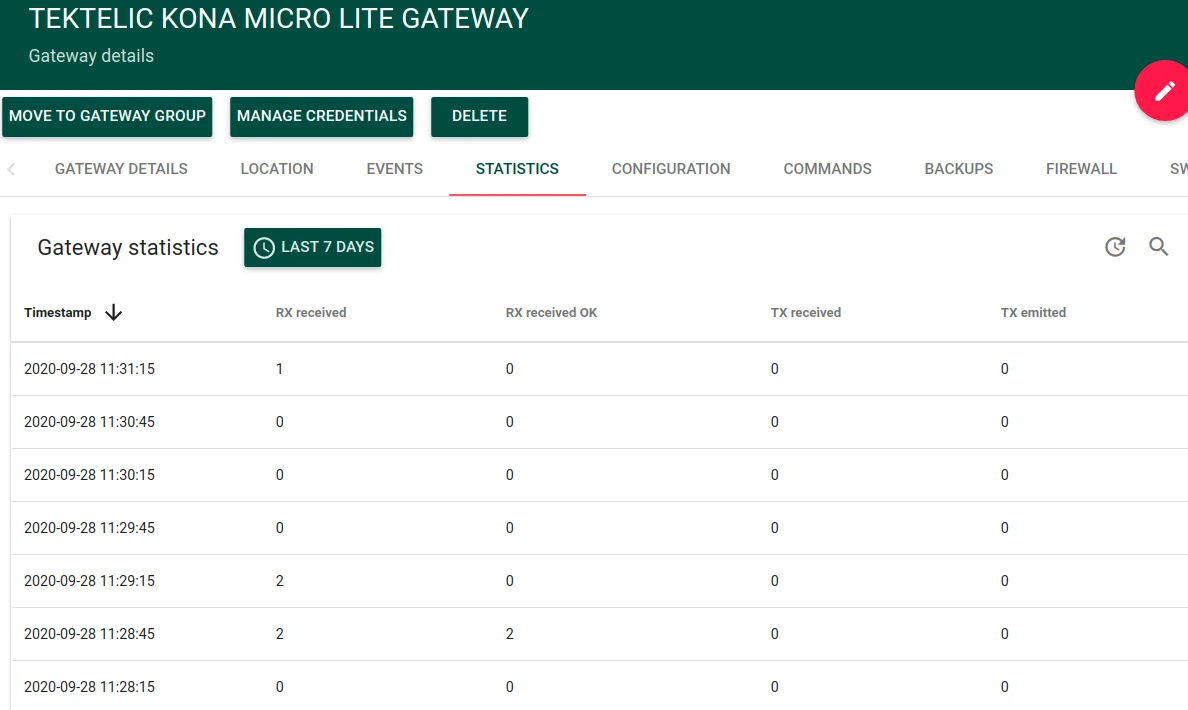
Once the gateway is powered on and connected to the internet, its status changes to Online. The Statistics tab updates periodically with sent and received packet counts.
Step 2: Register the COMFORT v2 sensor
-
Create a new application in the Network Server (for example, Leak Sensors). Create a new device in the application.
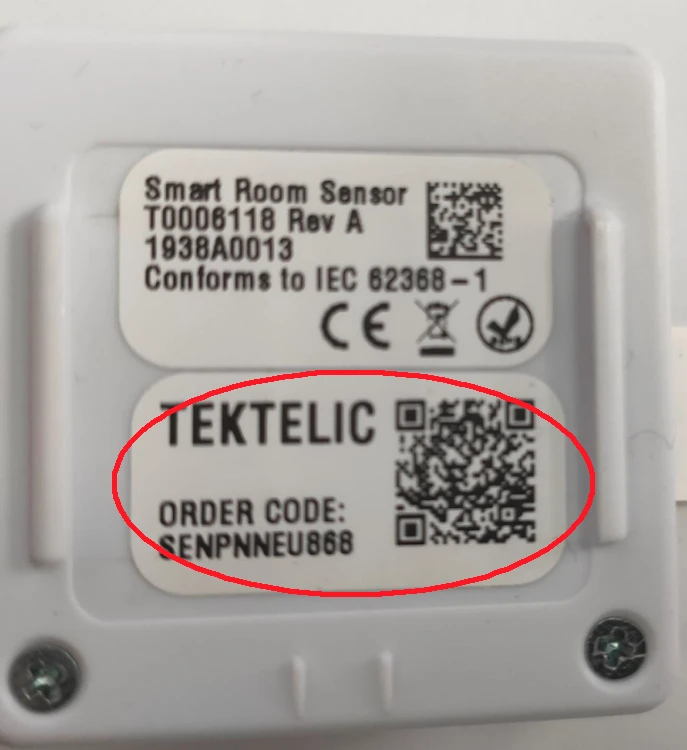
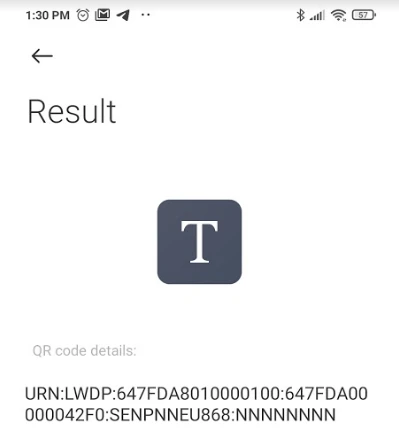
The COMFORT v2 ships with a QR code sticker containing the Device EUI and Application EUI required for provisioning.
-
Enter the Device EUI and Application EUI when adding the device. Then add the sensor to the application.
-
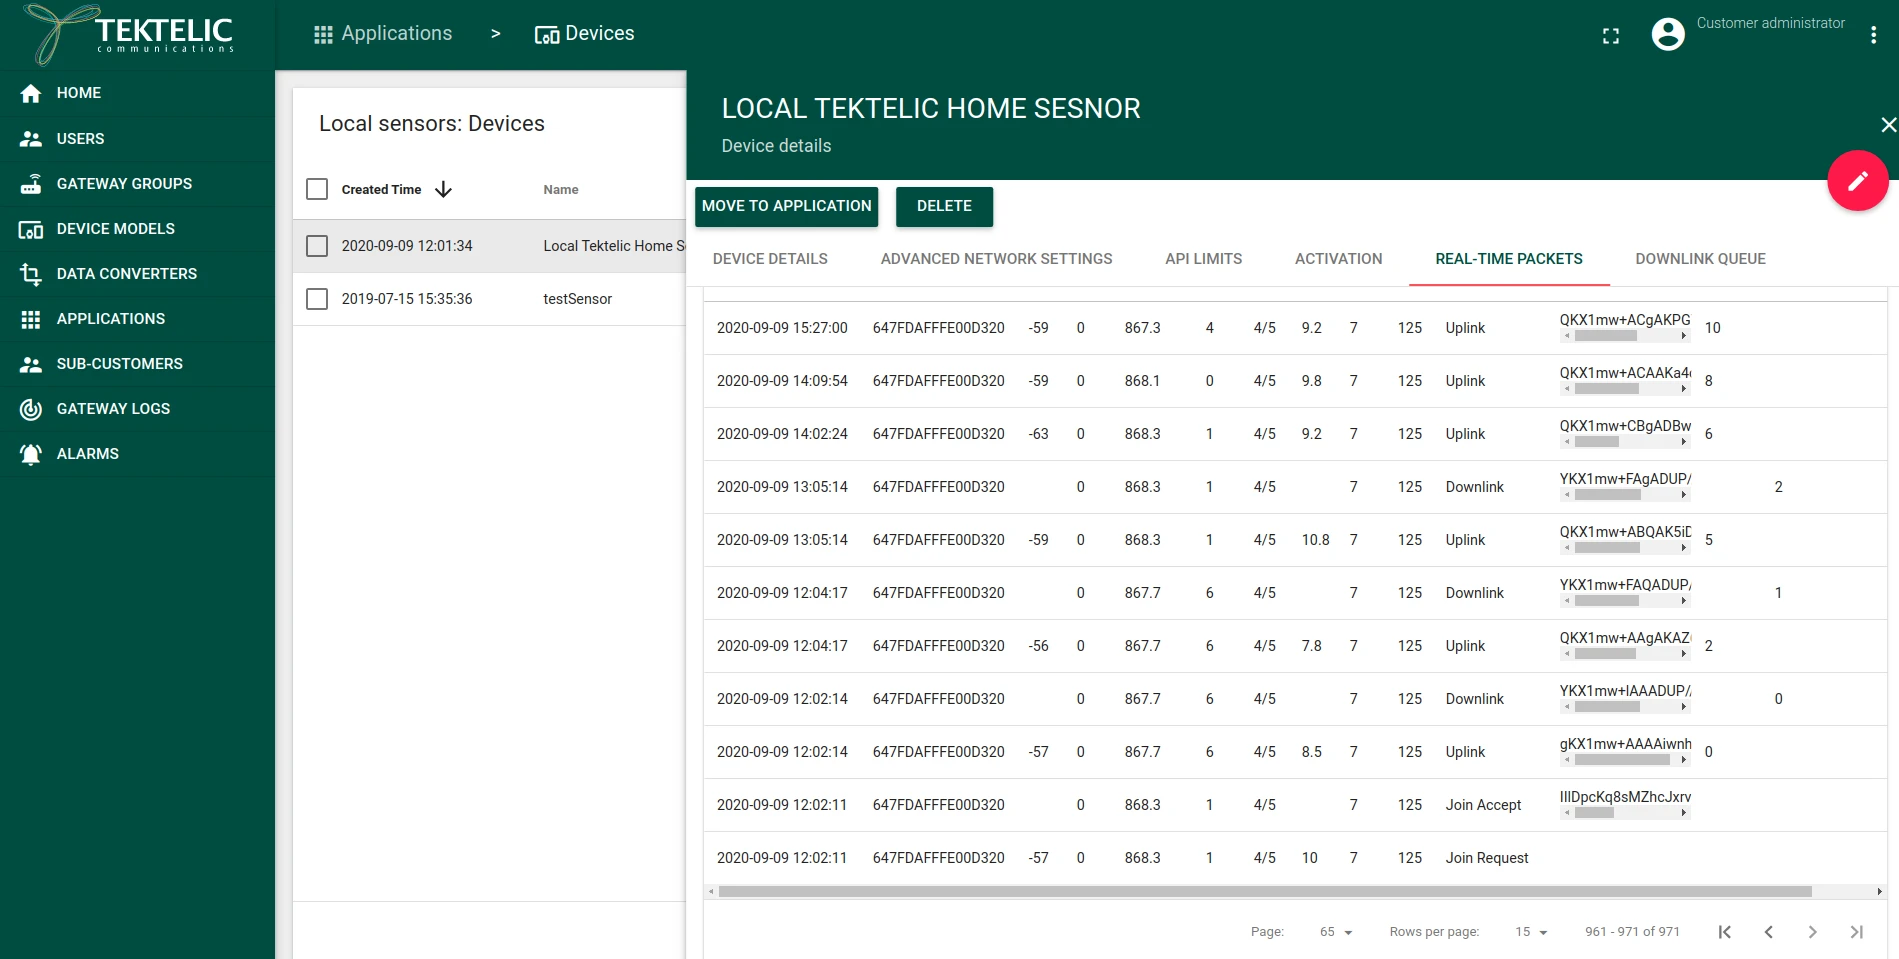
Power on the sensor by removing the protective film from the battery contact. The sensor sends a join request, and the Network Server shows join and uplink packets in the Real-Time Packets tab.
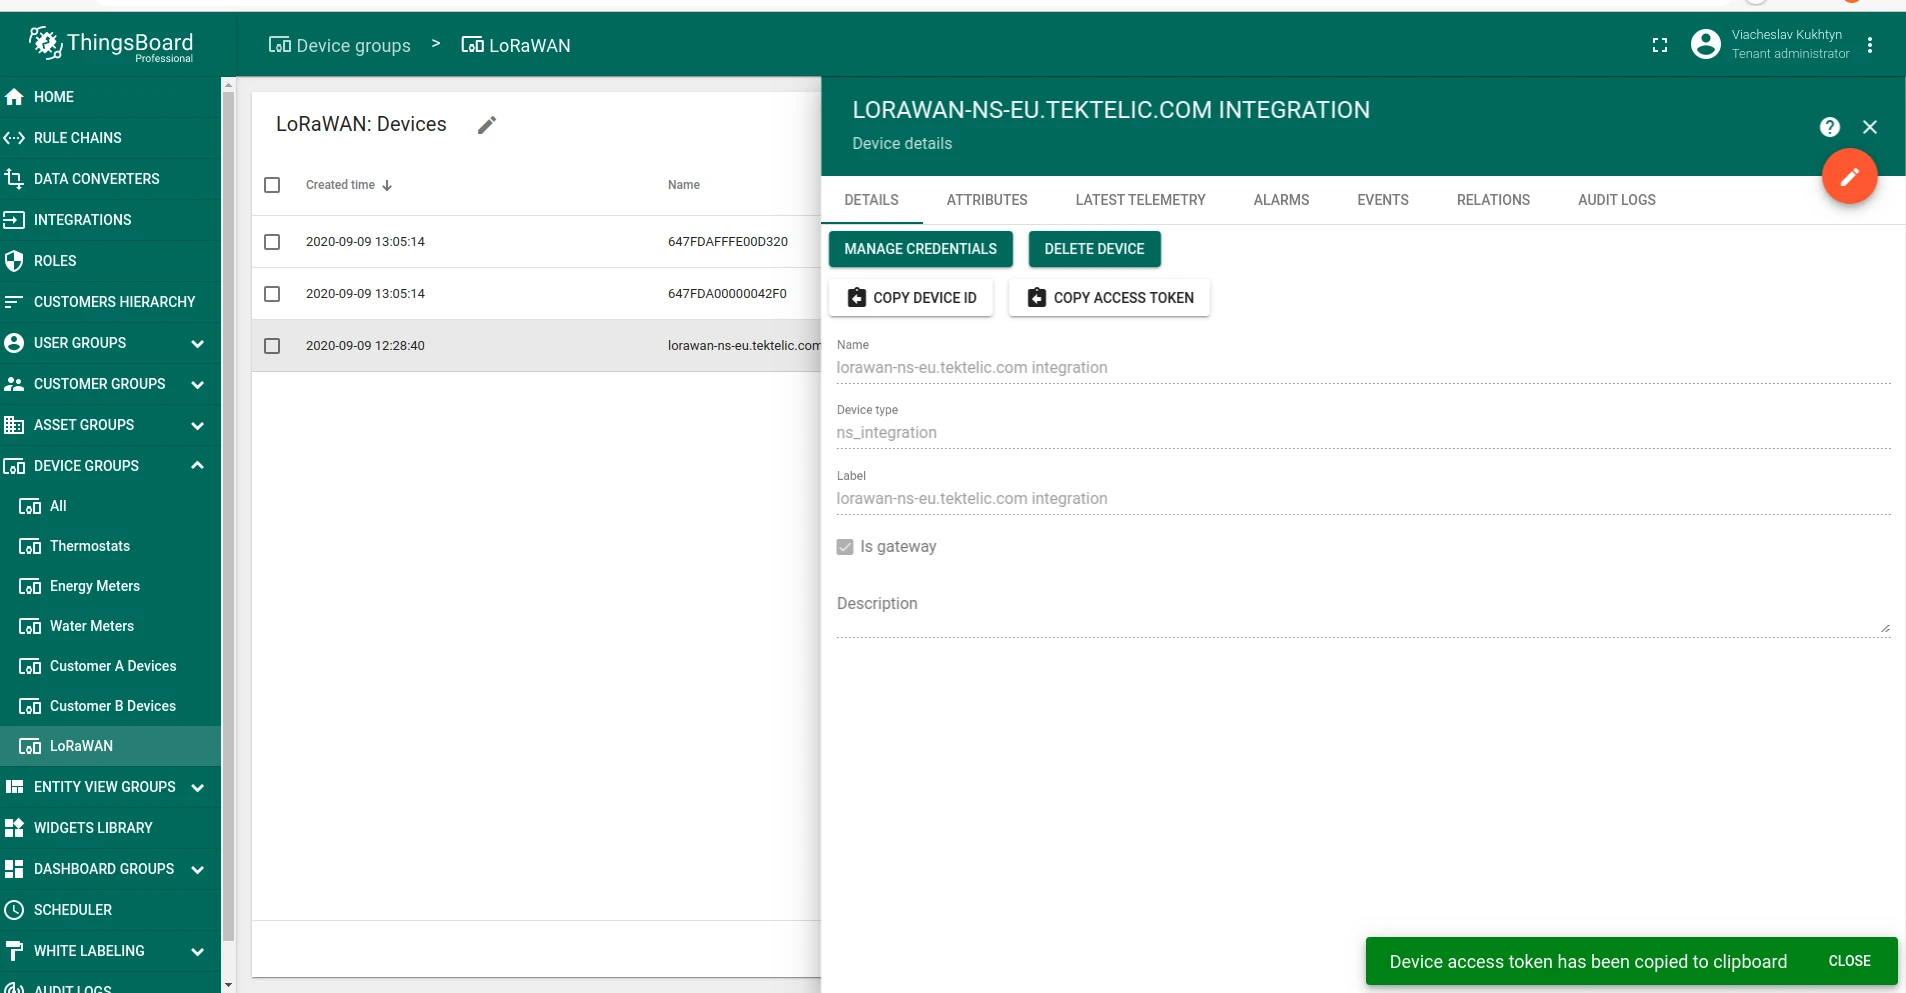
Step 3: Create a gateway device in ThingsBoard
The KONA Network Server uses the ThingsBoard MQTT Gateway API to forward data. You must create a gateway device in ThingsBoard and provide its access token to the Network Server.
-
In ThingsBoard, go to Entities ⇾ Devices and create a new device. Set any name (for example,
NS Integration) and enable the Is gateway checkbox. Click Add.
-
Open the created device and click Copy access token. Save the token — you will need it in the next step.
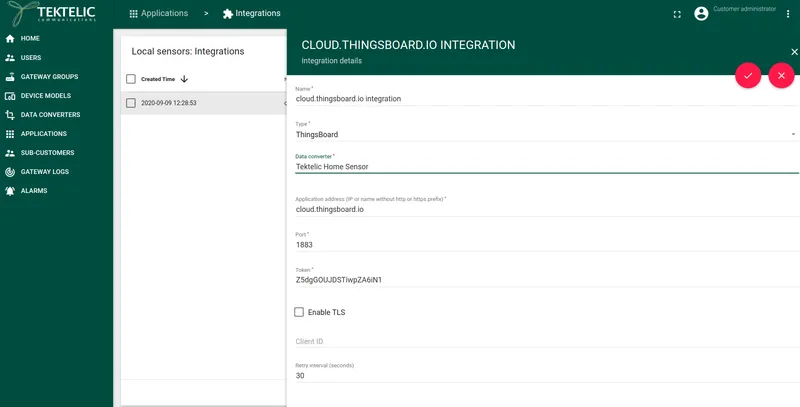
Step 4: Configure the ThingsBoard integration in the Network Server
-
In the KONA Network Server, open your application (e.g. Leak Sensors) and click Manage Integrations. Click Add integration (+) and fill in the following fields:
Field Value Name Any name (e.g. ThingsBoard)Type ThingsBoardData Converter Tektelic Home Sensor (or the appropriate converter for your sensor model) Application Address ThingsBoard host without http://orhttps://prefixToken The access token copied in Step 3 Leave all remaining fields at their defaults and save.

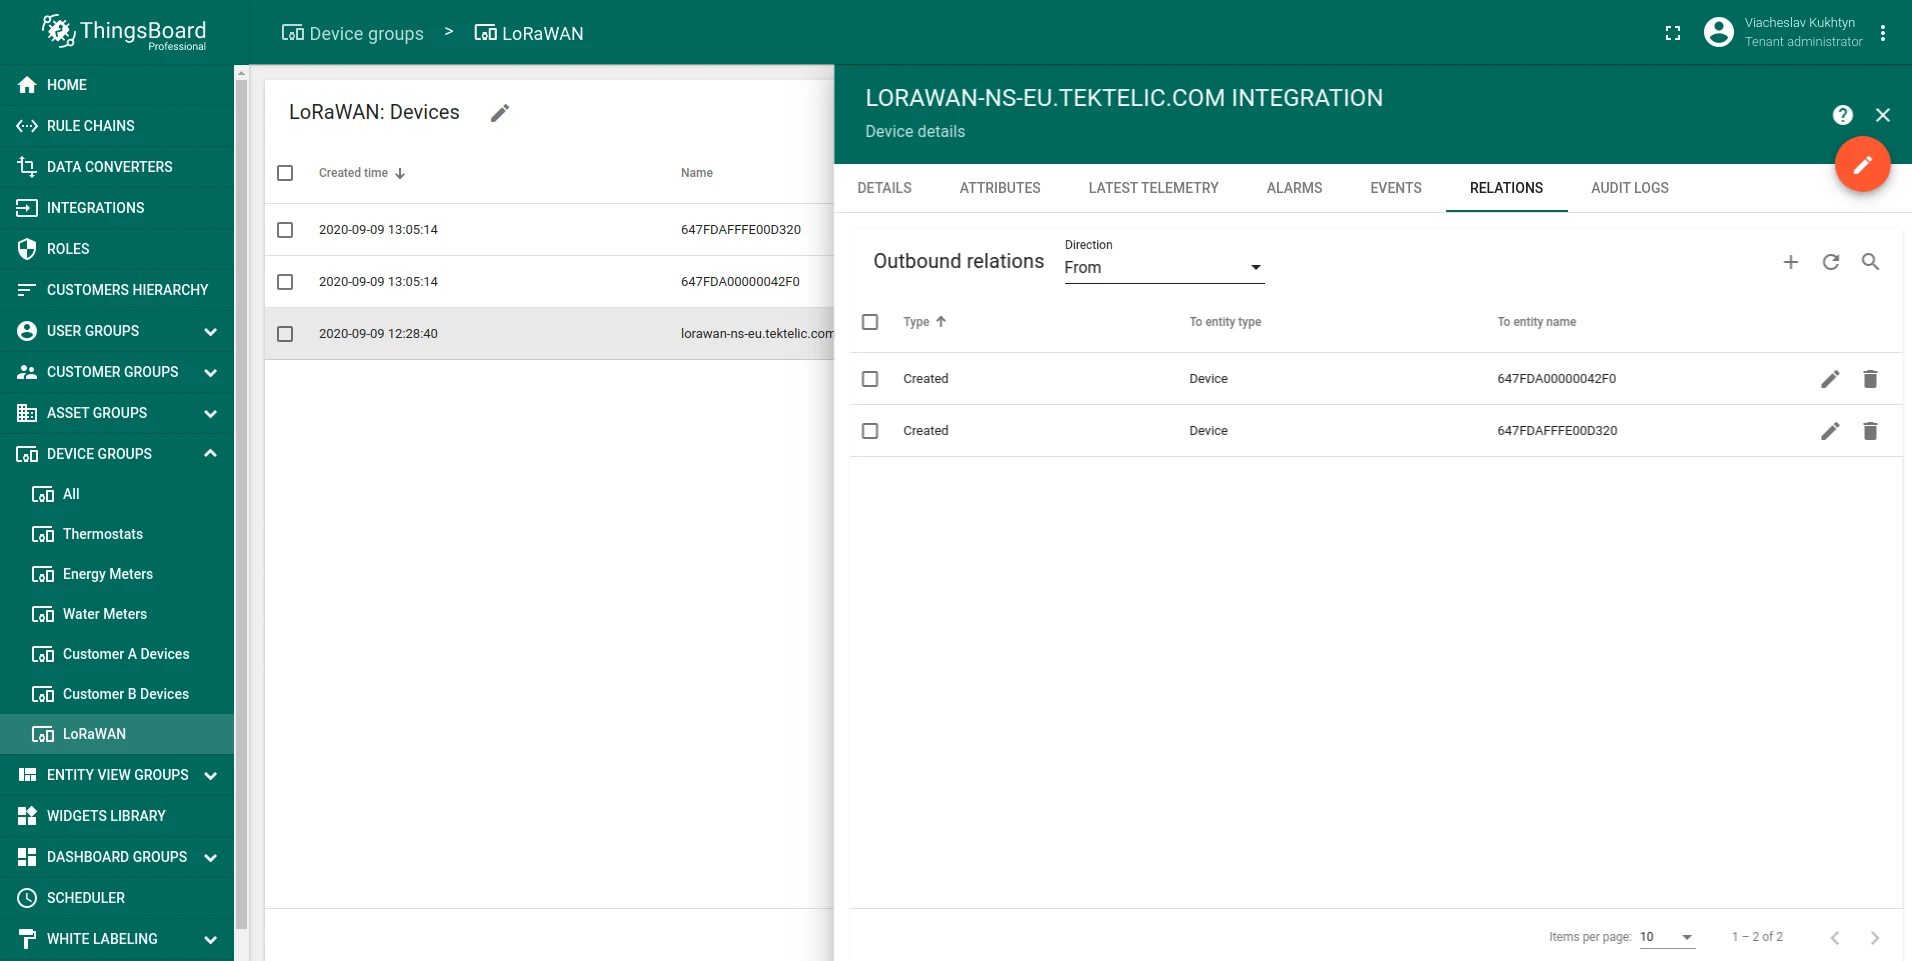
Verify data in ThingsBoard
After the next uplink from the COMFORT v2, the Network Server forwards data via MQTT Gateway API. ThingsBoard automatically creates two child devices under the gateway device: one for the LoRa gateway and one for the sensor.
-
In ThingsBoard, open the gateway device created in Step 3. Go to the Relations tab and select From outbound relations. Two child devices appear: the LoRa gateway (type
Gateway) and the COMFORT v2 sensor (typeCLASS_A).
-
Open the sensor device and click Latest telemetry. It contains the telemetry decoded by the Network Server converter — LoRaWAN metadata (
nsGateway,nsRssi, etc.) and sensor-specific fields likehumidity,temperature, and leak state.
Import the dashboard
Download network_server_dashboard.json and import it in Dashboards. See dashboard import instructions.