INDUSTRY 4.0
Real-Time production monitoring for automotive supplier by süc//dacor GmbH using ThingsBoard

süc//dacor GmbH is more than a regional internet provider — it is a forward-thinking technology partner for businesses navigating the digital era. Headquartered in Coburg, Germany, the company combines over 25 years of experience in telecommunications with a strong focus on IoT, smart infrastructure, and digital services. süc//dacor is a leading force in deploying LoRaWAN networks and intelligent solutions, helping enterprises shift from traditional automation to real-time, data-driven operations.
The company offers end-to-end IoT implementation — from device integration and data acquisition to visualization through platforms like ThingsBoard. Their solutions have already proven effective in industrial monitoring, smart energy, and infrastructure projects. With a unique blend of technical expertise and business-driven thinking, süc//dacor empowers its clients to increase efficiency, reduce operational costs, and accelerate their journey toward digital transformation.
0
LoRaWAN gateways in our regional public network
0+
in the field of IoT with LoRaWAN
0
sensor types tested in our in-house lab
What problem did they face?
The client needed greater transparency across their production floor to monitor machine activity, minimize unplanned downtime, and improve operational performance.
Challenges
-
Lack of real-time production data transmission
-
Limited visibility into equipment downtime and productivity
-
No visual interface for equipment status monitoring
-
Inability to quickly detect underperforming machines
Key results
-
Reliable data collection from production machines
-
Real-time visualization through ThingsBoard dashboards
-
Instant performance feedback with intuitive color indicators
-
Improved decision-making and operational transparency
How ThingsBoard powers süc//dacor GmbH?
Seamless integration with industrial equipment
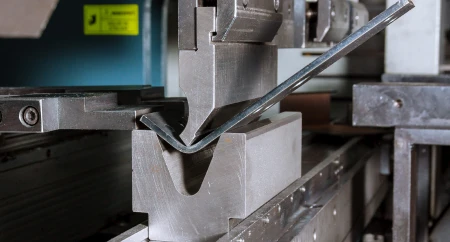
ThingsBoard's open architecture and support for standard industrial protocols enabled smooth integration with the customer's production line. In this project, a software trigger was embedded into each machine's control program to capture the milling motor's power status, which was then collected via a ThingsBoard-compatible IoT module — ensuring reliable data acquisition at the source.
Wireless data transmission enabled by ThingsBoard and LoRaWAN
Thanks to ThingsBoard's native support for LoRaWAN networks, süc//dacor was able to establish a robust and low-power wireless data transmission layer. This eliminated the need for wired infrastructure and made it possible to collect real-time machine data even in complex industrial environments.
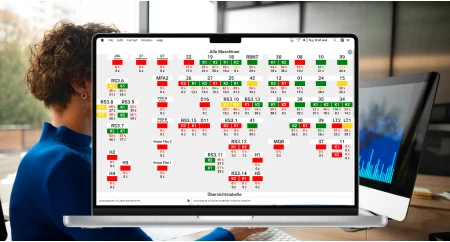
Advanced data aggregation and digital twin visualization
All collected data is aggregated and visualized using ThingsBoard's powerful dashboard engine. The dashboards display a digital twin of the manufacturing facility, accurately reflecting the position and configuration of each machine — including setups with dual milling heads — along with their real-time operational status.

Real-time performance monitoring
ThingsBoard's customizable dashboards allow süc//dacor GmbH to provide each customer with a personalized view of their IoT ecosystem—essential when supporting municipalities, enterprises, and service providers.
Operational transparency and control
ThingsBoard provides an intuitive web interface that gives plant management instant access to key machine performance data — without the need for external tools or complex configurations. This level of visibility drives operational transparency, reduces downtime, and supports informed, data-driven decision-making.
Increasing productivity with retrofit devices
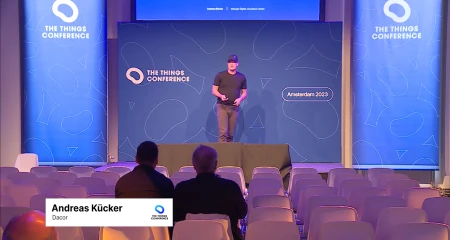
Watch Andreas Kücker, Manager Digital at süc//dacor GmbH, share insights from his conference presentation on how retrofit IoT solutions transformed their manufacturing processes and increased operational efficiency.
Watch conference presentation
How ThingsBoard helps industry 4.0 improve operations with IoT?
Real-Time telemetry & dashboards
ThingsBoard enables real-time collection, visualization, and analysis of telemetry data from our LoRaWAN sensors and IoT modules. With fully customizable dashboards, we can monitor live sensor readings such as temperature, humidity, fill levels, or switching states. Deviations or critical values are highlighted immediately, allowing fast responses and situational awareness.


Device management at scale
The platform offers powerful tools for registering, provisioning, and managing a wide range of IoT devices. In our case, this applies to diverse and individualized customer installations. ThingsBoard gives us centralized visibility and control of LoRaWAN-connected sensors—whether deployed at a single site or distributed across multiple locations. Features like remote monitoring and customer-specific device assignments help us manage installations efficiently and reliably.


Advanced rule engine for automation
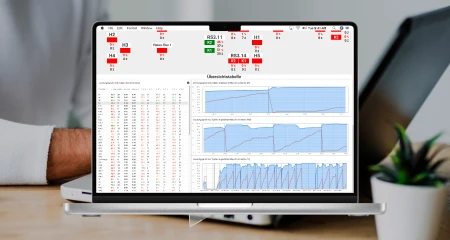
ThingsBoard includes a highly capable rule engine, which we actively use to automate data workflows. We rely on it to aggregate raw sensor data and calculate key performance metrics such as uptime, utilization, or operational KPIs. This allows complex processes—like tracking run-times or generating daily consumption summaries—to be fully automated and displayed in dashboards or reports. Most logic is built using the visual rule chain editor, reducing the need for manual coding.


Asset & entity management
Our LoRaWAN sensors are logically organized into device groups in ThingsBoard to maintain a clear and manageable structure. These groups are typically based on location, customer site, or application type. This organization makes it easier to aggregate performance data, analyze trends, and present targeted information. Grouping simplifies dashboarding and reporting while improving overall clarity and data interpretation.


Role-based access control (RBAC)
Rather than using detailed role-based permissions, we take advantage of ThingsBoard's public dashboard links to provide real-time access to key operational views. For example, a production overview dashboard is displayed on a central control room screen, continuously showing current machine states without requiring login credentials. This approach has proven extremely effective in offering staff a quick, up-to-date overview of production activity at a glance.


Real stories, real impact — share your experience with ThingsBoard!
Contact us