Predictive Occupancy Monitoring for Hotels
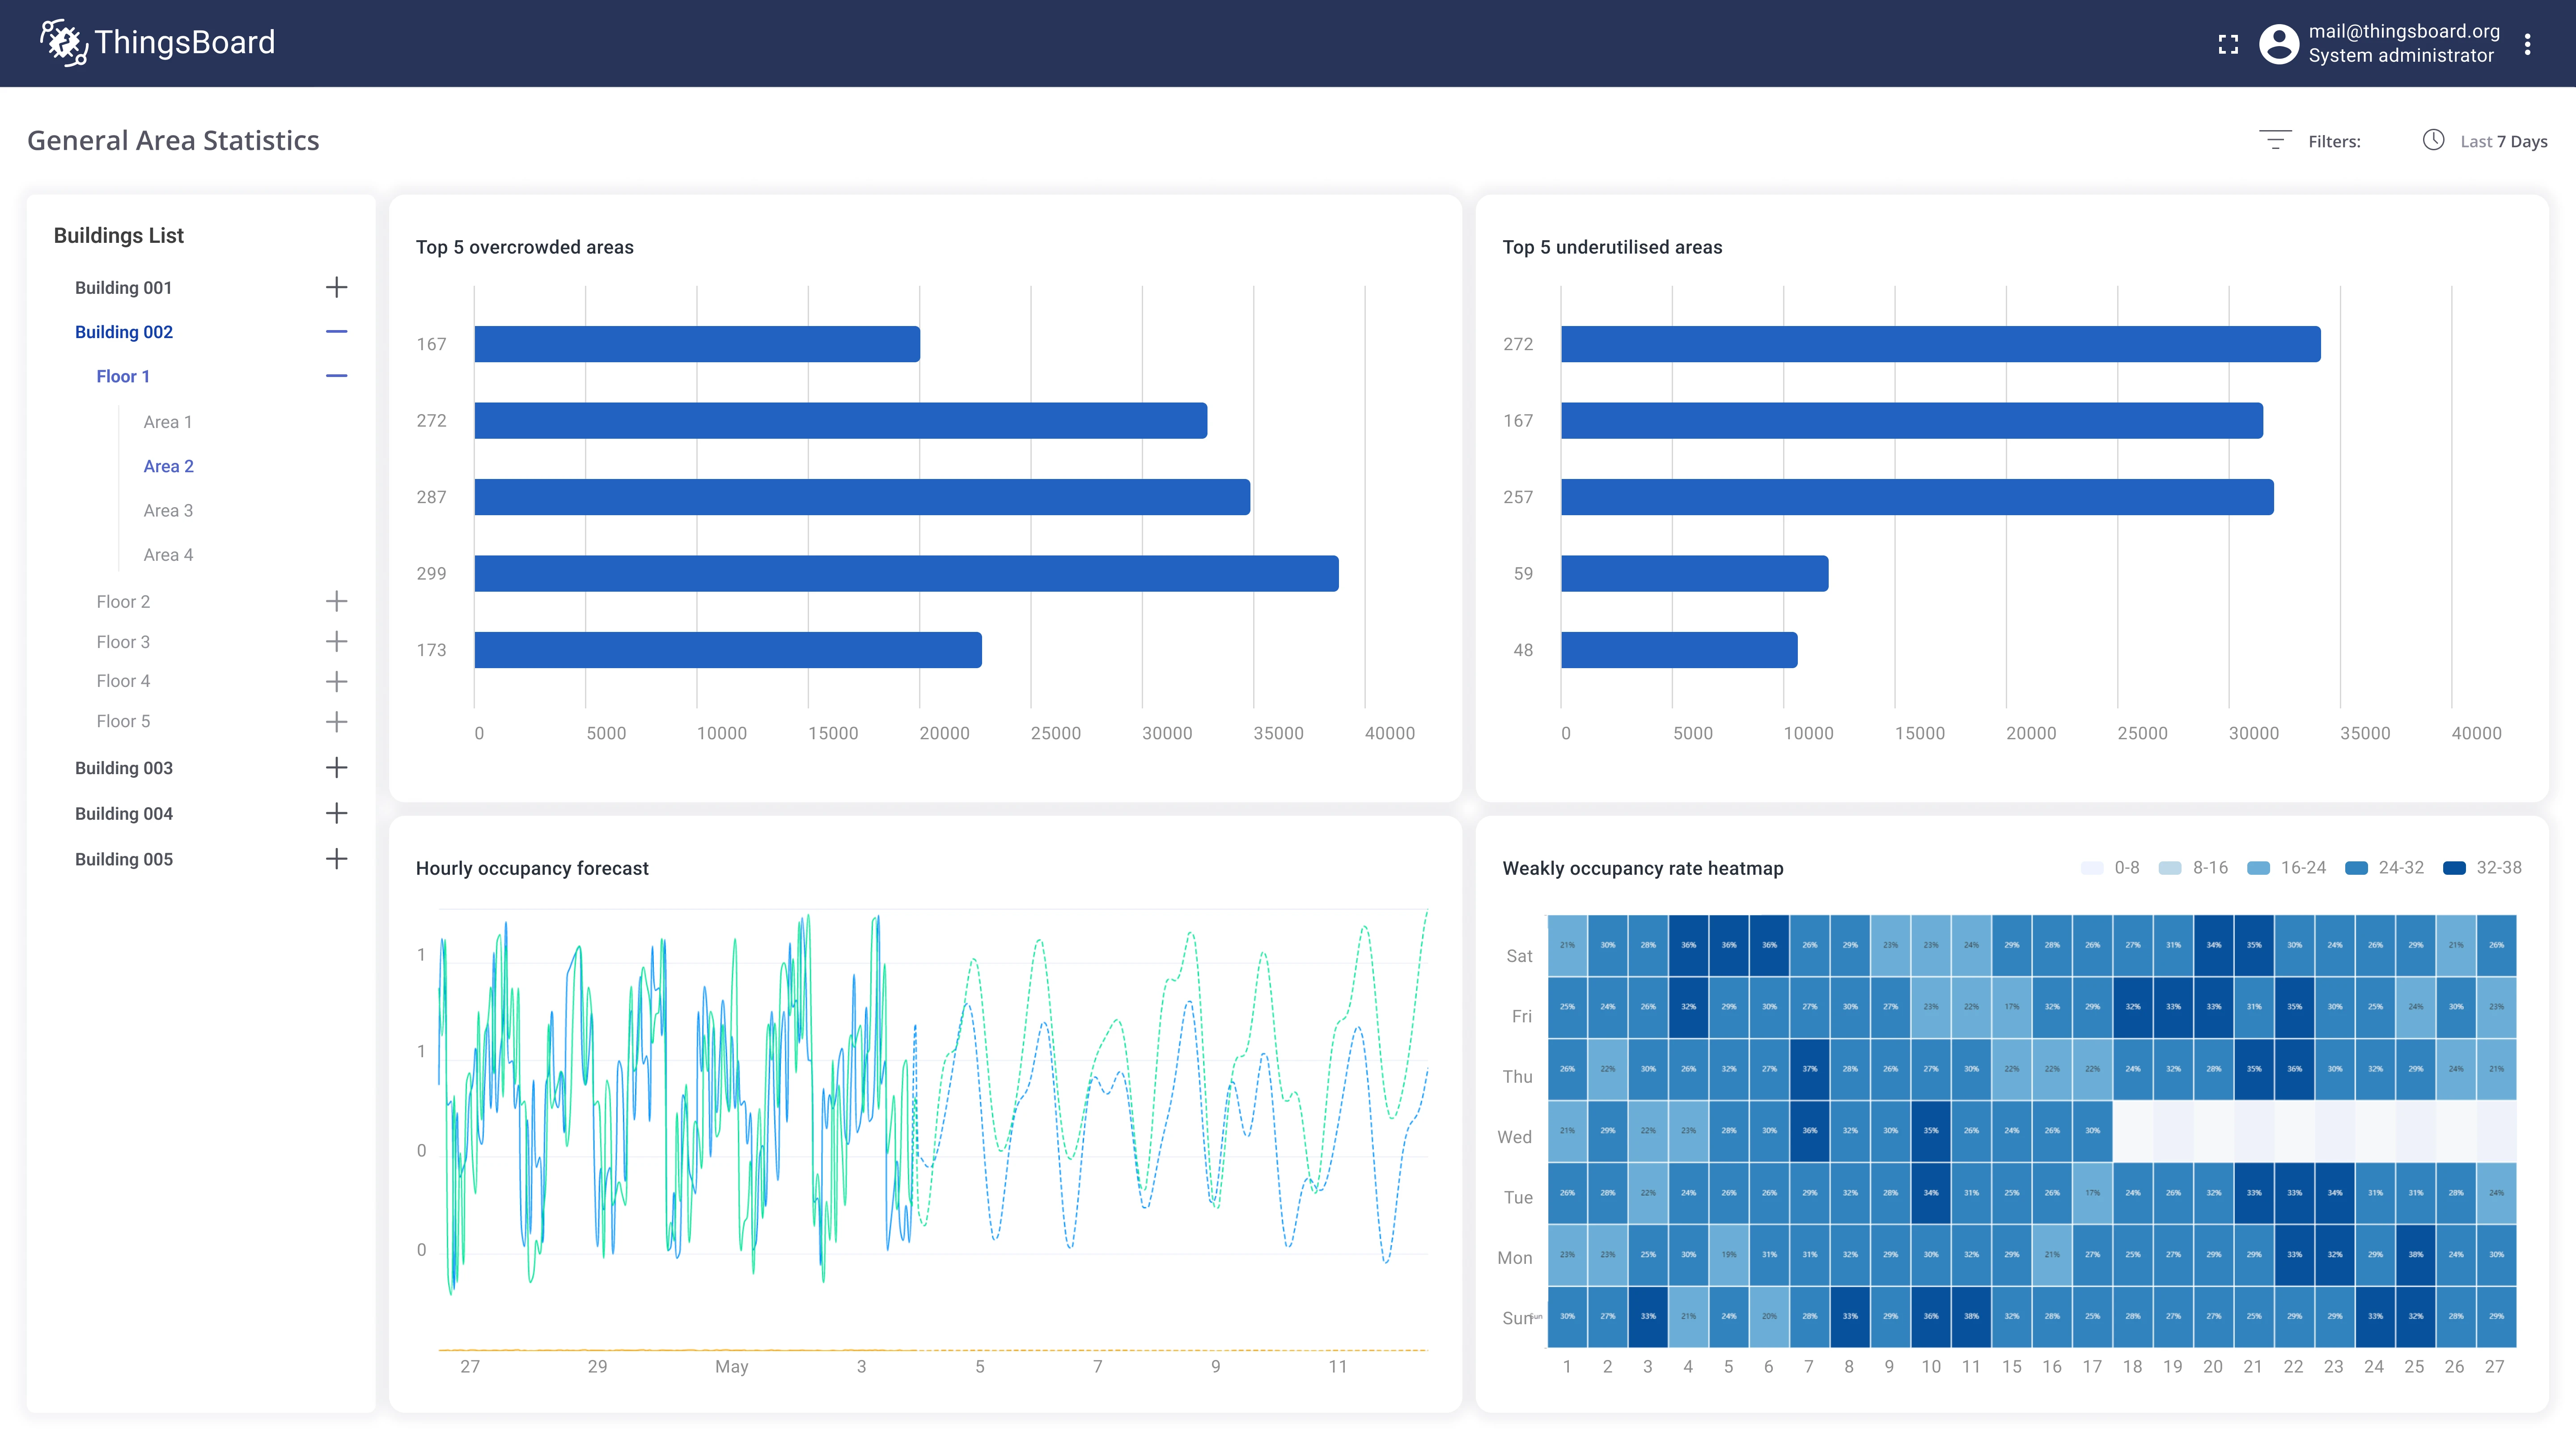
Knowing which hotel areas are busy and when lets management staff those areas efficiently, reduce energy waste in empty zones, and improve the guest experience. This guide shows how to build an occupancy monitoring solution using Trendz Analytics: a weekly heatmap, a 7-day forecast, top-5 overcrowded and underutilized area charts, and an interactive ThingsBoard dashboard with building-level filtering.
Task definition: Analyze occupancy rates for different areas within a hotel and predict hourly occupancy rates for the upcoming week.
Implementation plan
Section titled “Implementation plan”- Compute hourly occupancy rate as a percentage of max capacity per area.
- Aggregate occupancy rate at the floor and building level.
- Forecast occupancy for the upcoming week with hourly breakdown.
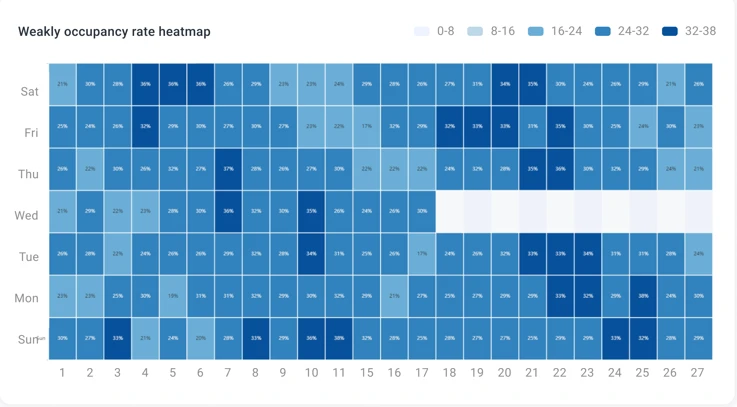
- Build a weekly heatmap to visualize patterns across hours and days.
- Show top-5 overcrowded and top-5 underutilized areas.
- Create an occupancy analysis dashboard in ThingsBoard.
Key outcomes
Section titled “Key outcomes”- reduction in utility costs
- reduction in labor costs
- increase in positive guest reviews
Prerequisites
Section titled “Prerequisites”- Occupancy sensors installed in each area, connected via LoRaWAN.
- Three asset types in ThingsBoard: Building, Floor, Area. A building has relations to multiple floors; a floor has relations to multiple areas; each area has a related occupancy sensor.
- Sensor payload:
{"ts": 1651419204000, "peopleCnt": 5} - Each Area asset has a
maxCapacityattribute set during provisioning.
Implementation
Section titled “Implementation”Step 1: Compute hourly occupancy rate per area
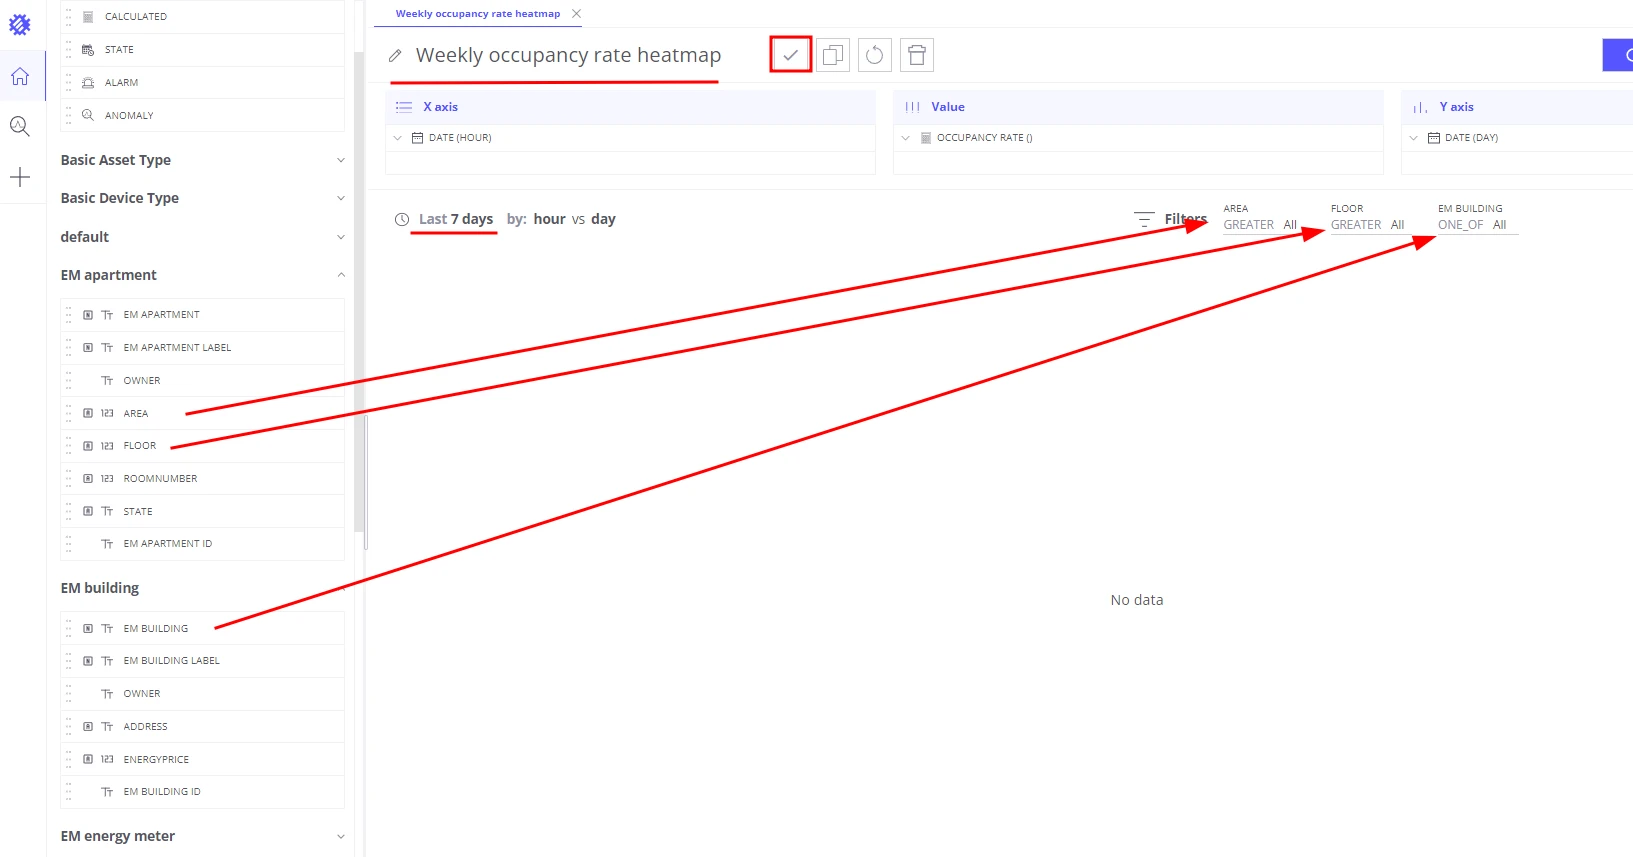
Section titled “Step 1: Compute hourly occupancy rate per area”Use a Trendz heatmap to visualize occupancy rate (as a percentage of max capacity) for each hour of the day over the last 7 days.
-
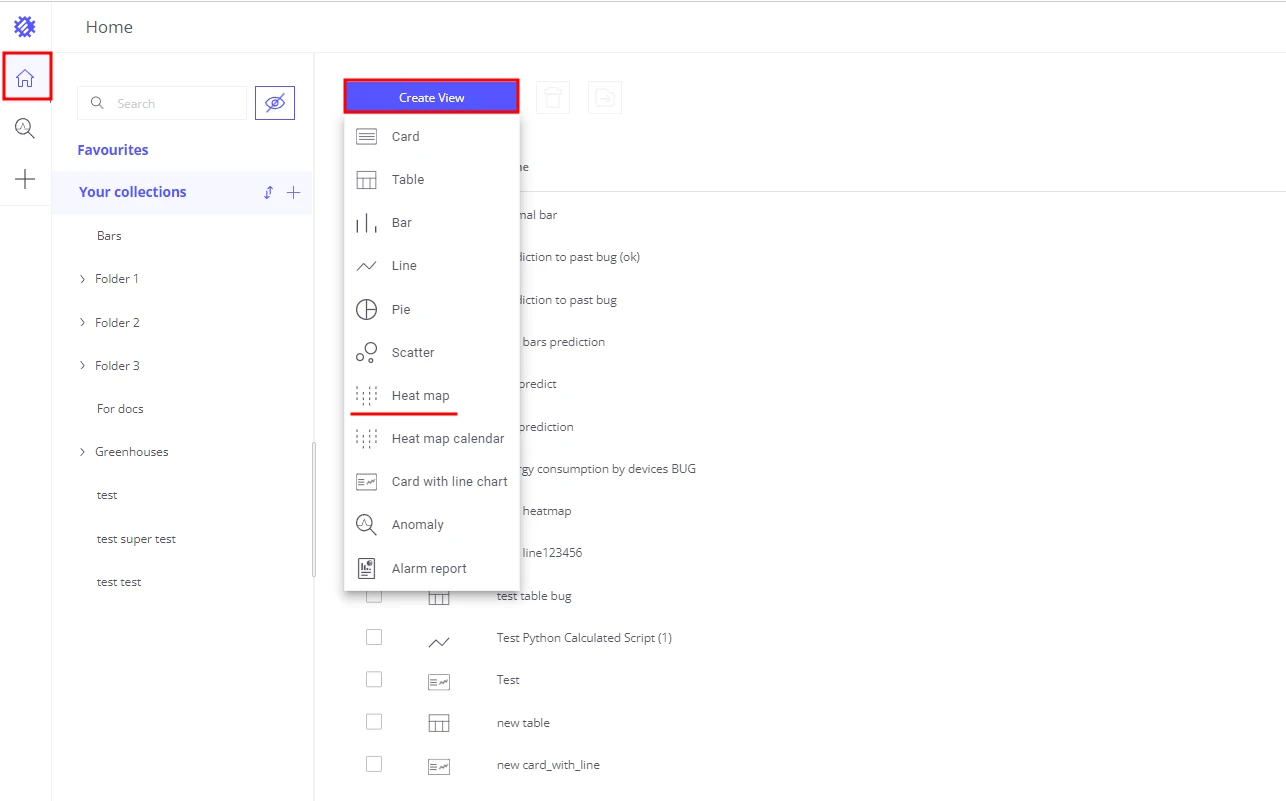
Create a Heatmap view in Trendz.
-
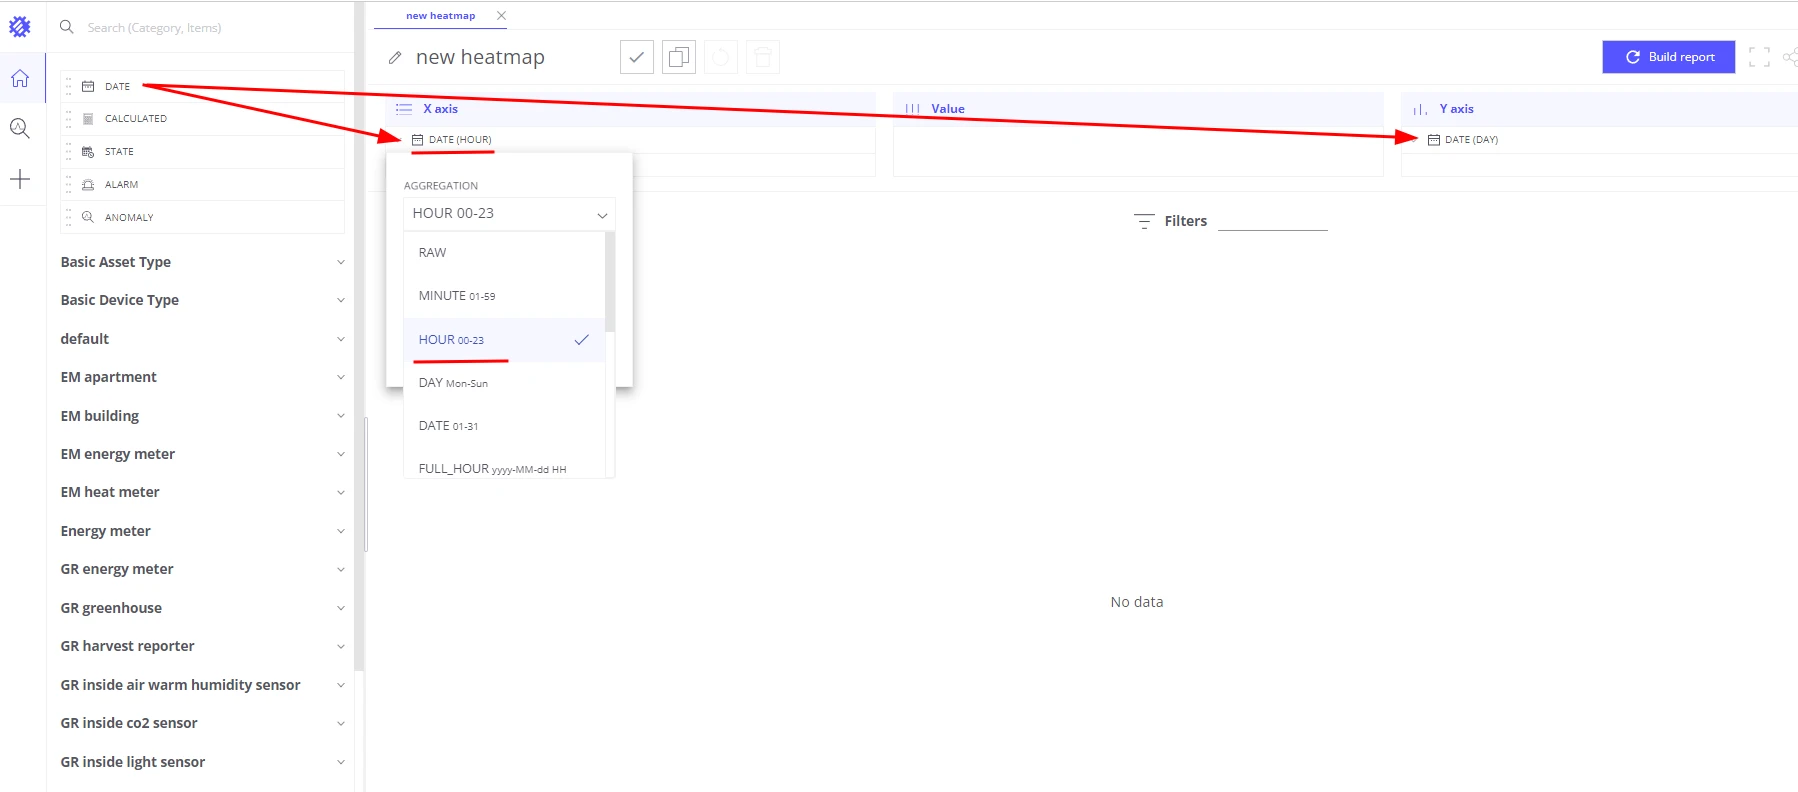
Add Date (Hour) to the X-axis section.
-
Add Date (Day) to the Y-axis section.
-
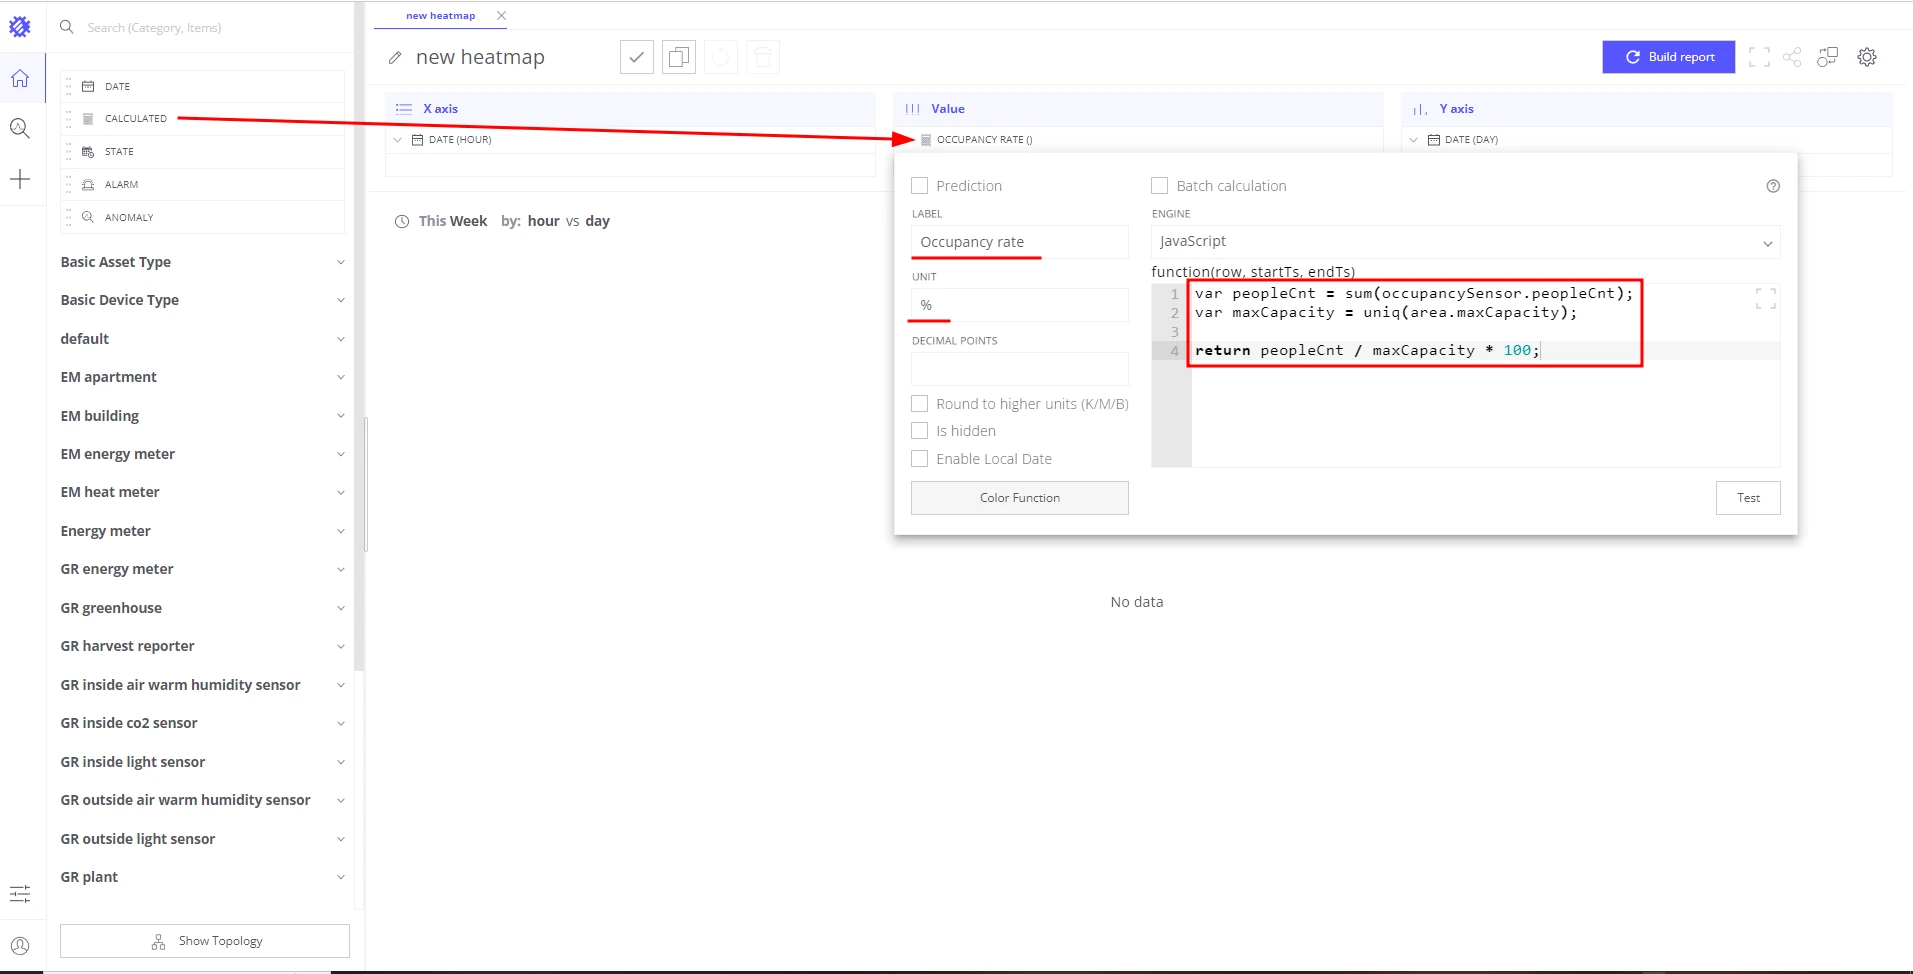
Add a Calculated field to the Value section, label:
Occupancy rate:var peopleCnt = sum(occupancySensor.peopleCnt);var maxCapacity = uniq(area.maxCapacity);return peopleCnt / maxCapacity * 100; -
Set the calculated field unit to
%. -
Add Area, Floor, and Building to the Filter section.
-
Set the default time range to Last 7 days.
-
Save the view as Weekly occupancy rate heatmap.
Step 2: Aggregate occupancy at floor and building level
Section titled “Step 2: Aggregate occupancy at floor and building level”The heatmap from Step 1 already supports this — no separate view is needed. When no filter is selected, the heatmap aggregates all sensors across all areas, floors, and buildings. When a user selects a specific building or floor in the filter, Trendz automatically:
- Fetches all floors for the selected building.
- Loads all areas for each floor.
- Loads occupancy data for each sensor in those areas.
- Applies the calculation and aggregates results at the selected level.
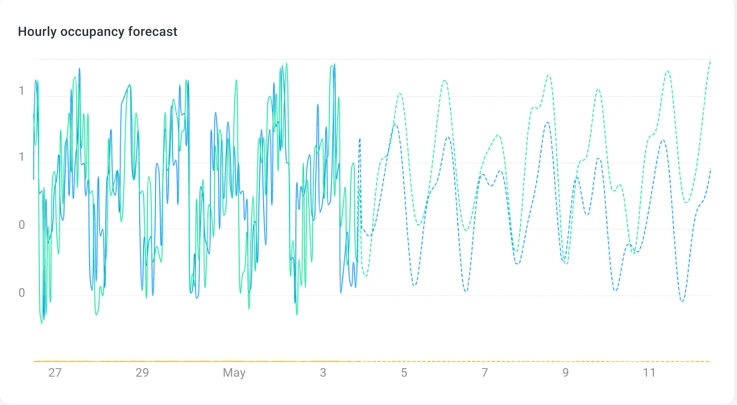
Step 3: Forecast occupancy for the upcoming week
Section titled “Step 3: Forecast occupancy for the upcoming week”-
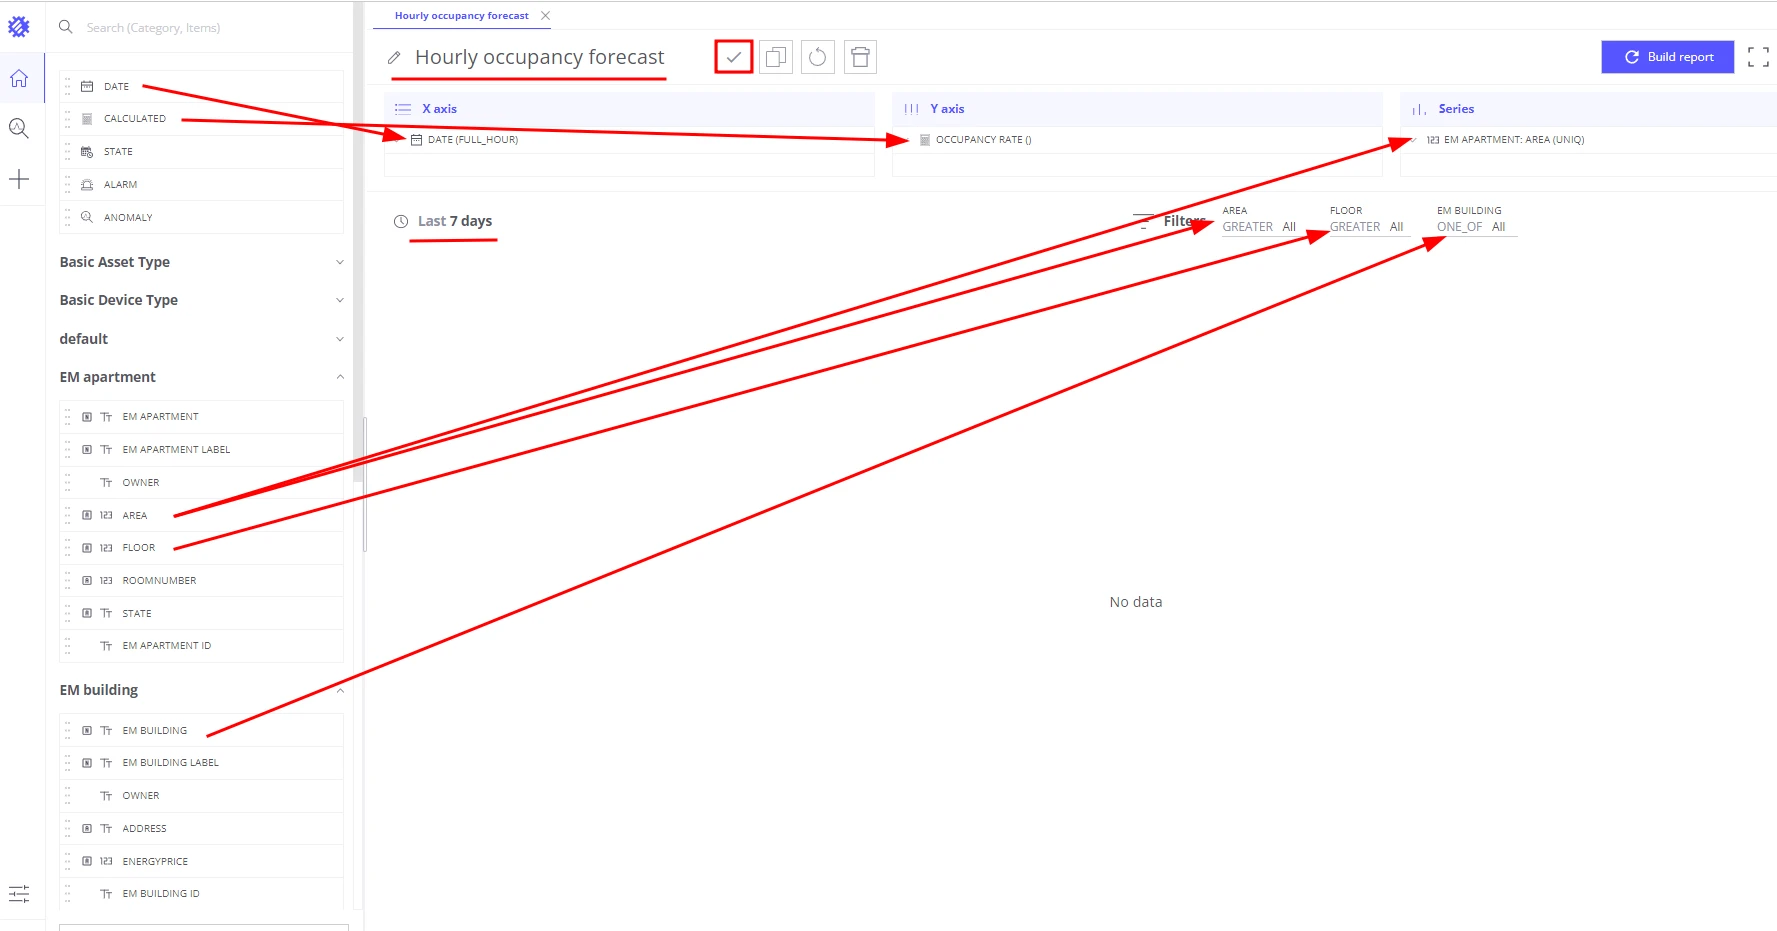
Create a Line chart view in Trendz.
-
Add Date (Full Hour) to the X-axis section.
-
Add a Calculated field to the Y-axis section, label:
Occupancy rate:var peopleCnt = sum(occupancySensor.peopleCnt);var maxCapacity = uniq(area.maxCapacity);return peopleCnt / maxCapacity * 100; -
Set the unit to
%. -
Add Area name to the Series section — shows a separate line per area.
-
Add Area, Floor, and Building to the Filter section.
-
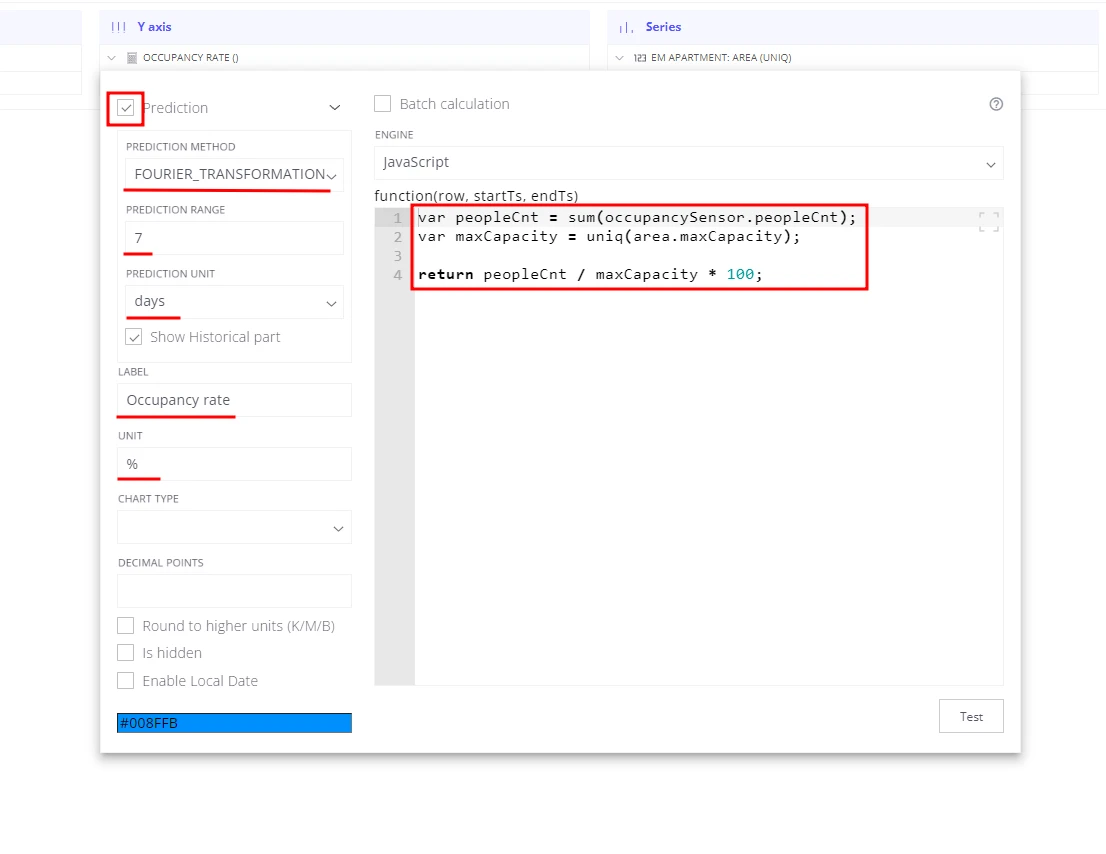
Click the Occupancy rate field in the Y-axis section, enable Prediction:
- Prediction method: Fourier transformation
- Prediction range:
7 - Prediction unit:
days
-
Set the default time range to Last 7 days.
-
Save the view as Hourly occupancy forecast.
Historical data is shown as solid lines; the forecast appears as dashed lines extending 7 days into the future.
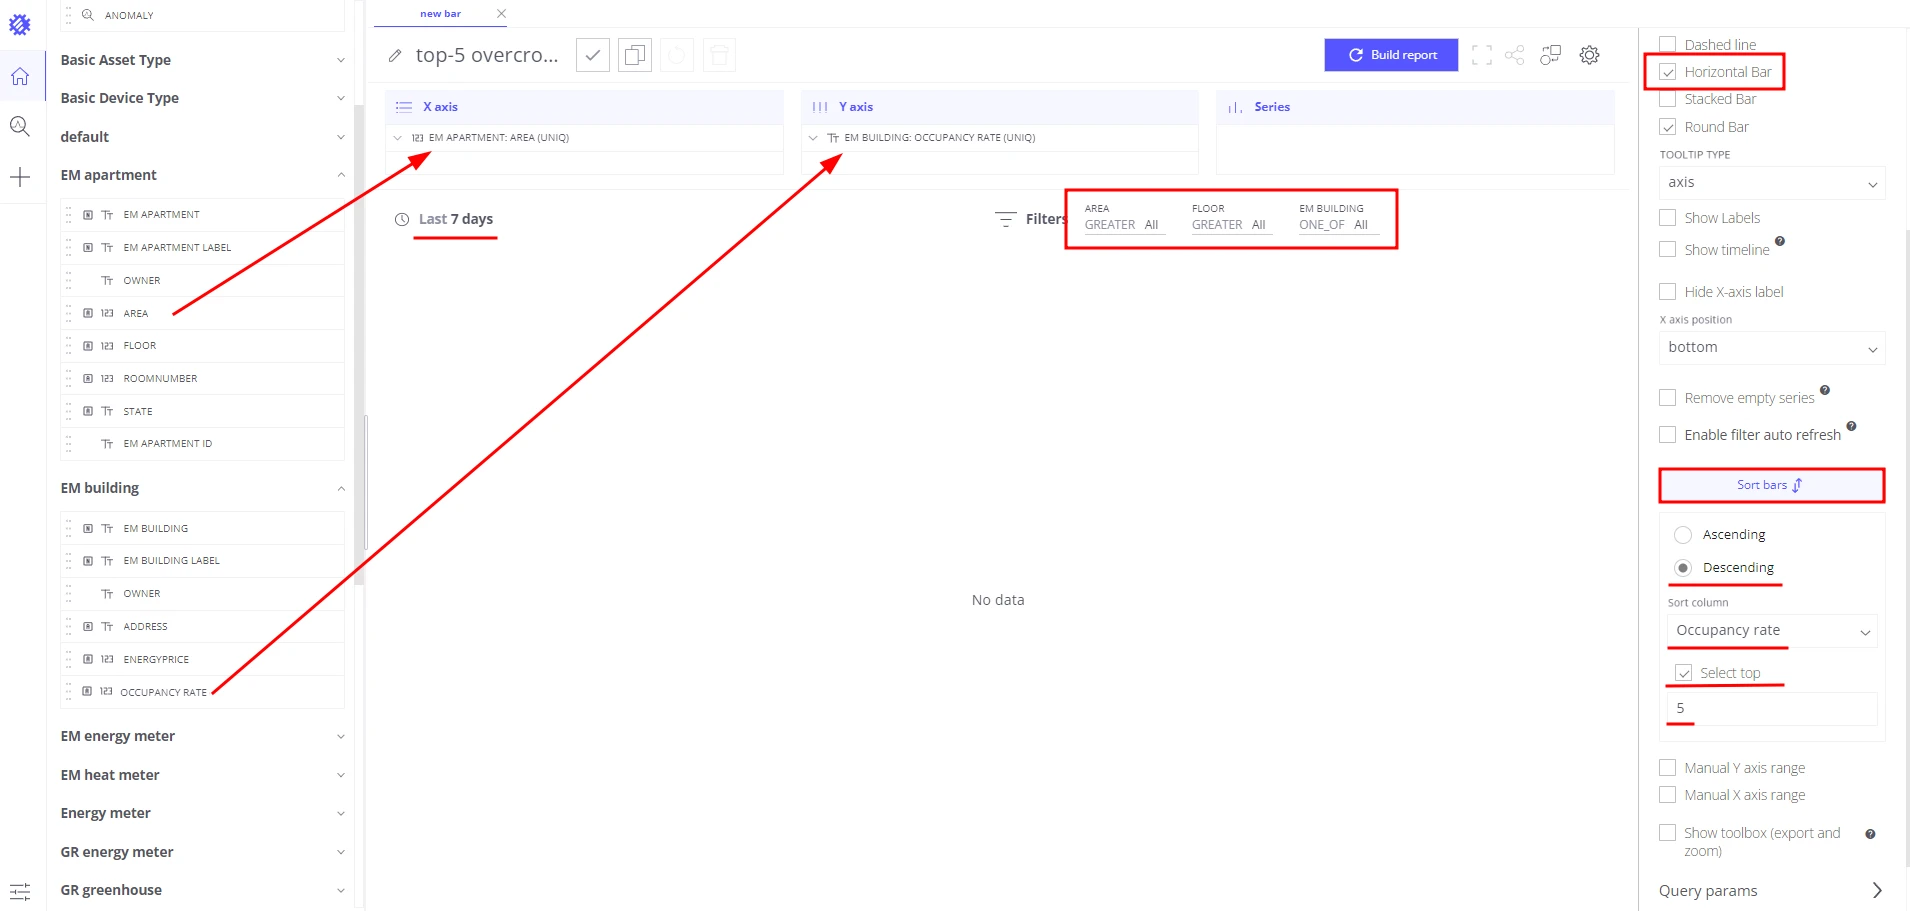
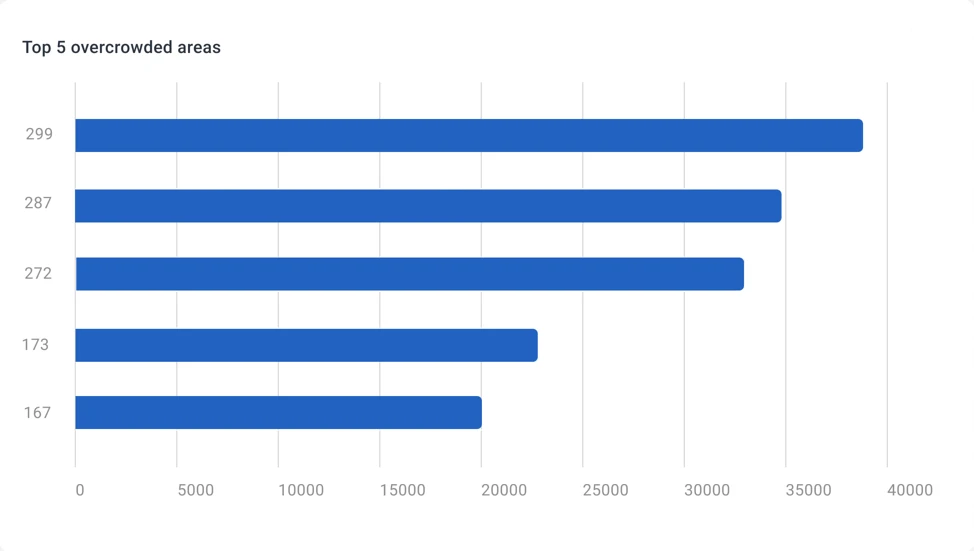
Step 4: Top-5 overcrowded and underutilized areas
Section titled “Step 4: Top-5 overcrowded and underutilized areas”- Create a Bar chart view in Trendz.
- Add Area name to the X-axis section.
- Add the Occupancy rate calculated field to the Y-axis section (reuse the formula from Step 1).
- Add Area, Floor, and Building to the Filter section.
- Open view settings:
- Sorting: Descending
- Limit:
5 - Enable Horizontal bar chart
- Set the default time range to Last 7 days.
- Save the view as top-5 overcrowded areas.
- Clone the view, change sorting to Ascending, and save as top-5 underutilized areas.
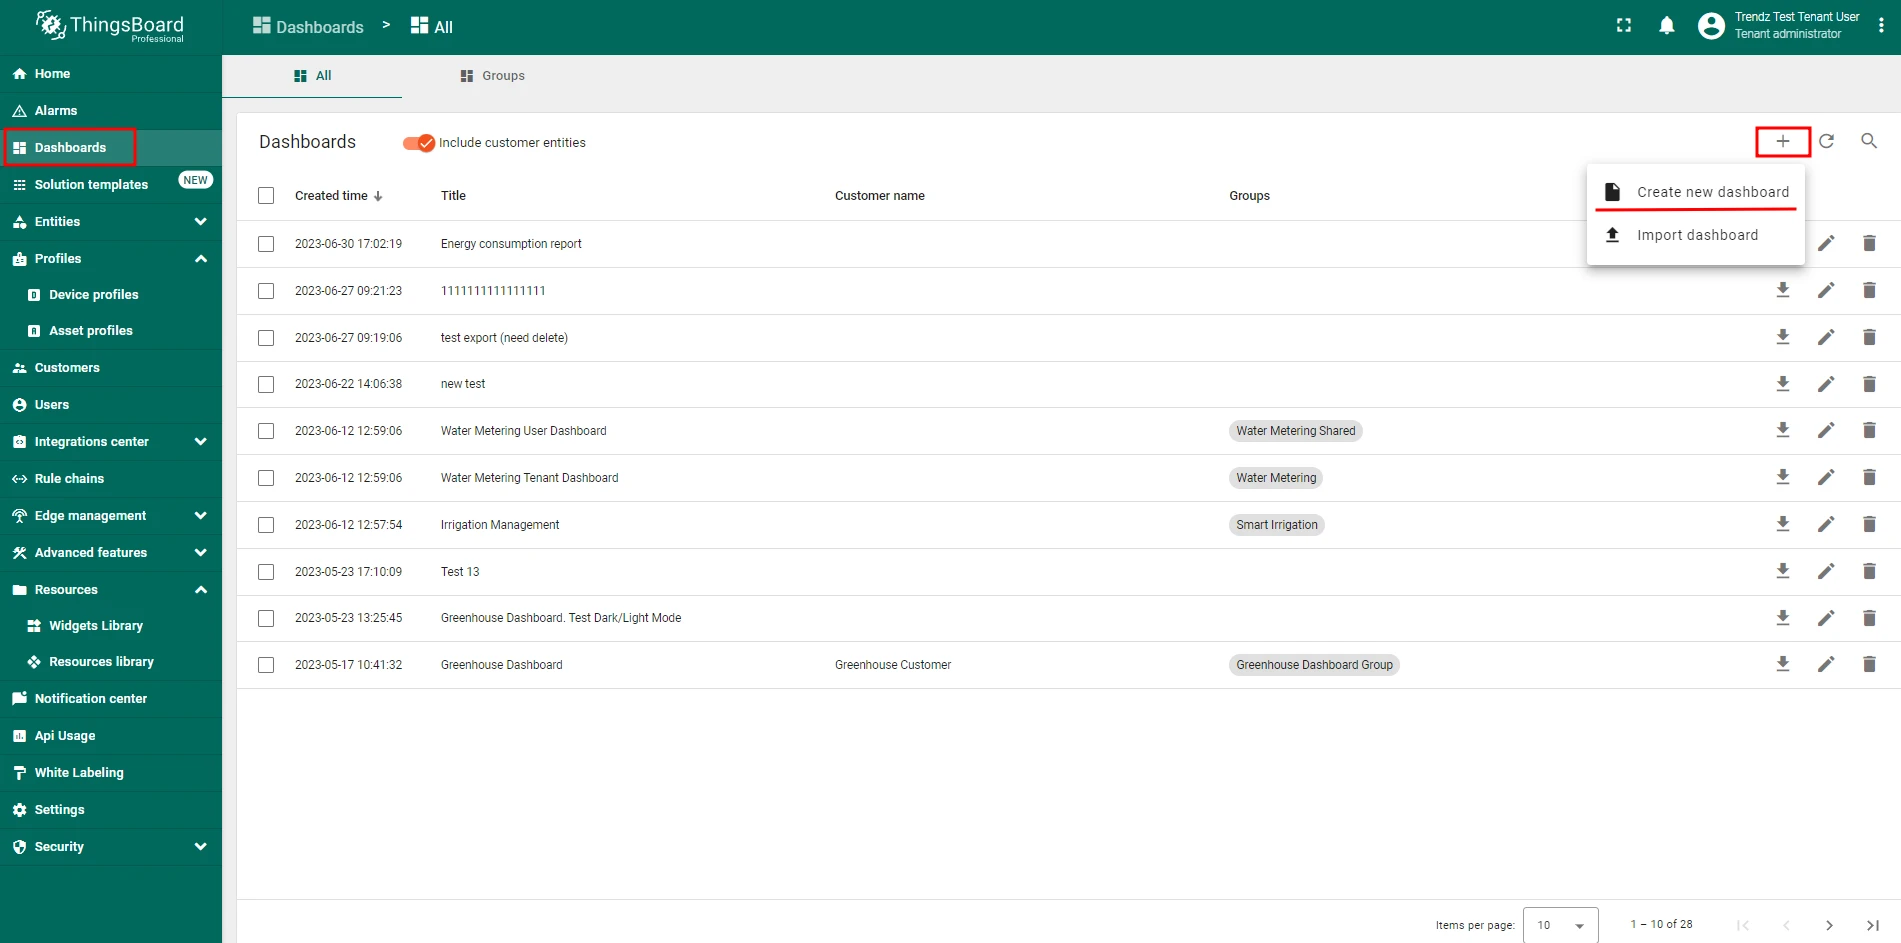
Step 5: Create the occupancy analysis dashboard in ThingsBoard
Section titled “Step 5: Create the occupancy analysis dashboard in ThingsBoard”- In ThingsBoard, create a dashboard named Occupancy analysis.
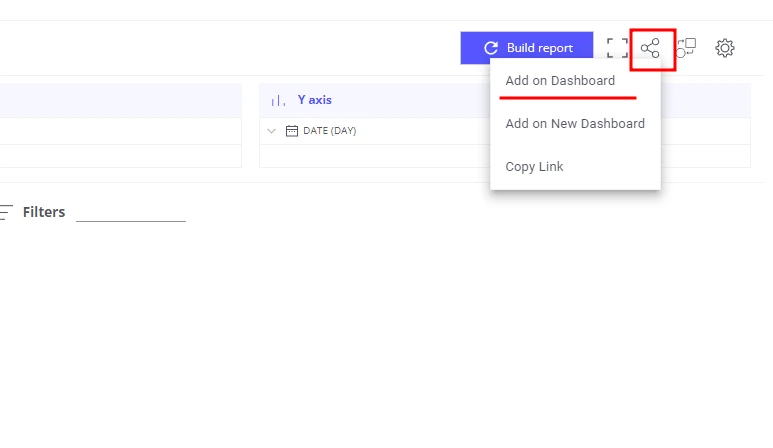
- In Trendz, for each view created in Steps 1–4:
- Click Share to ThingsBoard → copy Add on Dashboard.
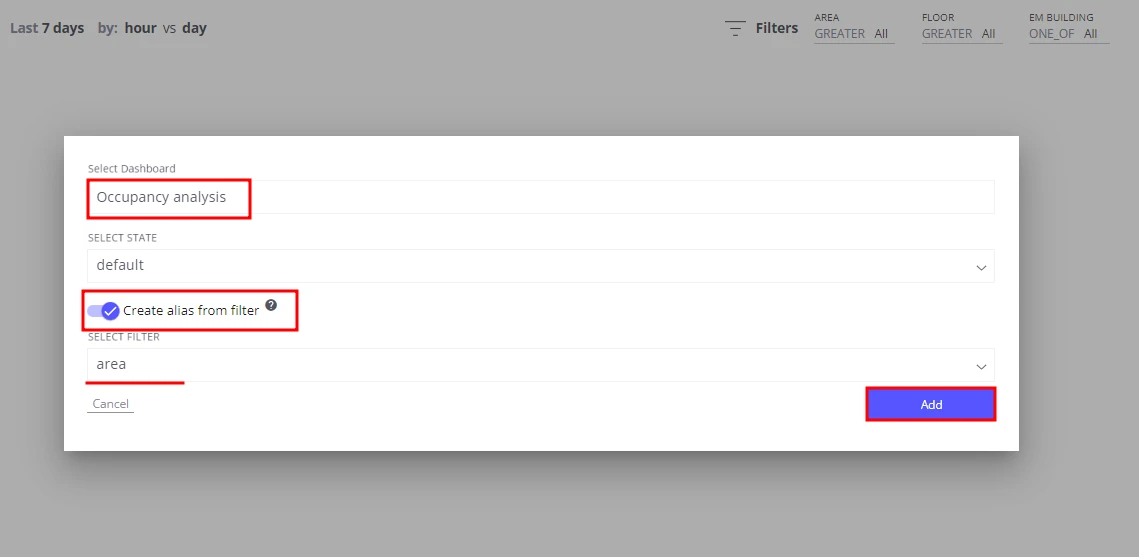
- Select the Occupancy analysis dashboard.
- Enable Create alias and choose Area name as the filter entity.
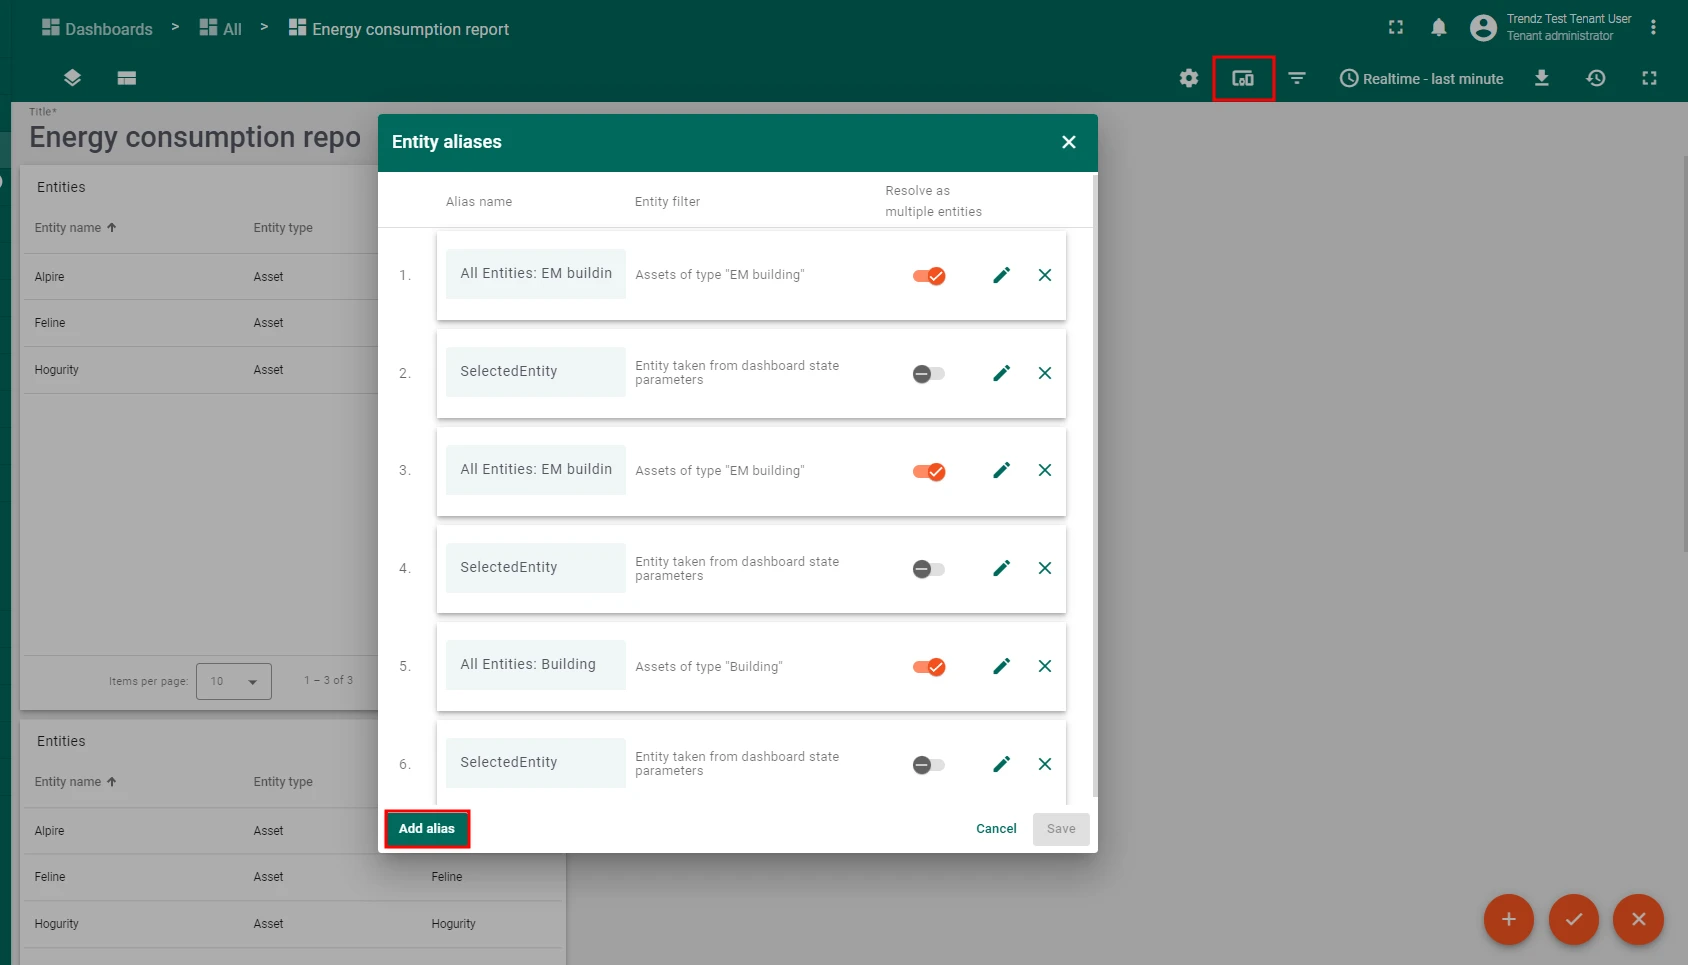
- Back in ThingsBoard, tune the dashboard layout.
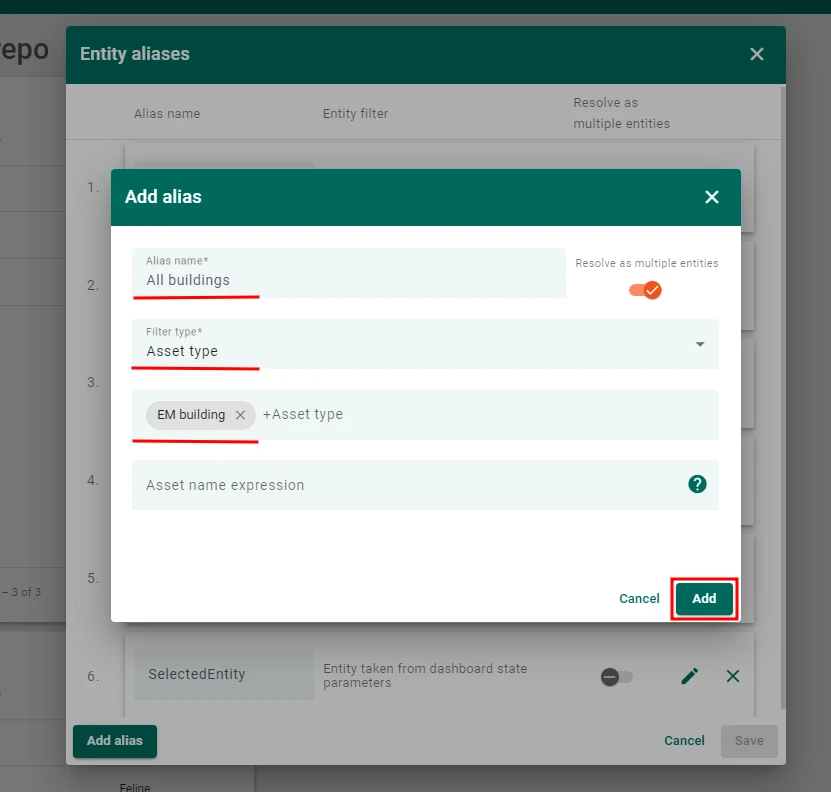
- Create the alias All buildings:
- Filter type: Asset type
- Asset type: Building
- Create the alias Selected entity:
- Filter type: Entity from dashboard state
- State entity parameter name:
selectedEntity
- Create the alias Filtered areas:
- Filter type: Asset search query
- Enable Root entity with parameter name:
selectedEntity - Enable Fetch last level relation only
- Direction: From
- Max relation level:
3 - Asset types: Area
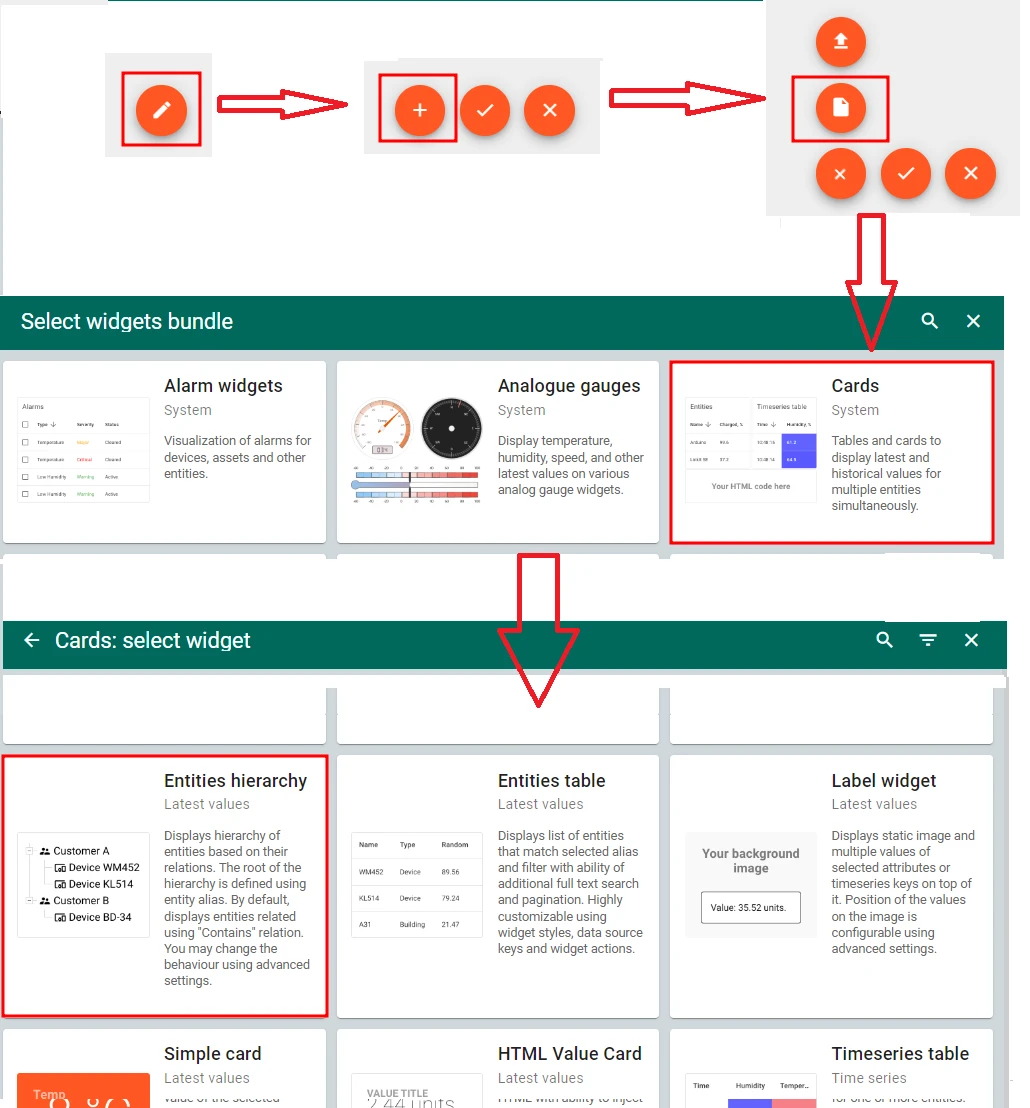
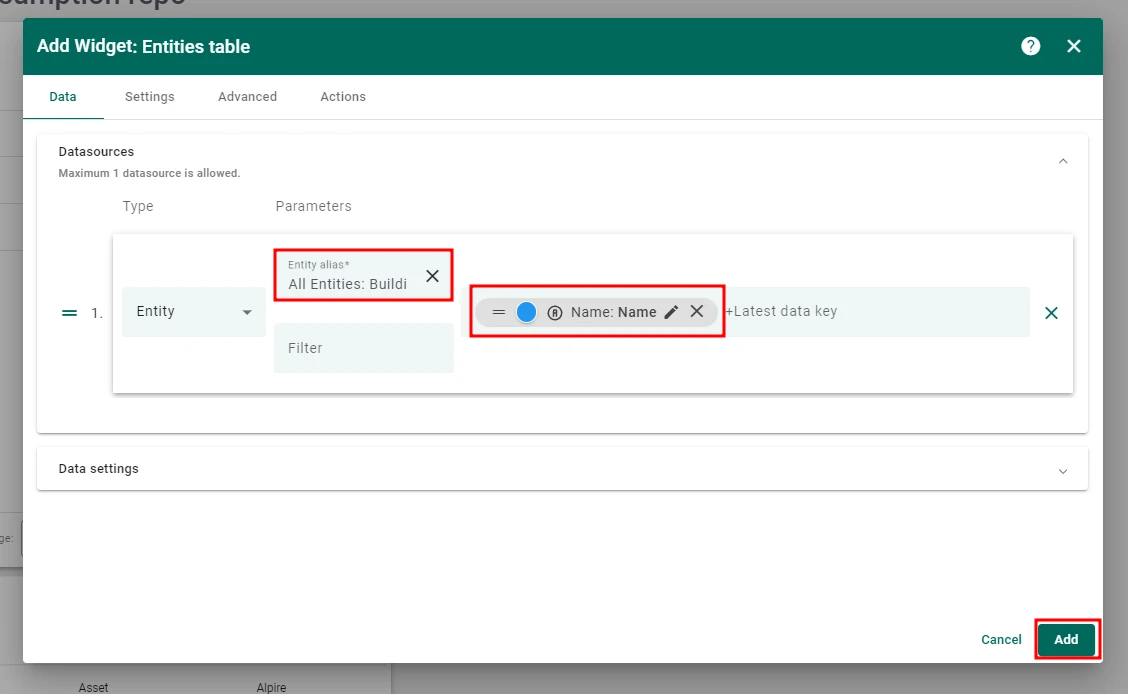
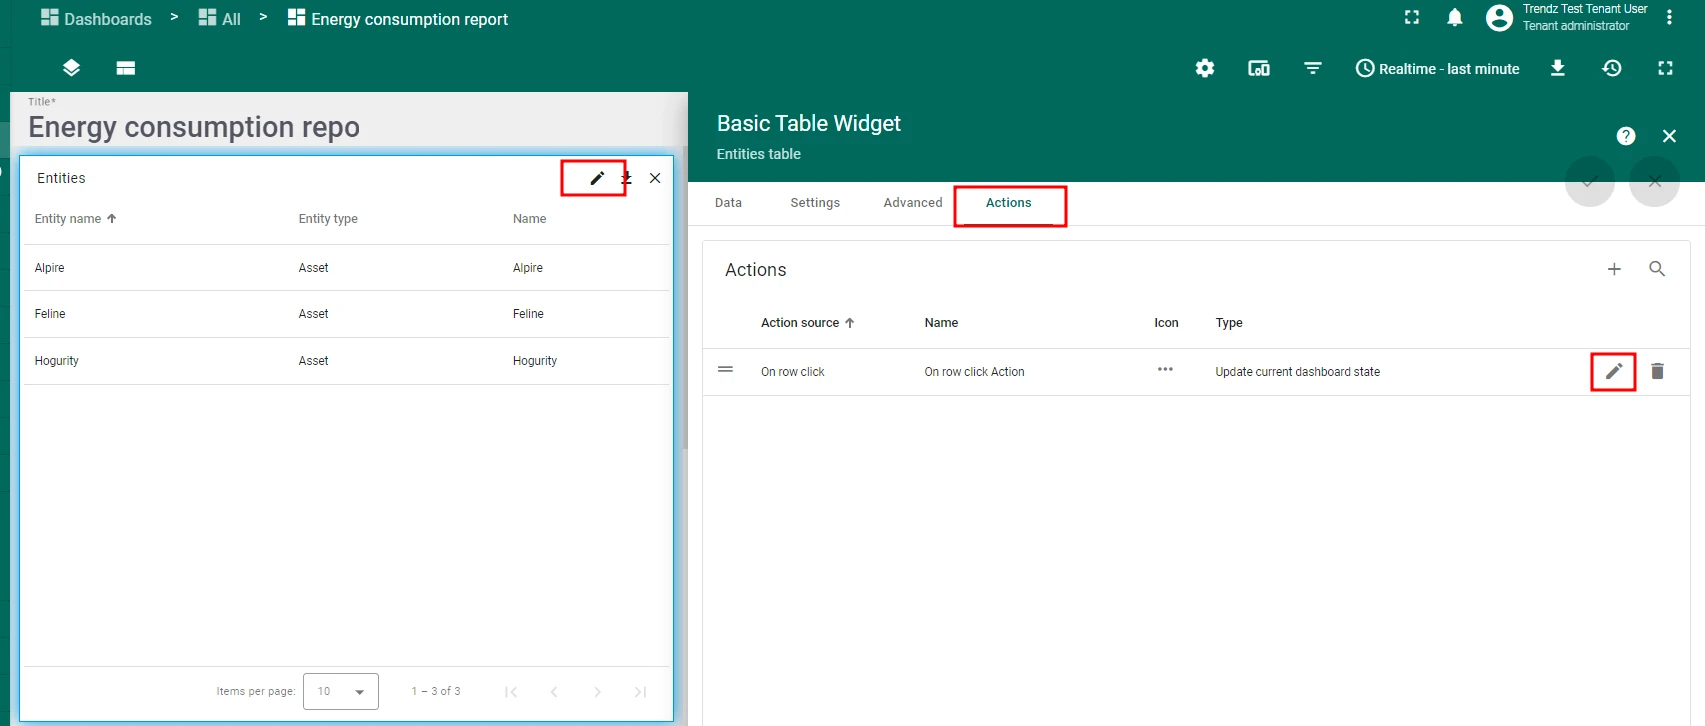
- Add a Cards → Entities hierarchy widget:
- Datasource alias: All buildings
- Latest data key: Name
- Add an On node selected action:
- Action type: Update current dashboard state
- State entity parameter name:
selectedEntity
- For all Trendz widgets, set the datasource alias to Filtered areas.
- Save the dashboard.
When a user clicks a building, floor, or area in the hierarchy widget, the Filtered areas alias refreshes and all Trendz widgets update to show occupancy data for the selected scope.

Summary
Section titled “Summary”The occupancy monitoring solution built in this guide gives hotel management real-time and predictive insight into how each area of their property is being used. With hourly heatmaps, 7-day forecasts, and top-5 charts for overcrowded and underutilized zones, teams can optimize staffing, reduce energy waste in empty areas, and proactively address capacity issues before they affect guest experience.
Was this helpful?