Getting Started with Trendz Analytics
This guide walks you through the core Trendz workflows end-to-end using a sample energy metering dataset. You will learn how to discover your ThingsBoard topology, build analytics views, add them to a dashboard, create calculated fields, train a prediction model, detect anomalies, and use the AI Assistant.
Prerequisites
Section titled “Prerequisites”You need a running Trendz Analytics instance. The quickest option is the ThingsBoard Cloud add-on (no installation required). For self-hosted deployments, follow the Installation guide.
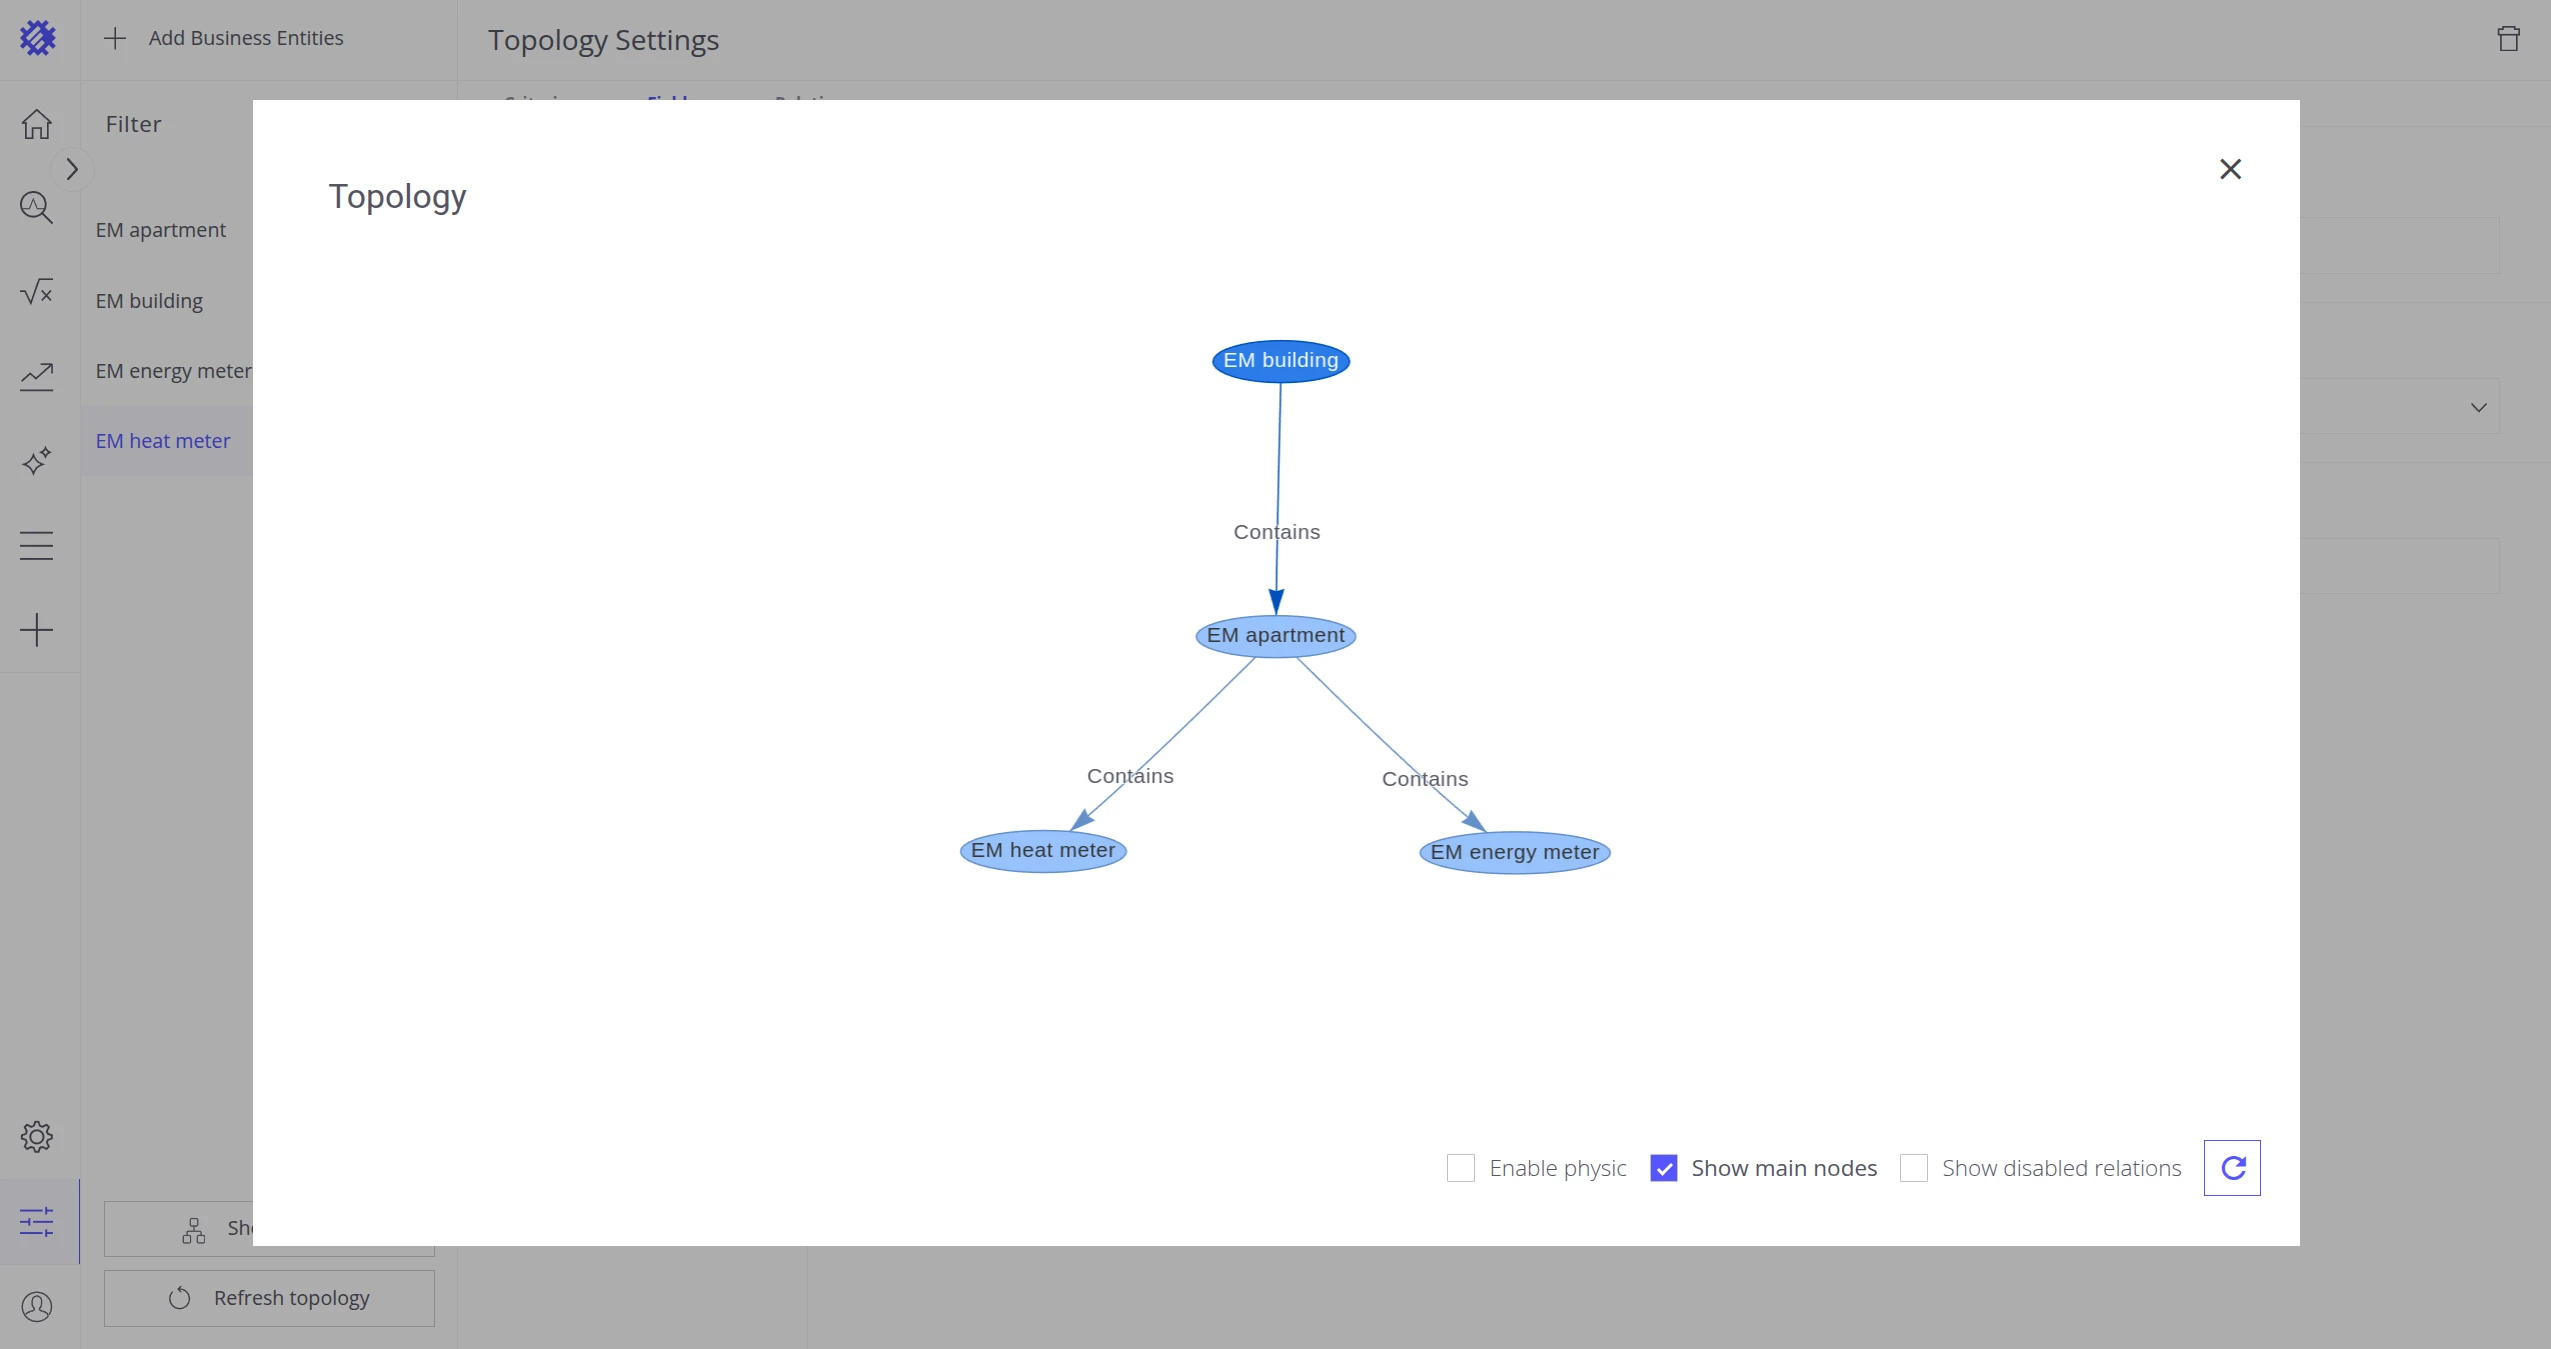
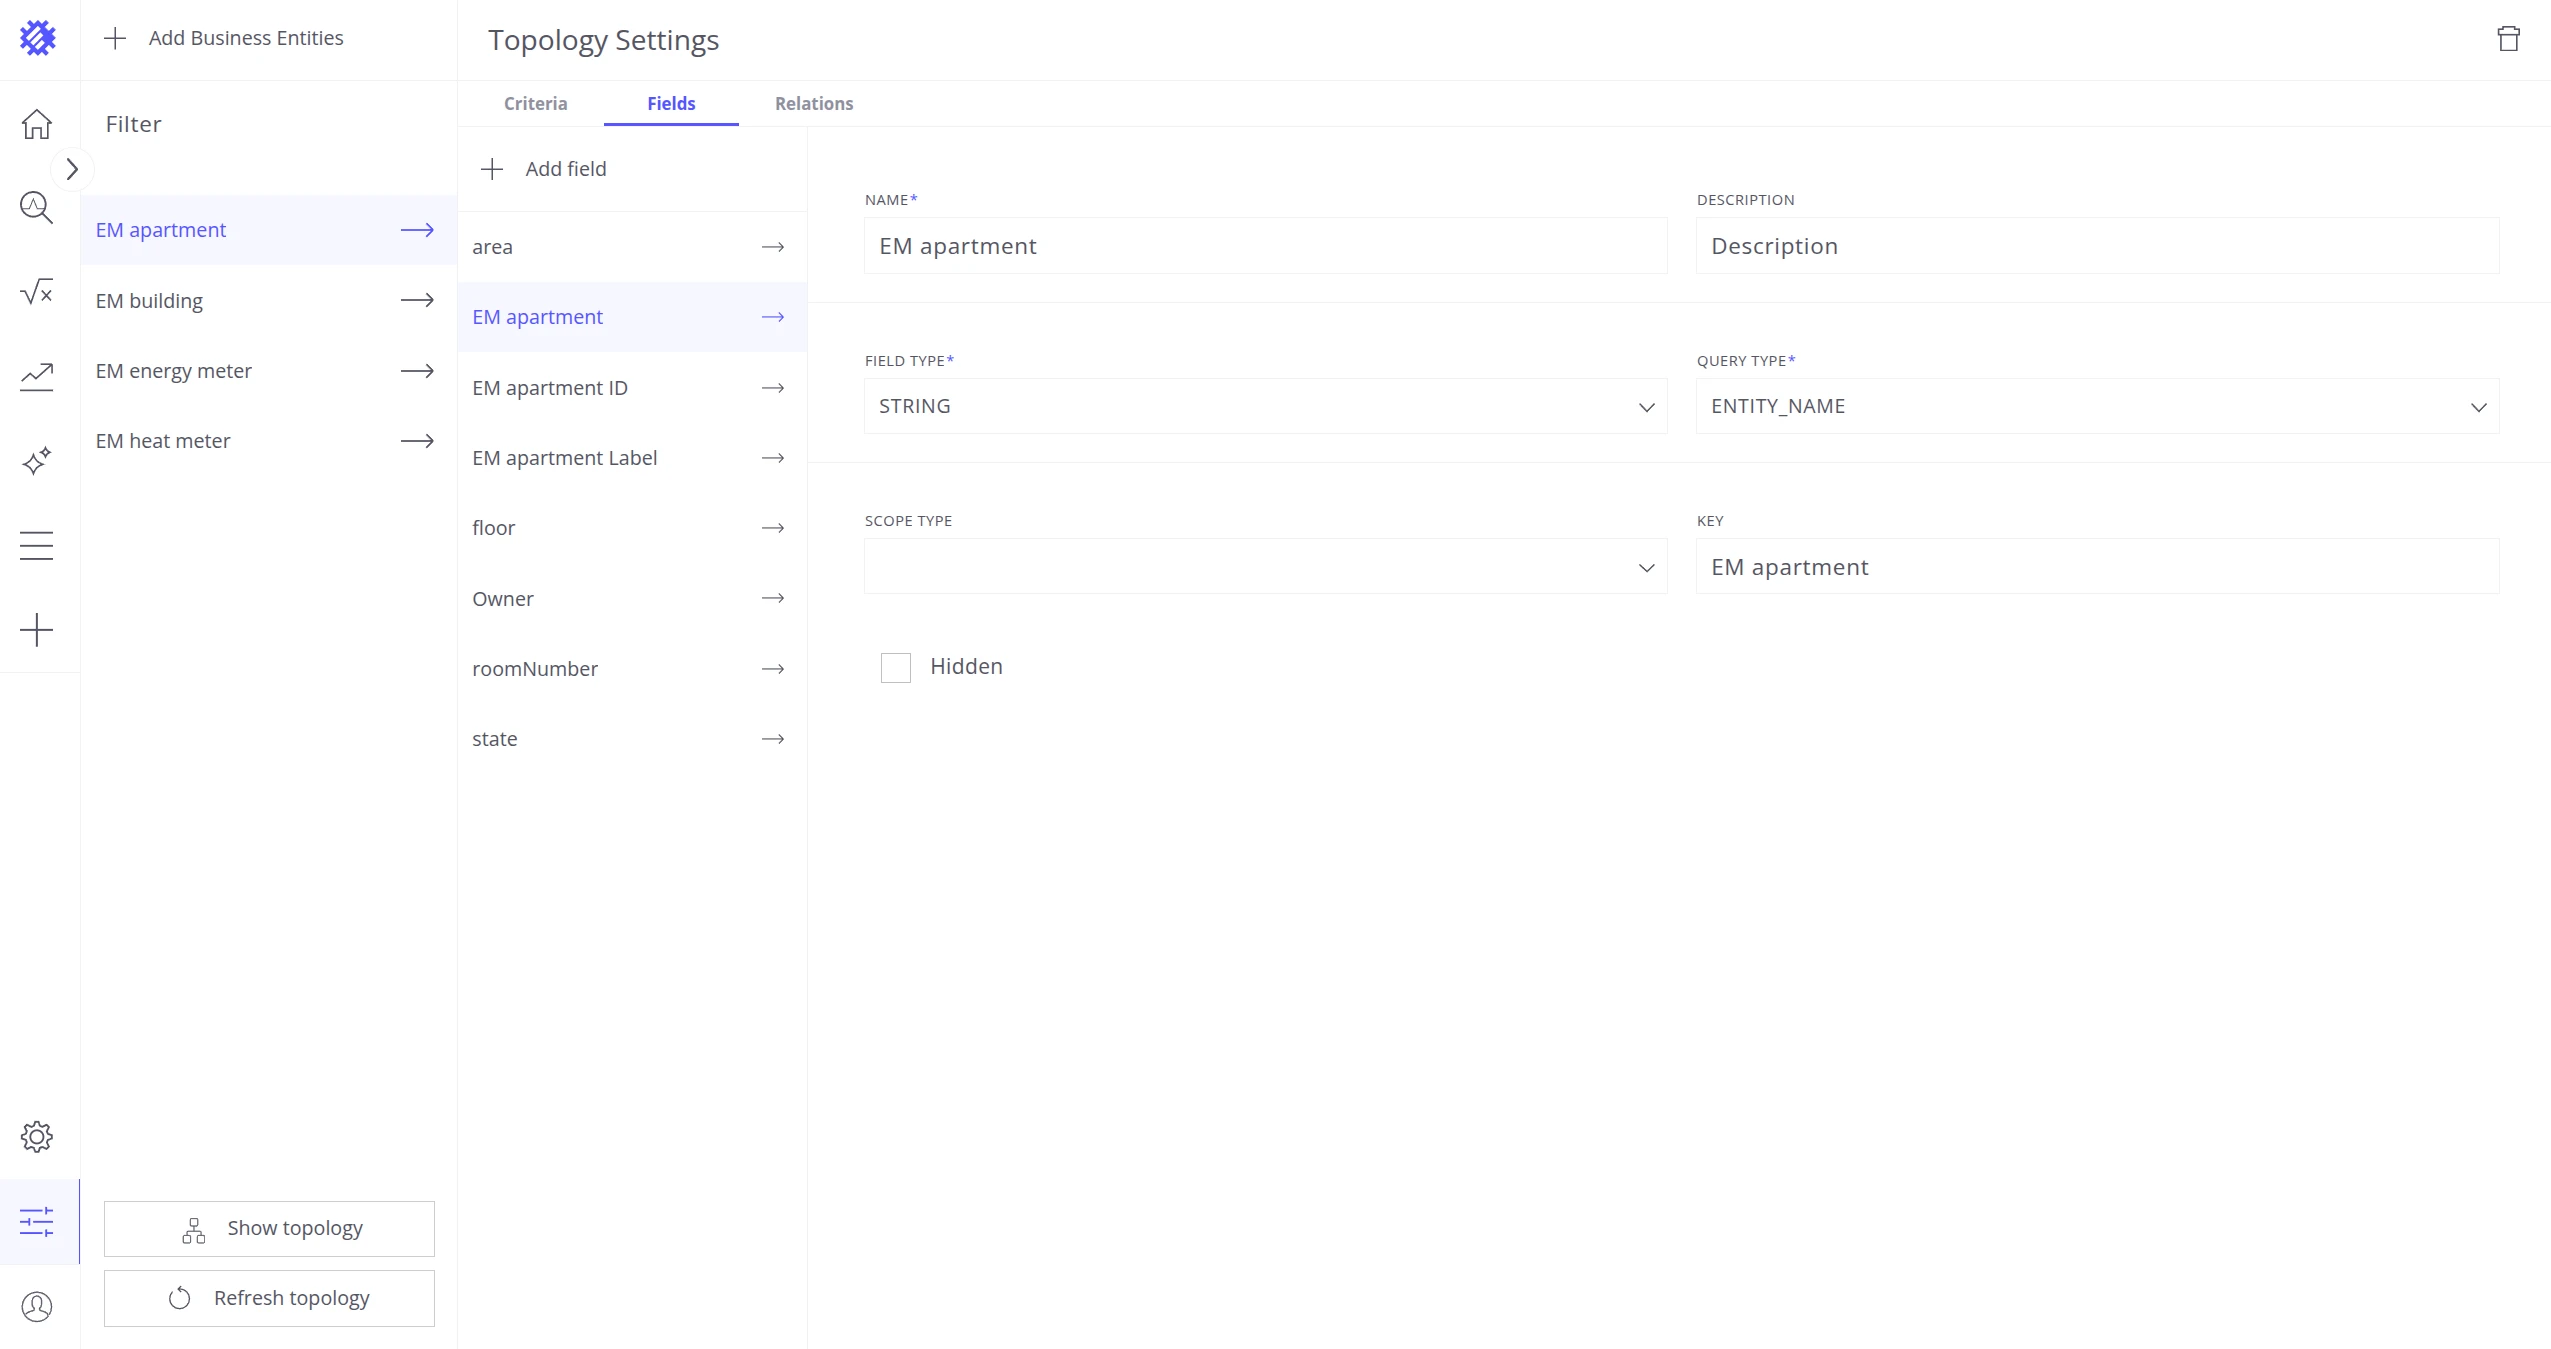
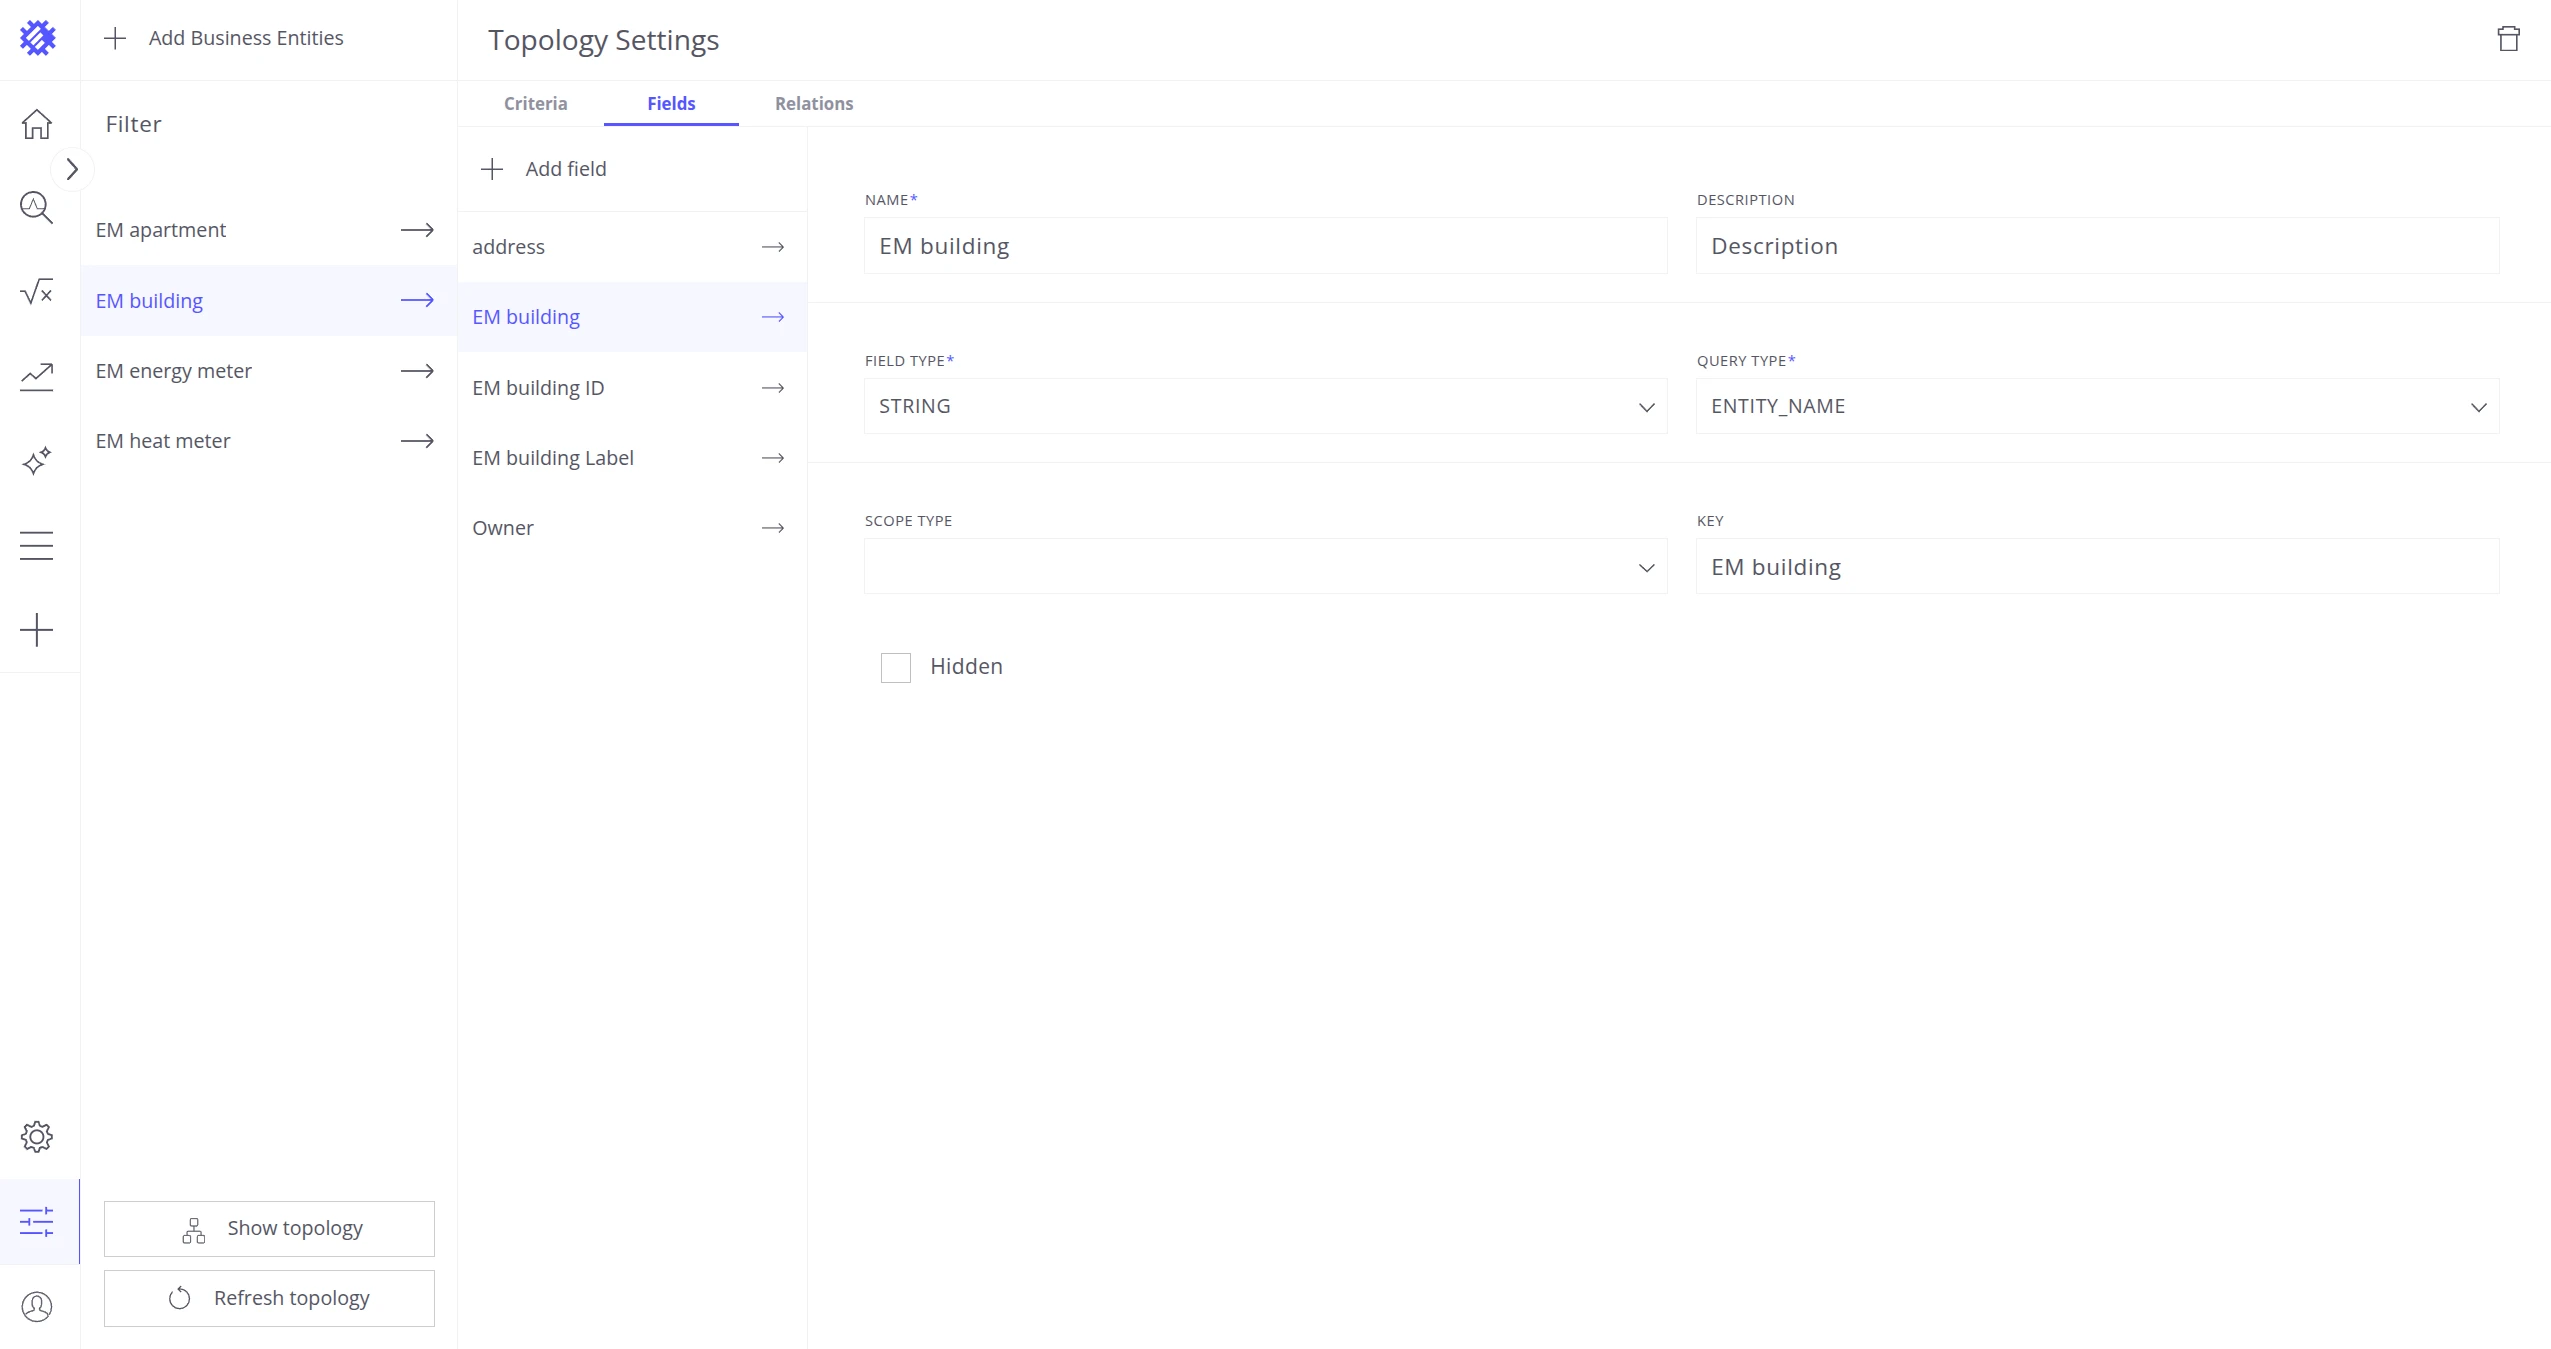
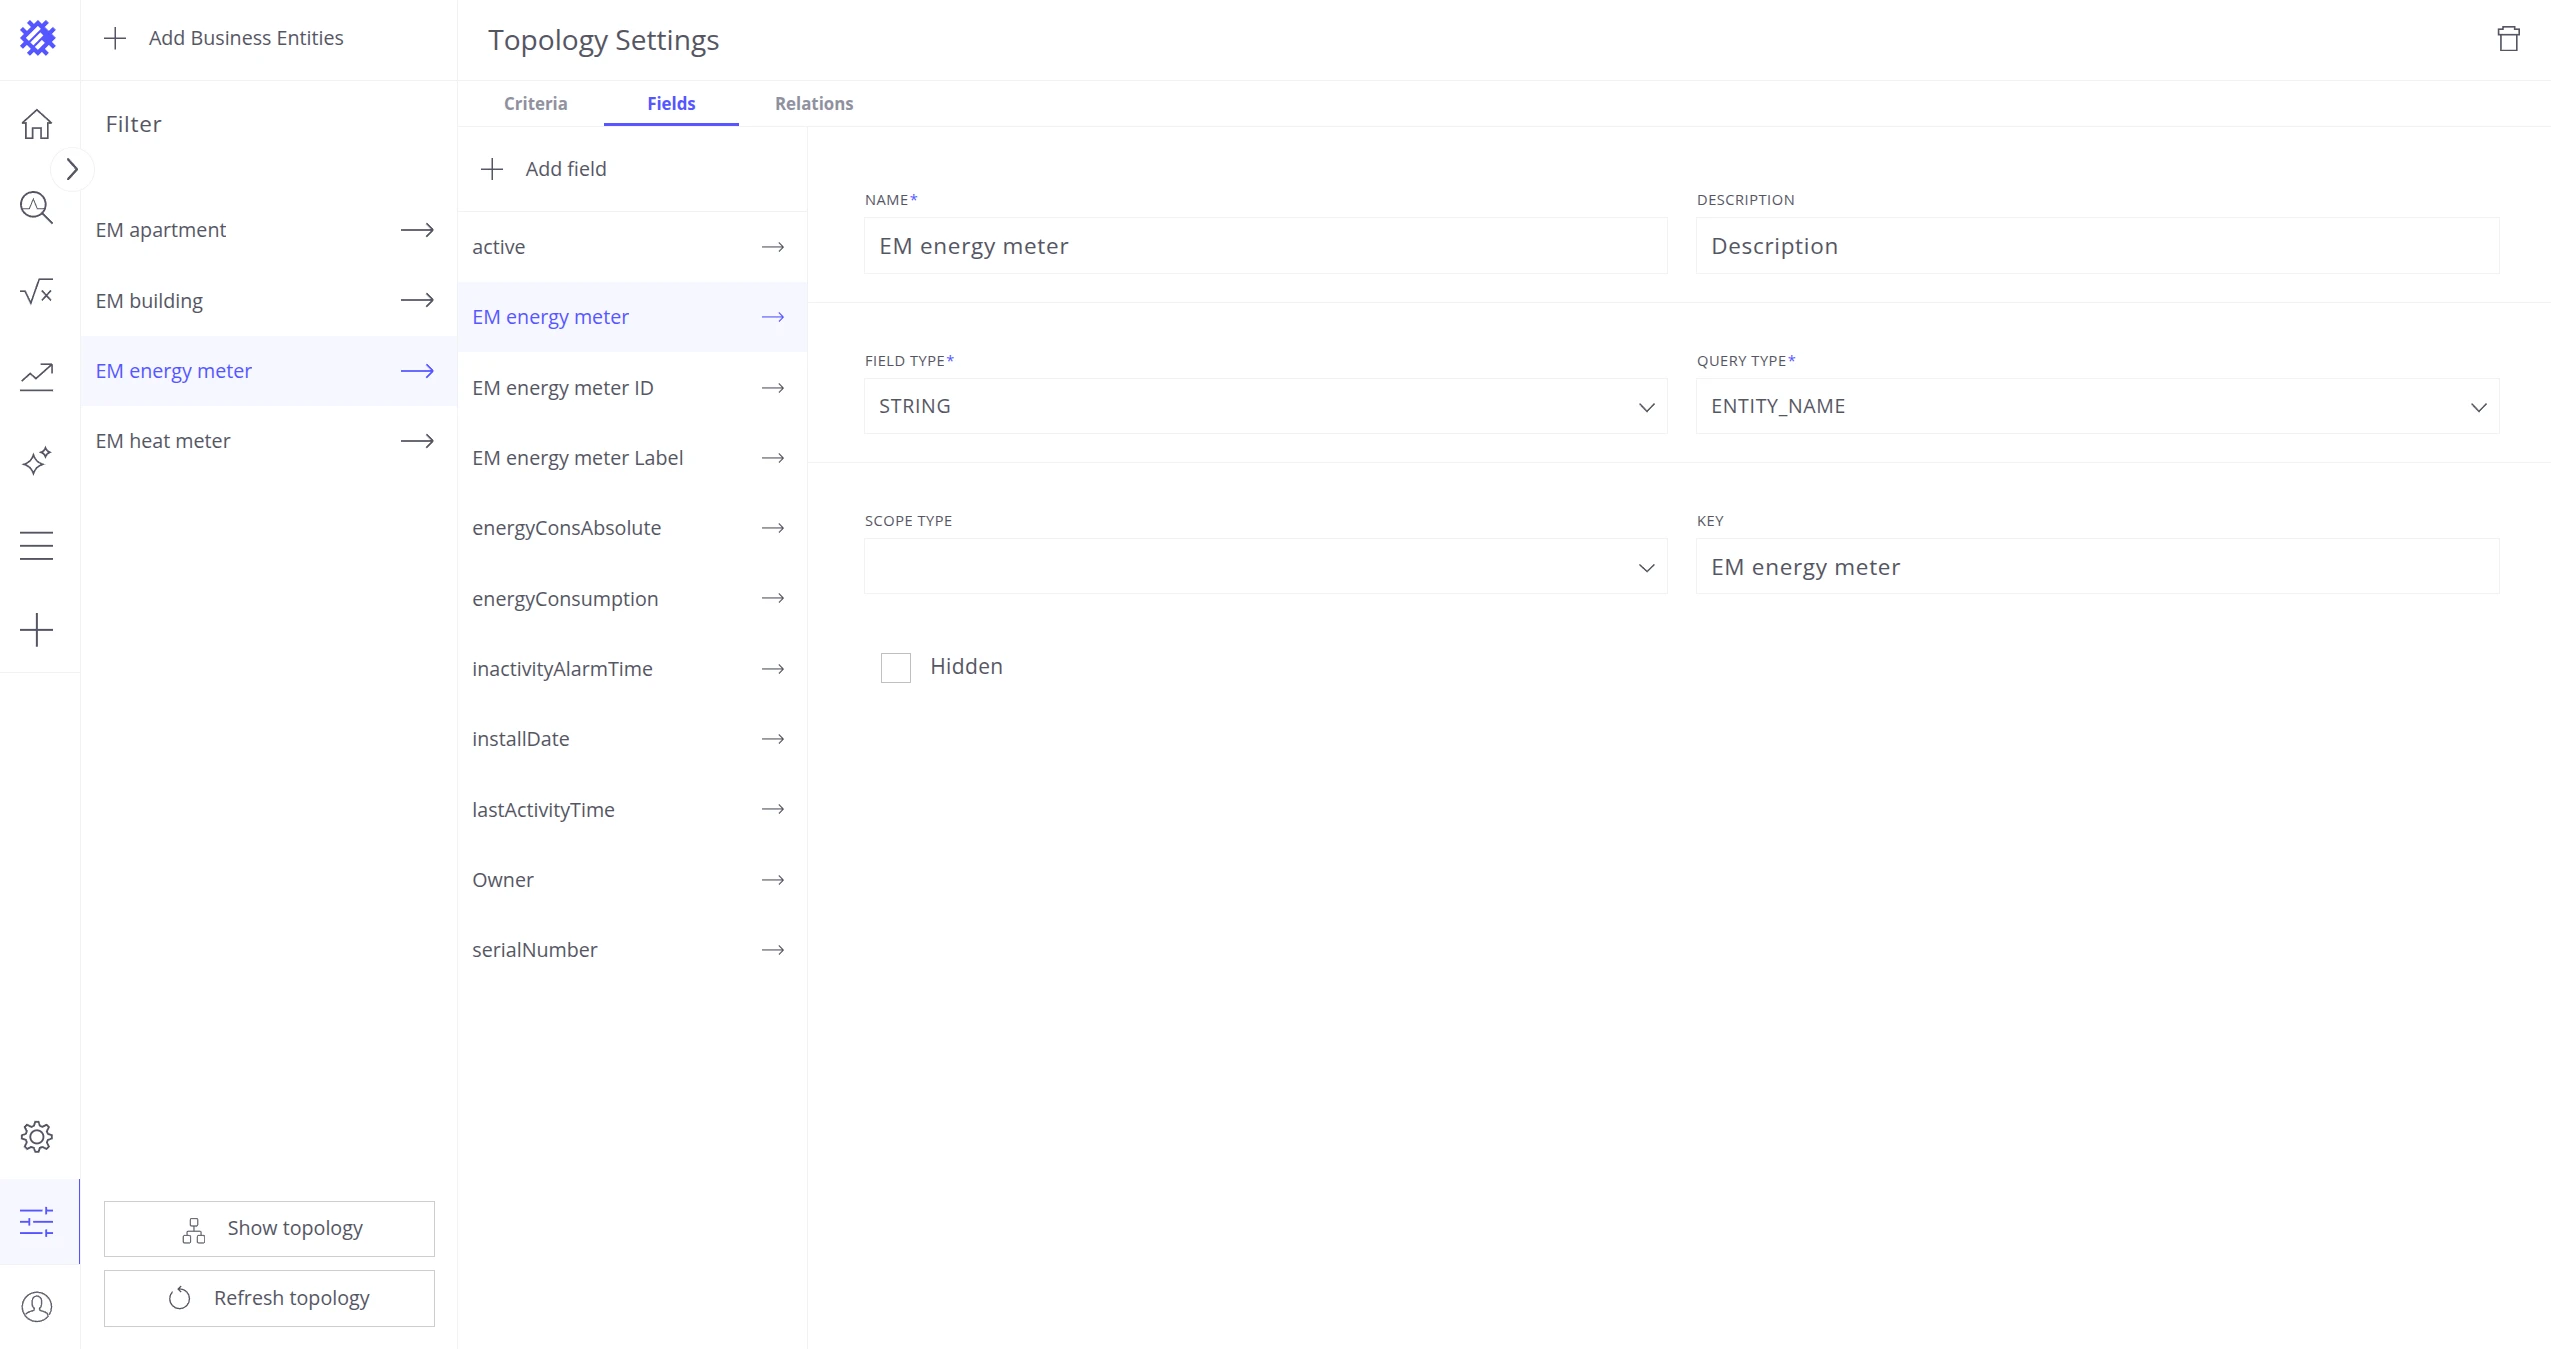
This guide uses Building and Apartment assets together with Heat Meter and Energy Meter devices. You can substitute your own devices and apply the same steps. If you don’t have data yet, use any available solution template.
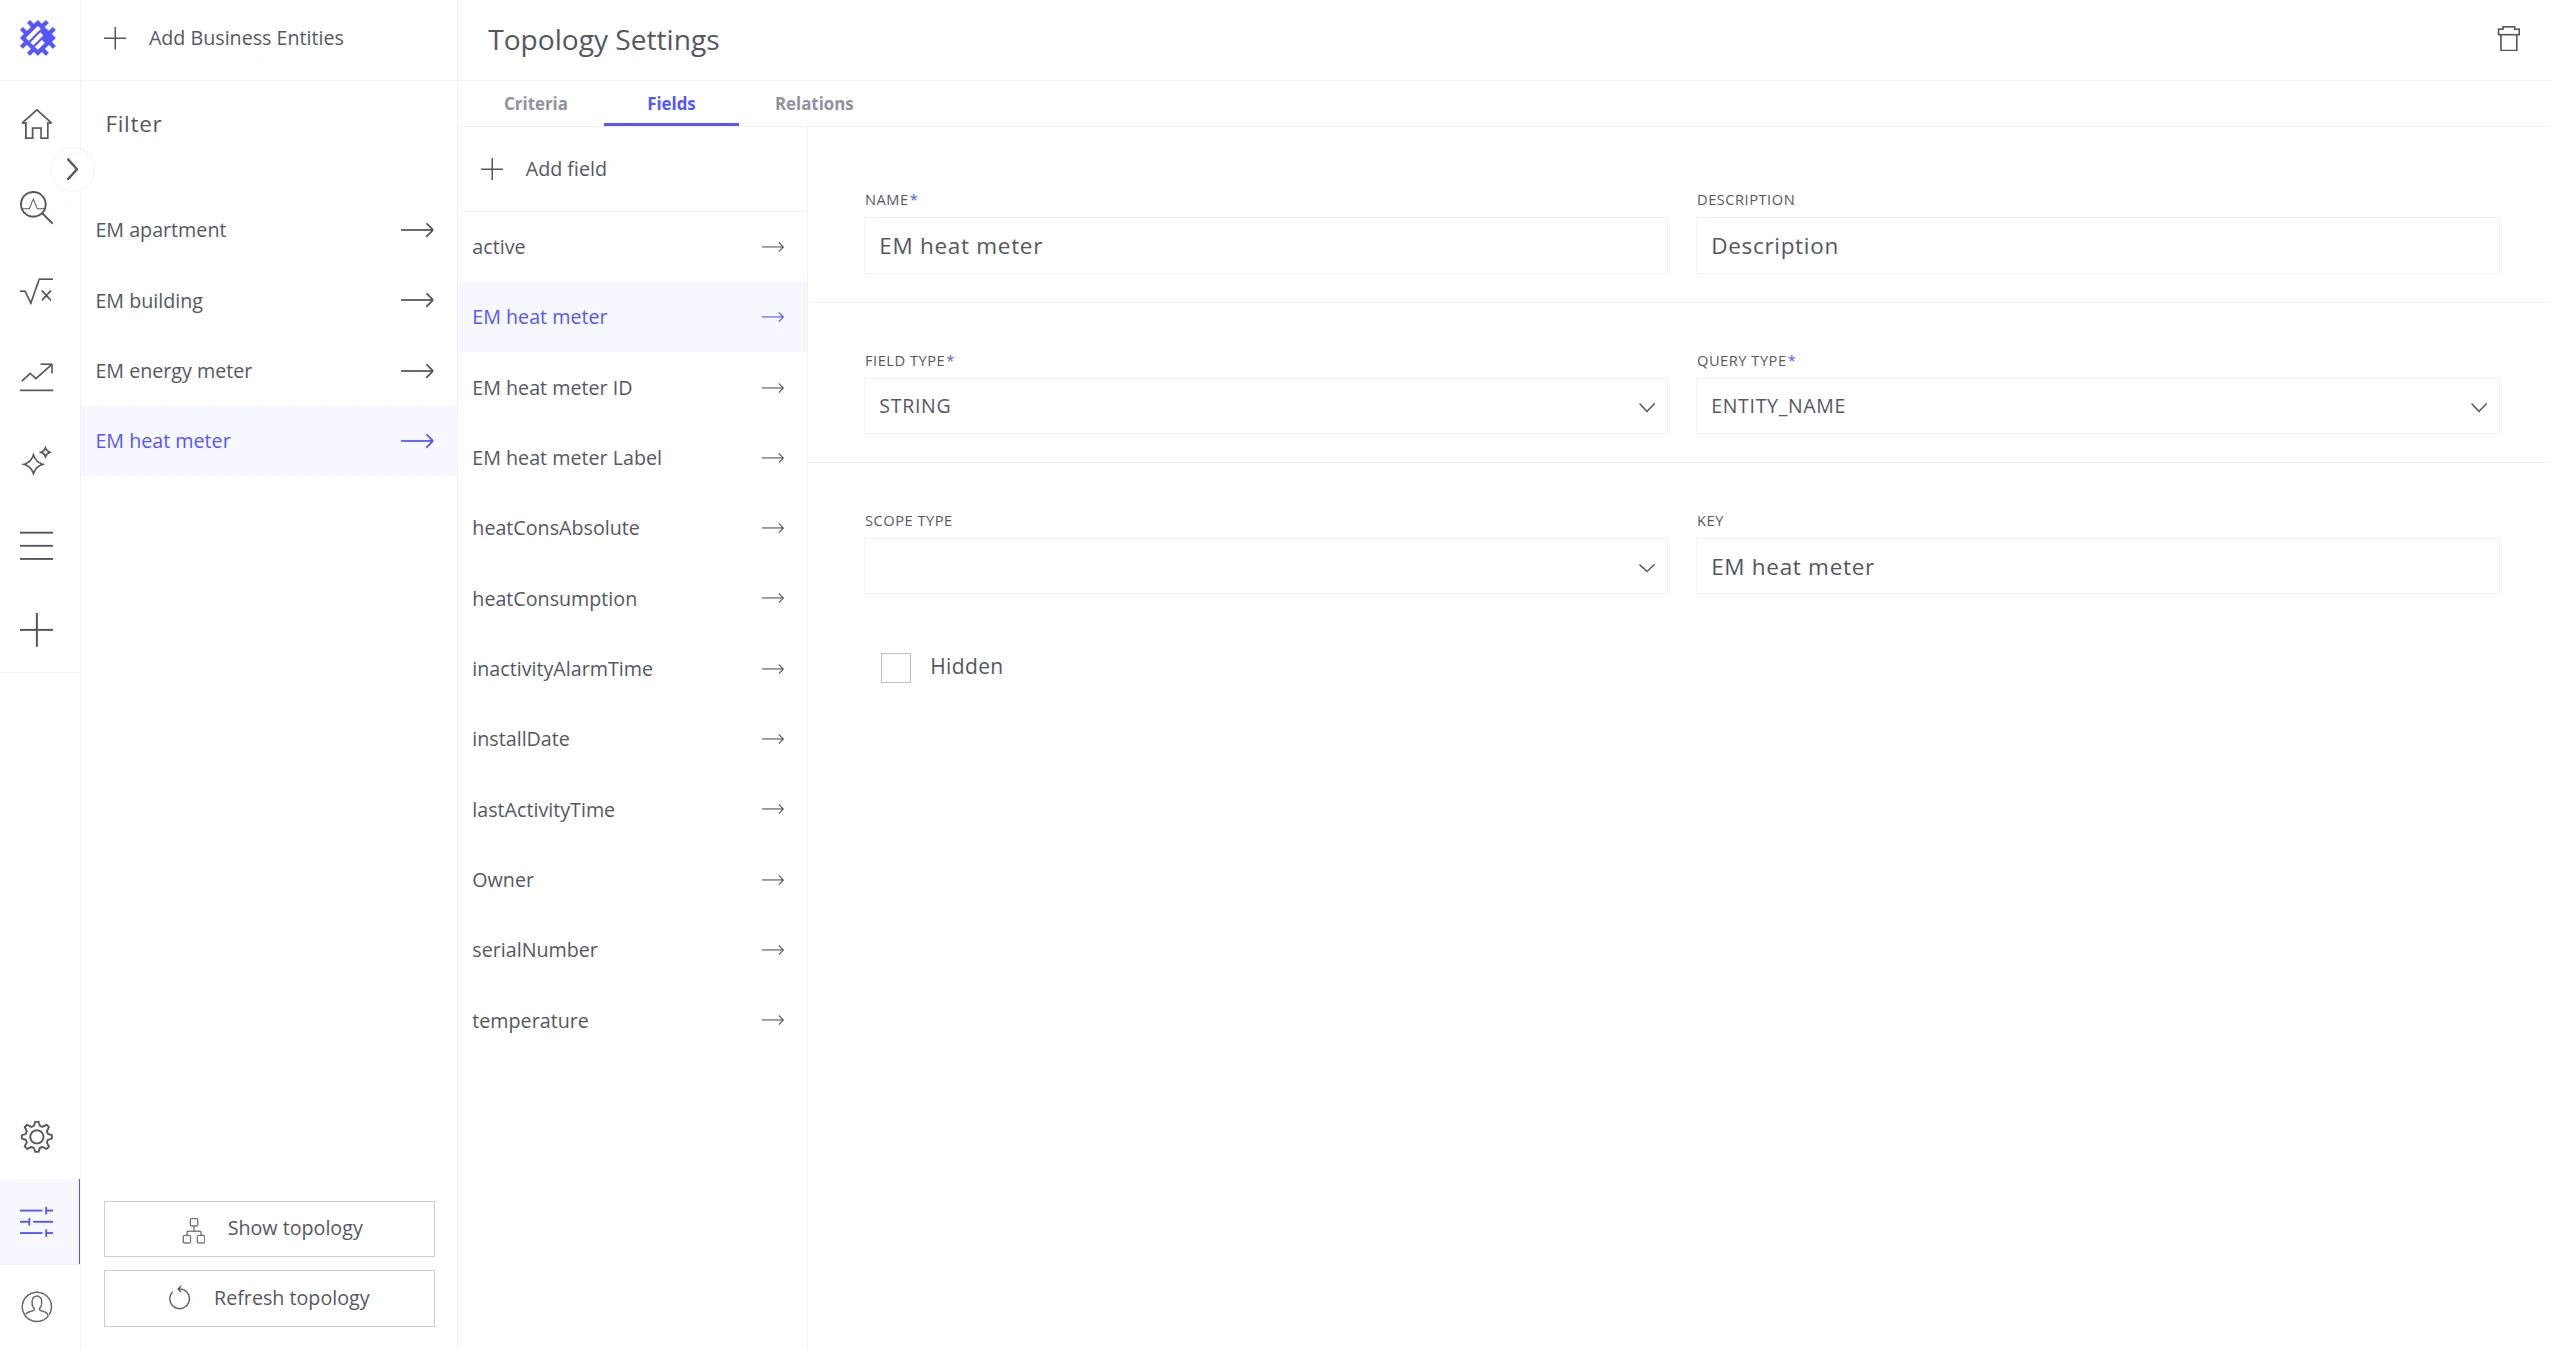
The entity model used in this guide is shown below — five screenshots walking through the fields and relationships for each entity type:
Step 1. Discover topology
Section titled “Step 1. Discover topology”Sign in to the Trendz UI using the URL for your deployment:
| Deployment | URL |
|---|---|
| ThingsBoard Cloud (North America) | https://thingsboard.cloud/trendz/ |
| ThingsBoard Cloud (Europe) | https://eu.thingsboard.cloud/trendz/ |
| Self-hosted | http://localhost:8888/trendz/ |
Use your ThingsBoard Tenant Administrator or Customer User credentials — the same login and password you use in ThingsBoard.
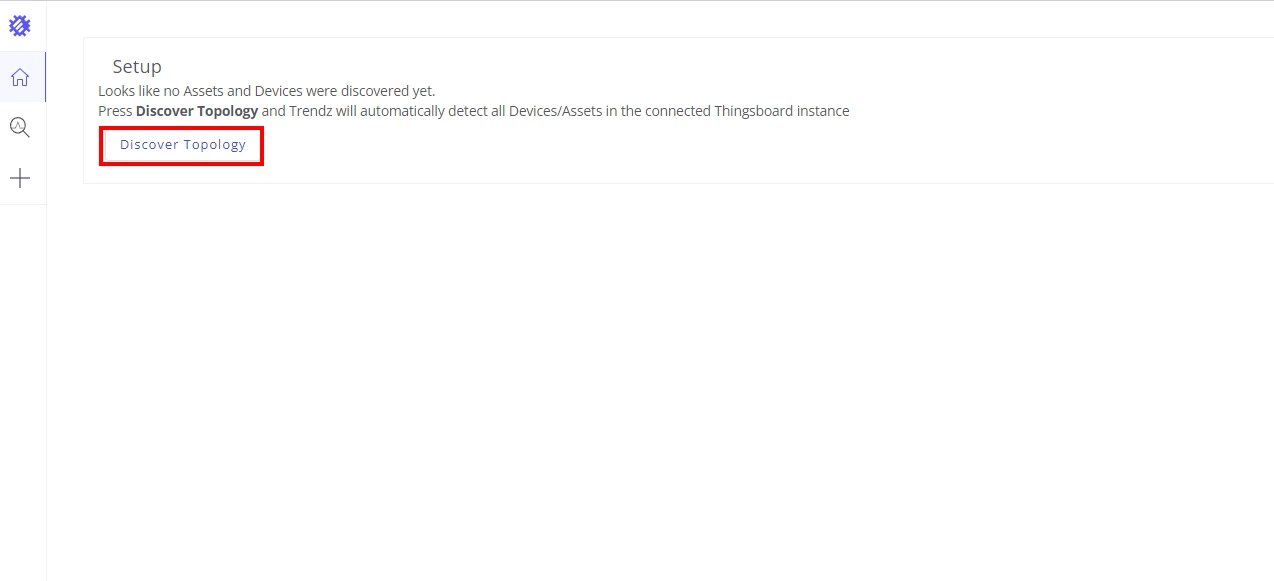
After signing in, click Discover Topology to import your ThingsBoard entities into Trendz, then click Finish when the discovery completes. See Topology Discovery for a full explanation of how discovery works.
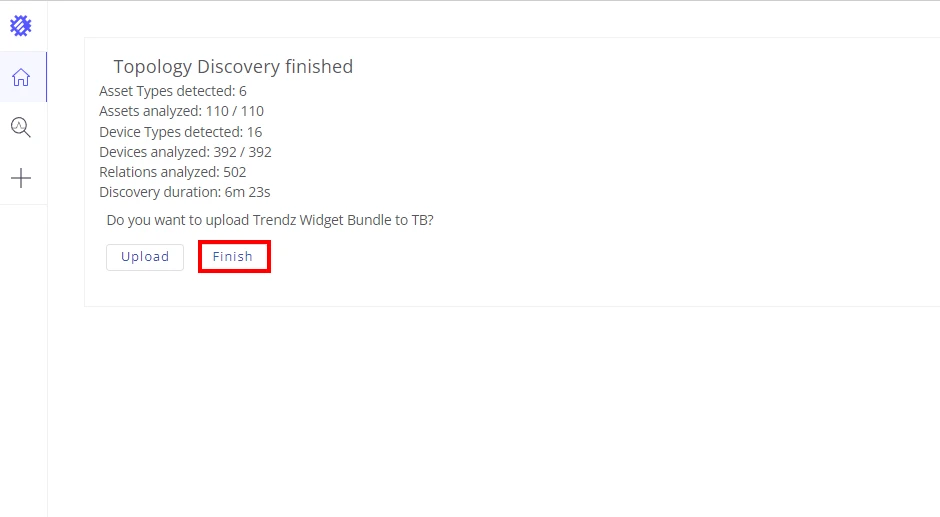
Now Trendz has your ThingsBoard topology imported and is ready to explore your IoT data.
Read more in Topology Discovery.
Step 2. Explore your data with Metric Explorer
Section titled “Step 2. Explore your data with Metric Explorer”Before building views, use the Metric Explorer to understand what telemetry your devices are reporting. Here you can explore data availability and find patterns and insights in your data.
-
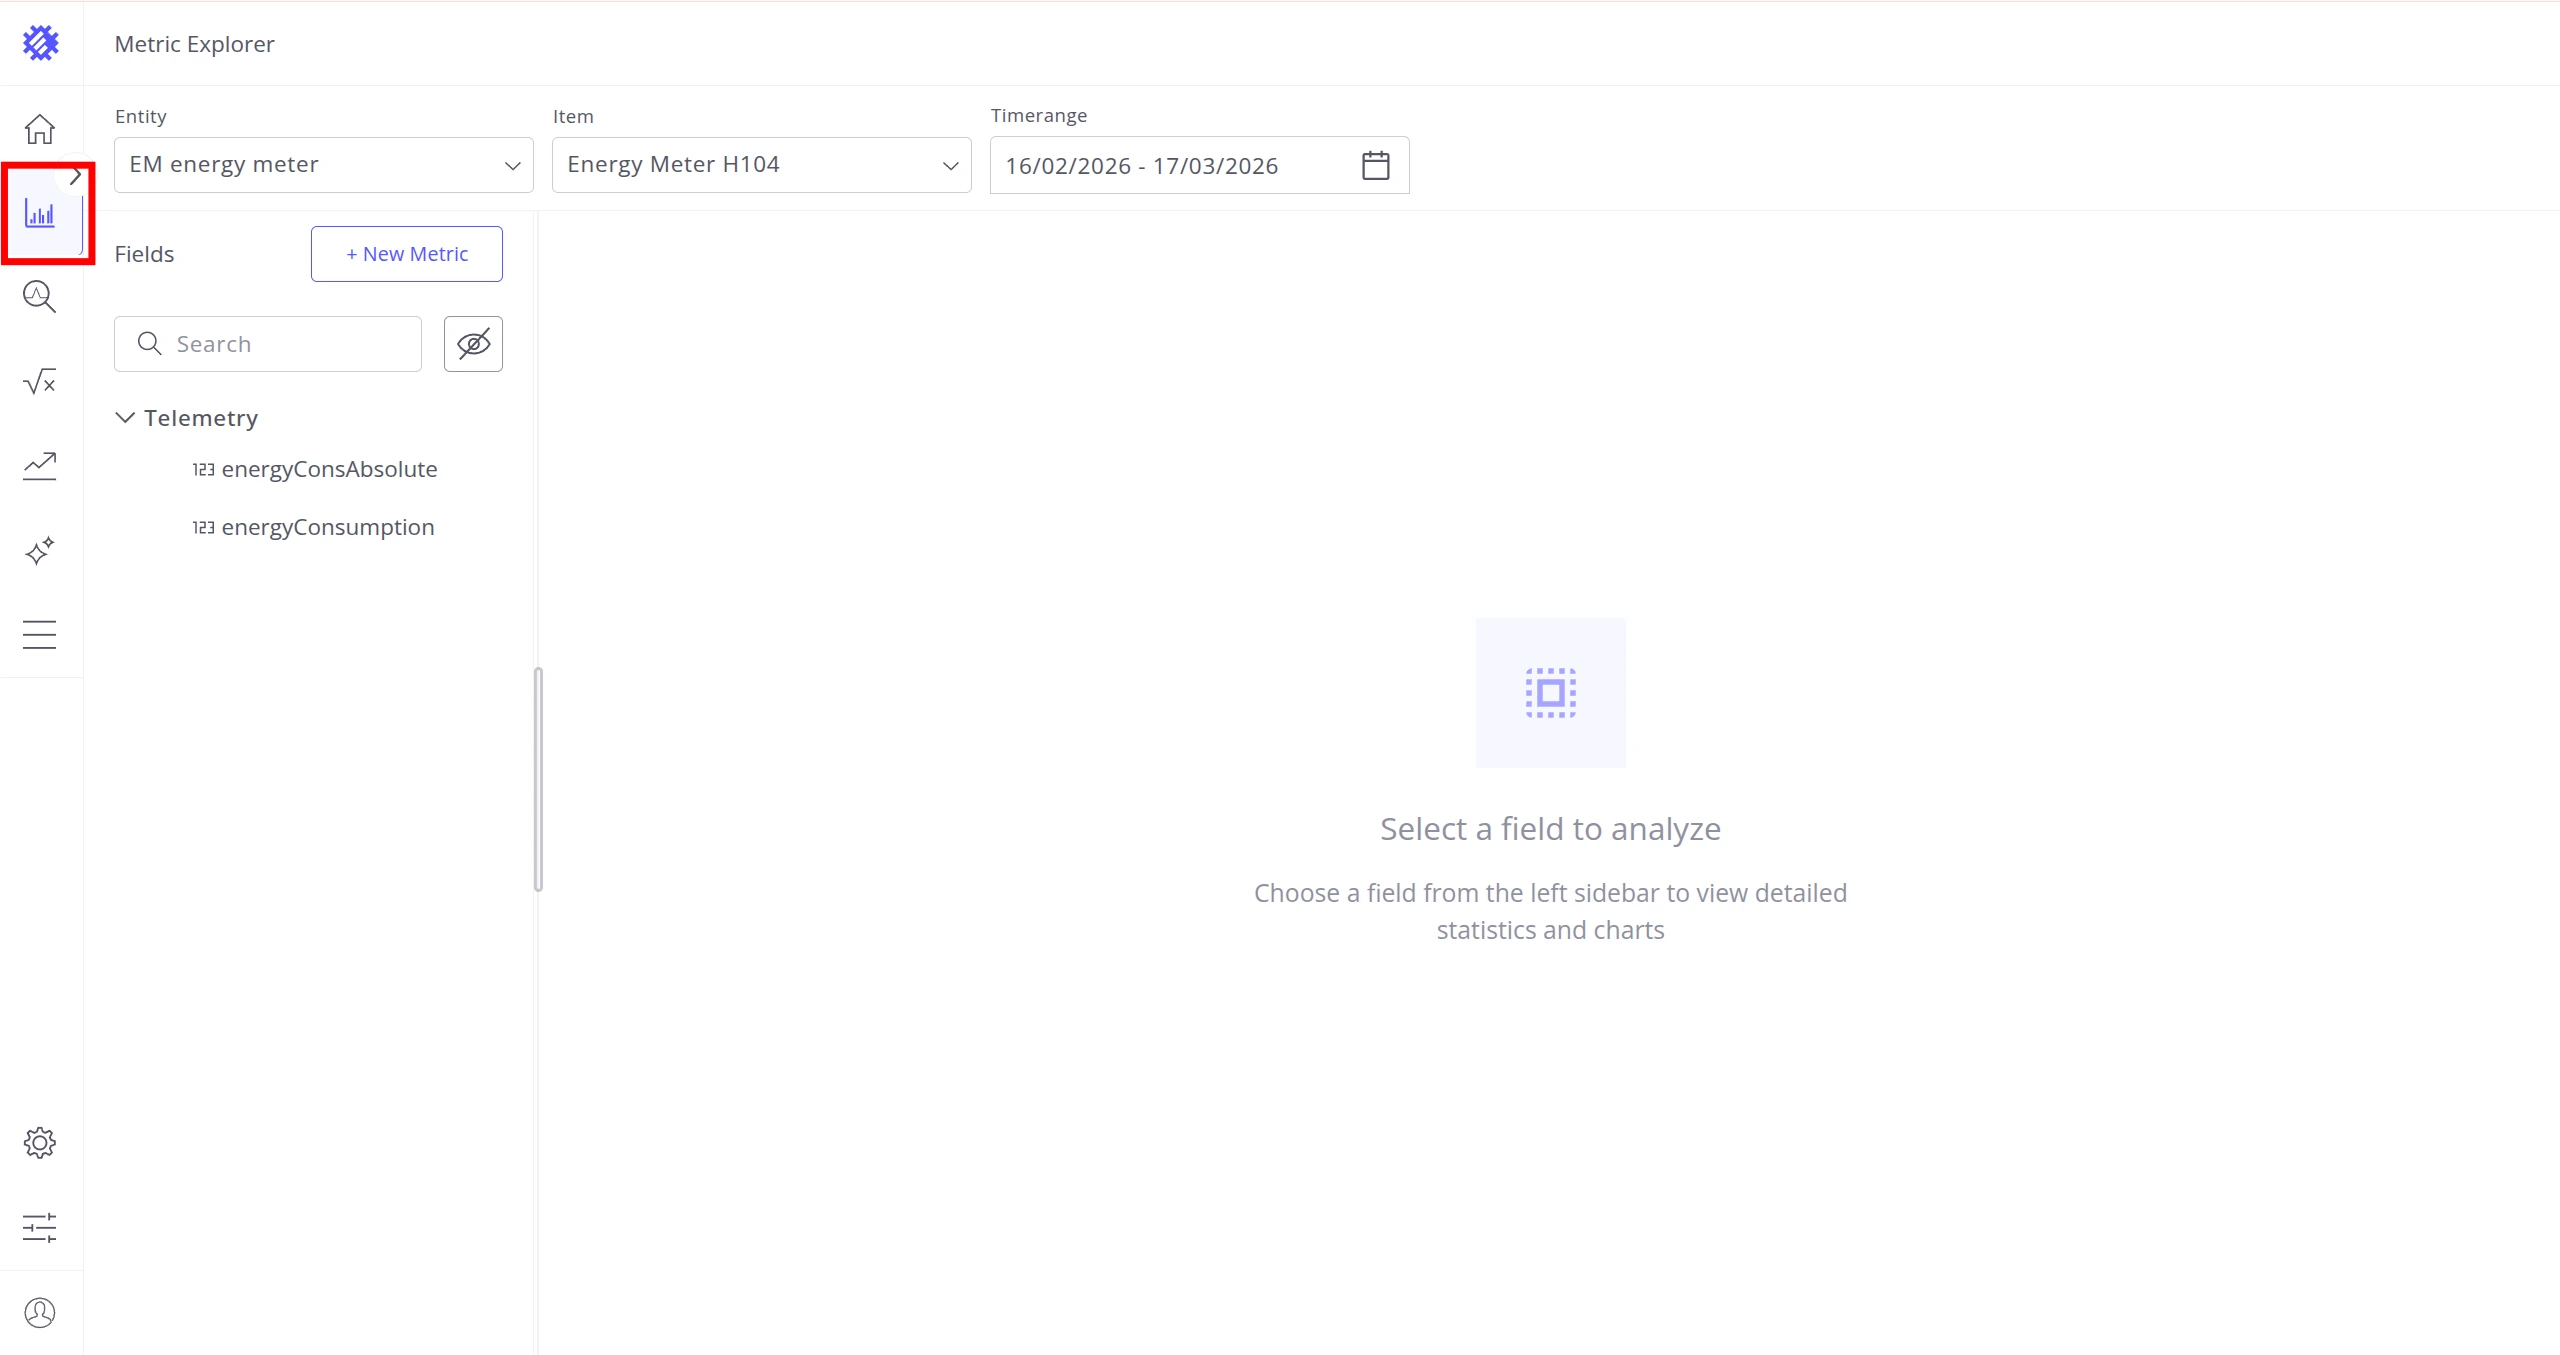
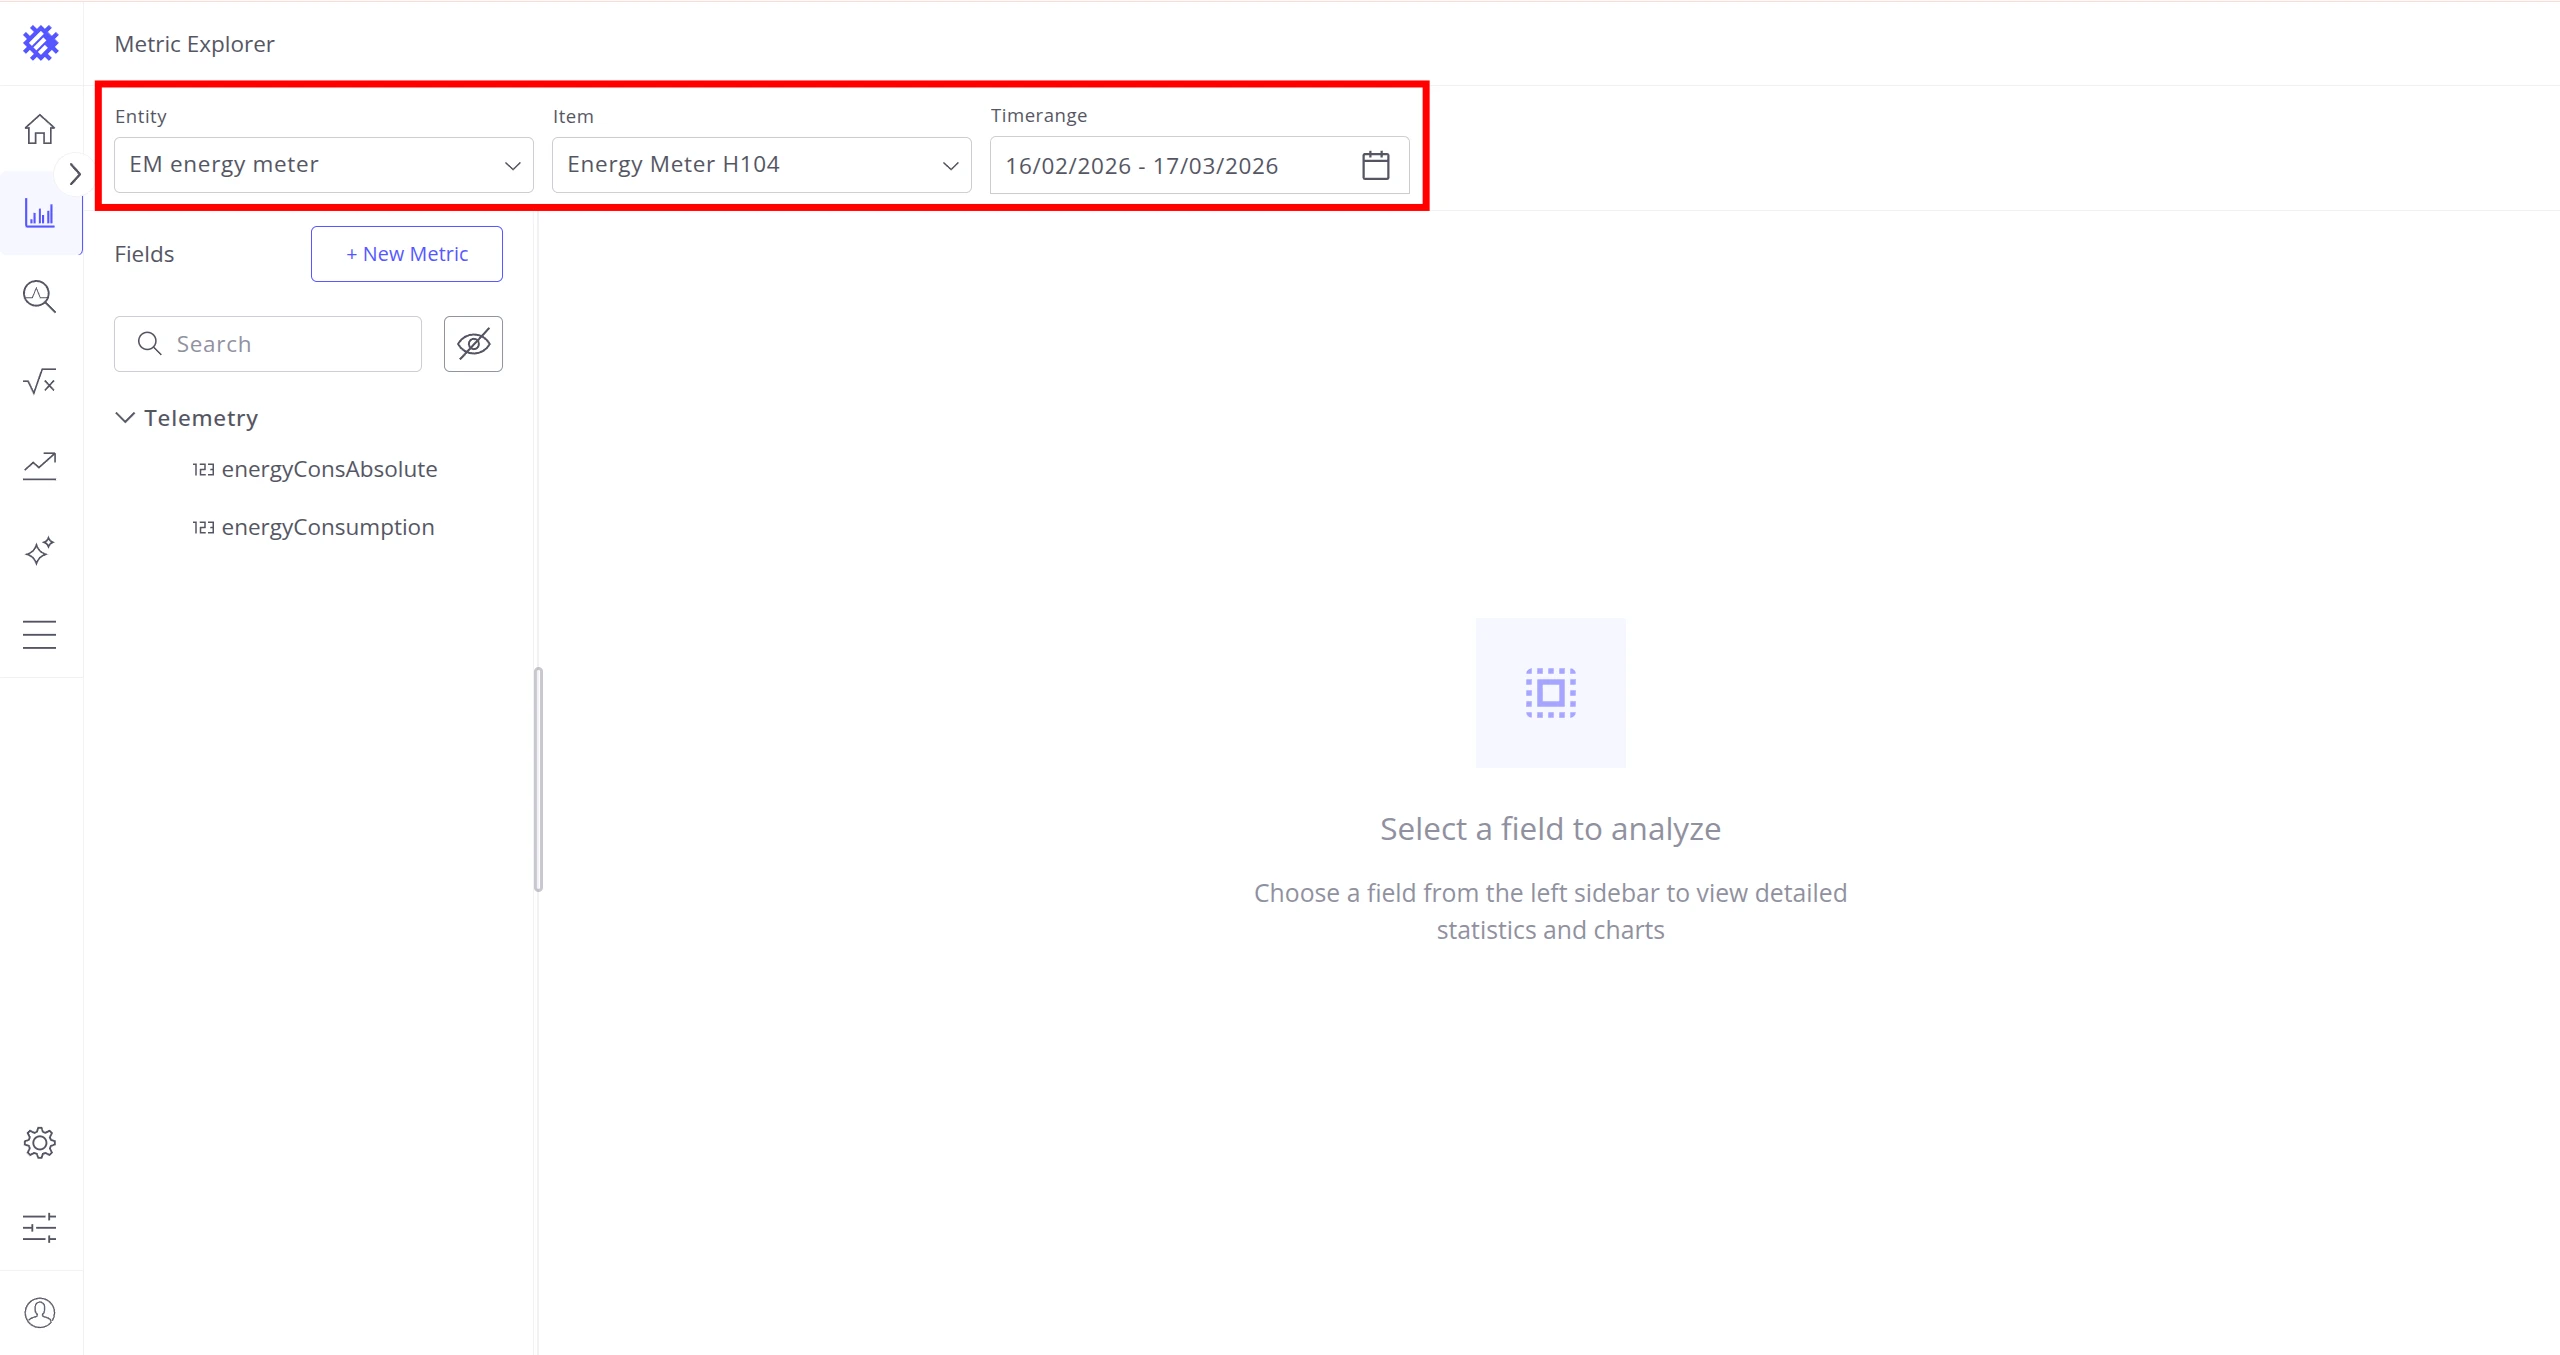
Click the chart icon in the left navigation panel to open the Metric Explorer.
-
In the Header, select:
- Entity →
EM energy meter - Item → pick any specific energy meter
- Timerange →
Last 30 days
- Entity →
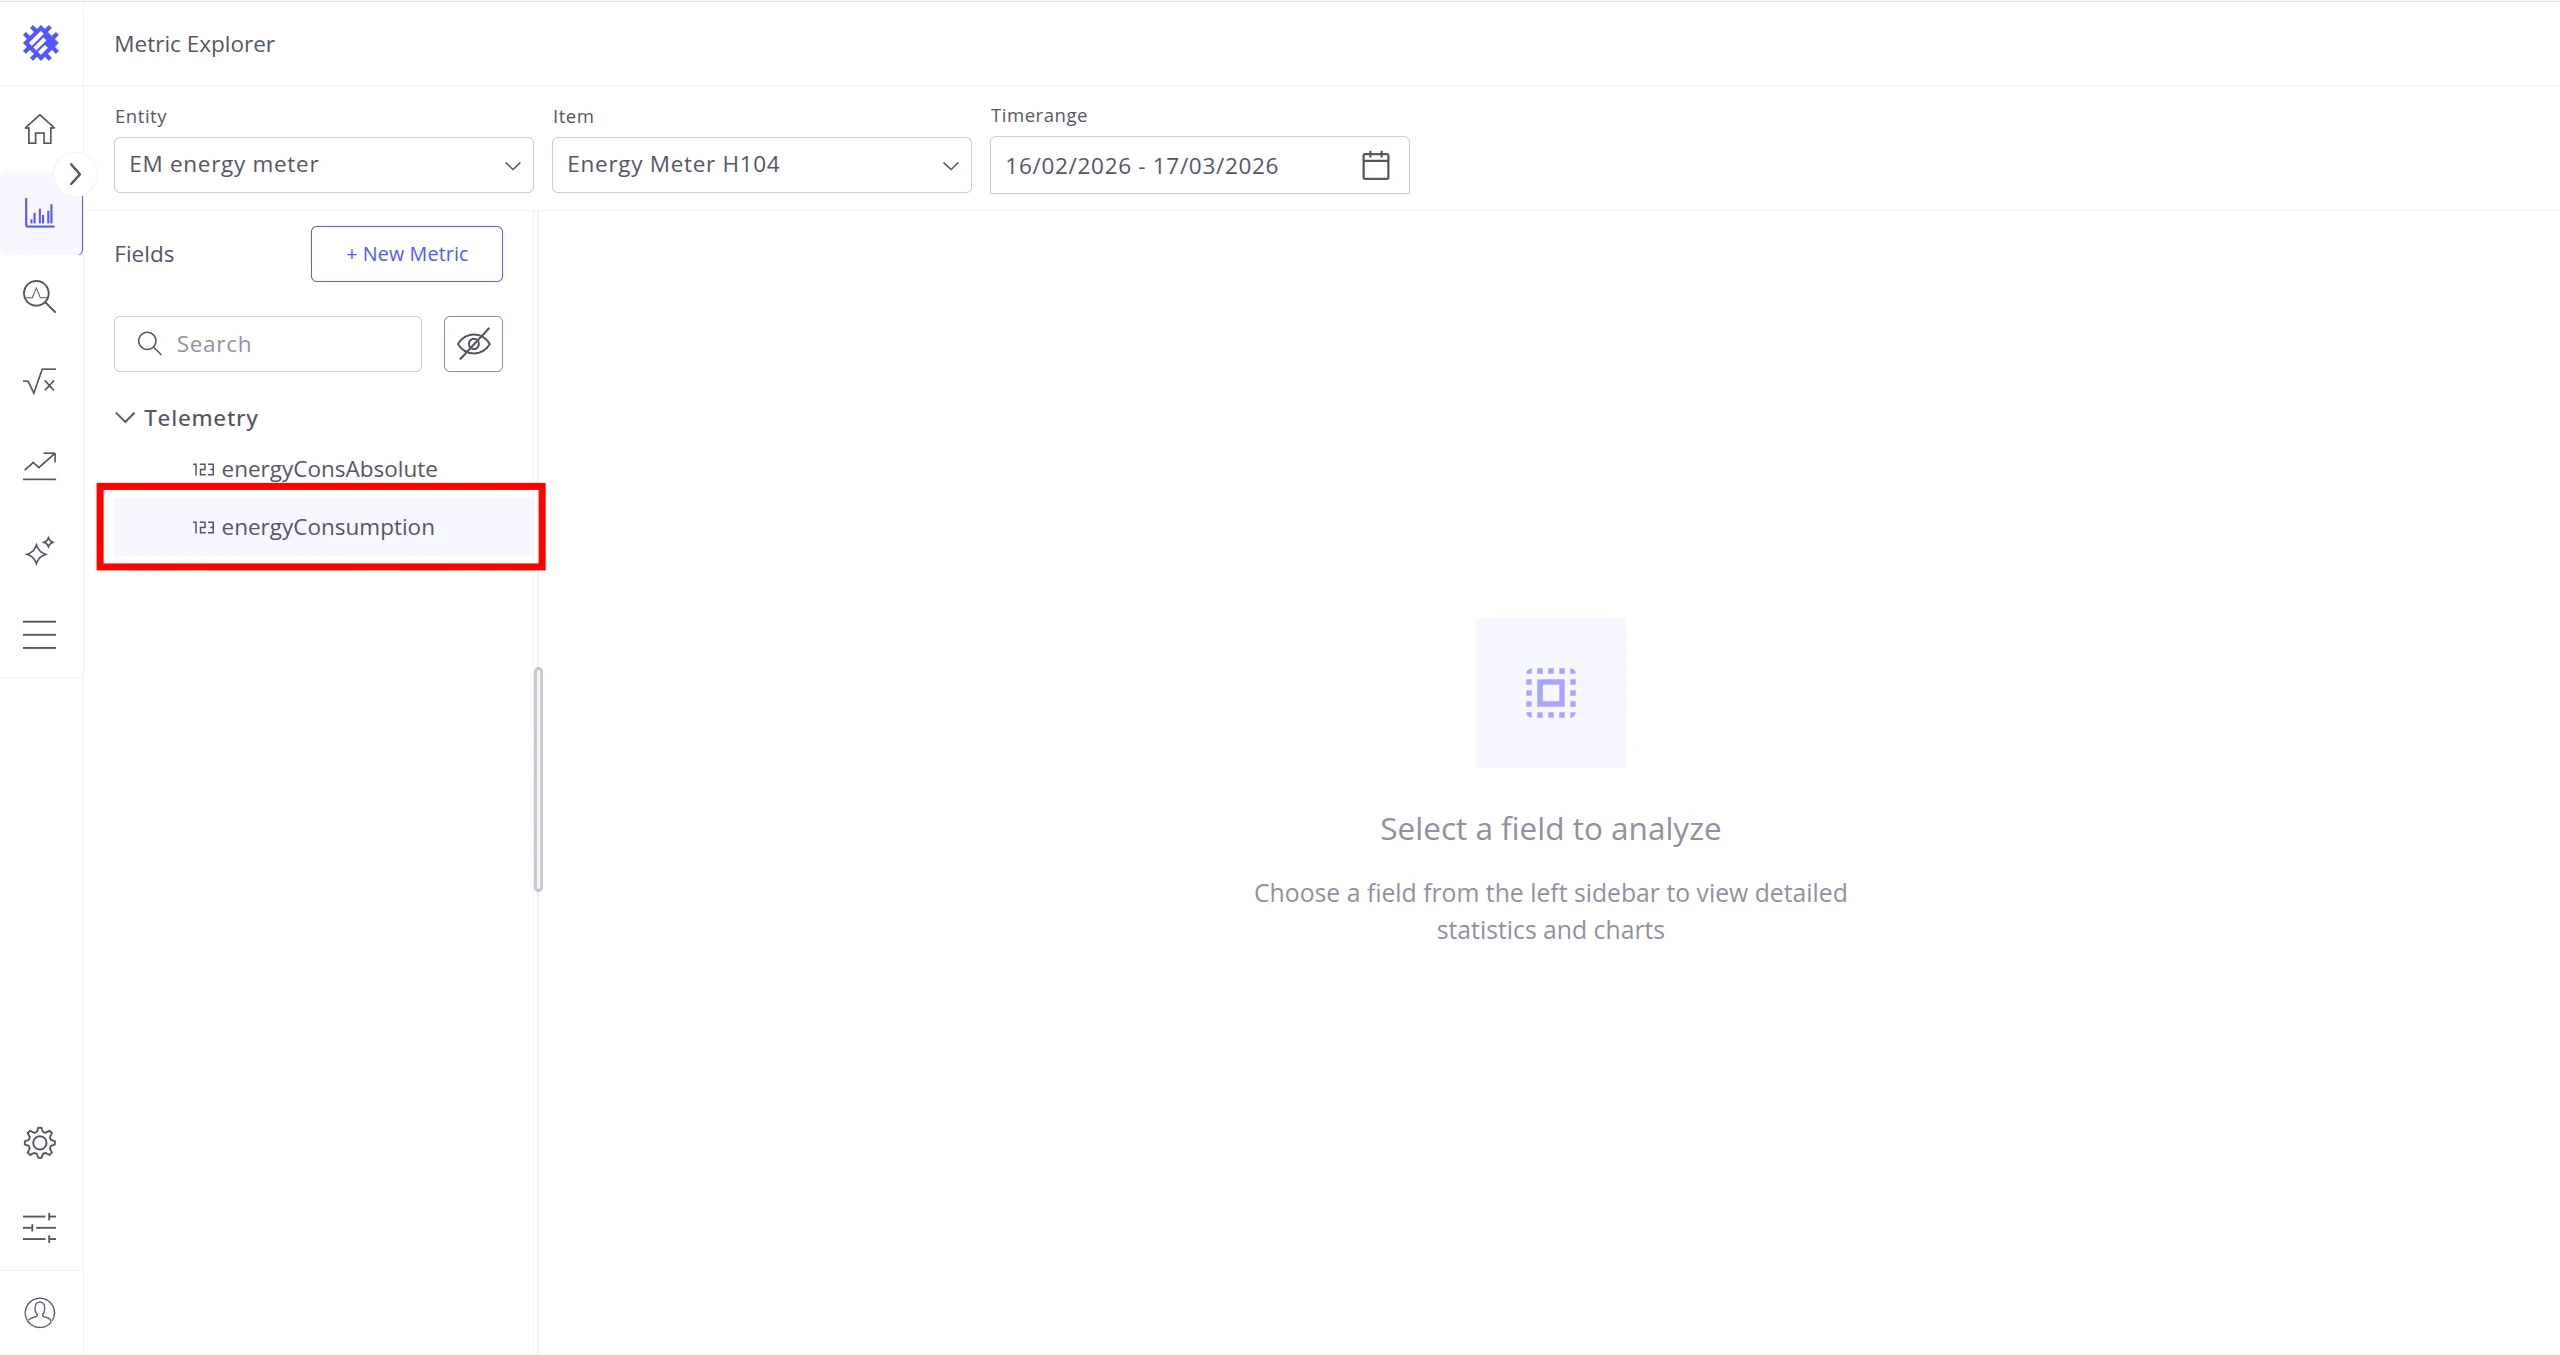
-
In the Fields Section on the left, expand the Telemetry group and click
energyConsumption. -
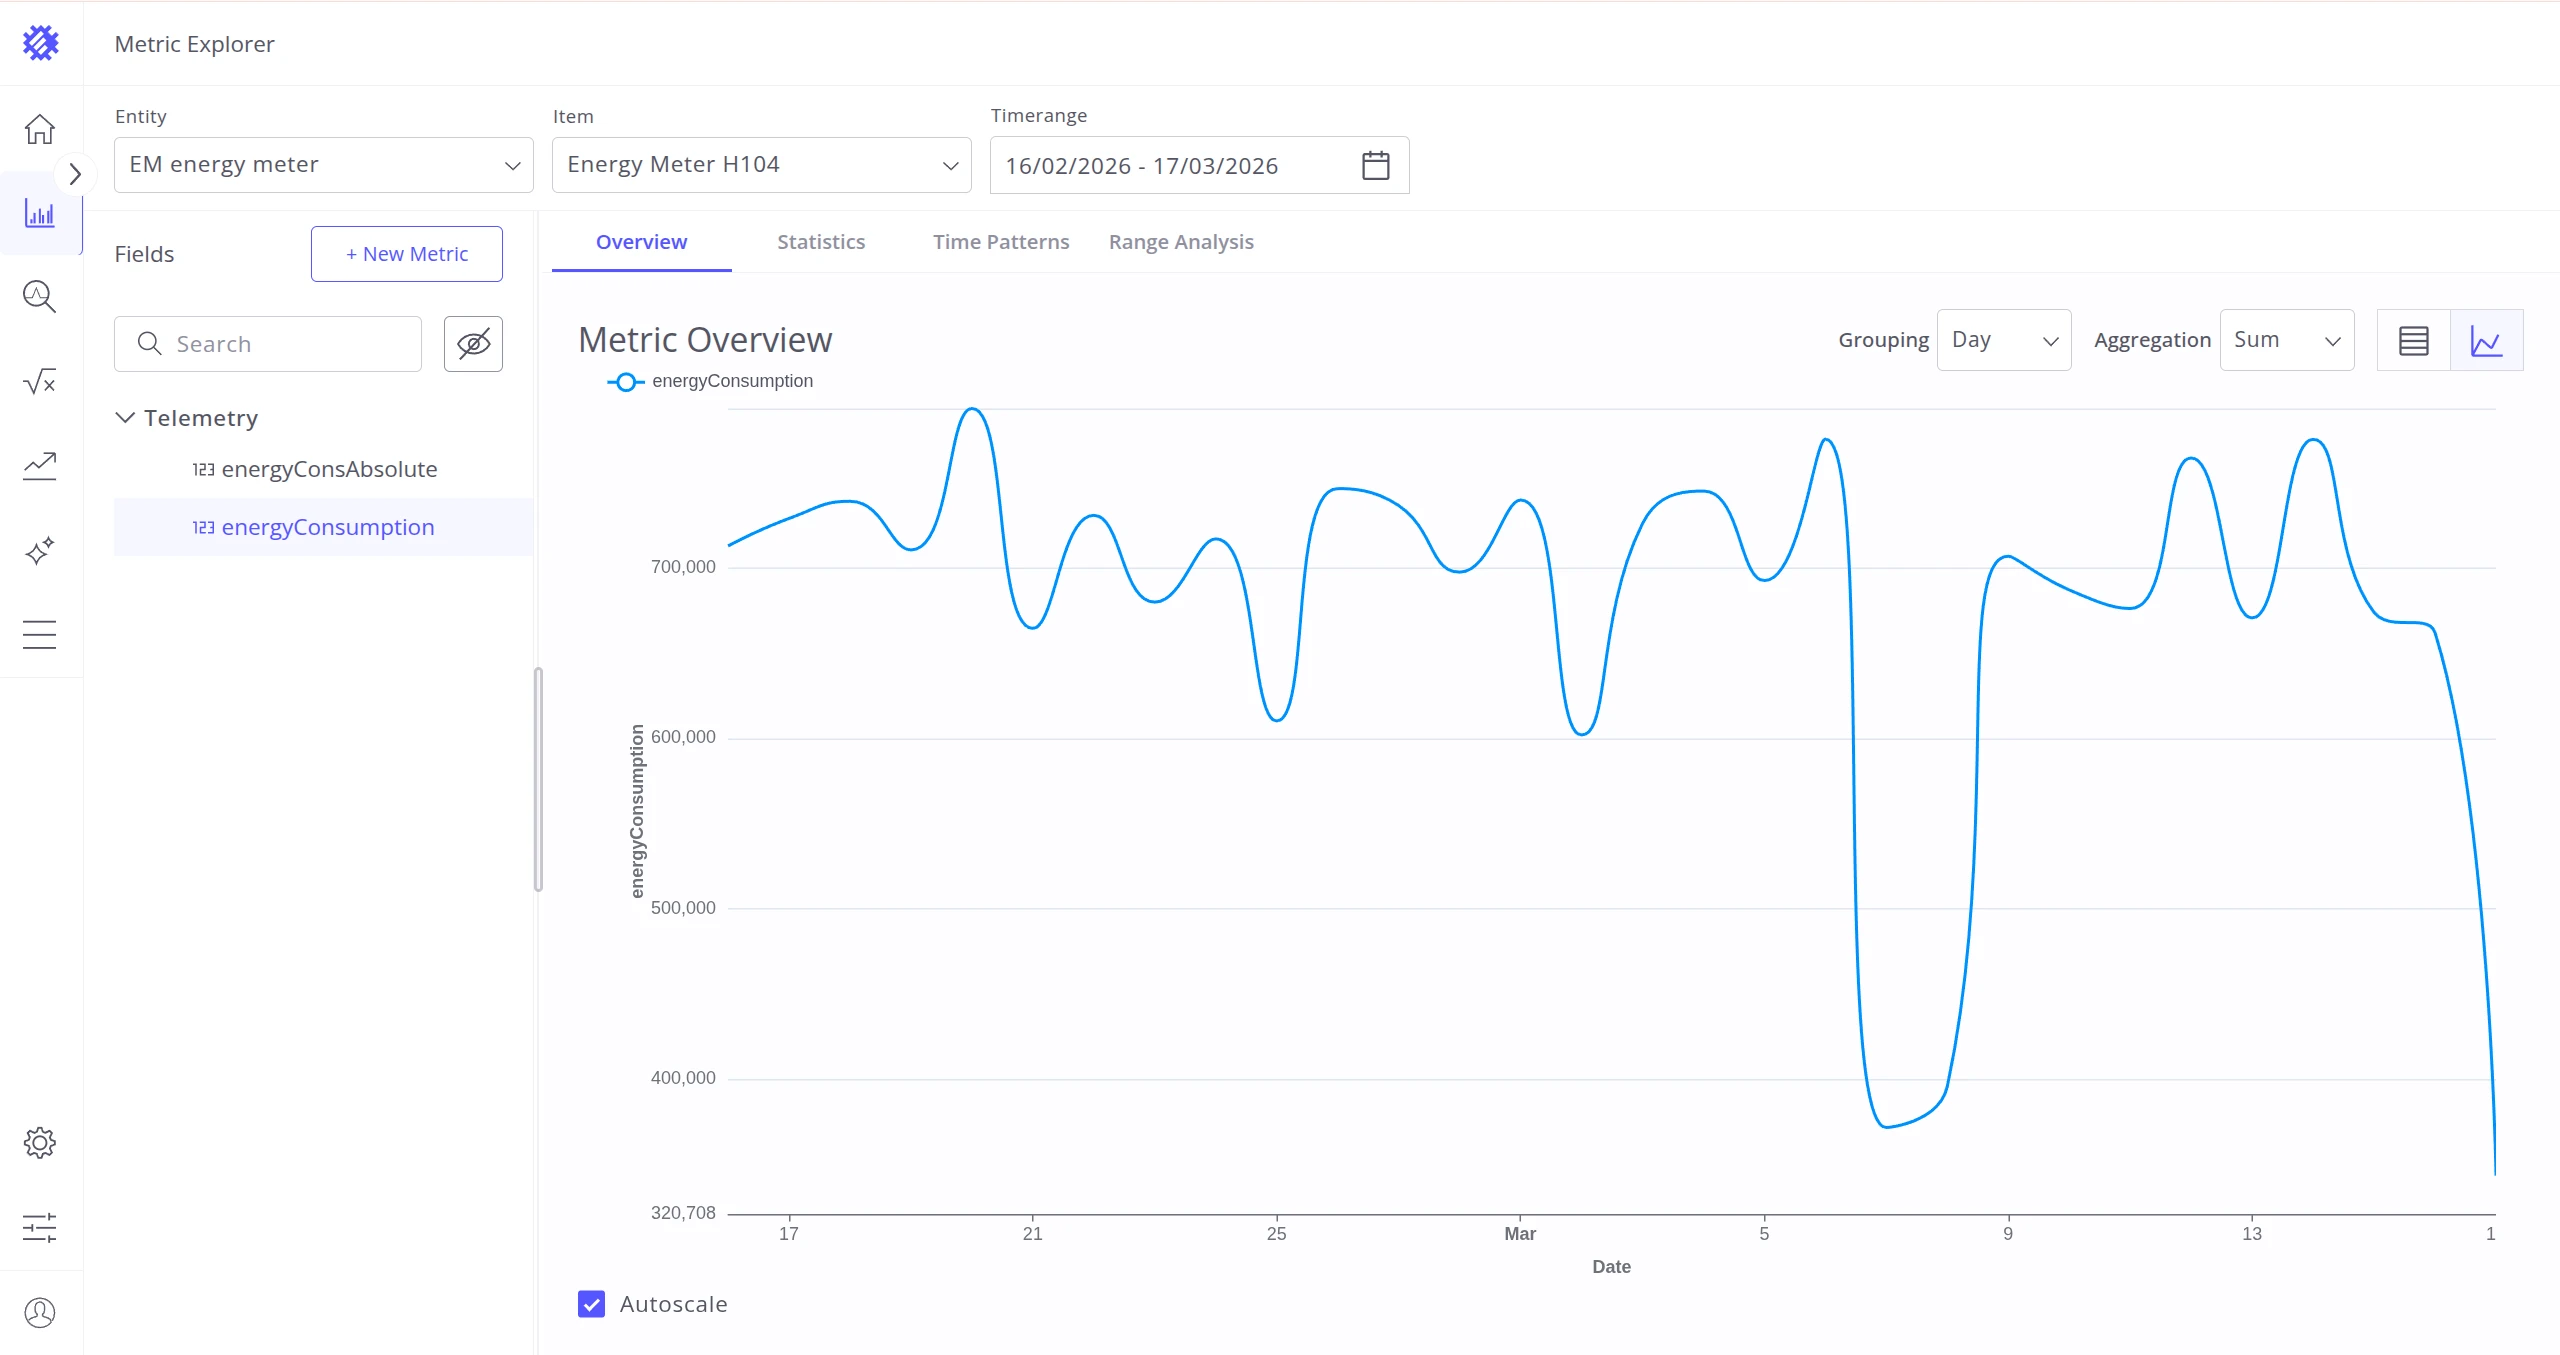
The Overview tab opens automatically — review the line chart to confirm data is flowing in.
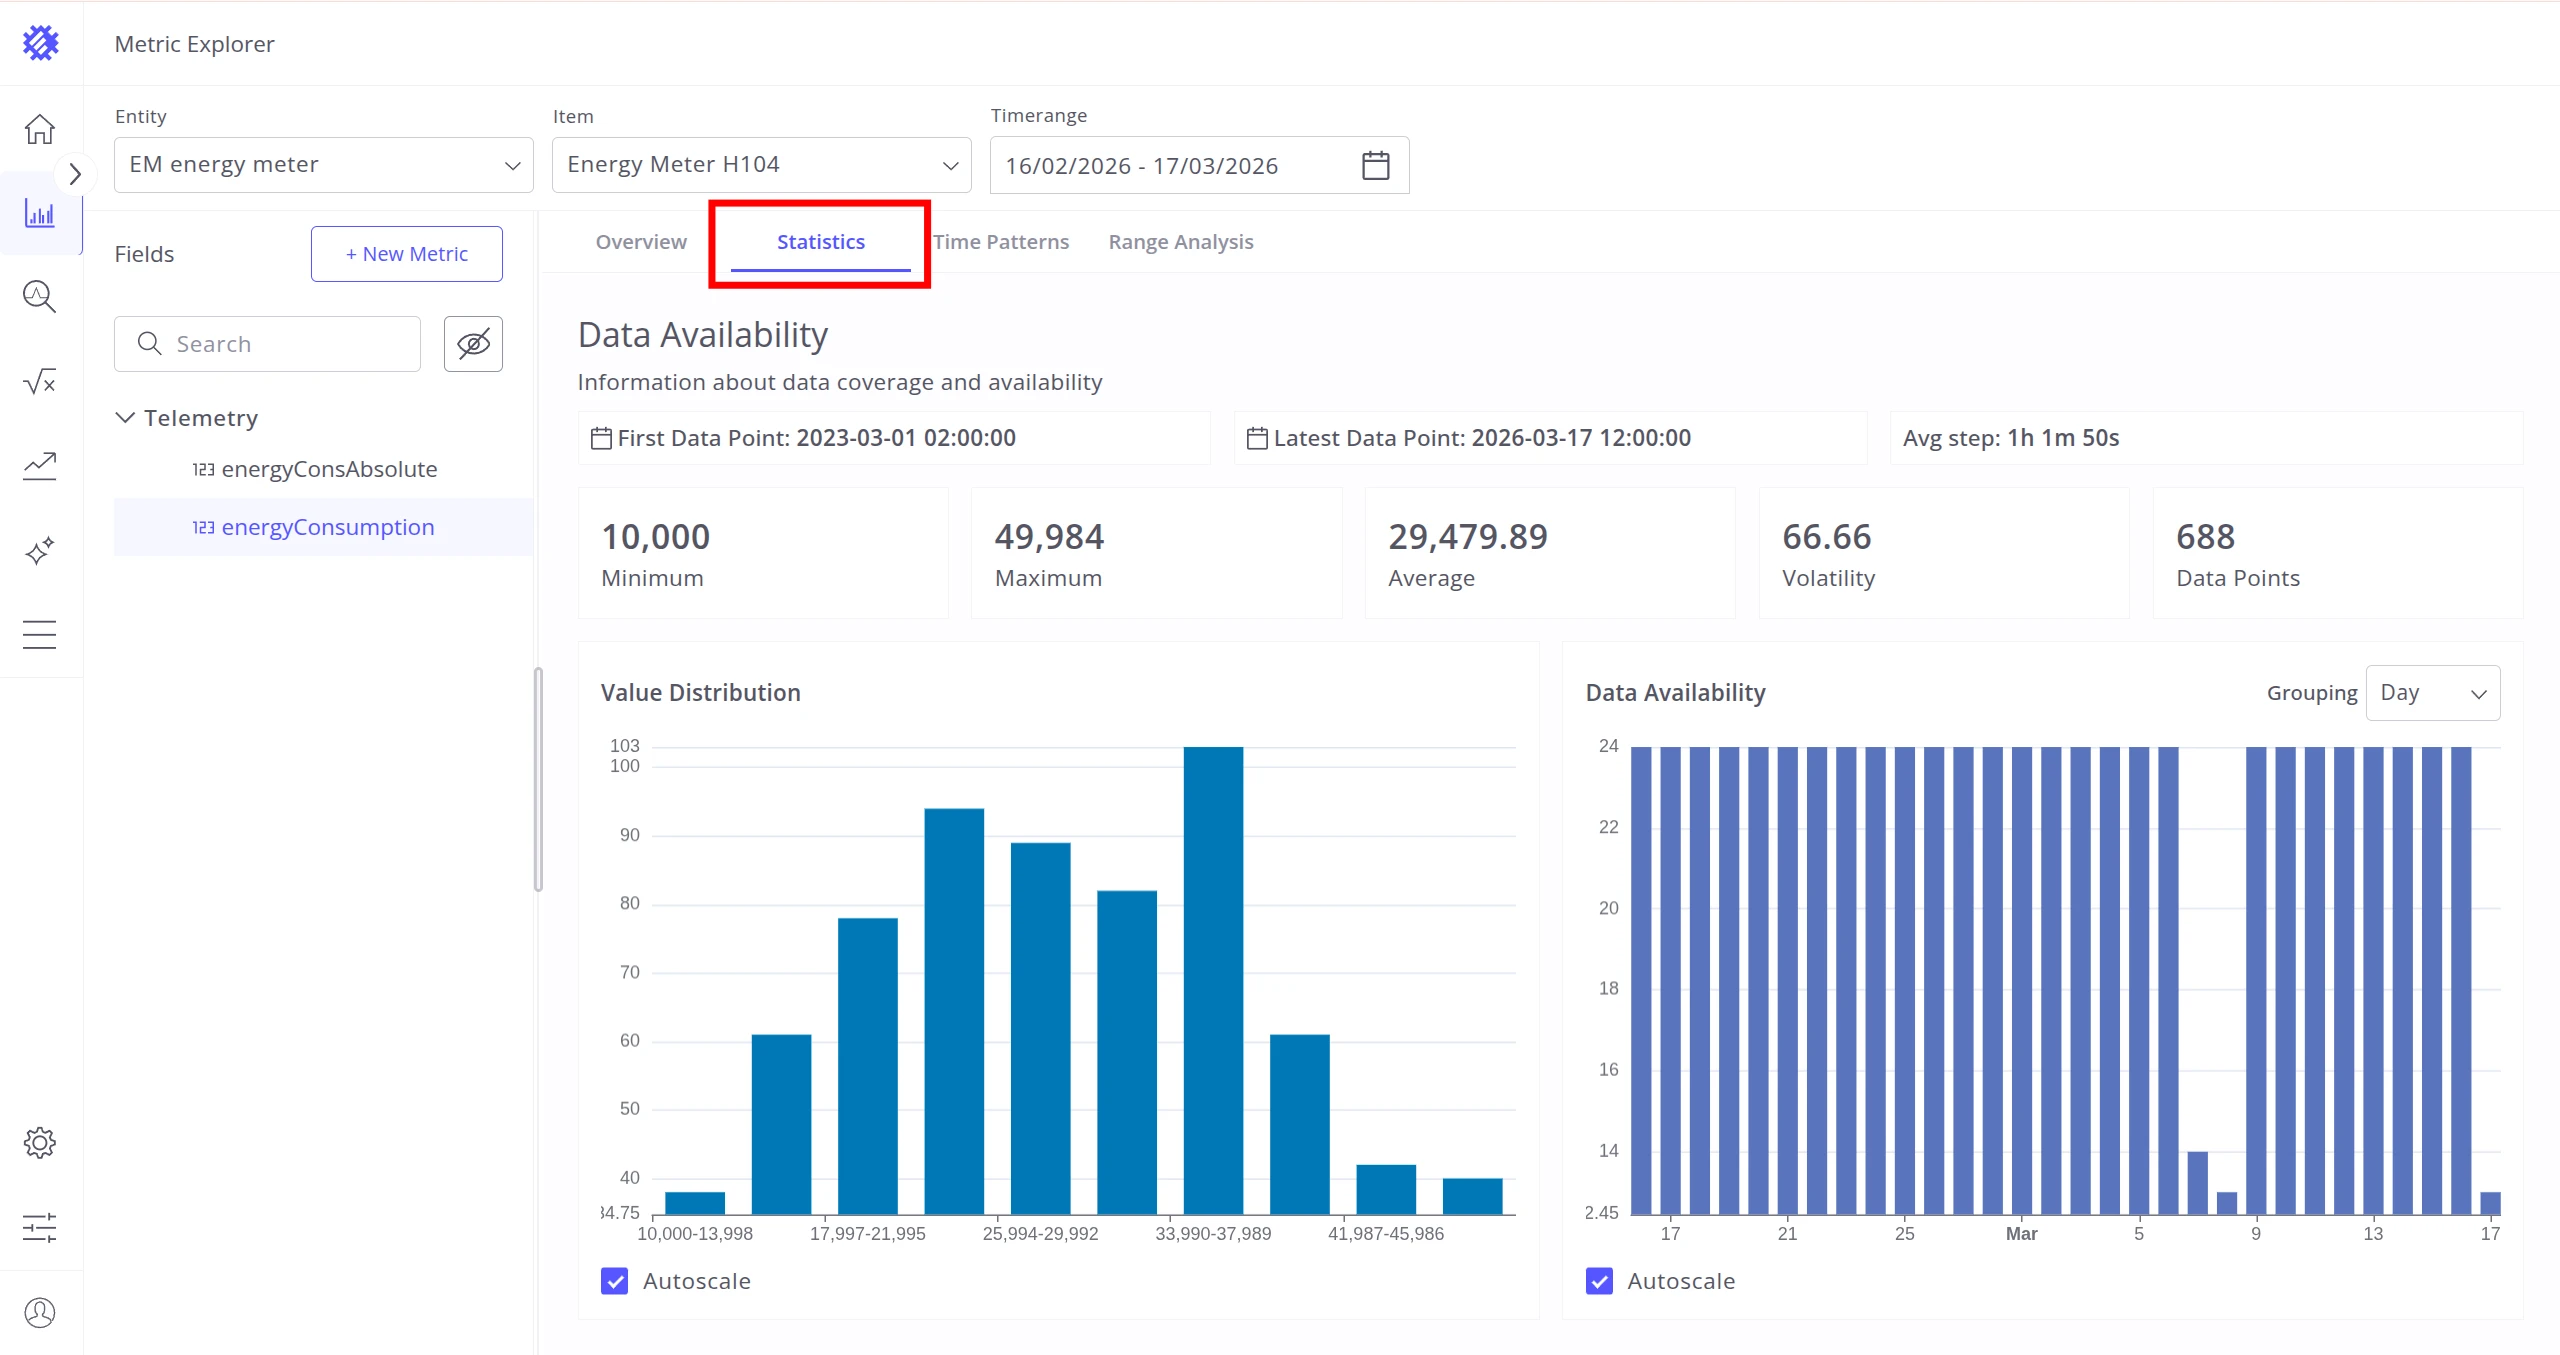
-
Switch to the Statistics tab to see min, max, average, and data availability for the selected period.
-
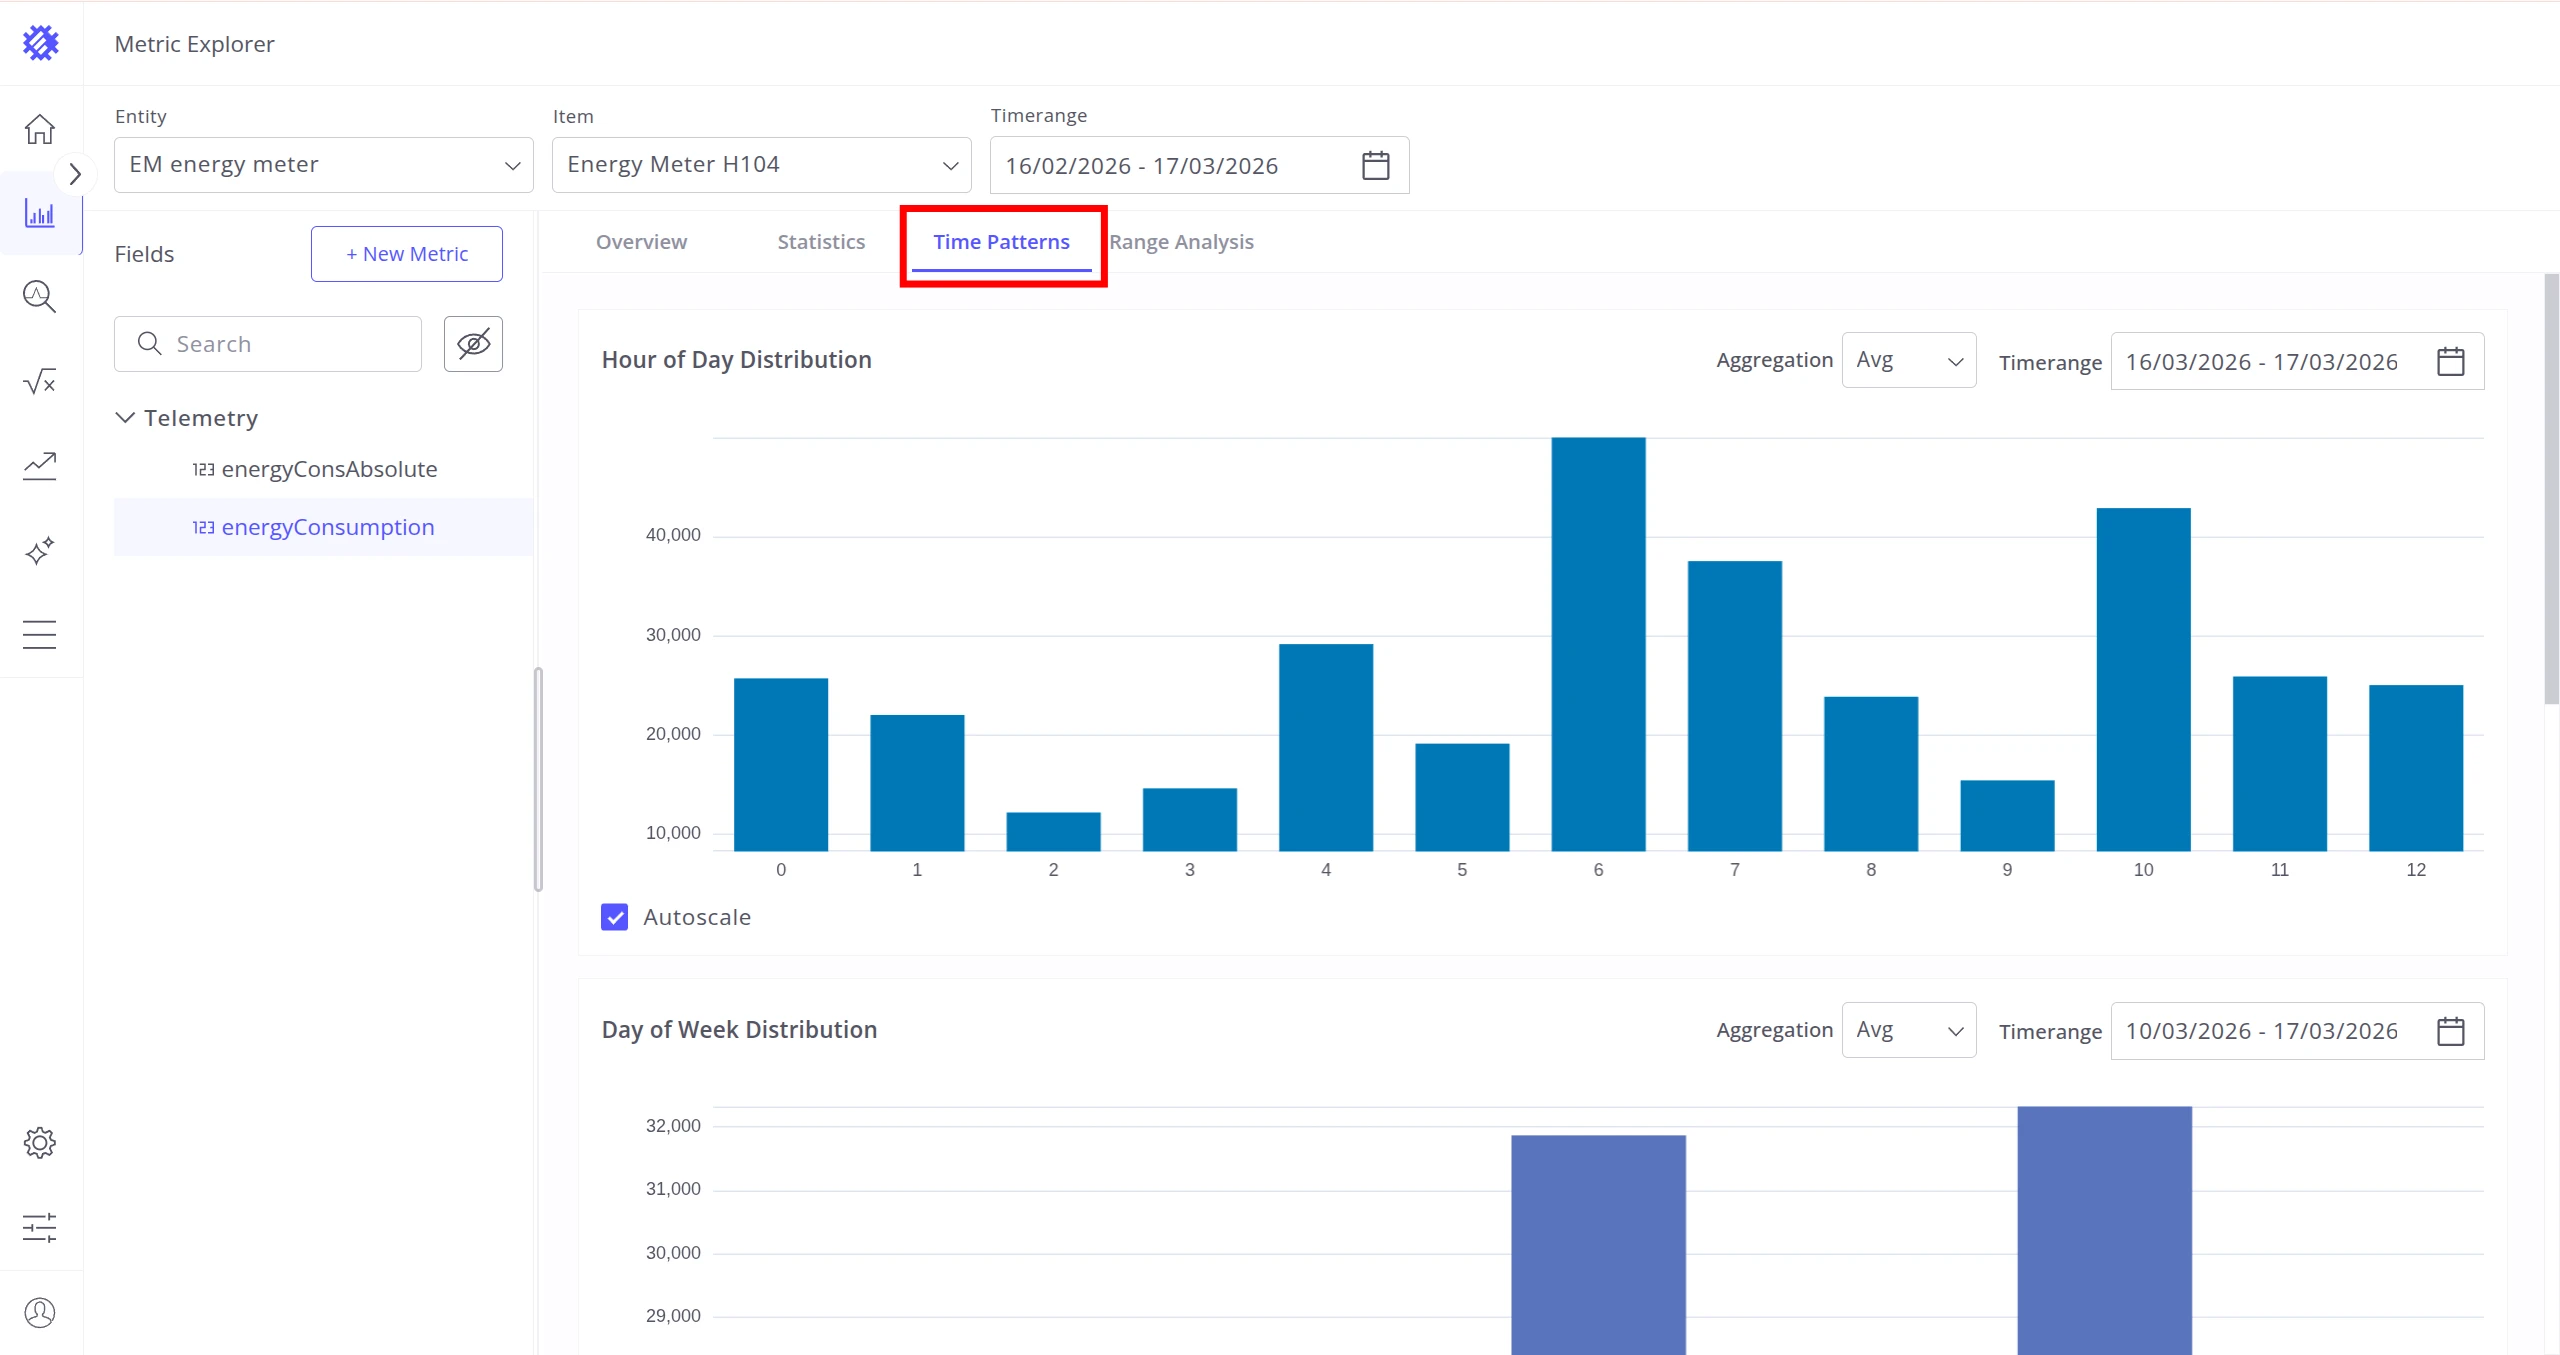
Switch to the Time Patterns tab to see hourly and daily consumption patterns.
-
Switch to the Range Analysis tab to see how long energy consumption stayed in each range during the selected period.
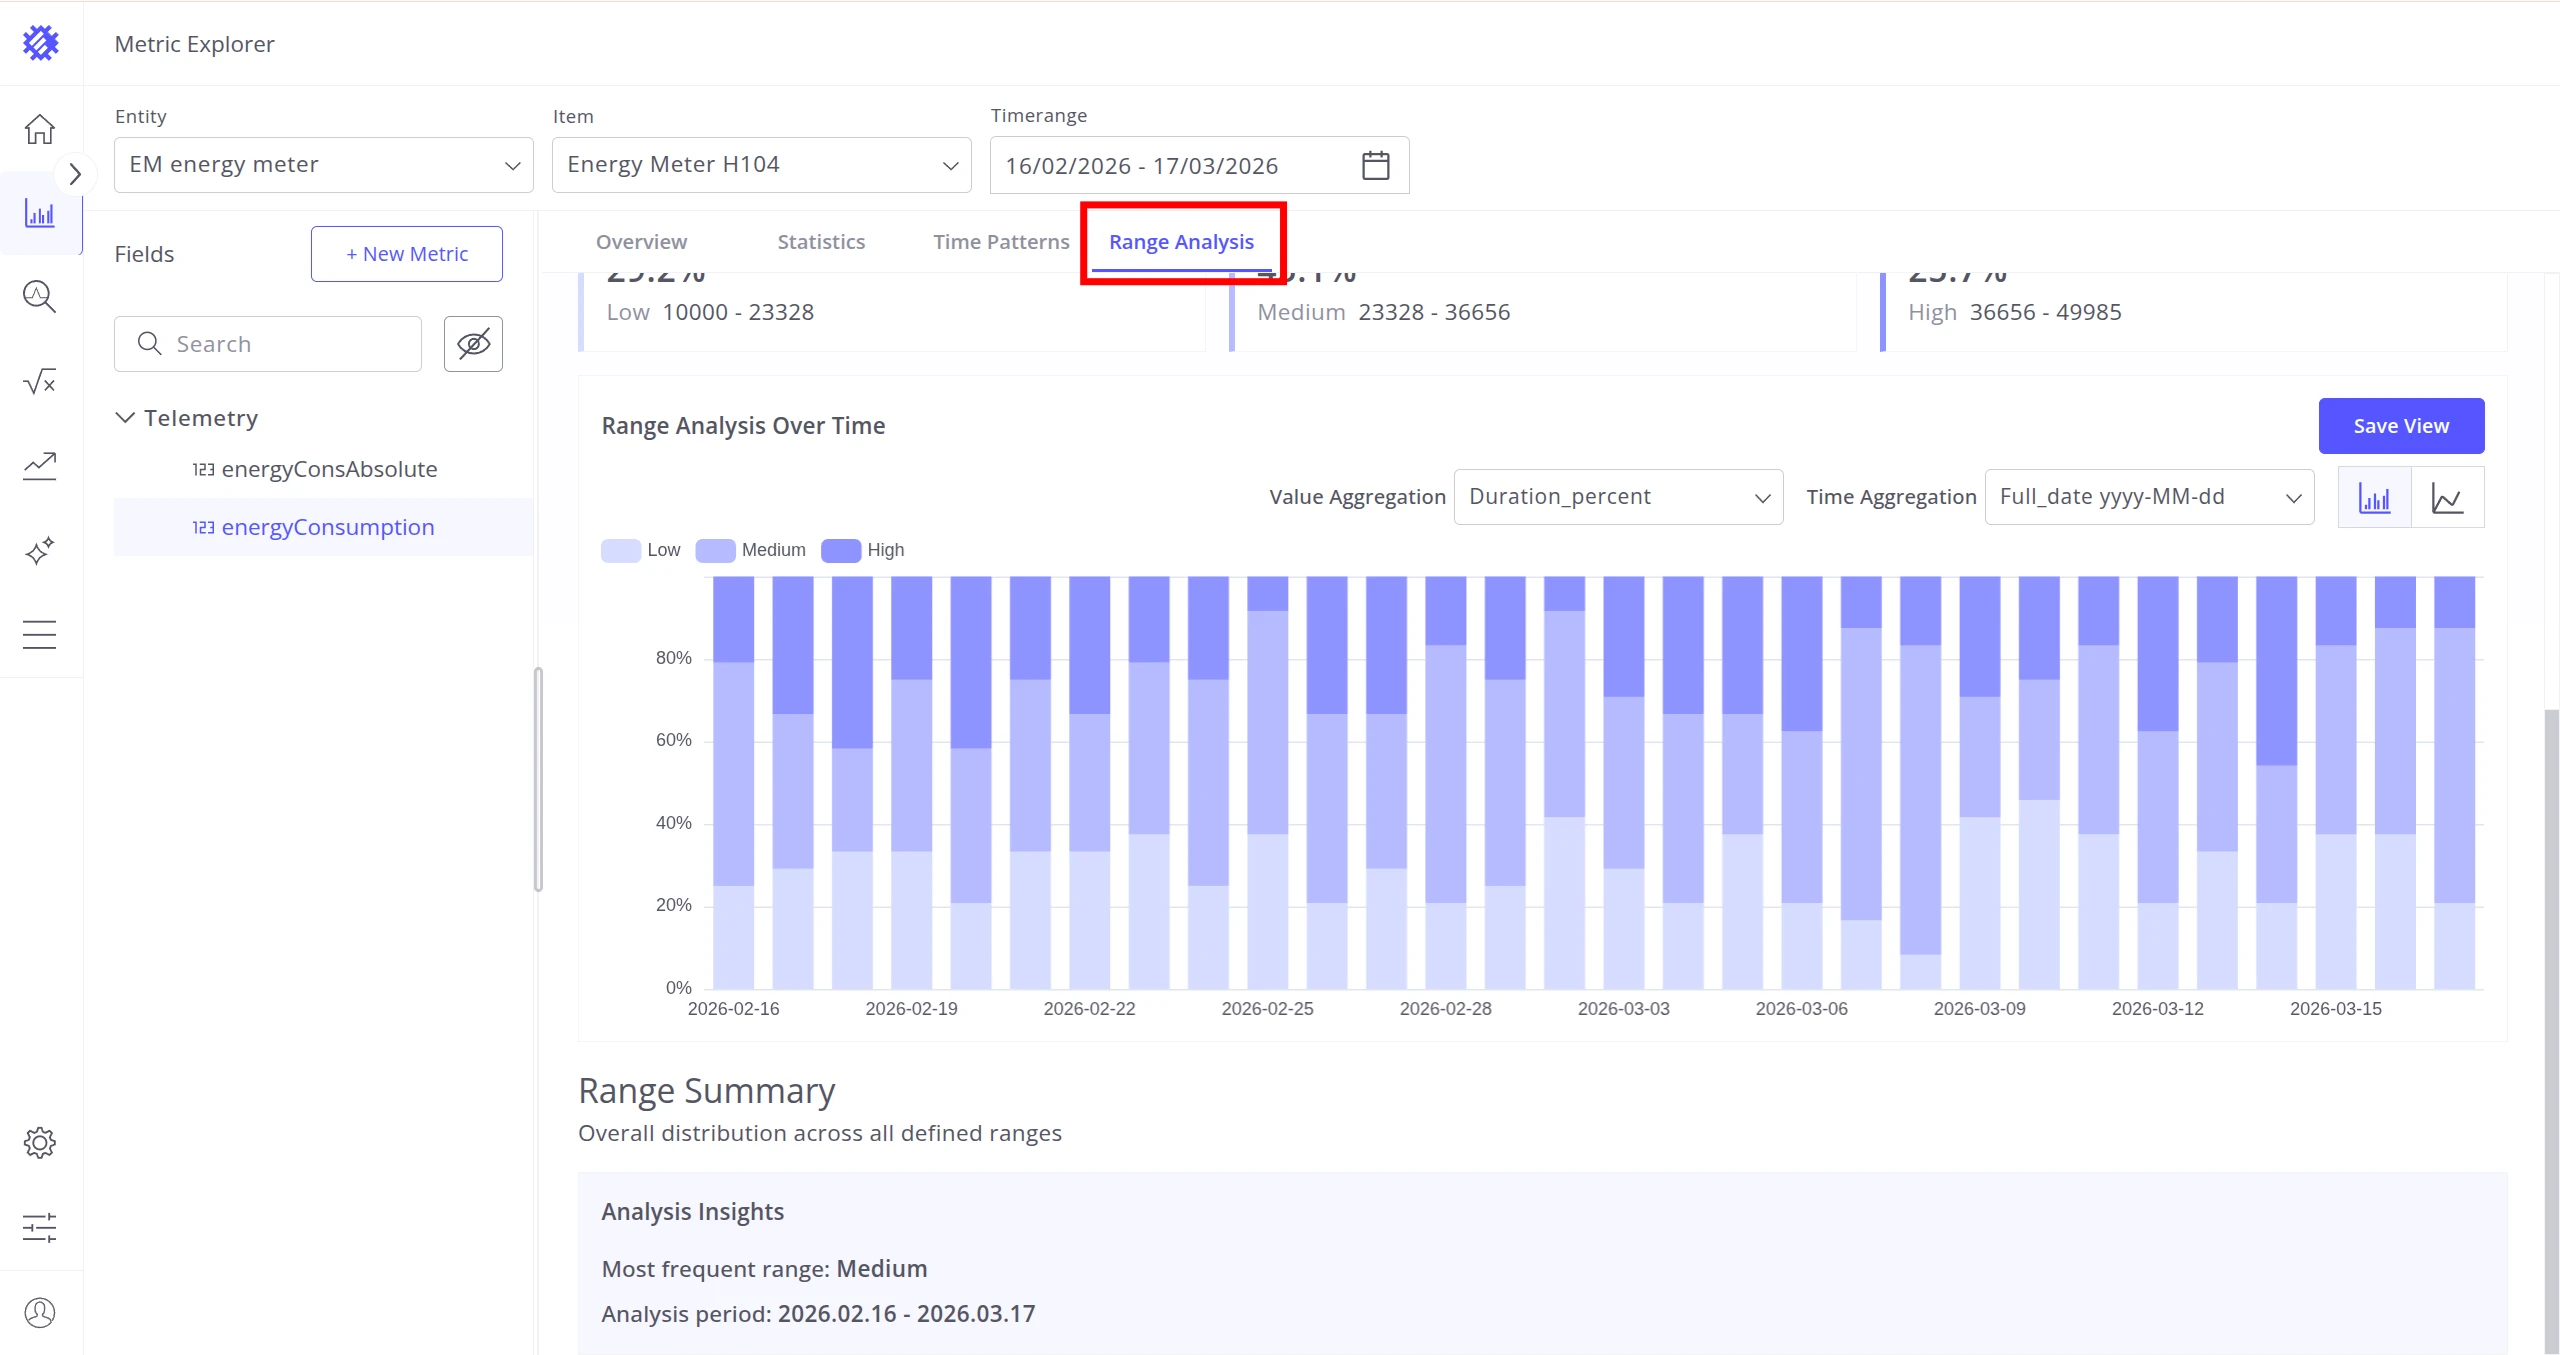
Now we have explored energy consumption statistics, time patterns, and range distribution for the selected meter.
Read more in Metric Explorer.
Step 3. Create a line chart view
Section titled “Step 3. Create a line chart view”Let’s build a line chart showing hourly electricity consumption per building for today.
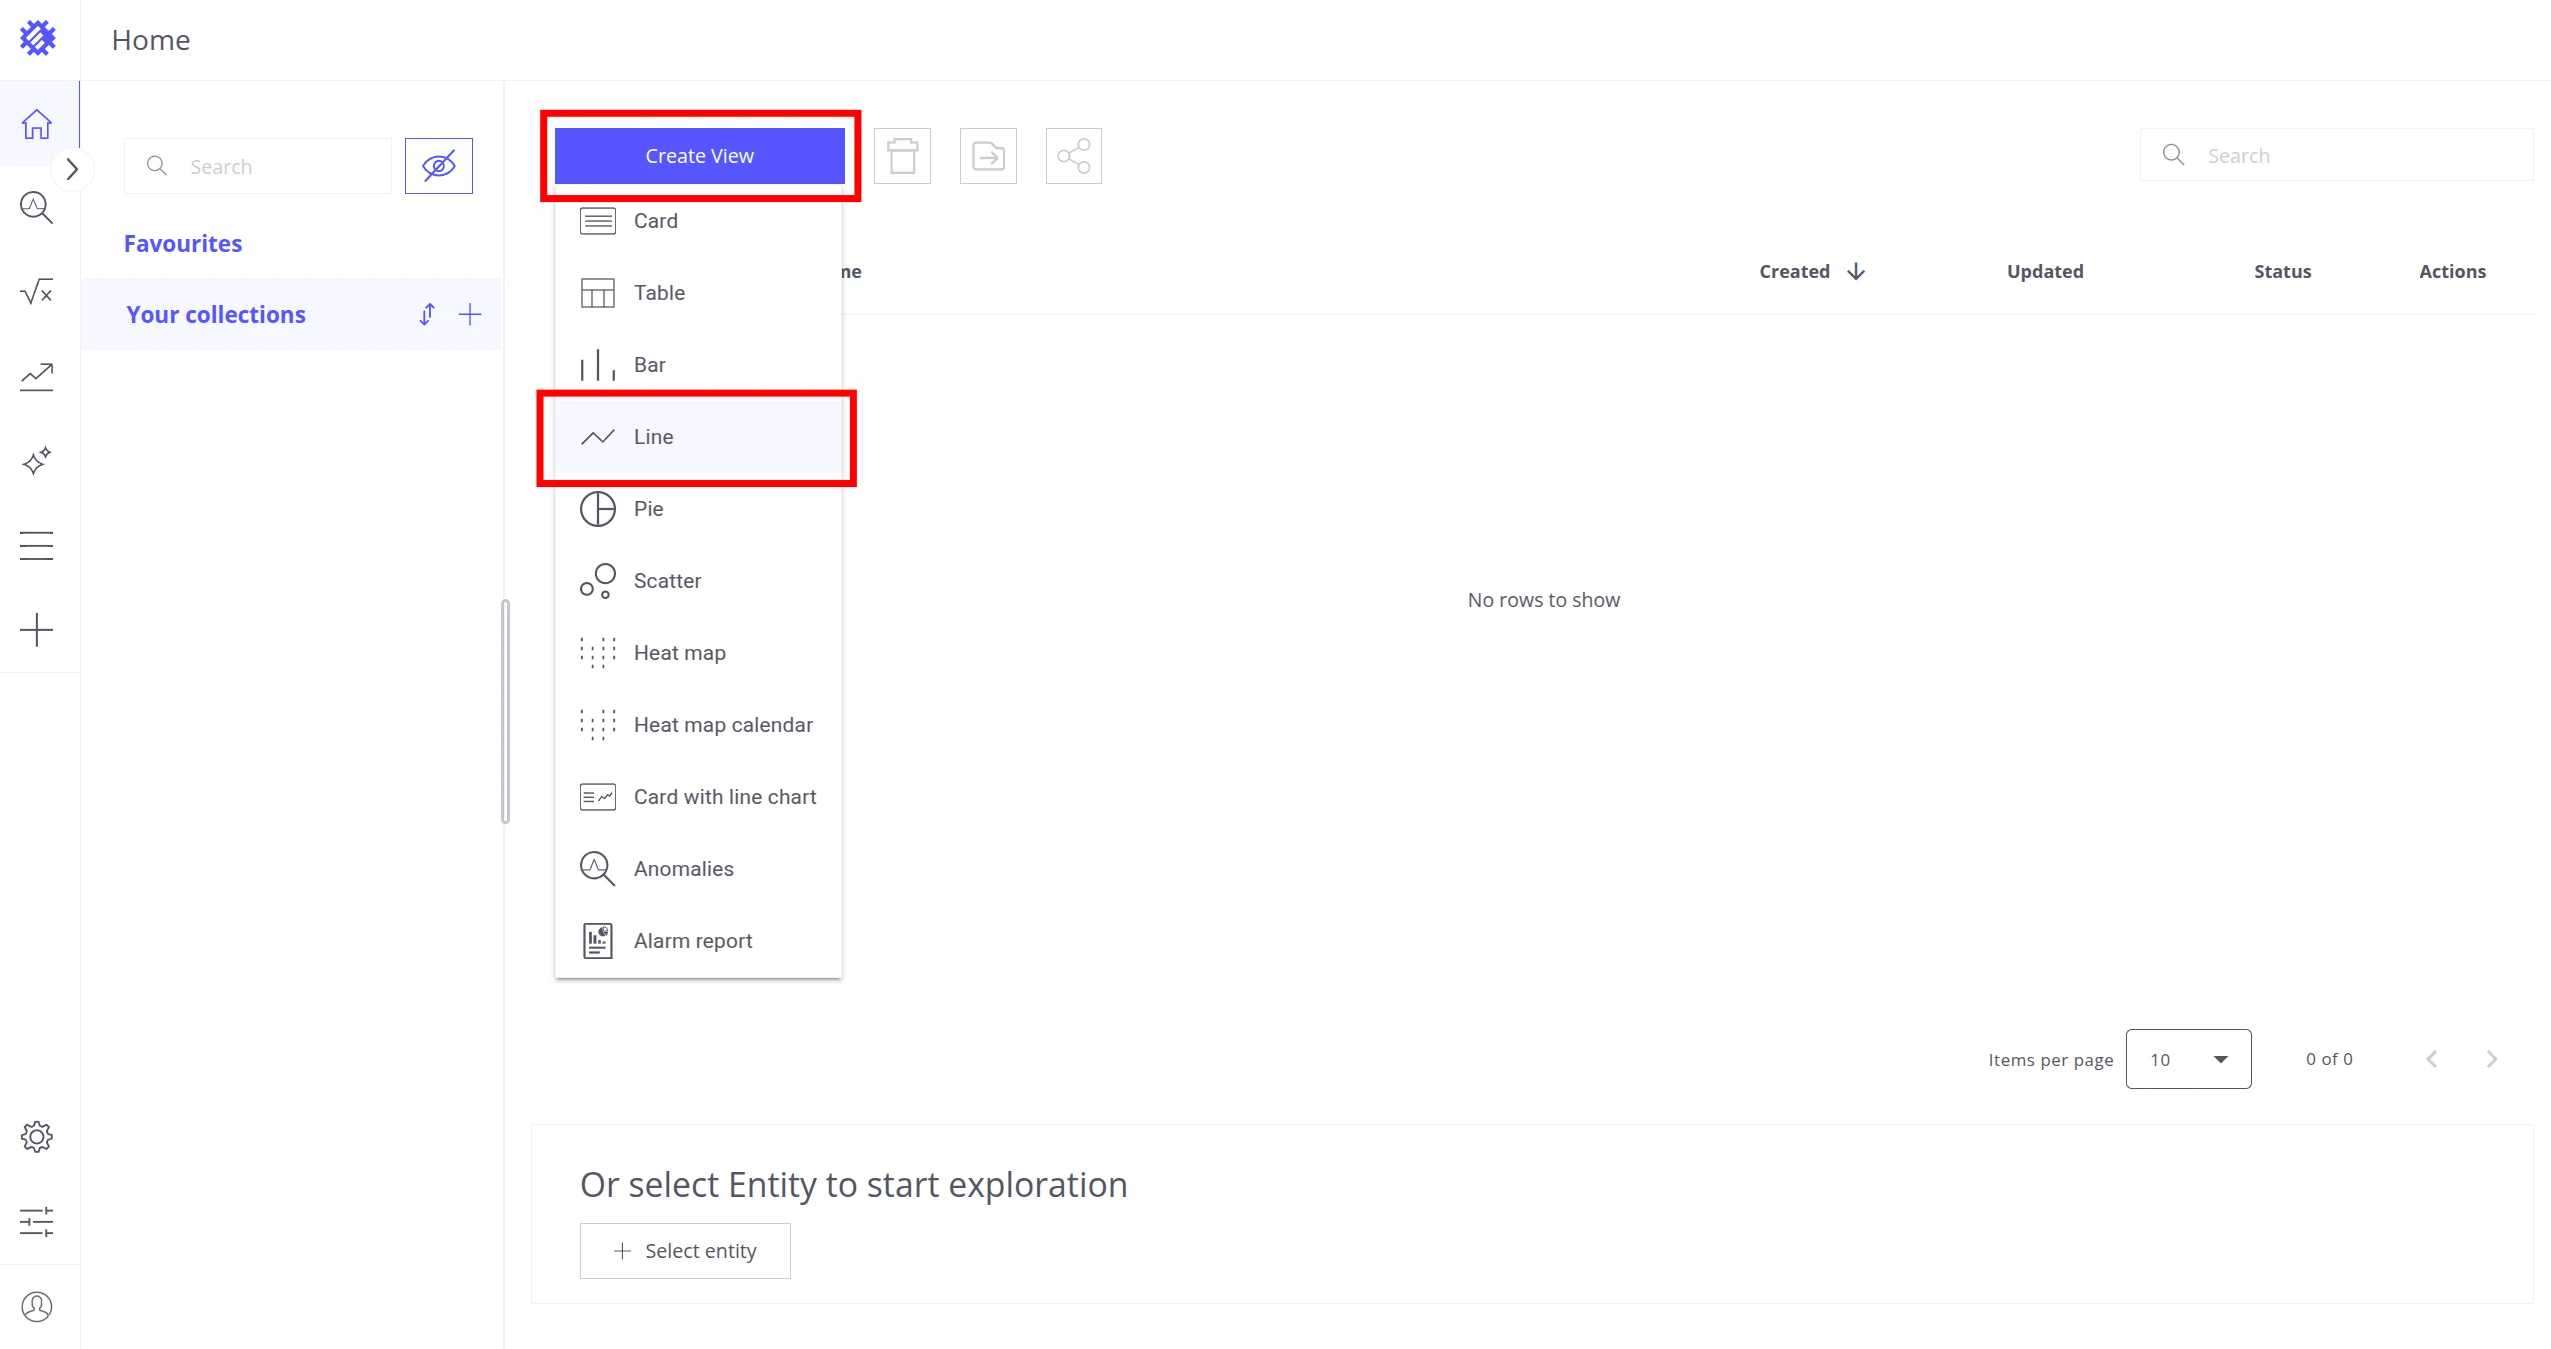
-
On the home page, click Create View and select Line.
-
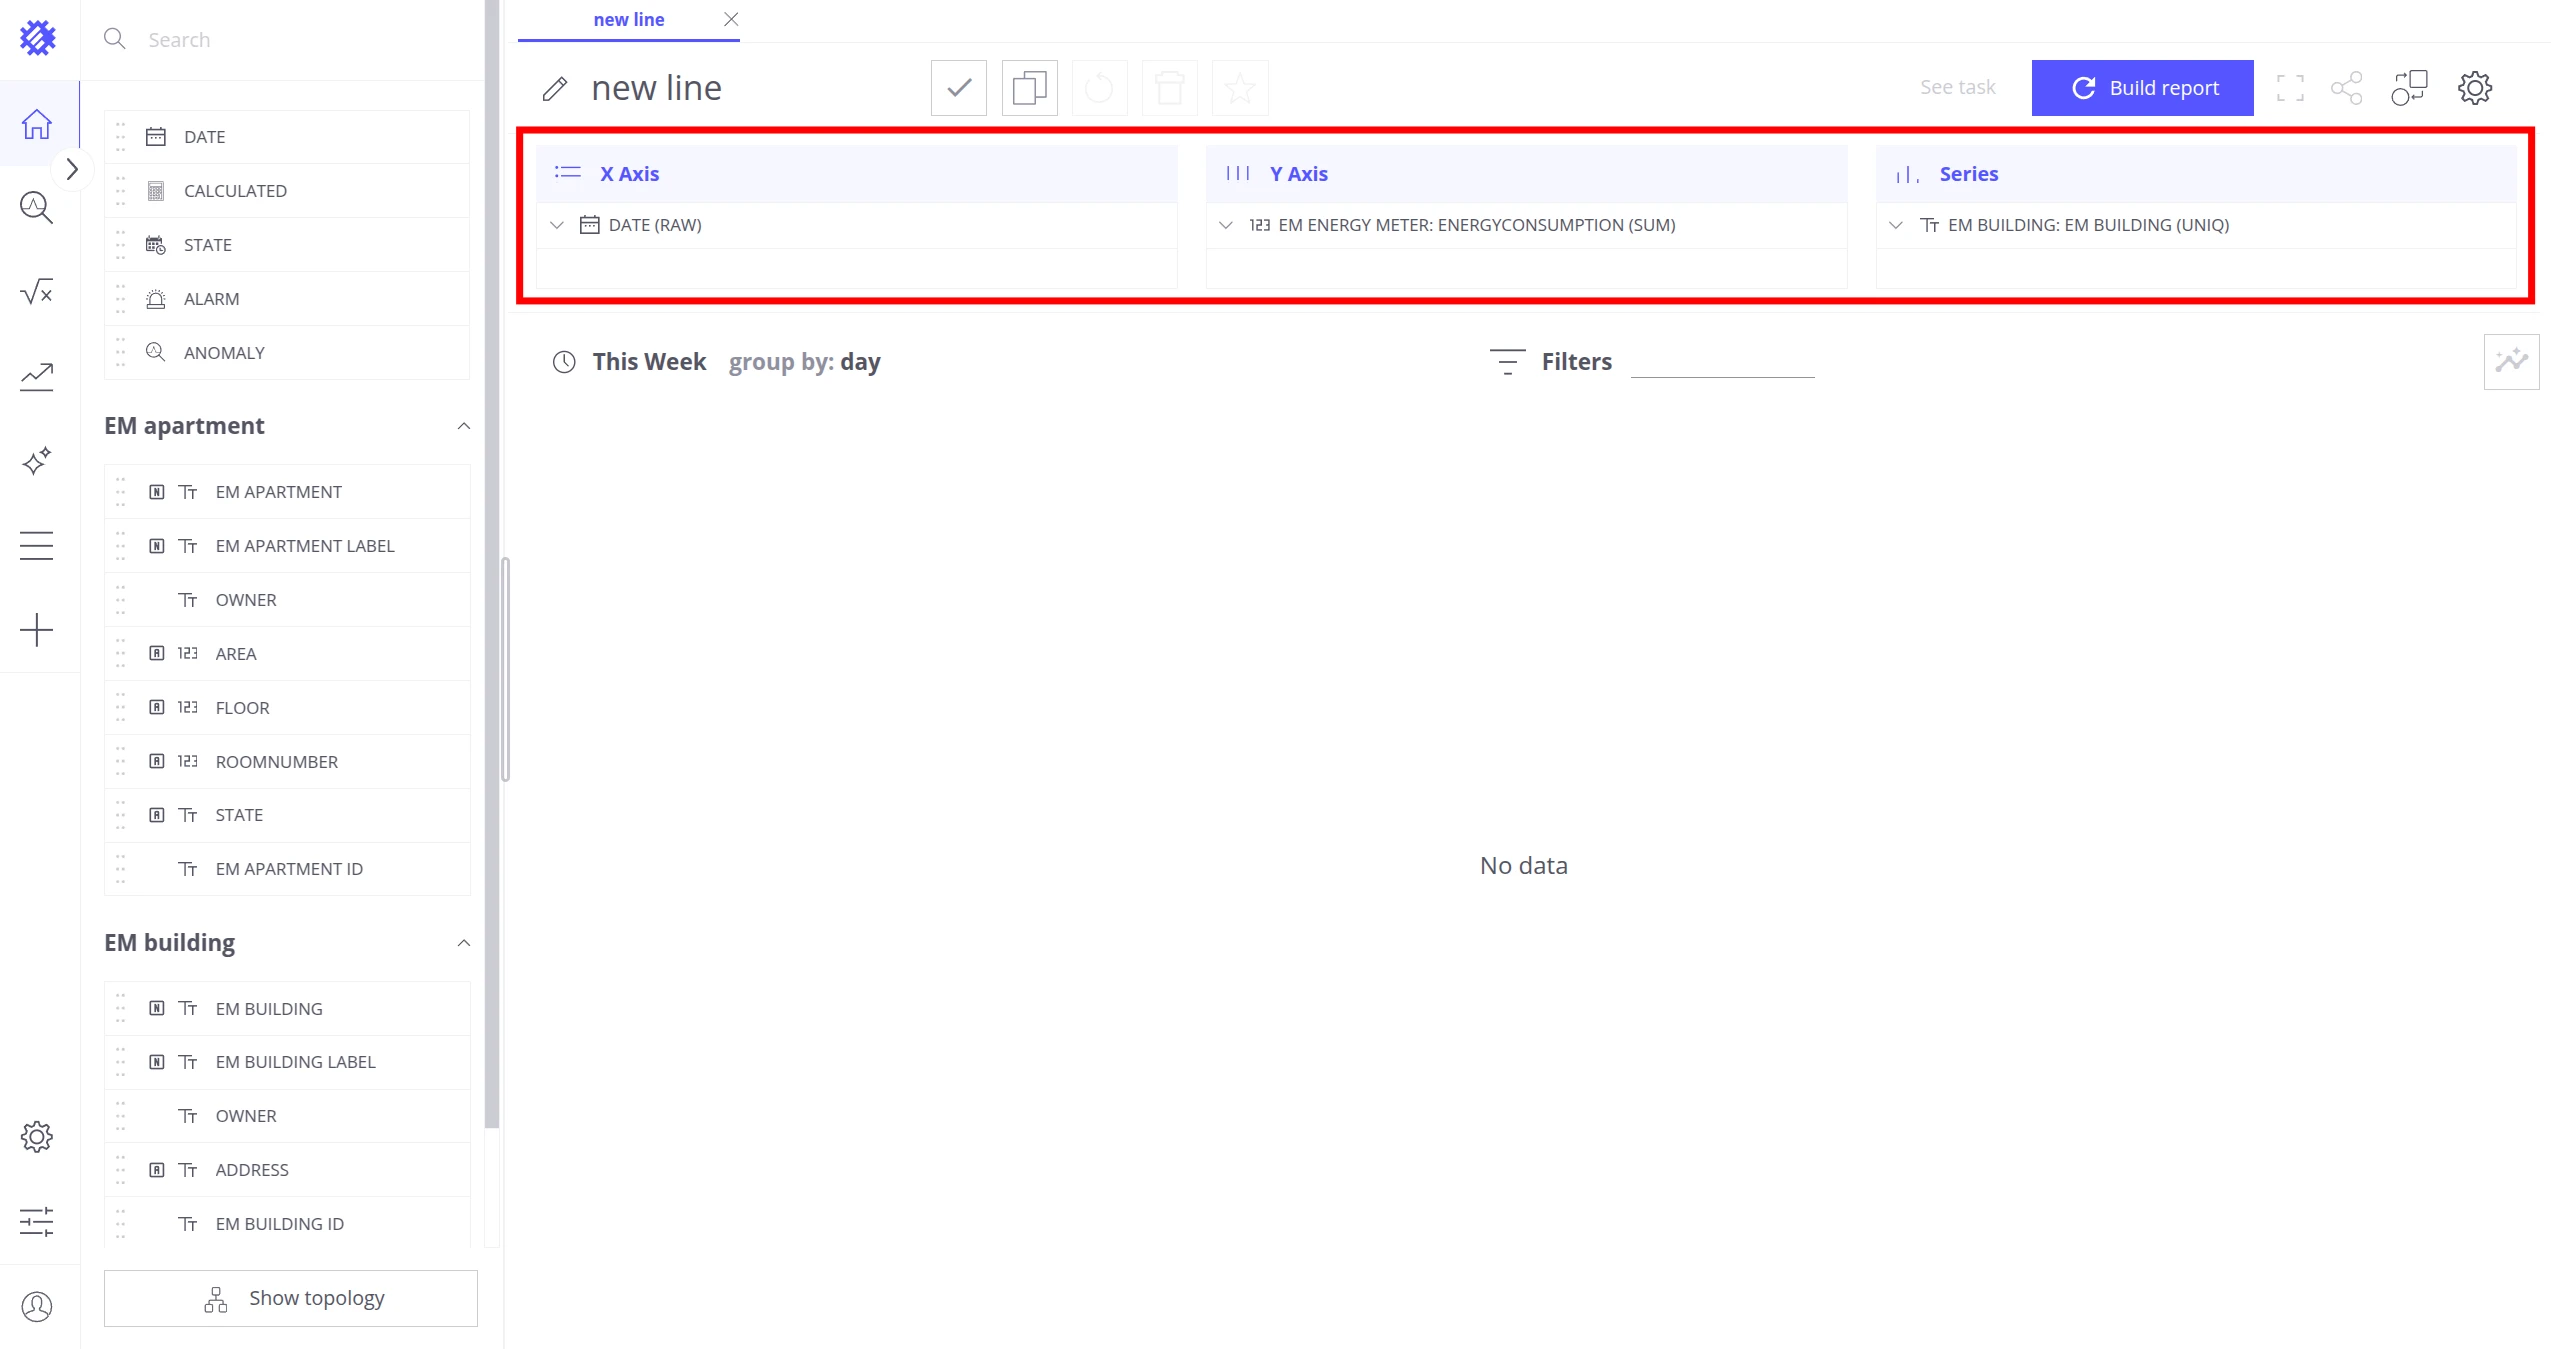
Drag the following fields from the left panel into the corresponding sections:
- X axis →
Date (RAW) - Y axis →
EM energy meter.energyConsumption - Series →
EM building.EM building
- X axis →
-
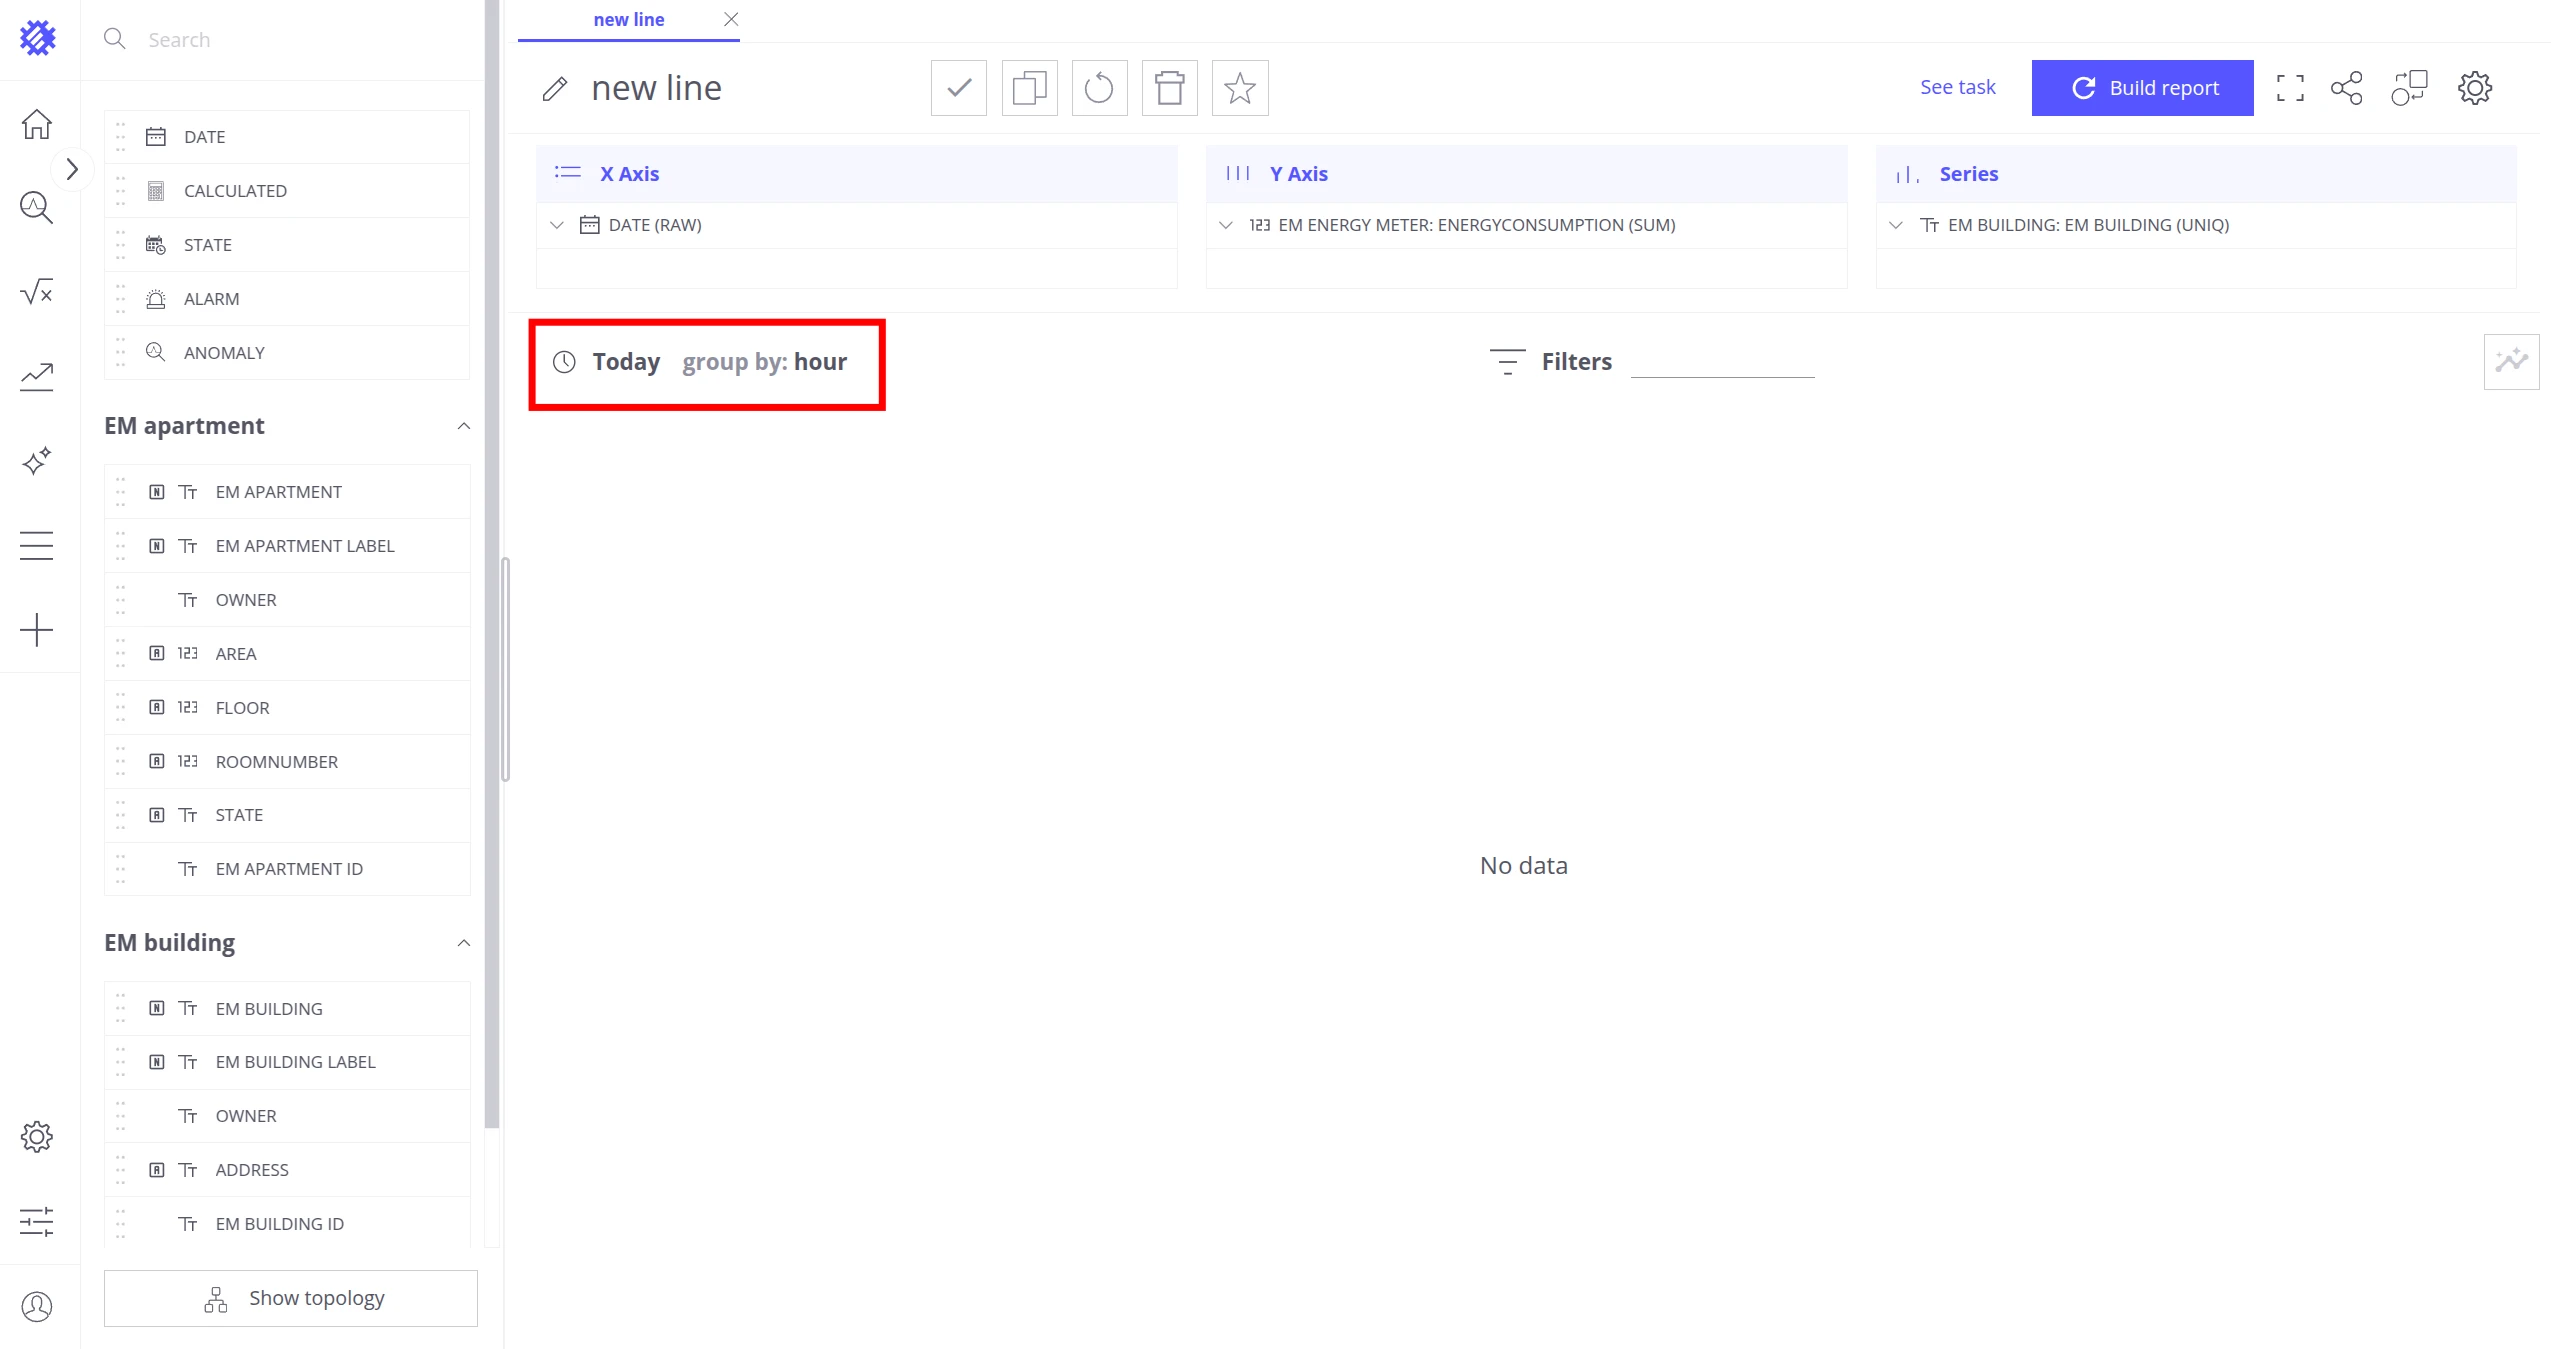
Set the date picker to Today and Group by to Hour.
-
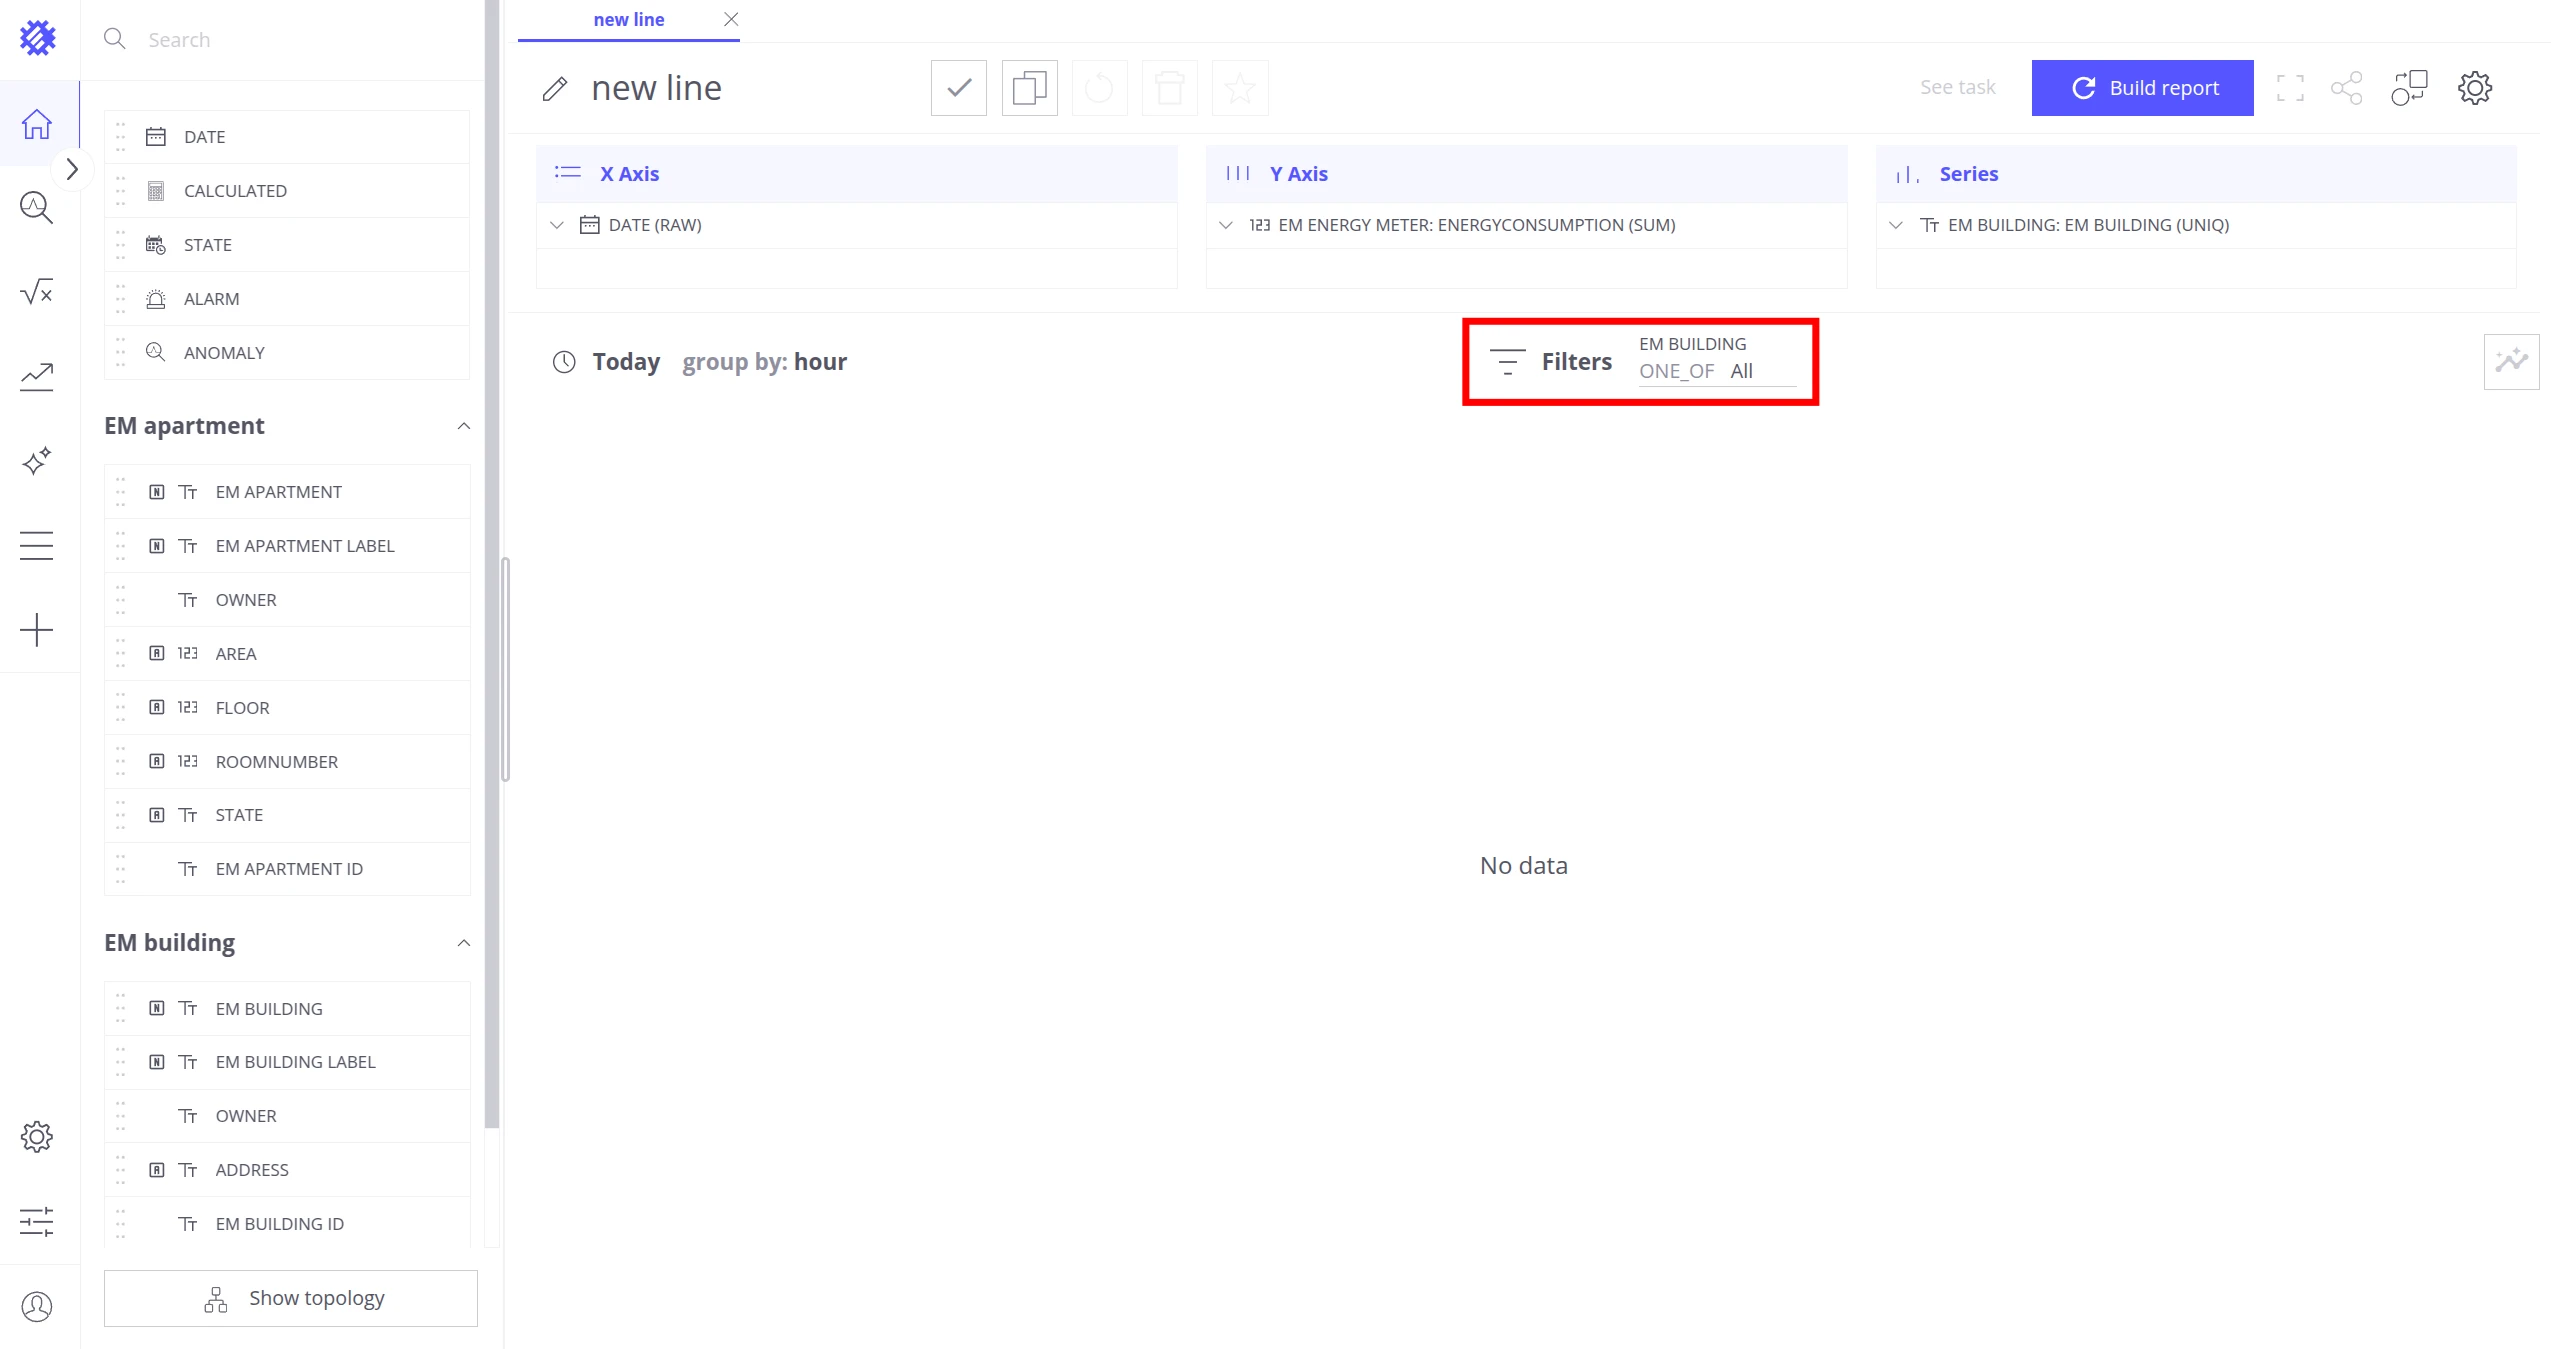
In the Filters section, add
EM building.EM buildingto allow filtering by a specific building. -
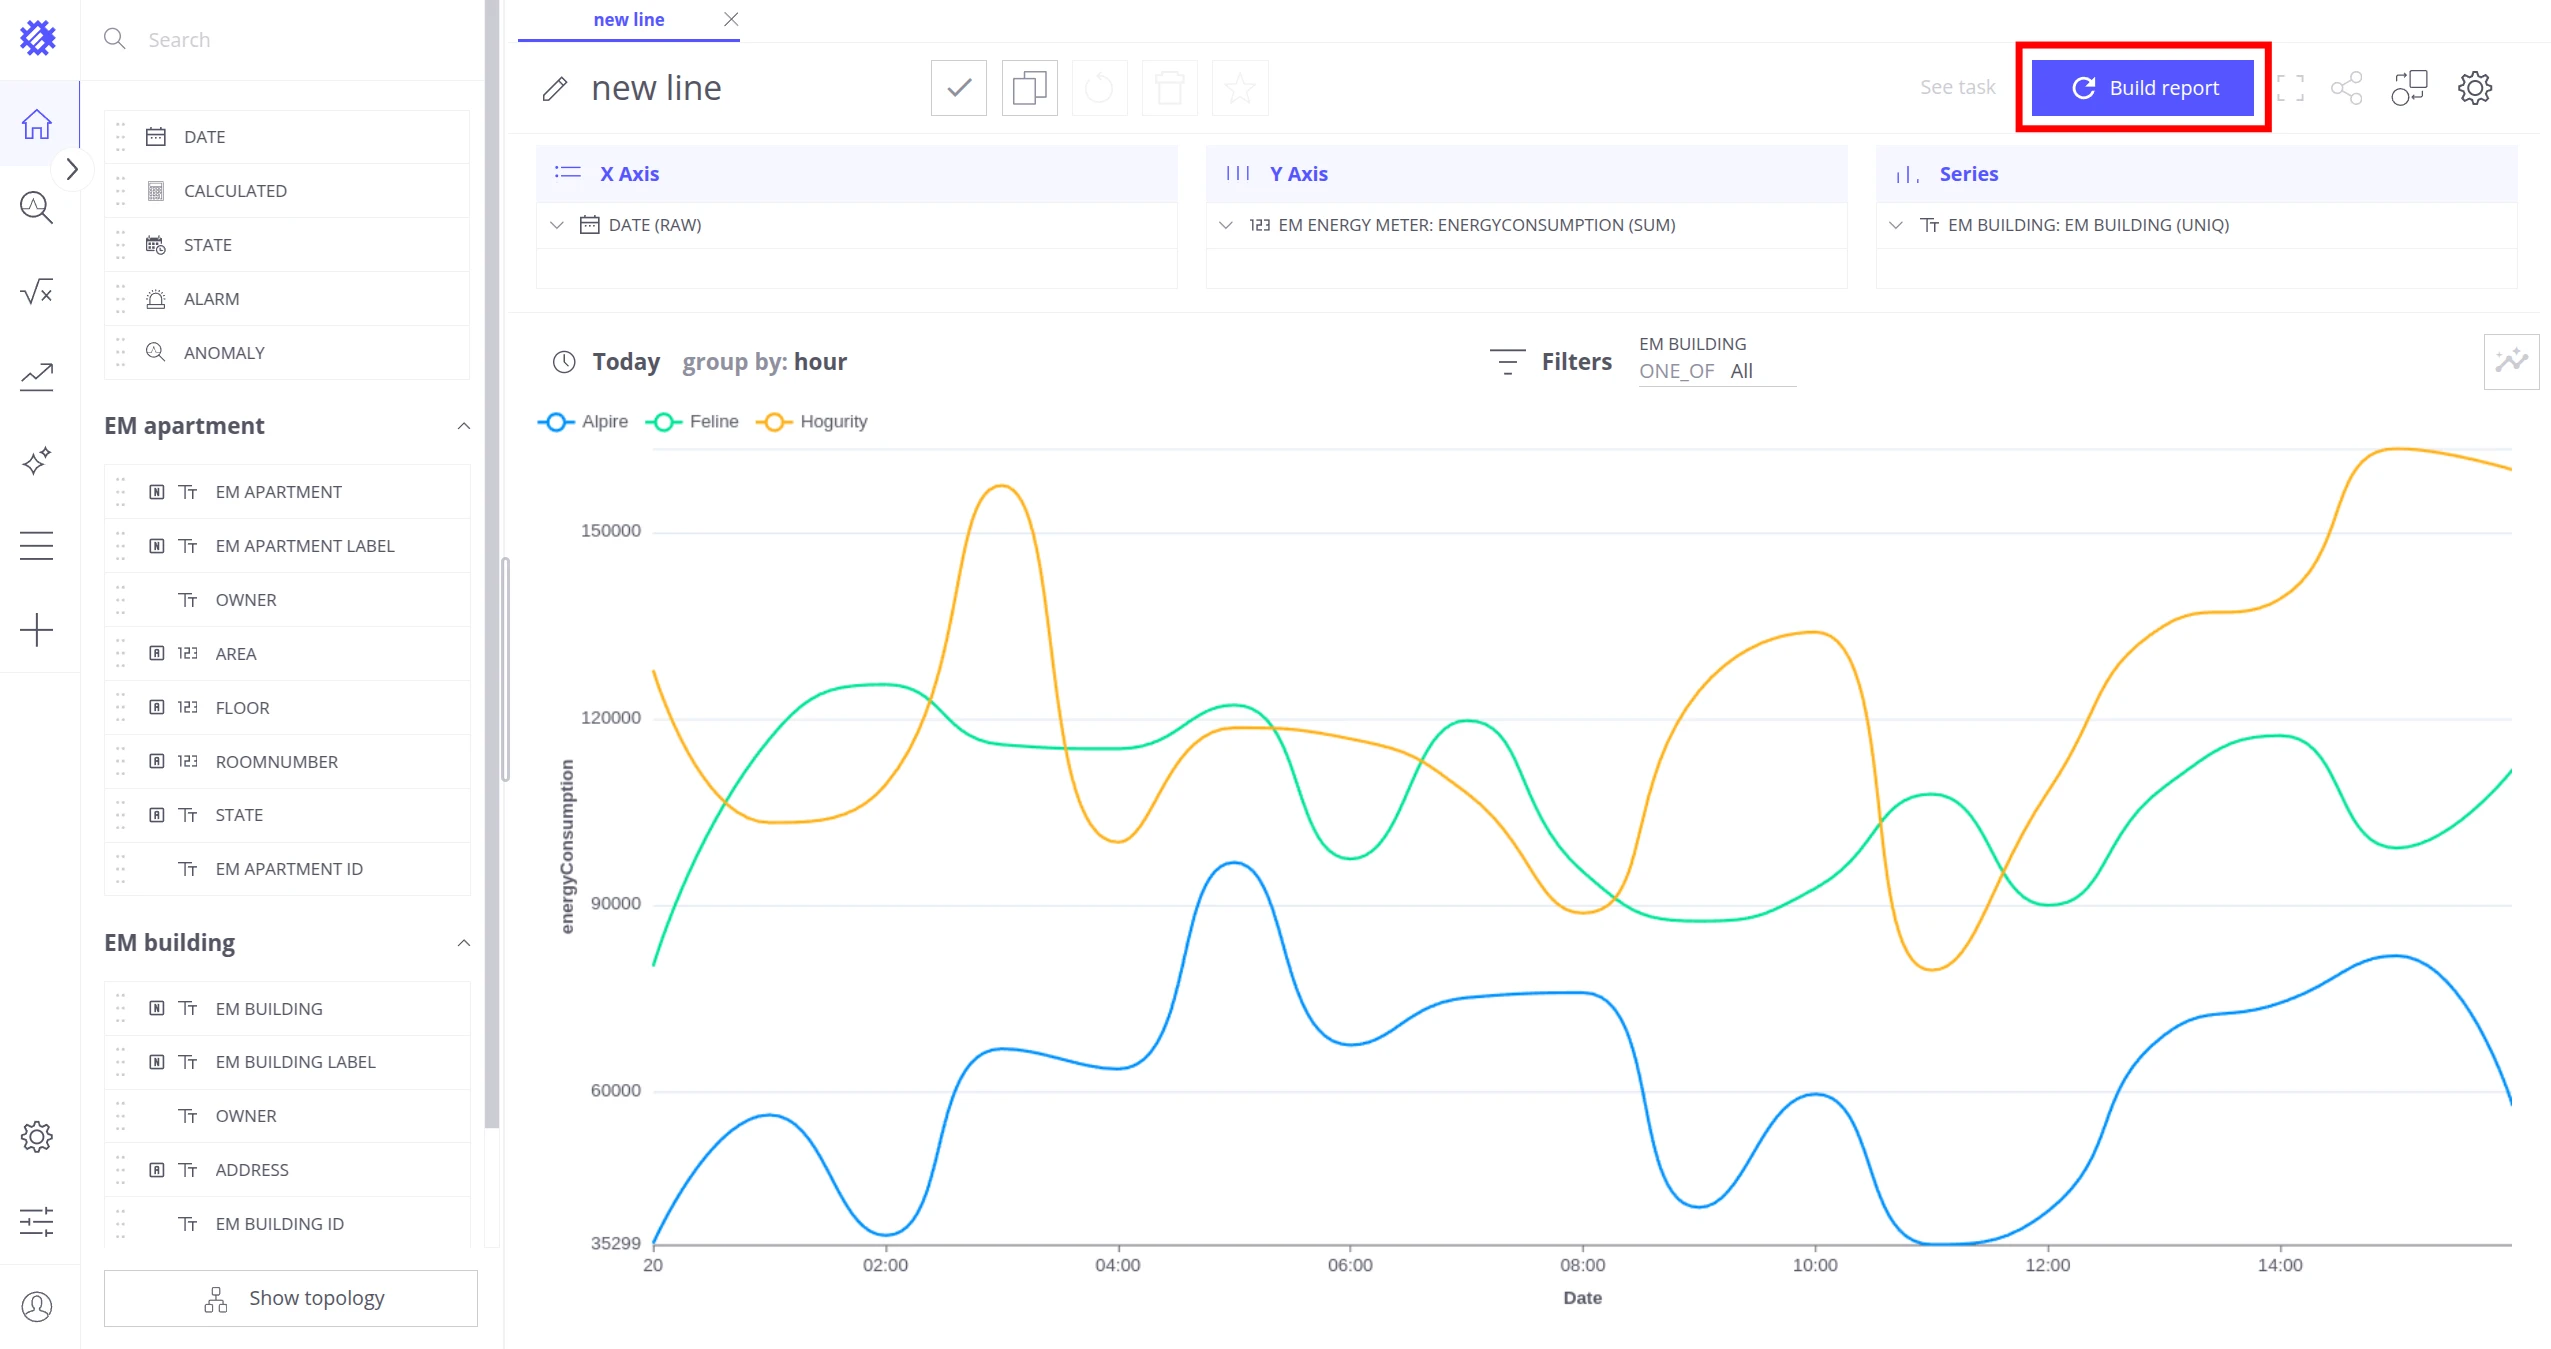
Click Build Report — a line chart broken down by building appears.
-
Click the pencil icon next to the view name and rename it to
Building energy consumption trends for today. -
Click Save Changes, then Save in the pop-up.
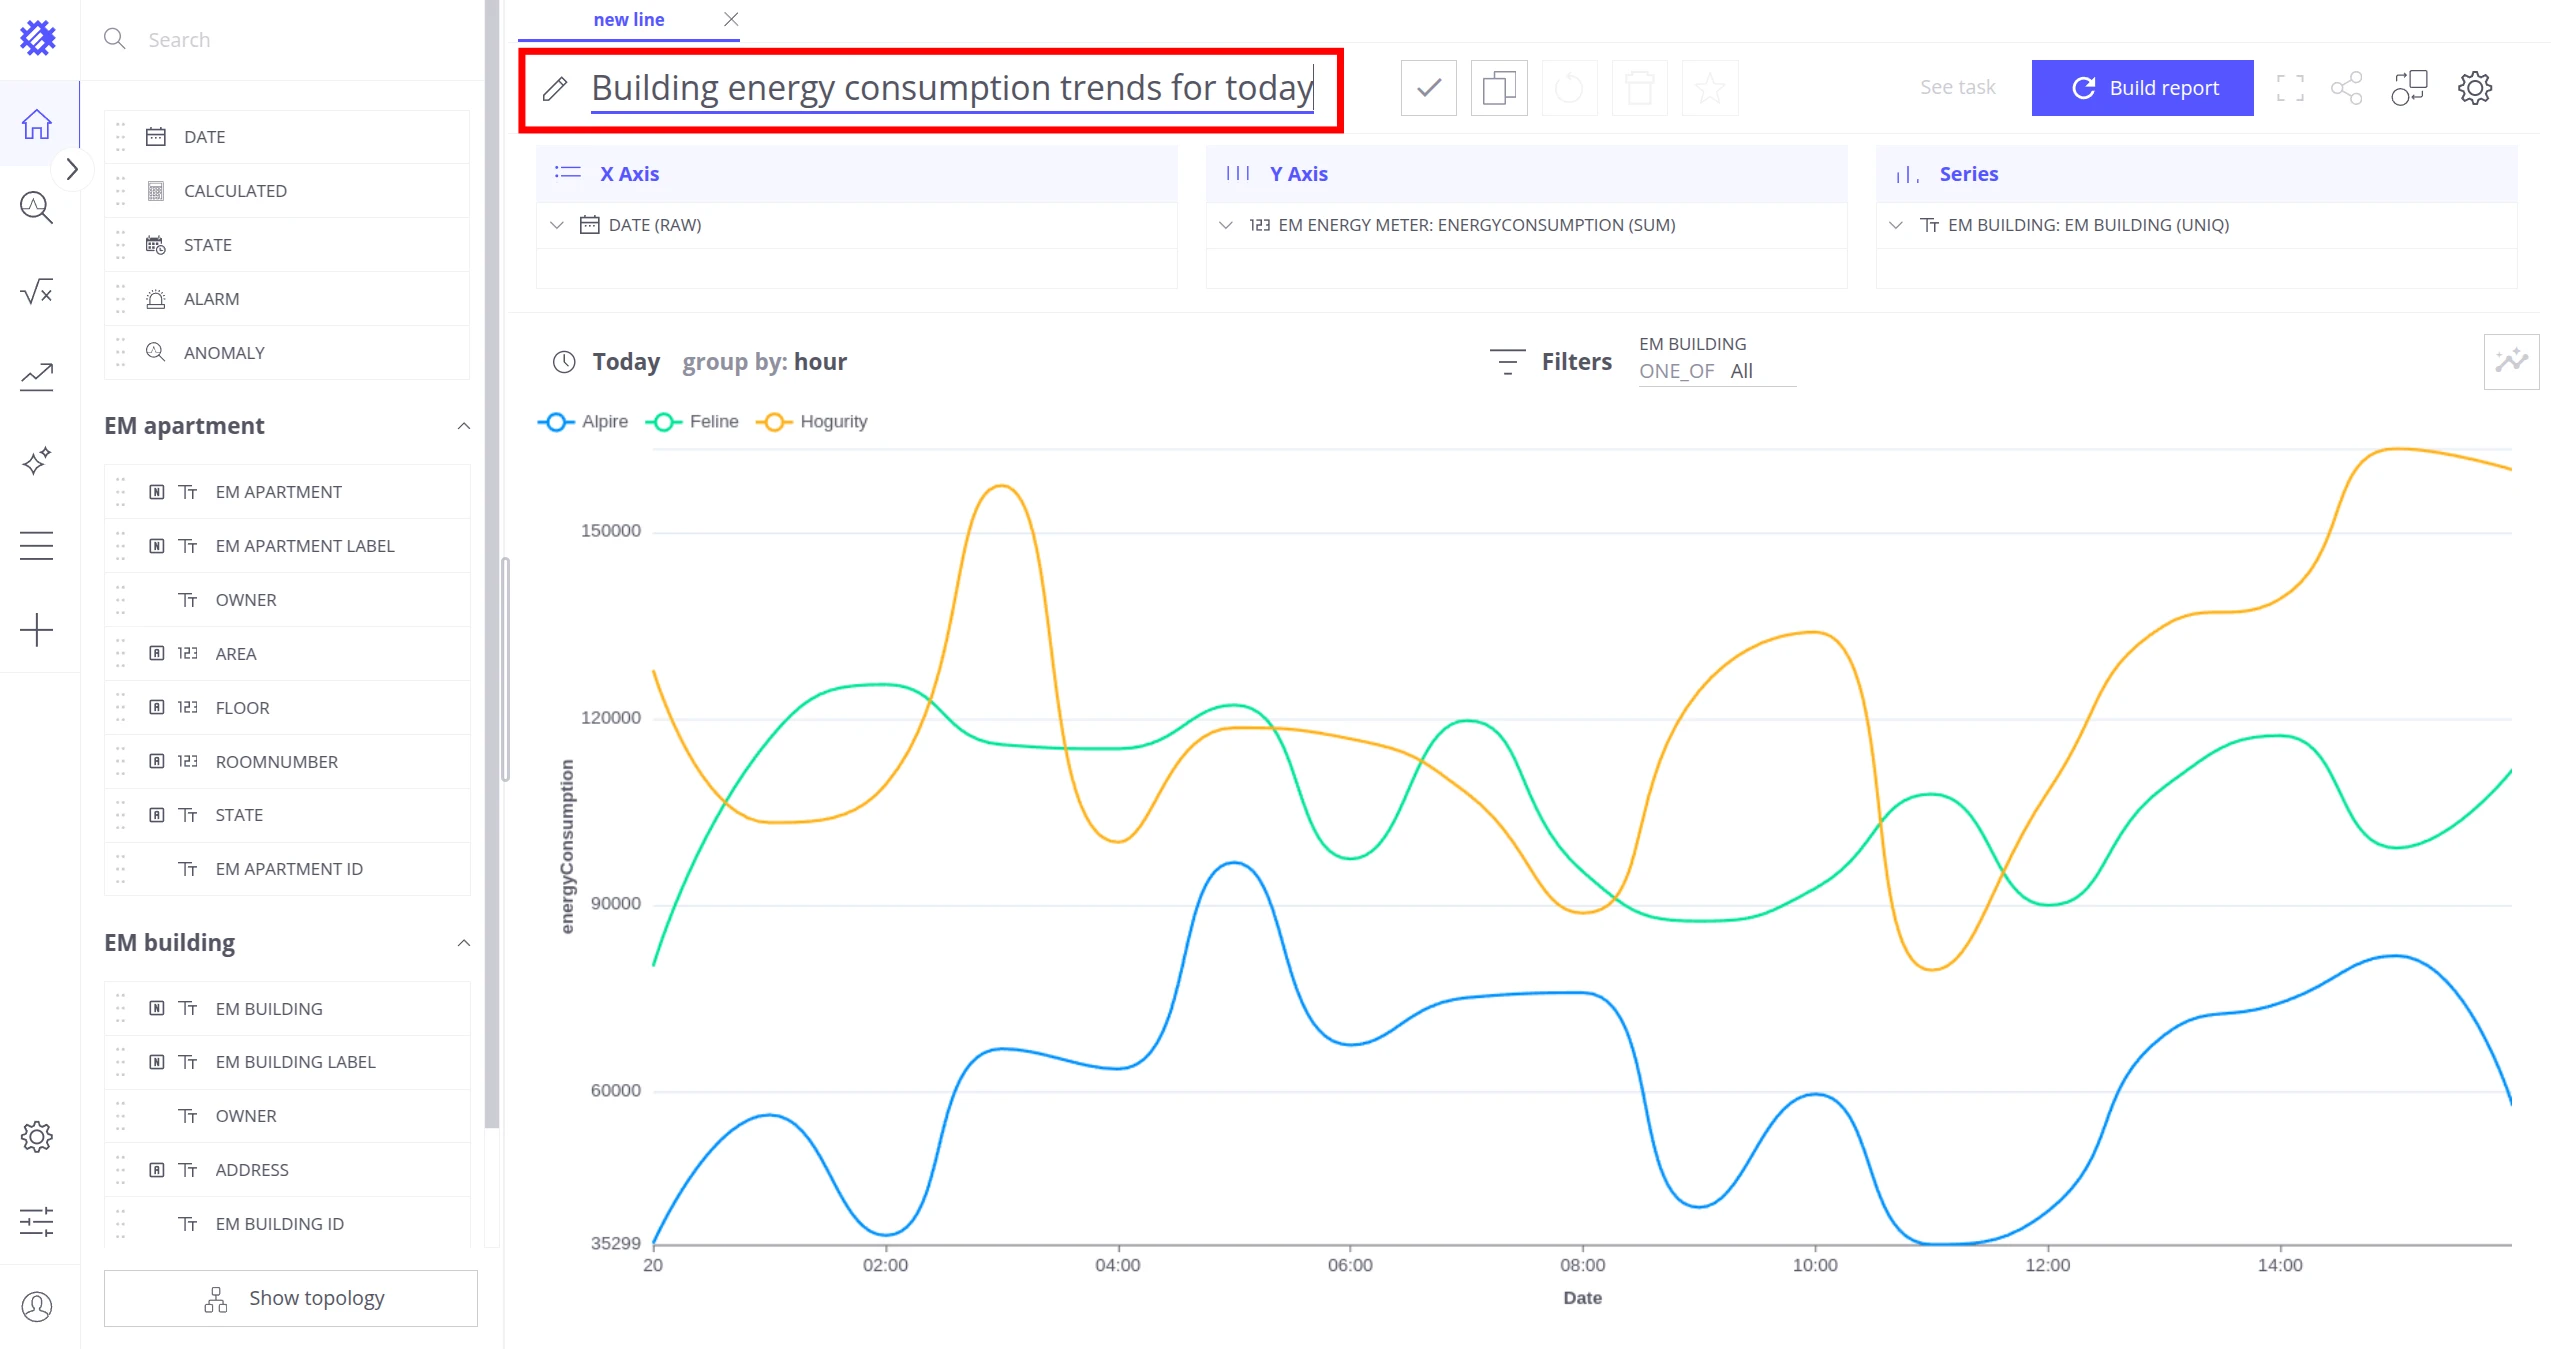
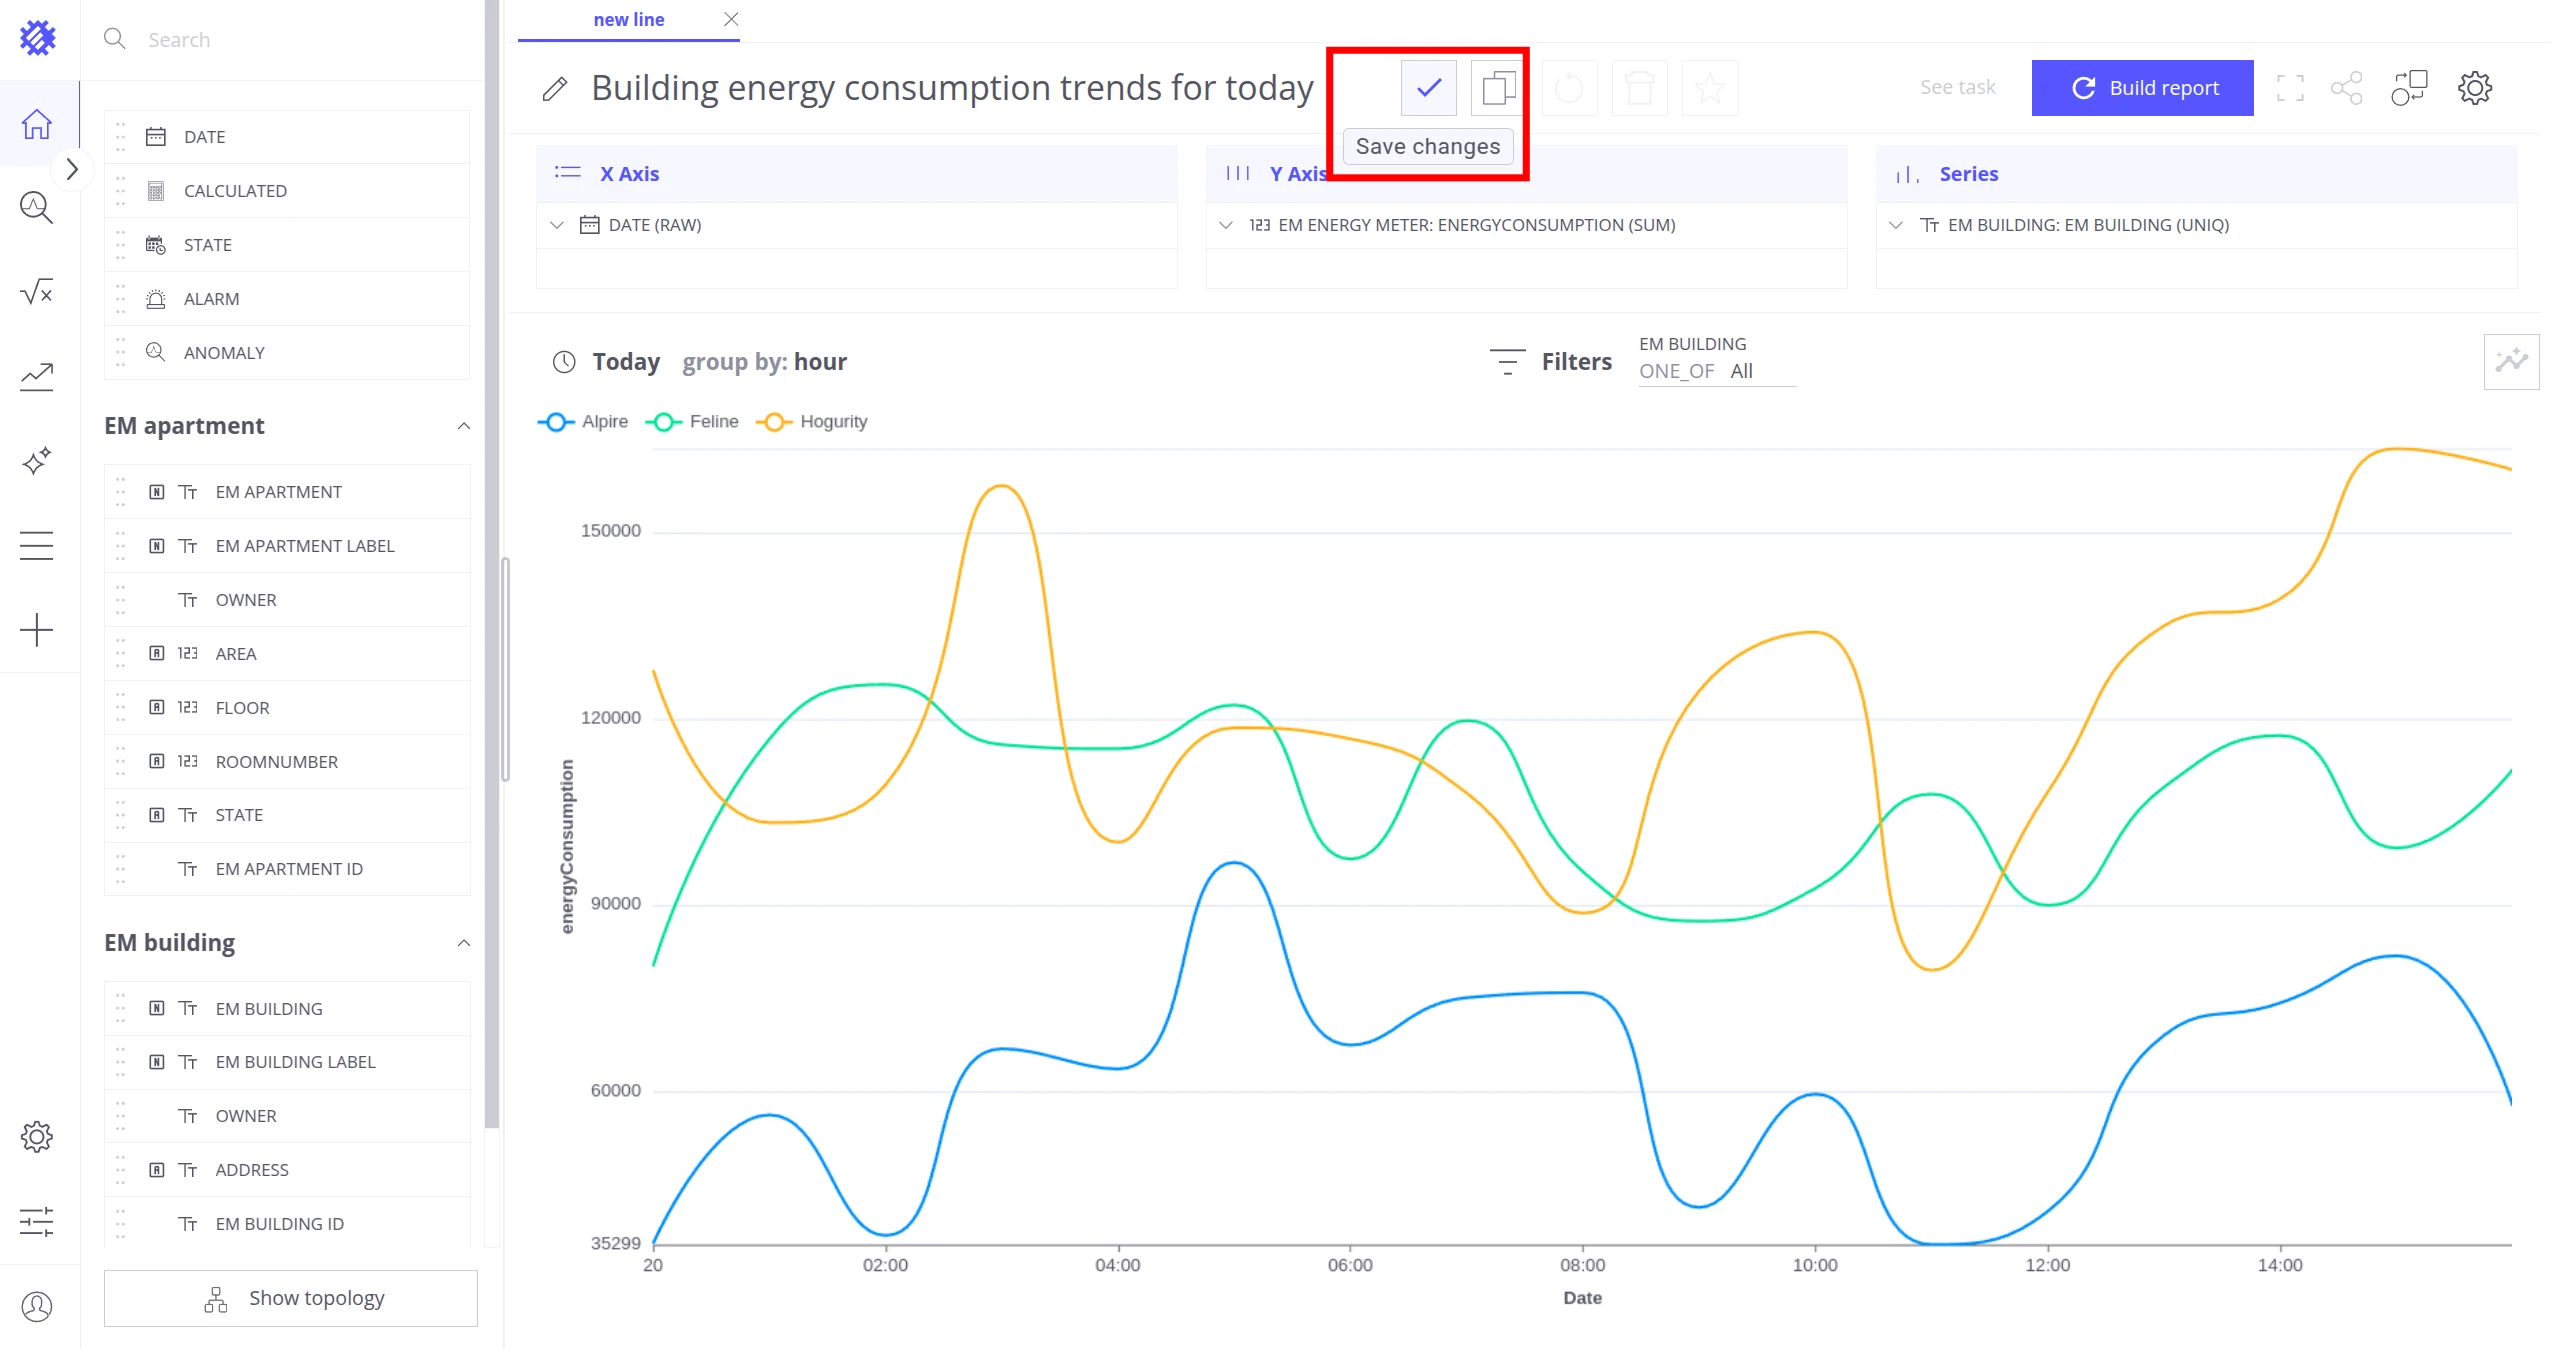
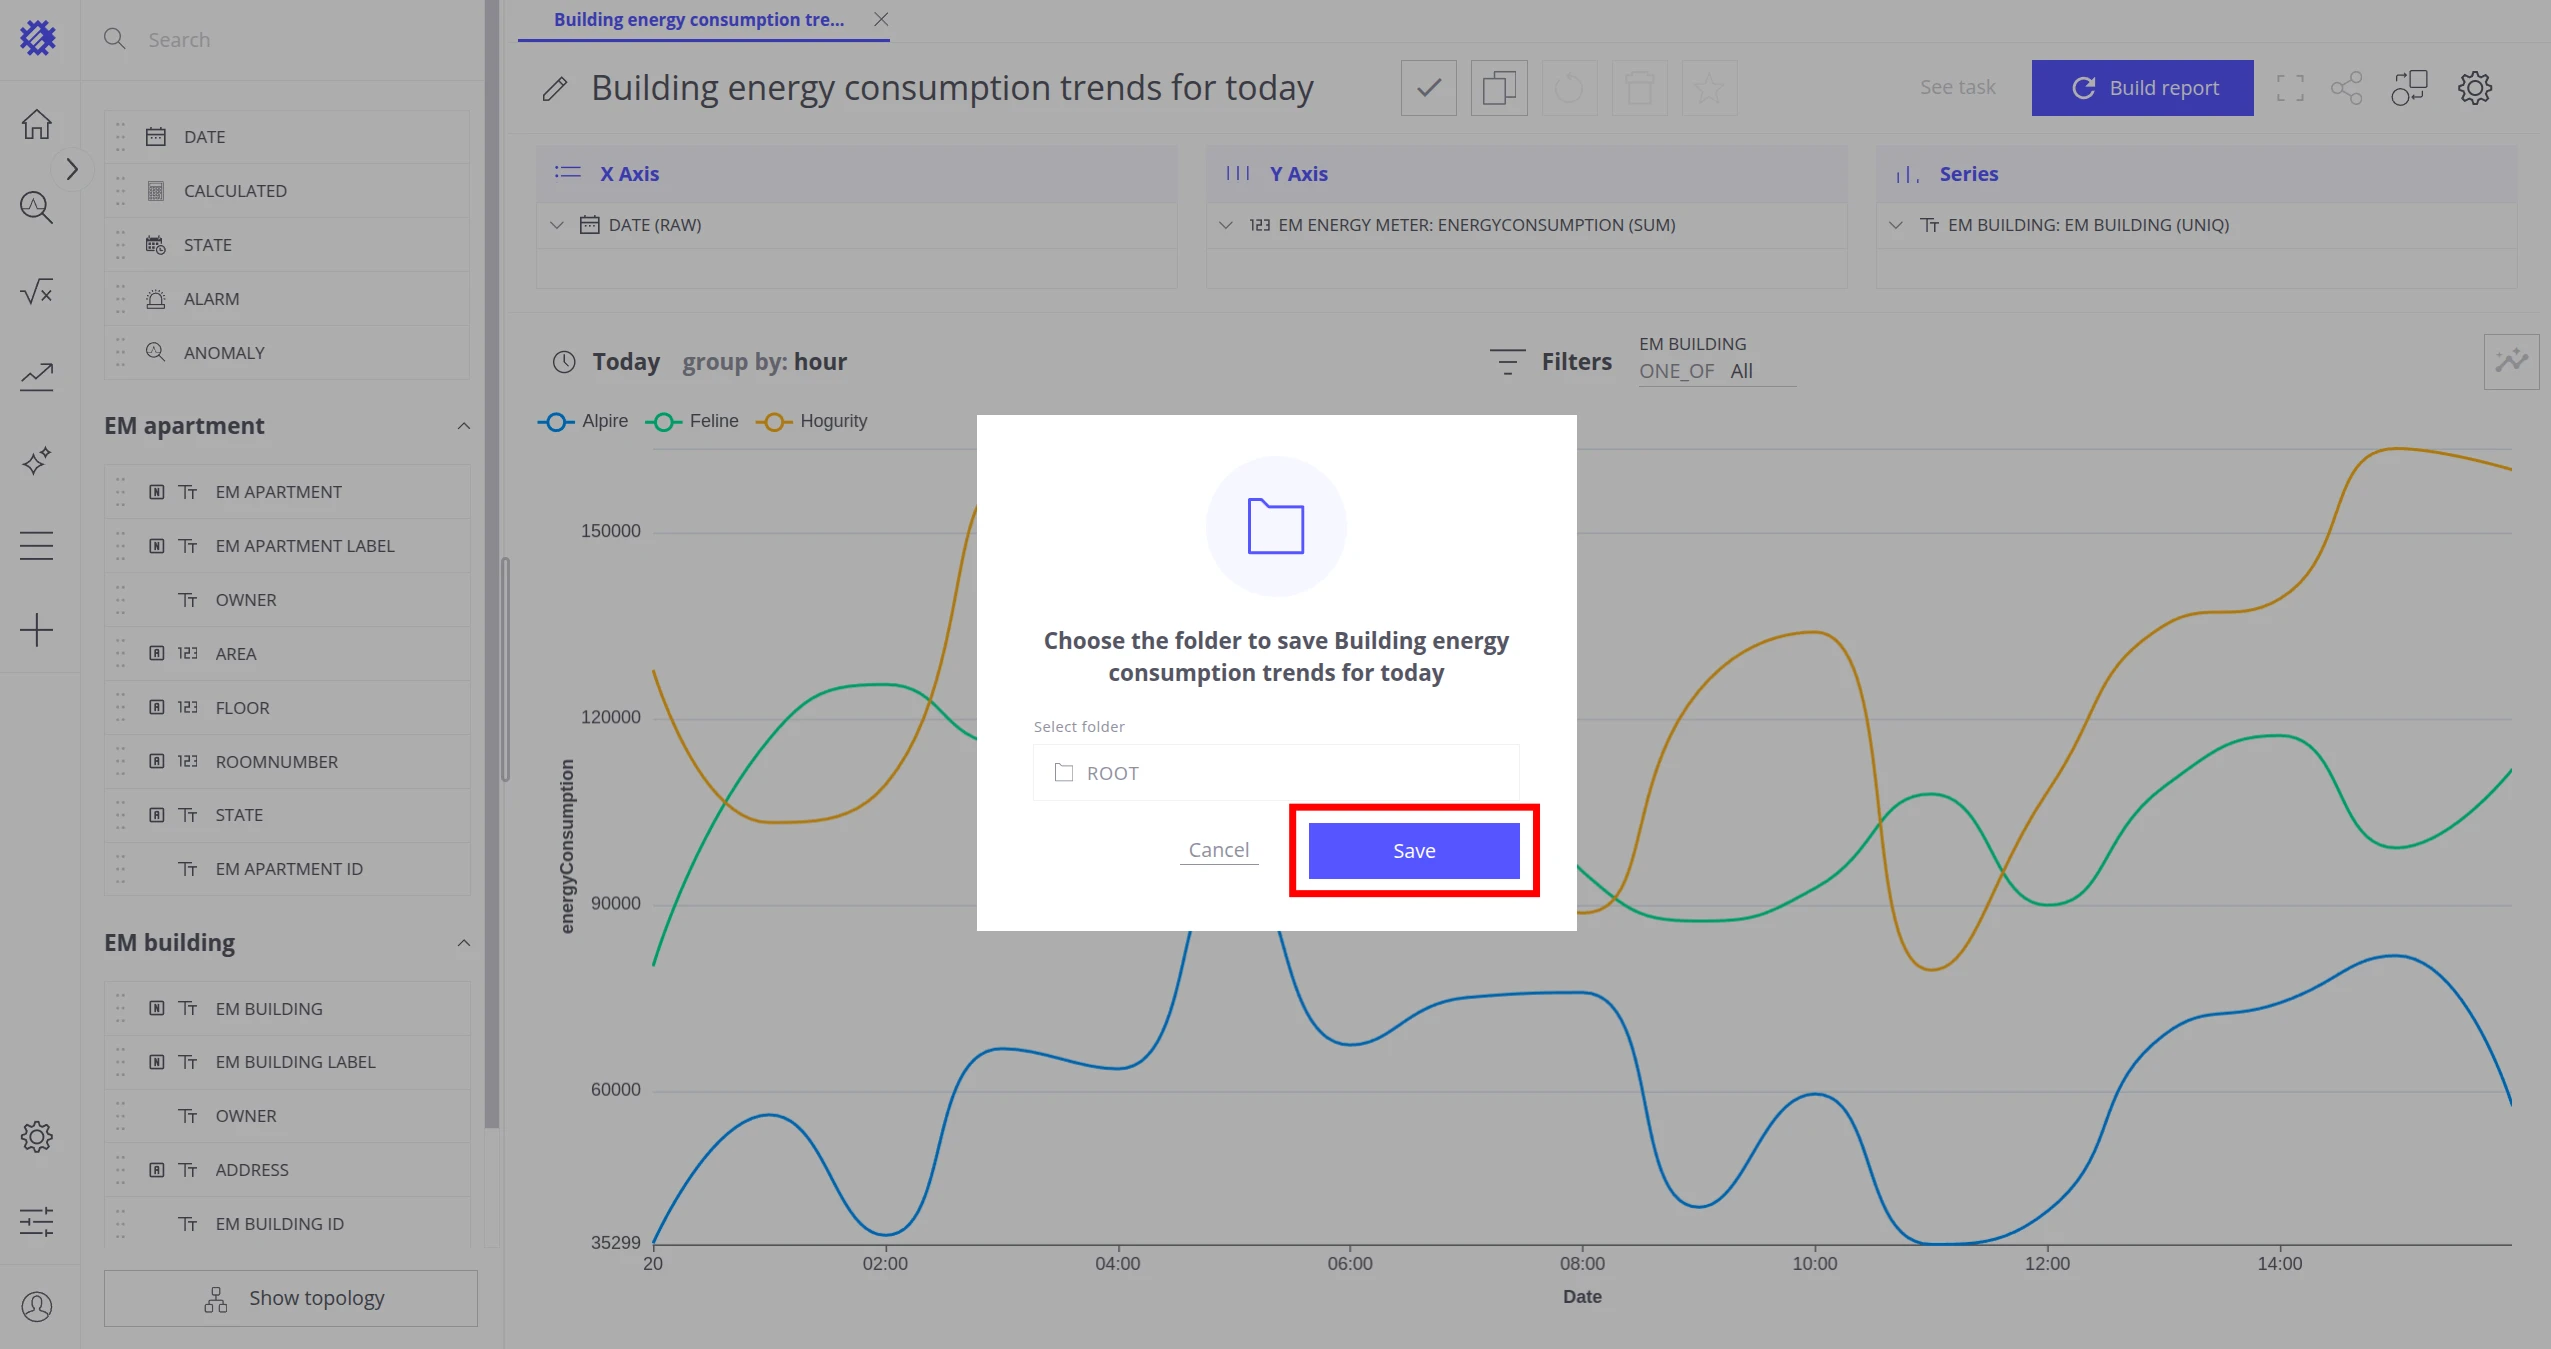
Now we have a line chart showing hourly electricity consumption per building for today, saved and ready to embed in a ThingsBoard dashboard.
Read more in Visualizations Overview.
Step 4. Add the chart to a ThingsBoard dashboard
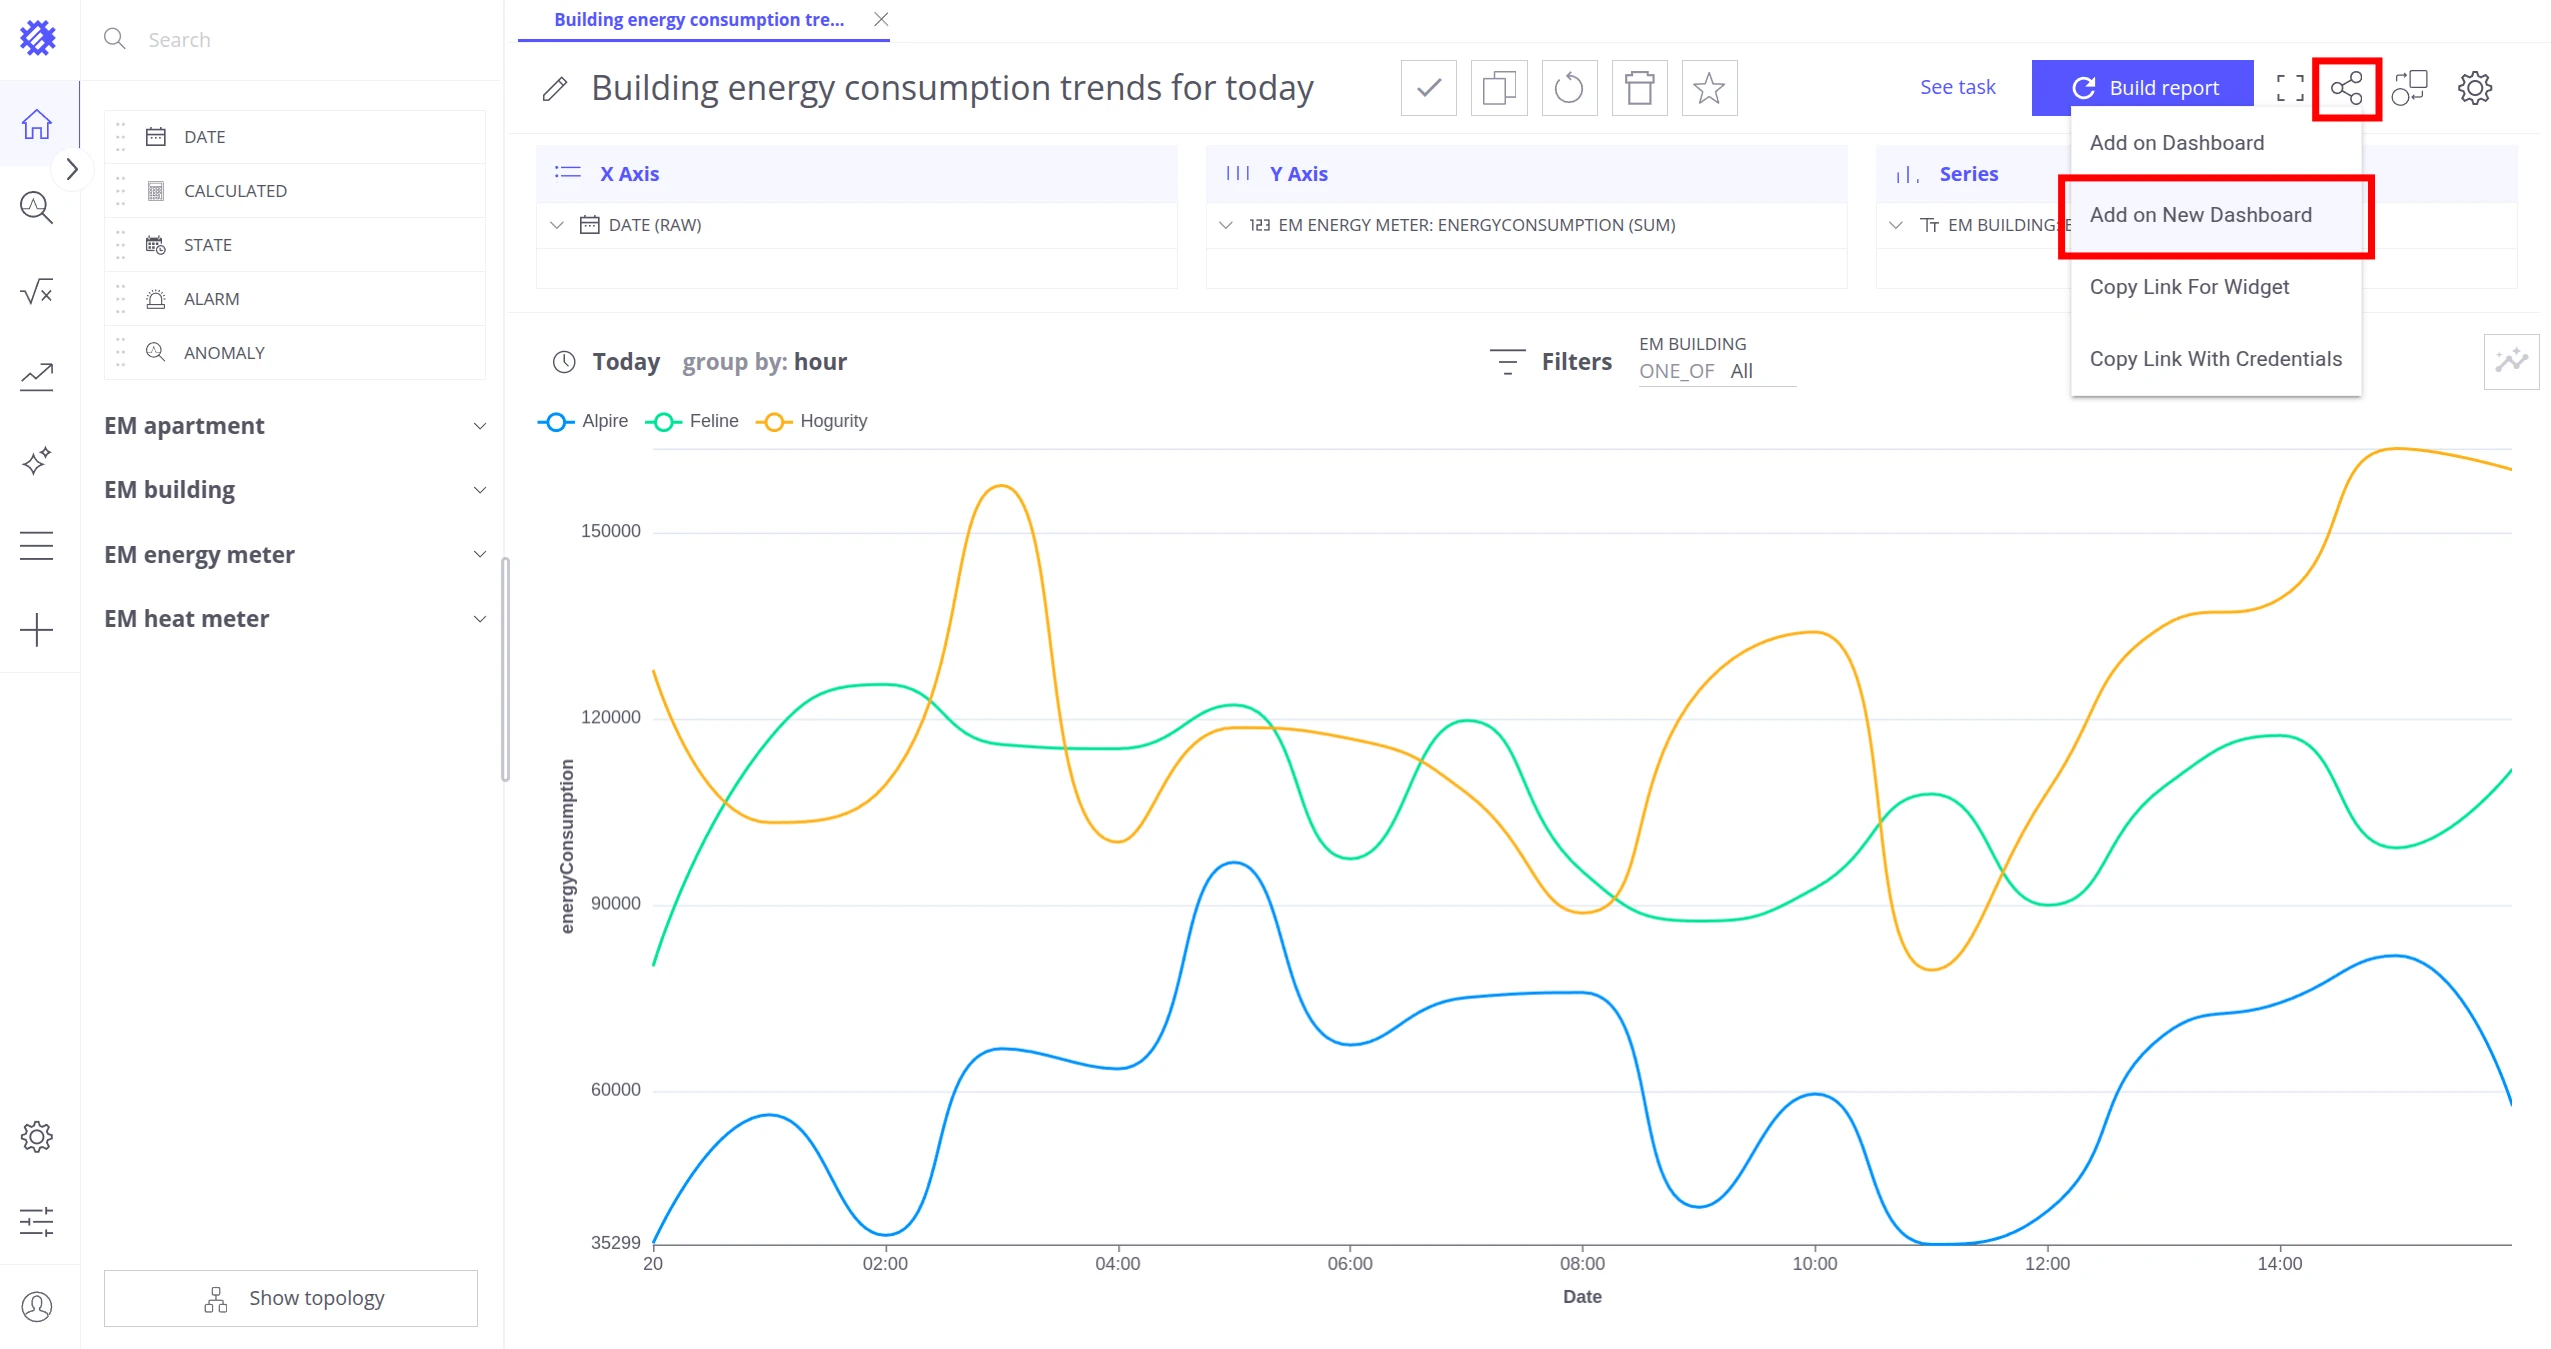
Section titled “Step 4. Add the chart to a ThingsBoard dashboard”-
Click Share to ThingsBoard and choose Add on New Dashboard.
-
Set the dashboard name to
Energy consumption; leave all other settings as default. Click Add. -
Open the ThingsBoard platform — you will find a new dashboard named
Energy consumptionwith the Trendz line view embedded and a filter alias by building.
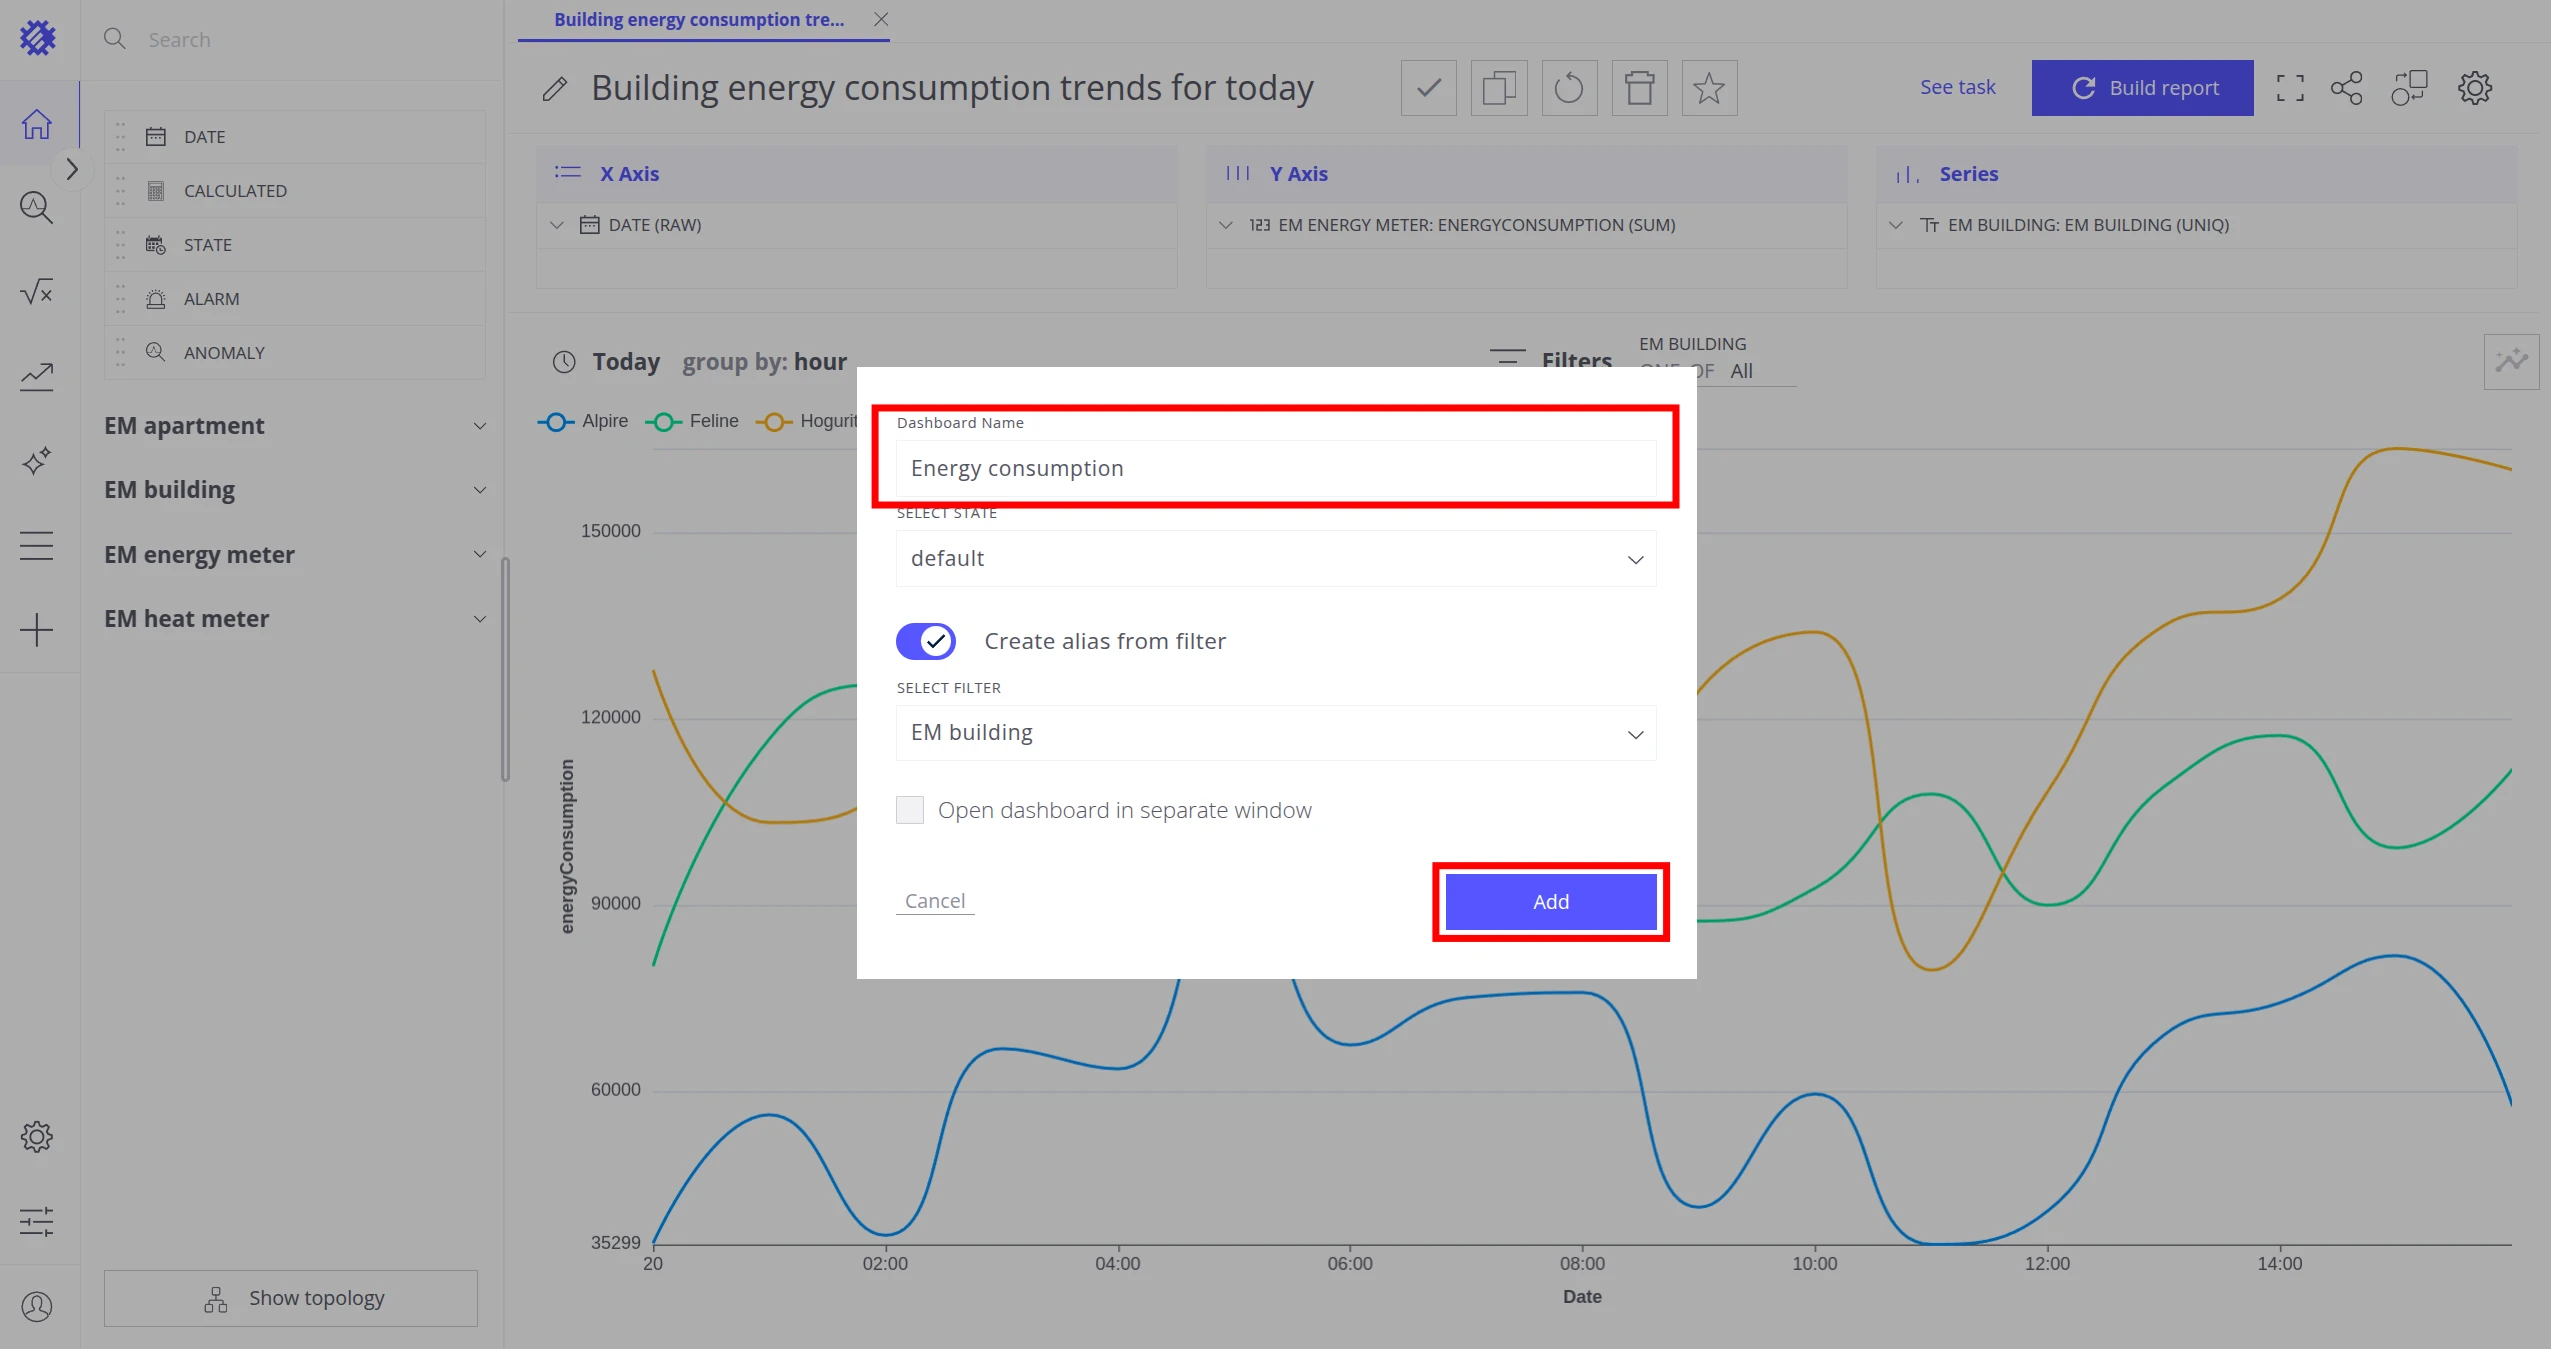
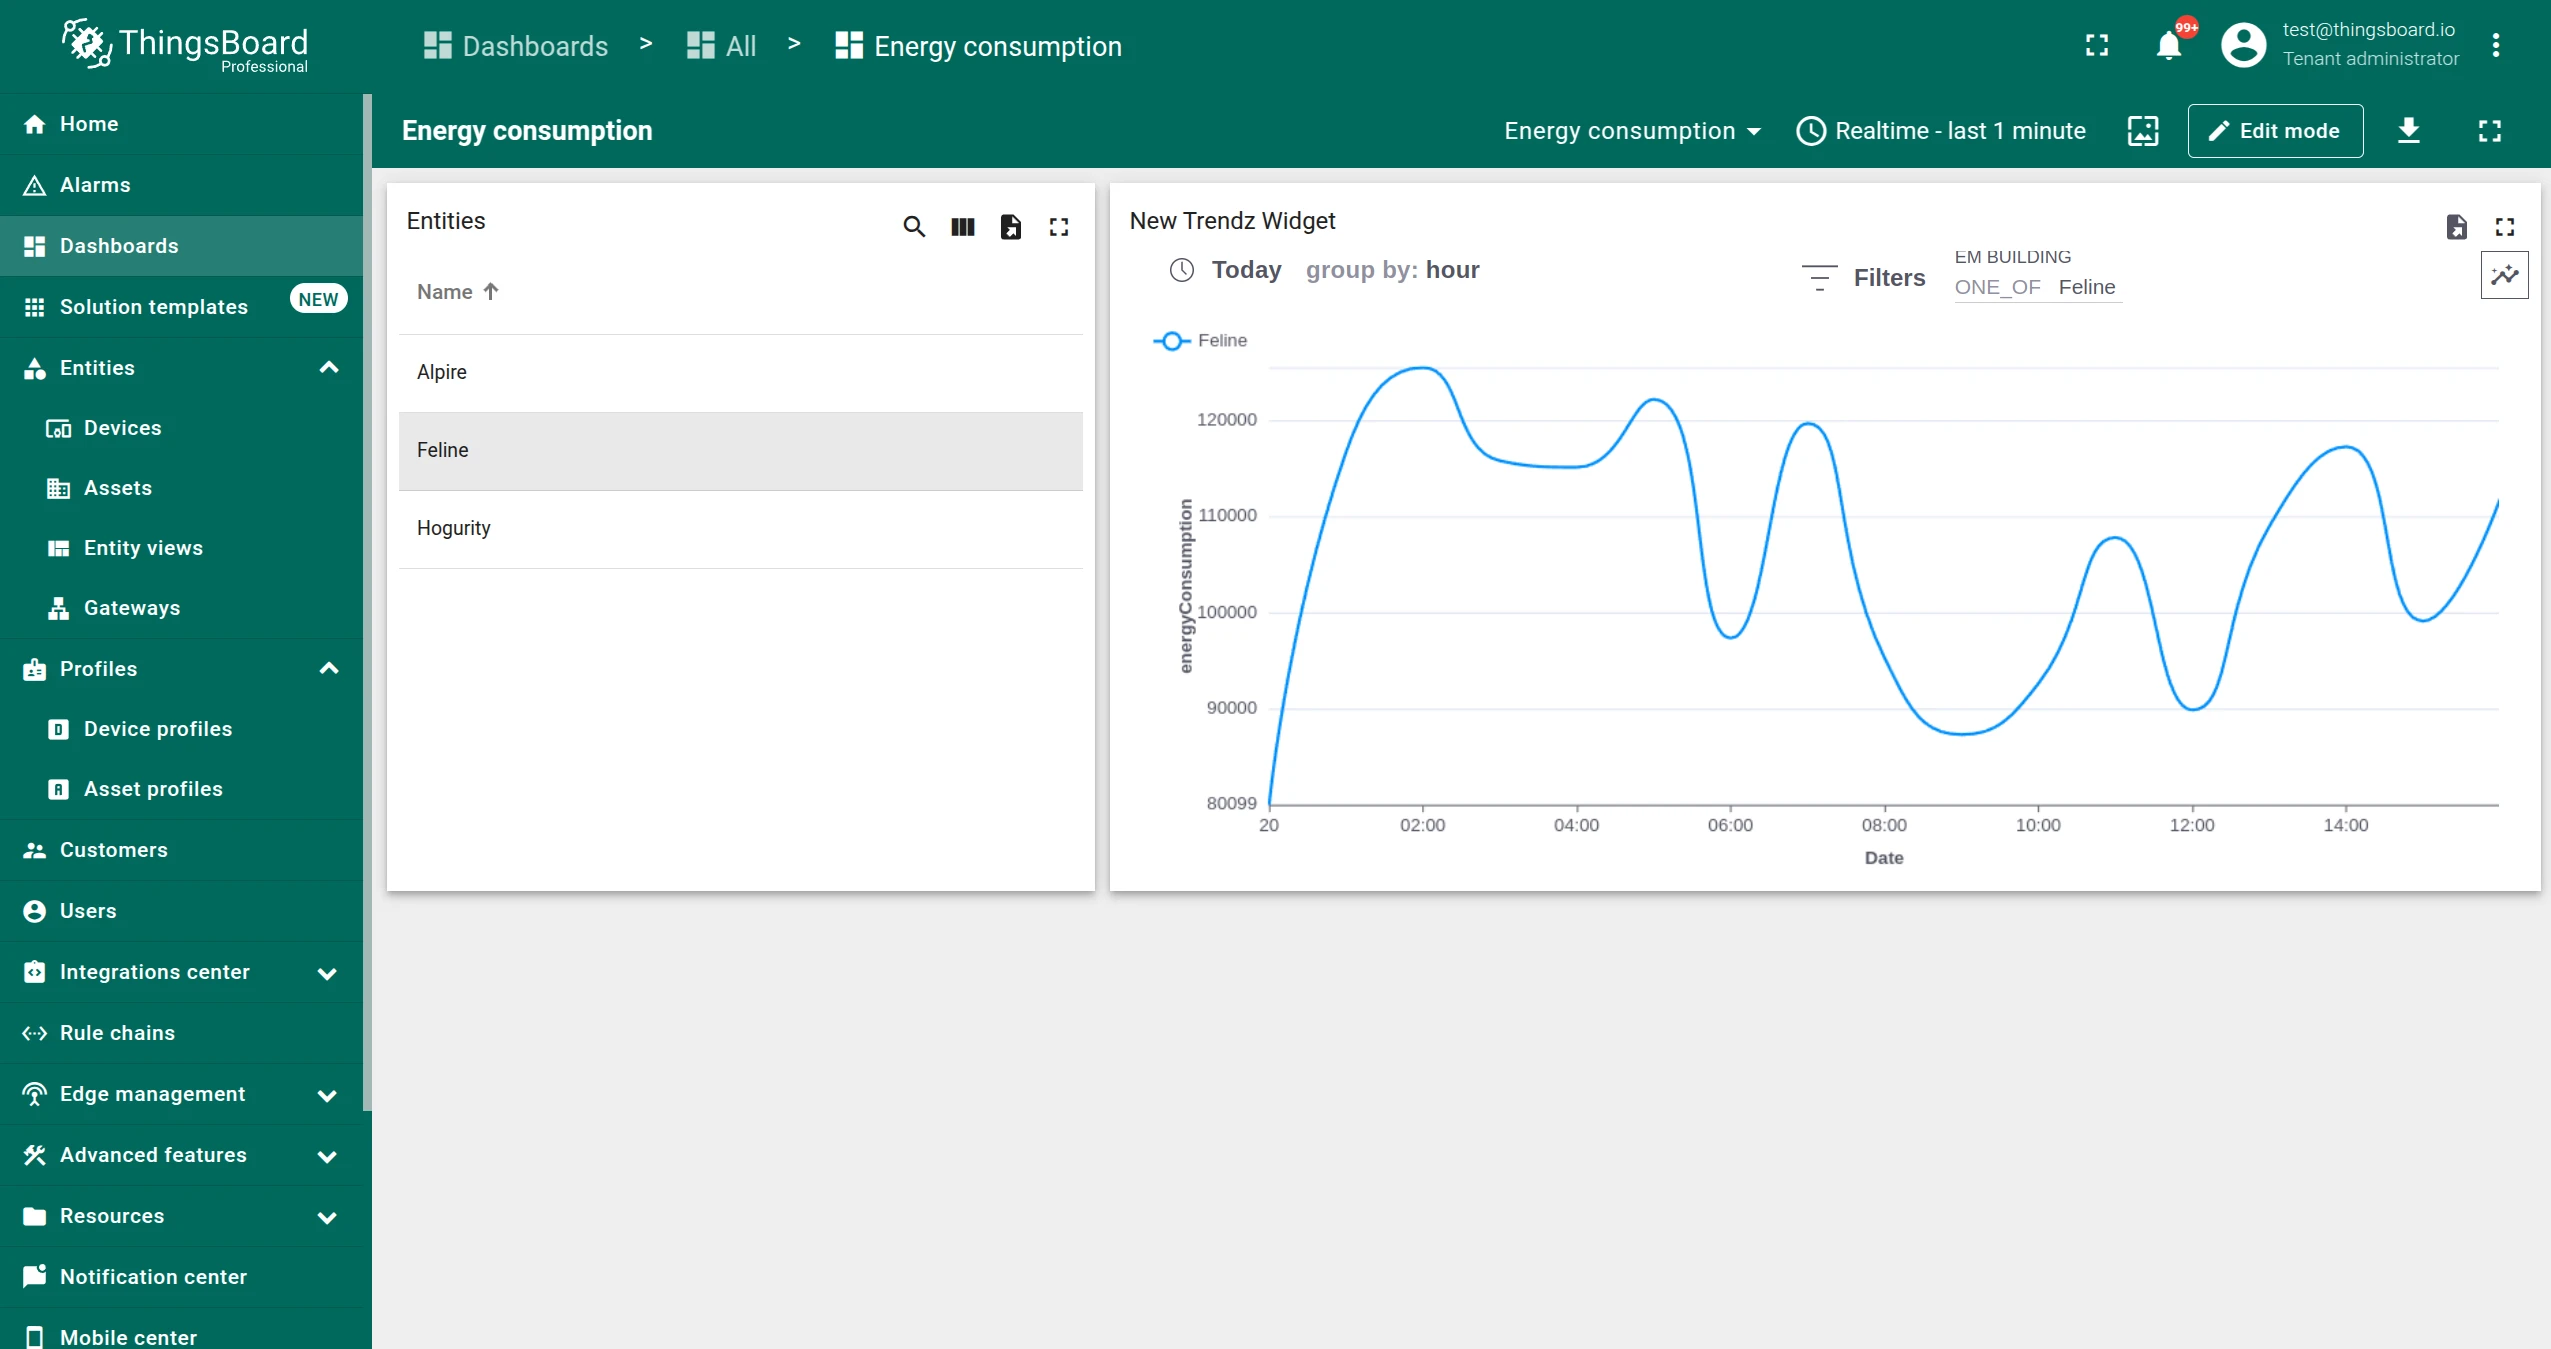
Now we have the line chart embedded in a ThingsBoard dashboard with a building filter alias applied automatically.
Read more in Share Views.
Step 5. Calculate new metrics
Section titled “Step 5. Calculate new metrics”We will create a calculated field that computes electricity and heat consumption per square meter for each apartment, then use it in a table view.
Create a calculated field
Section titled “Create a calculated field”-
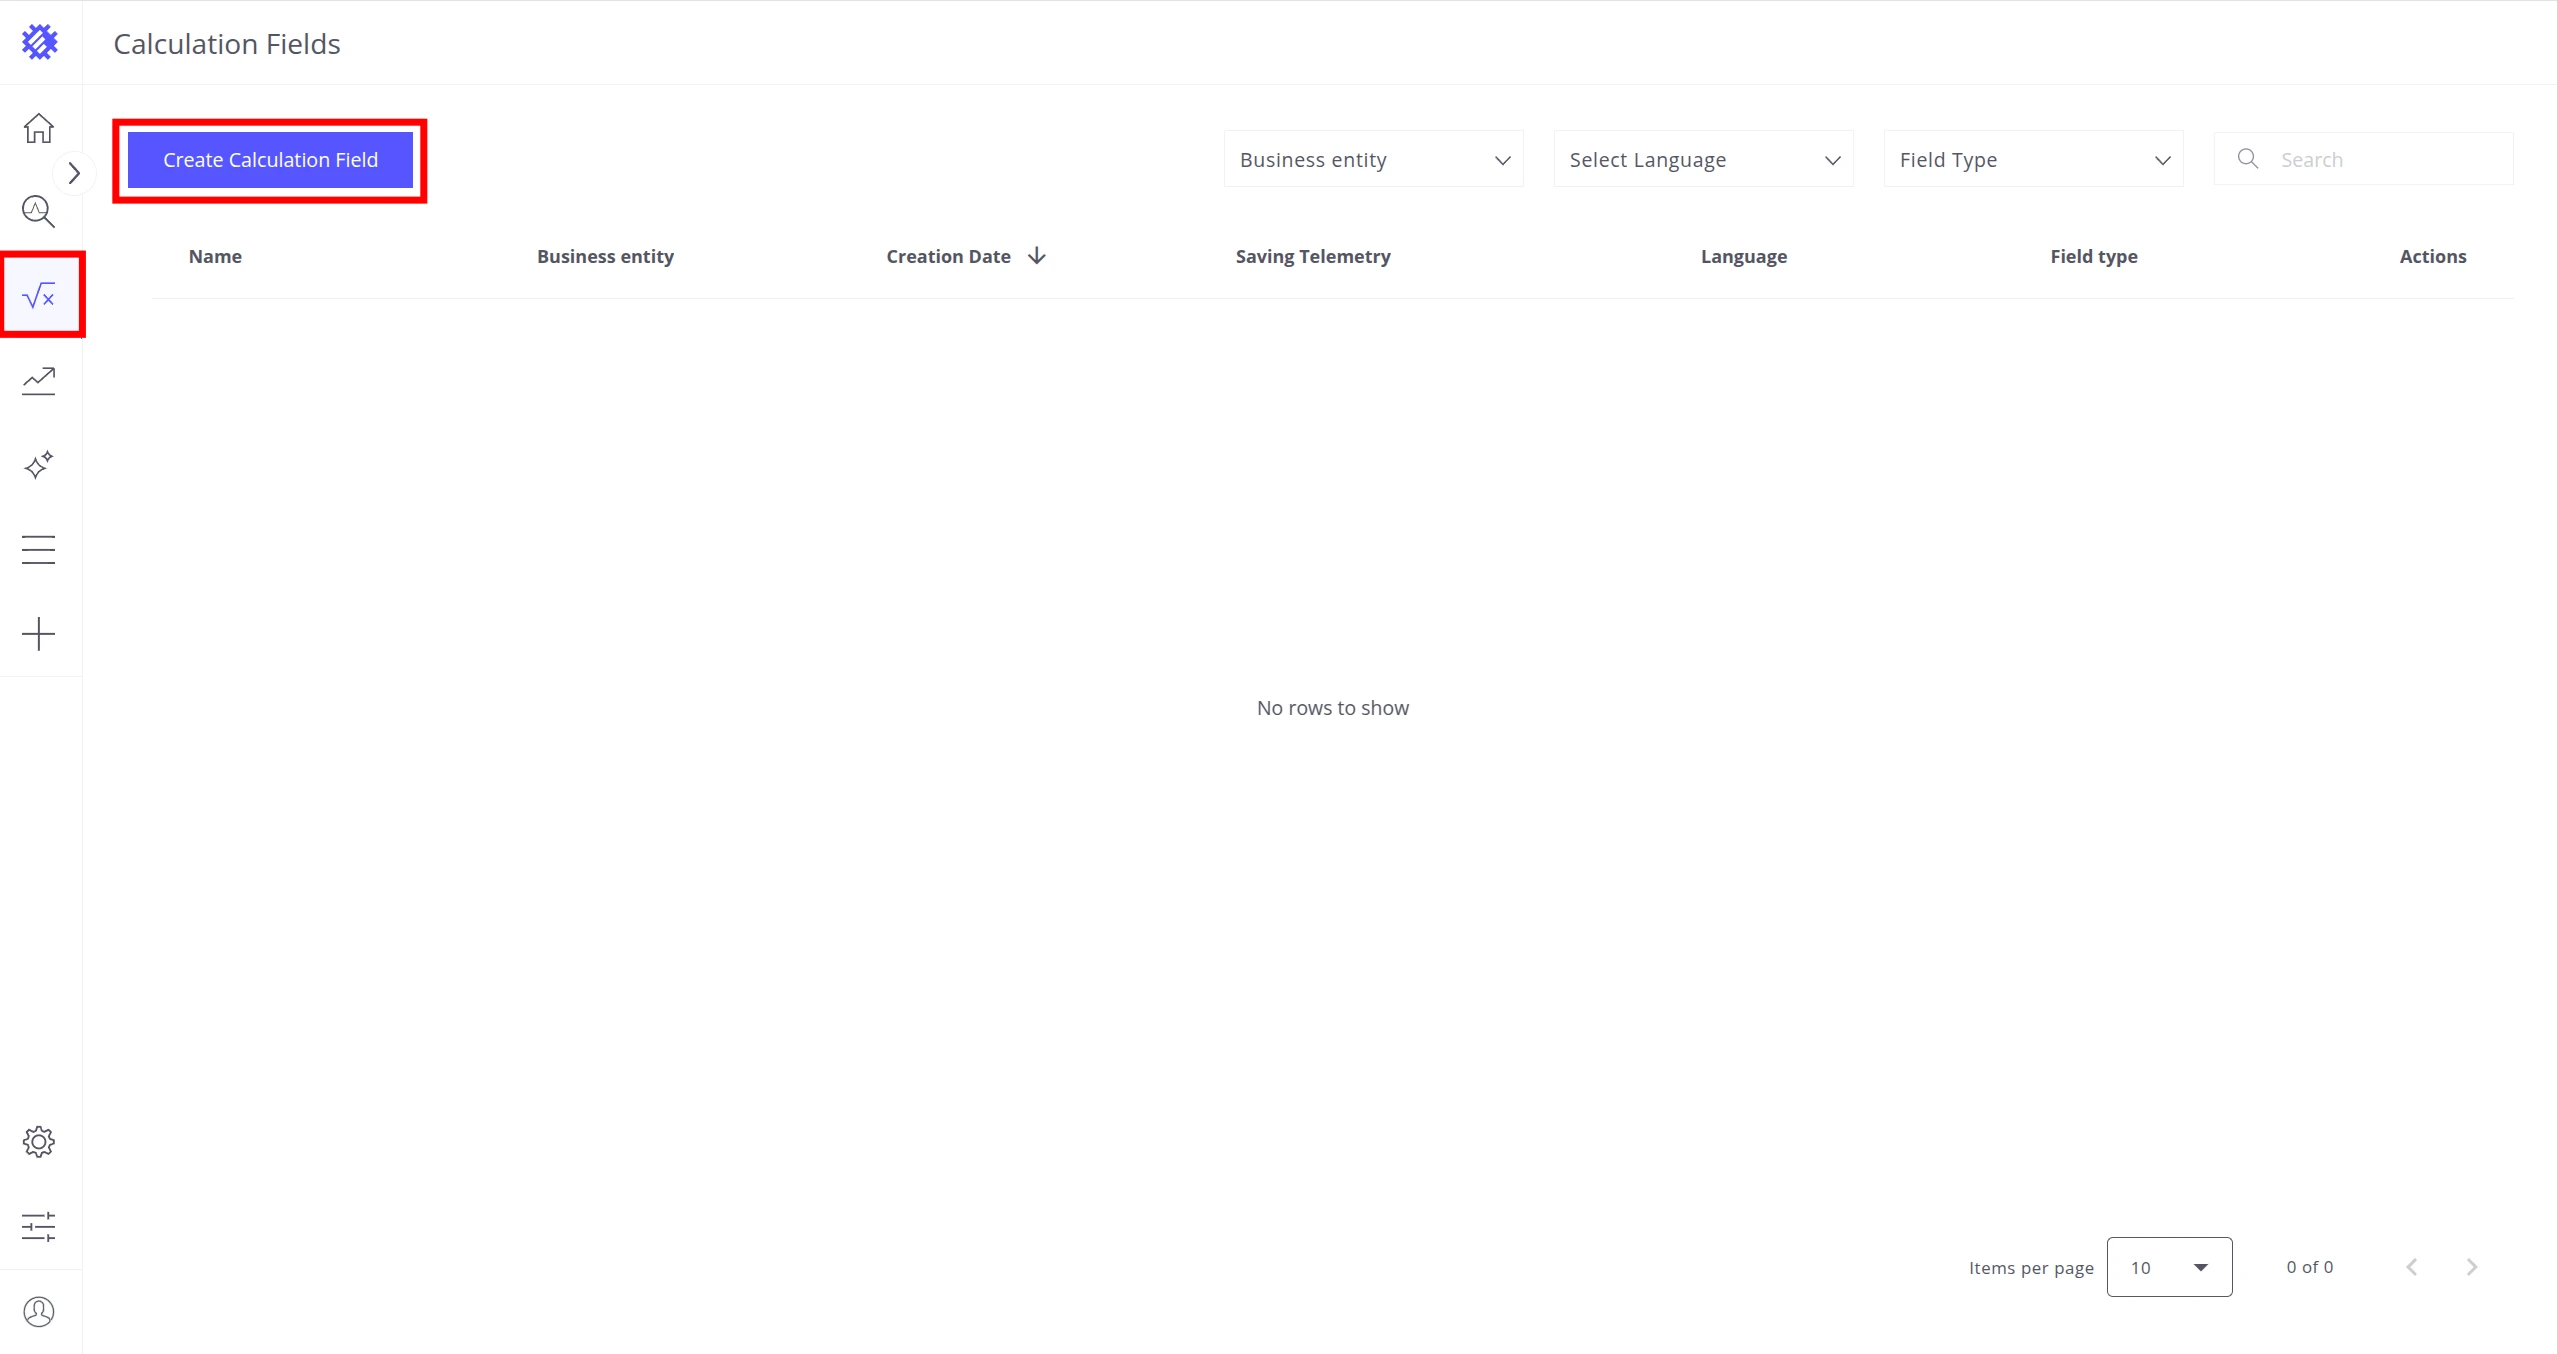
Click the calculator icon on the left panel to open the Calculated Fields page.
-
Click Create Calculated Field.
-
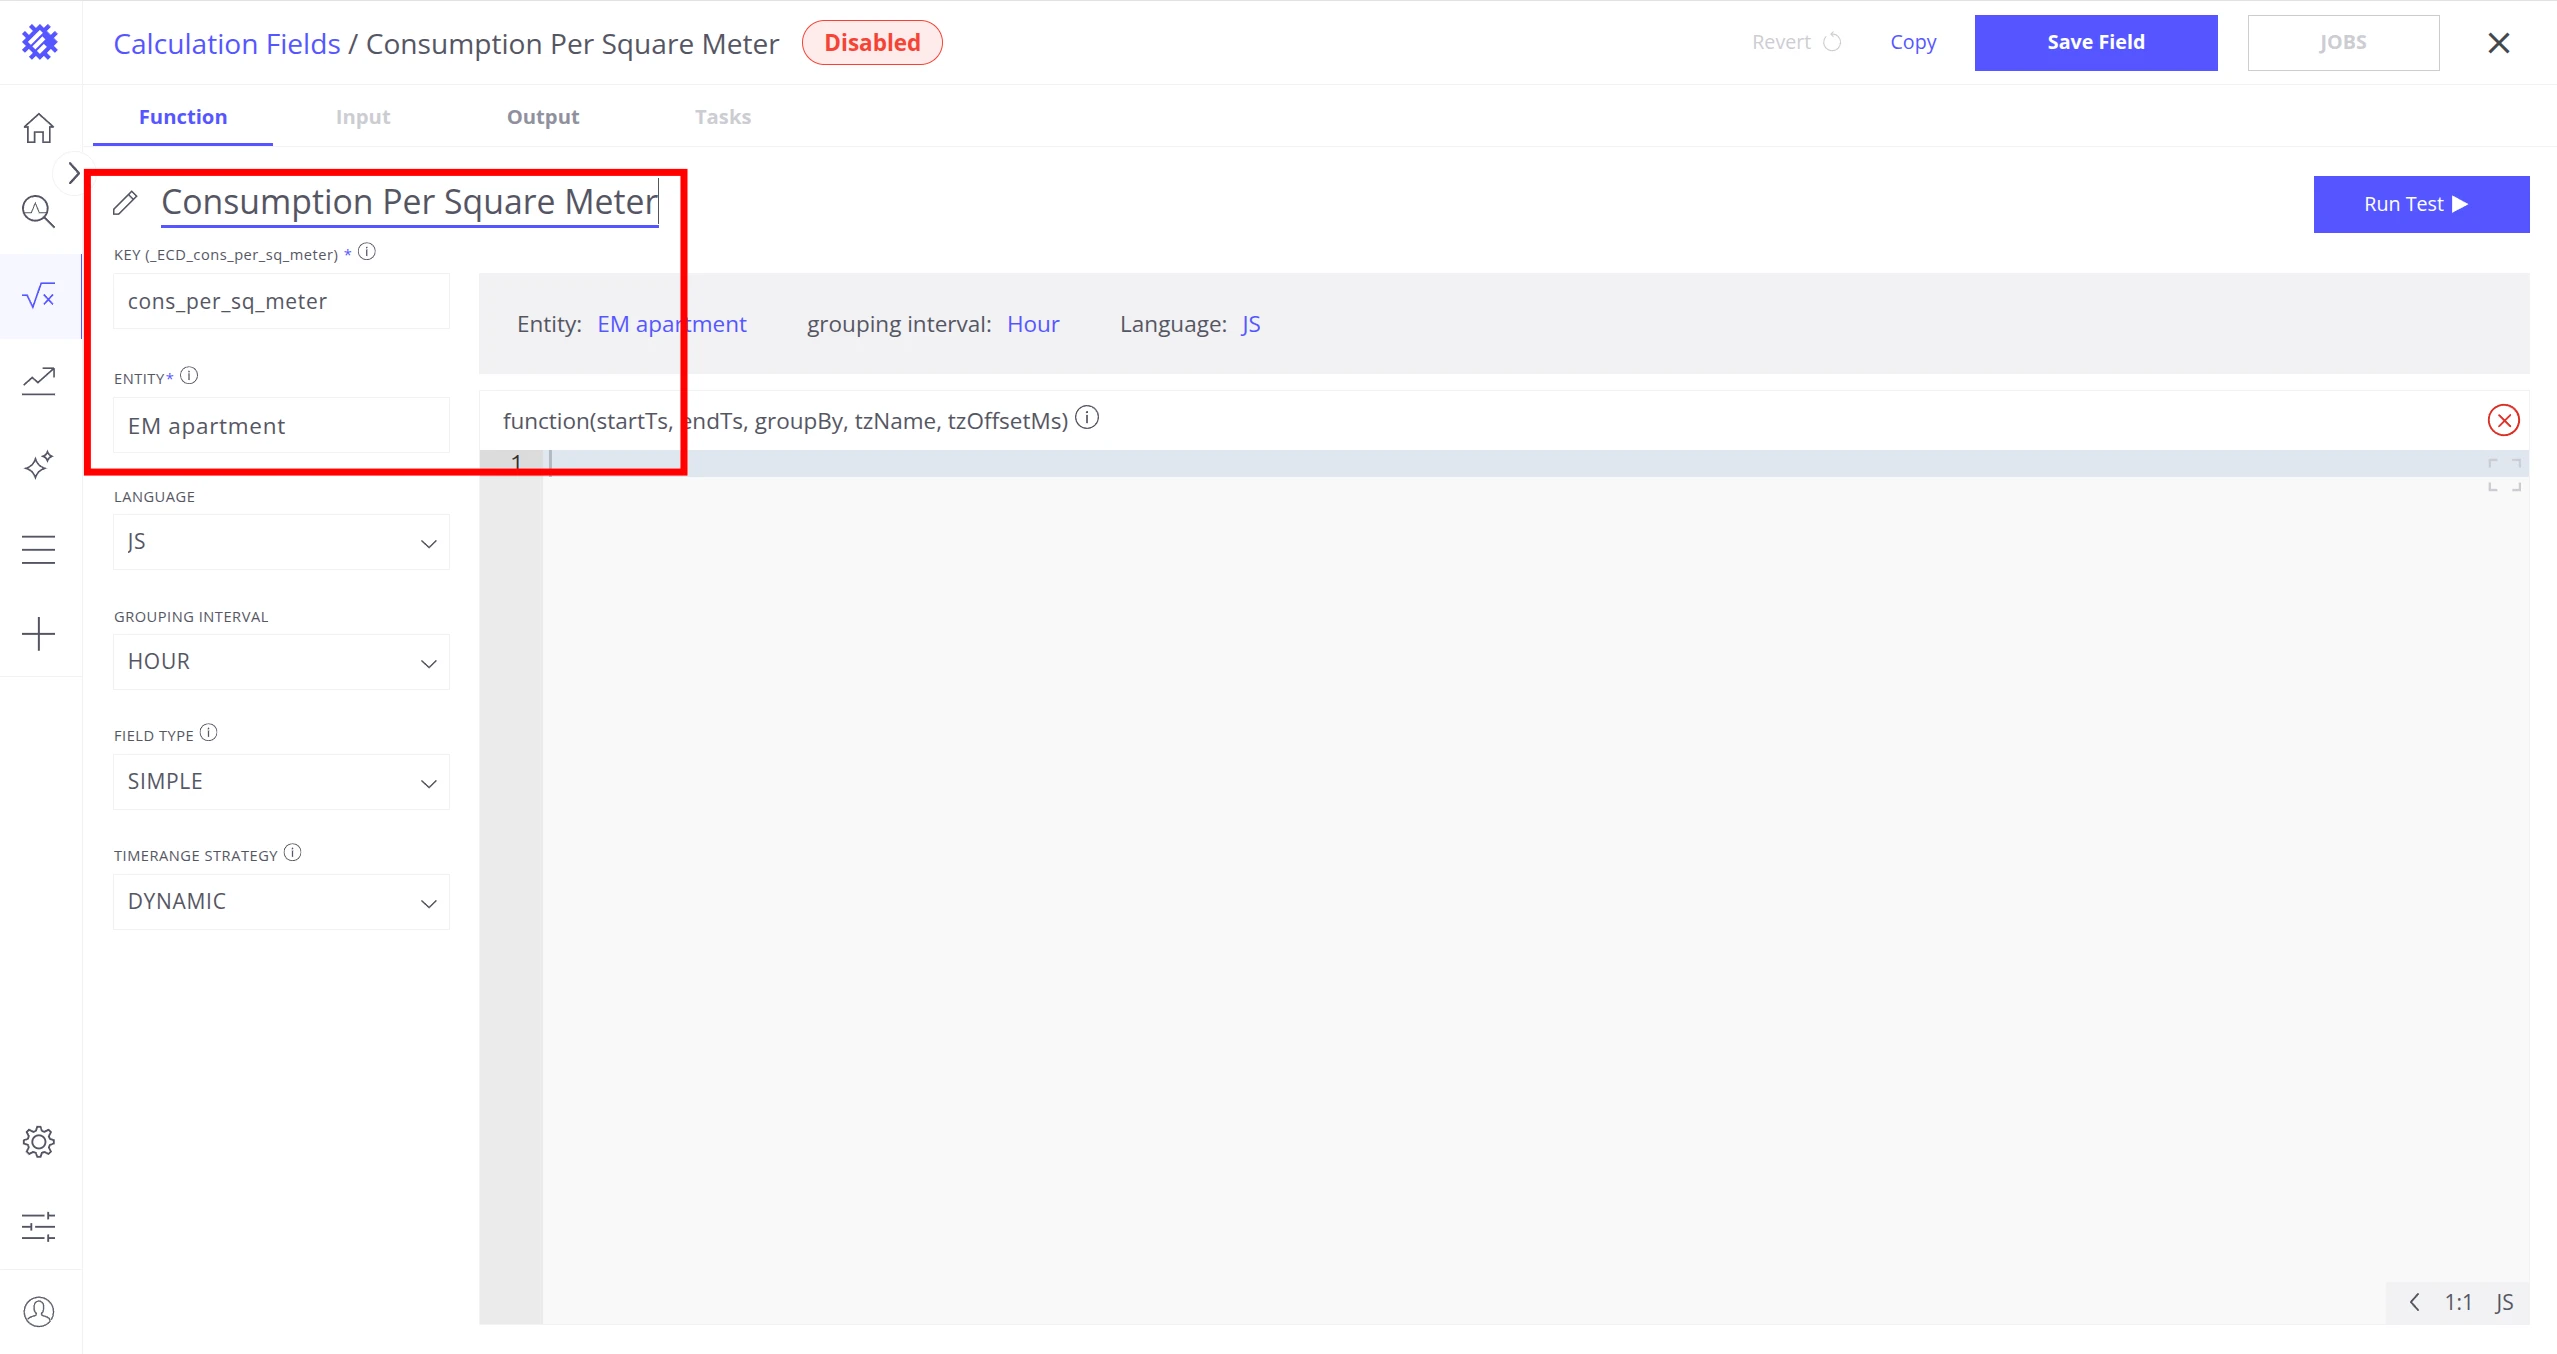
Fill in the fields:
- Name:
Consumption Per Square Meter - Key:
cons_per_sq_meter - Entity:
EM apartment
- Name:
-
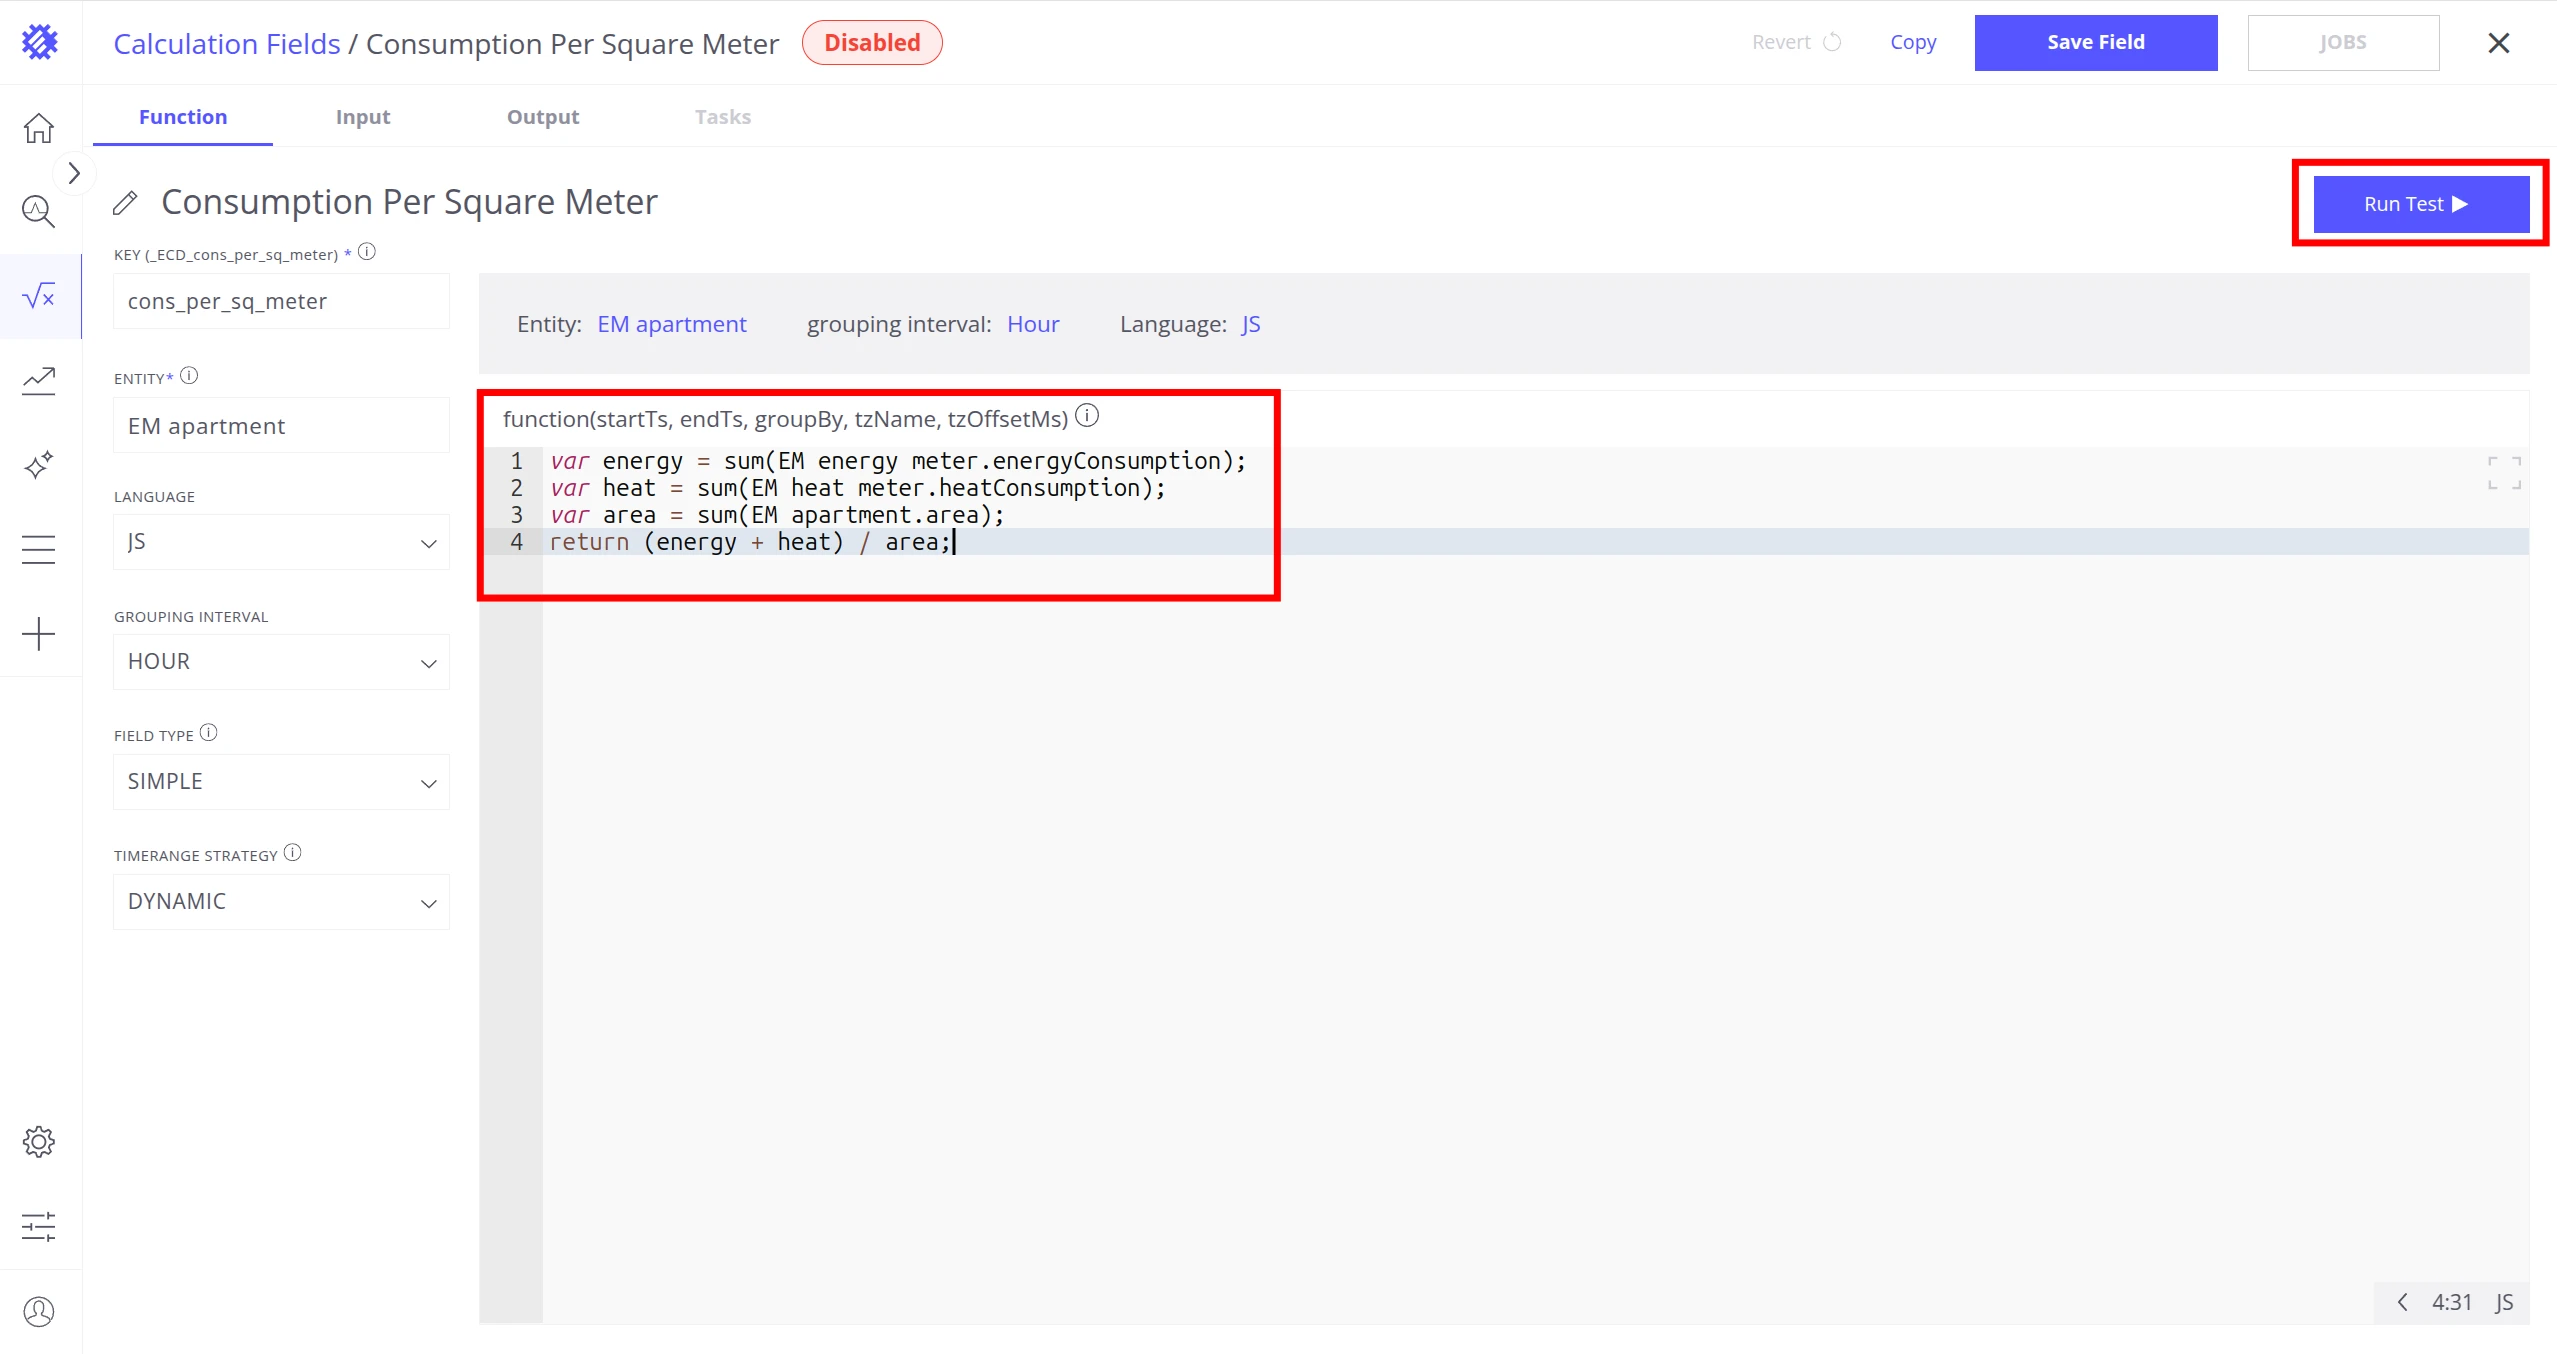
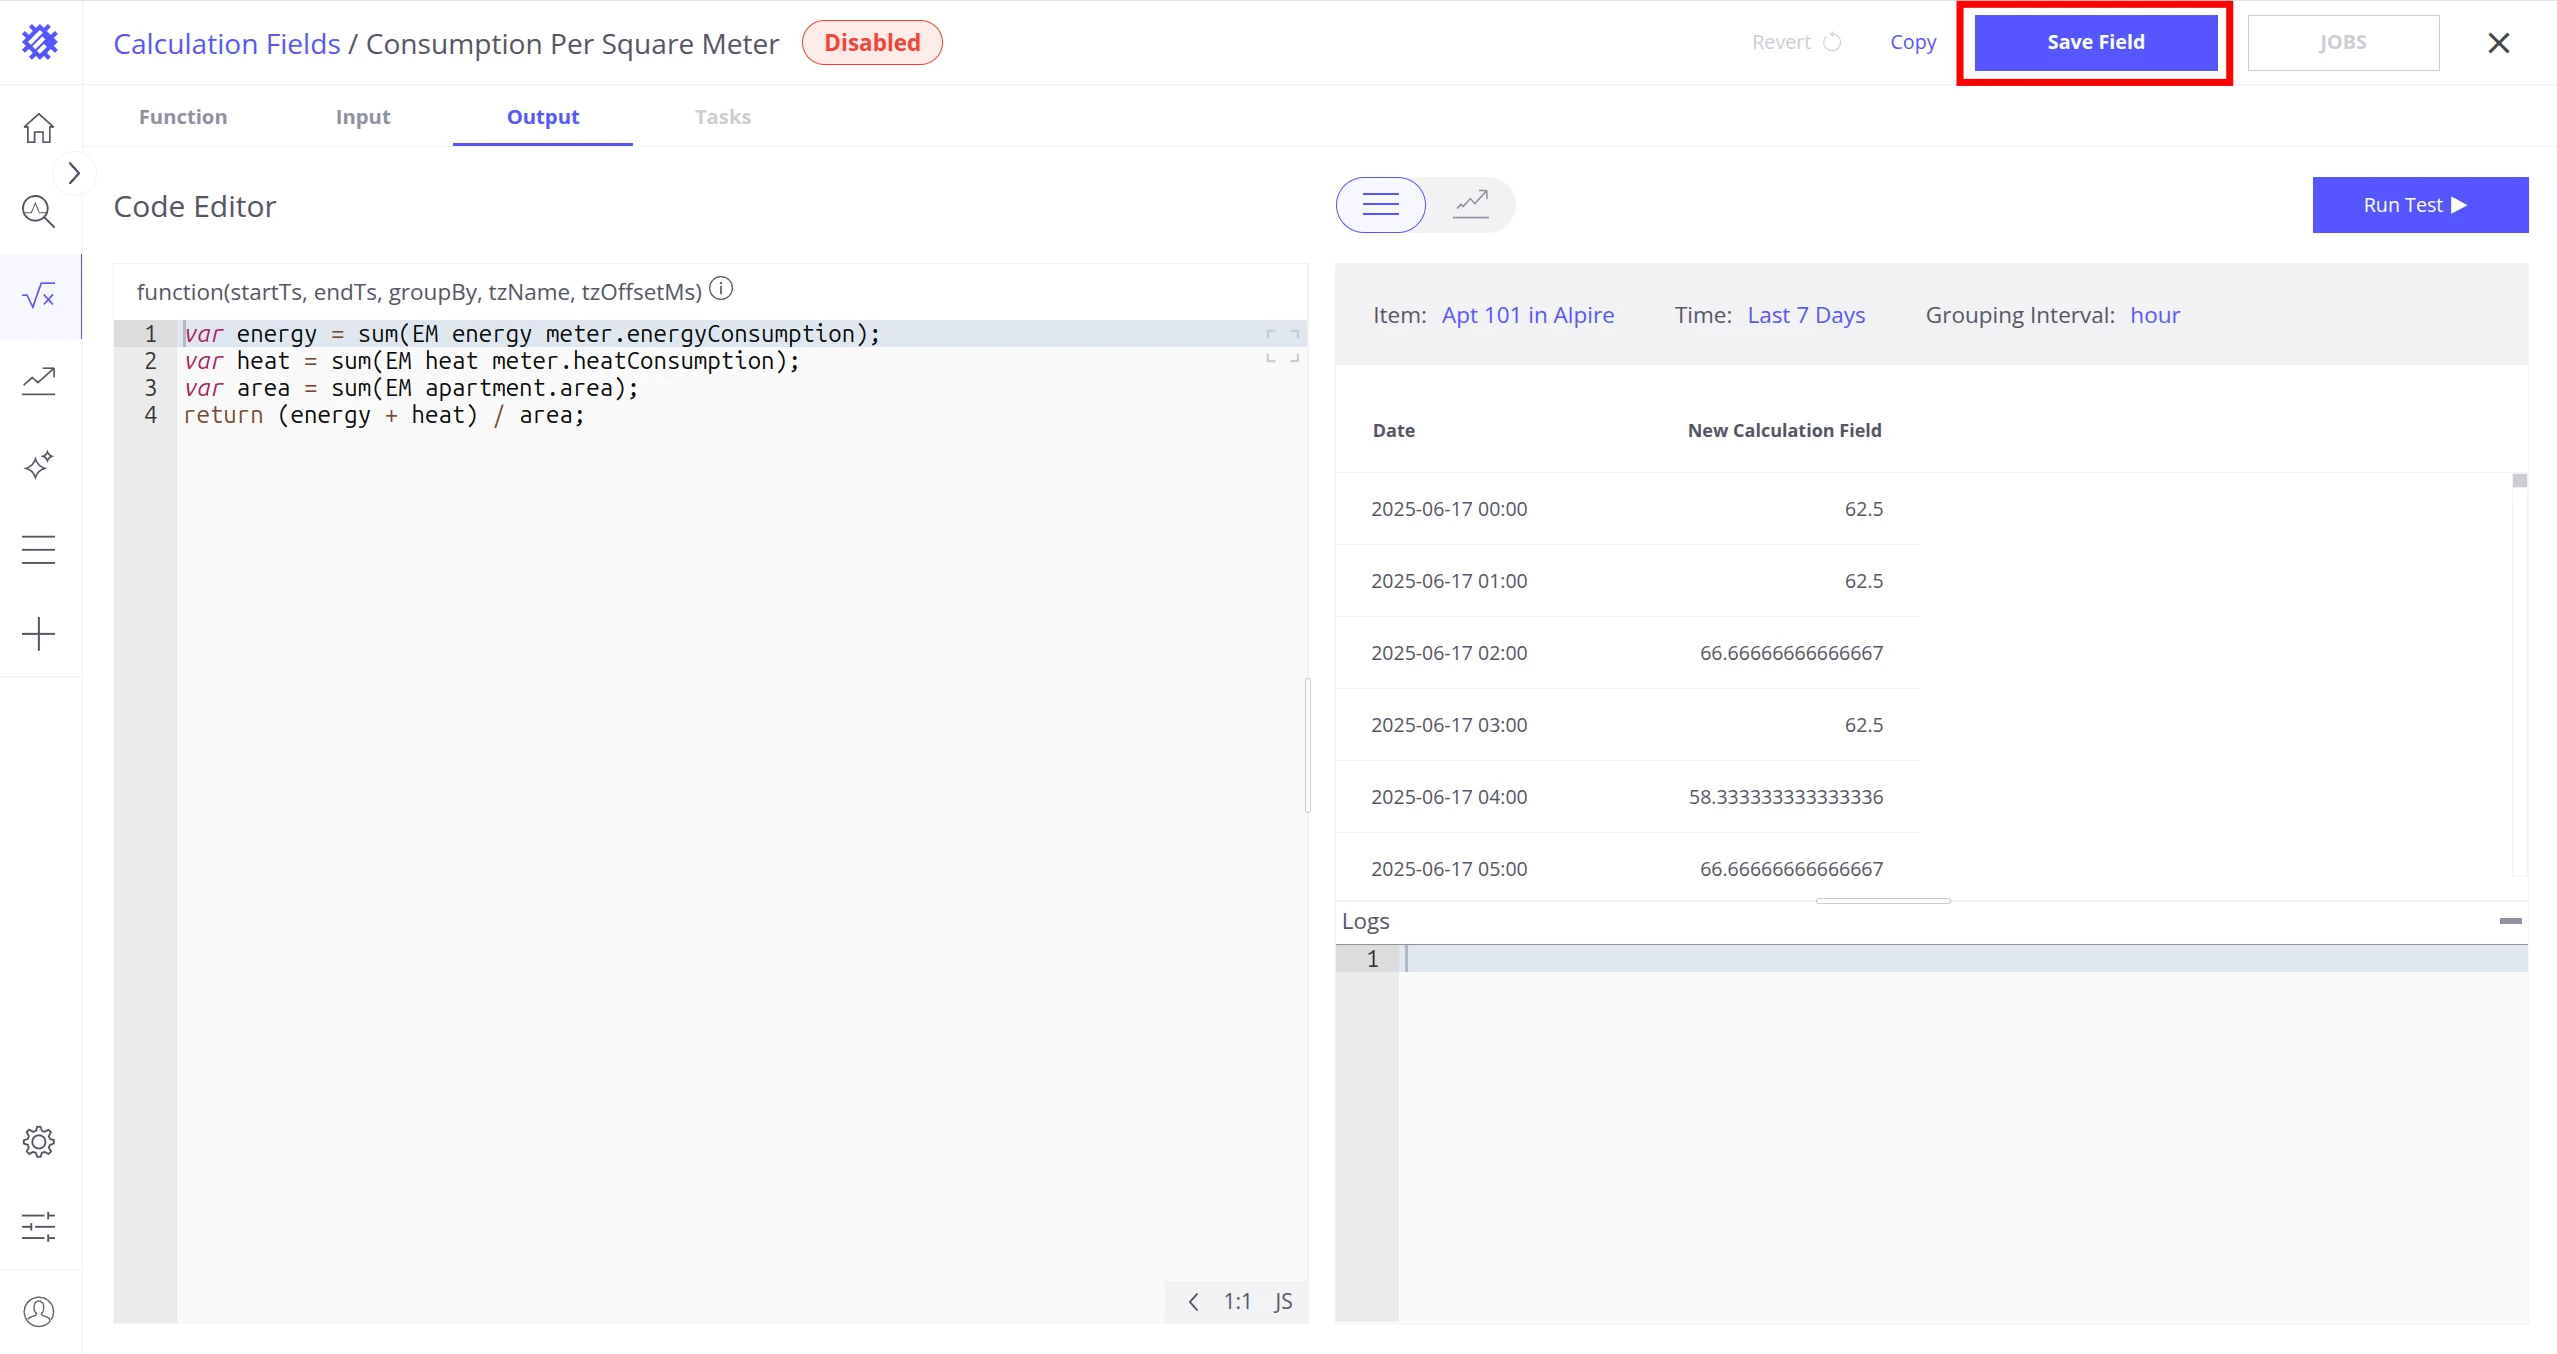
Paste the following code into the editor:
var energy = sum(EM energy meter.energyConsumption);var heat = sum(EM heat meter.heatConsumption);var area = sum(EM apartment.area);return (energy + heat) / area; -
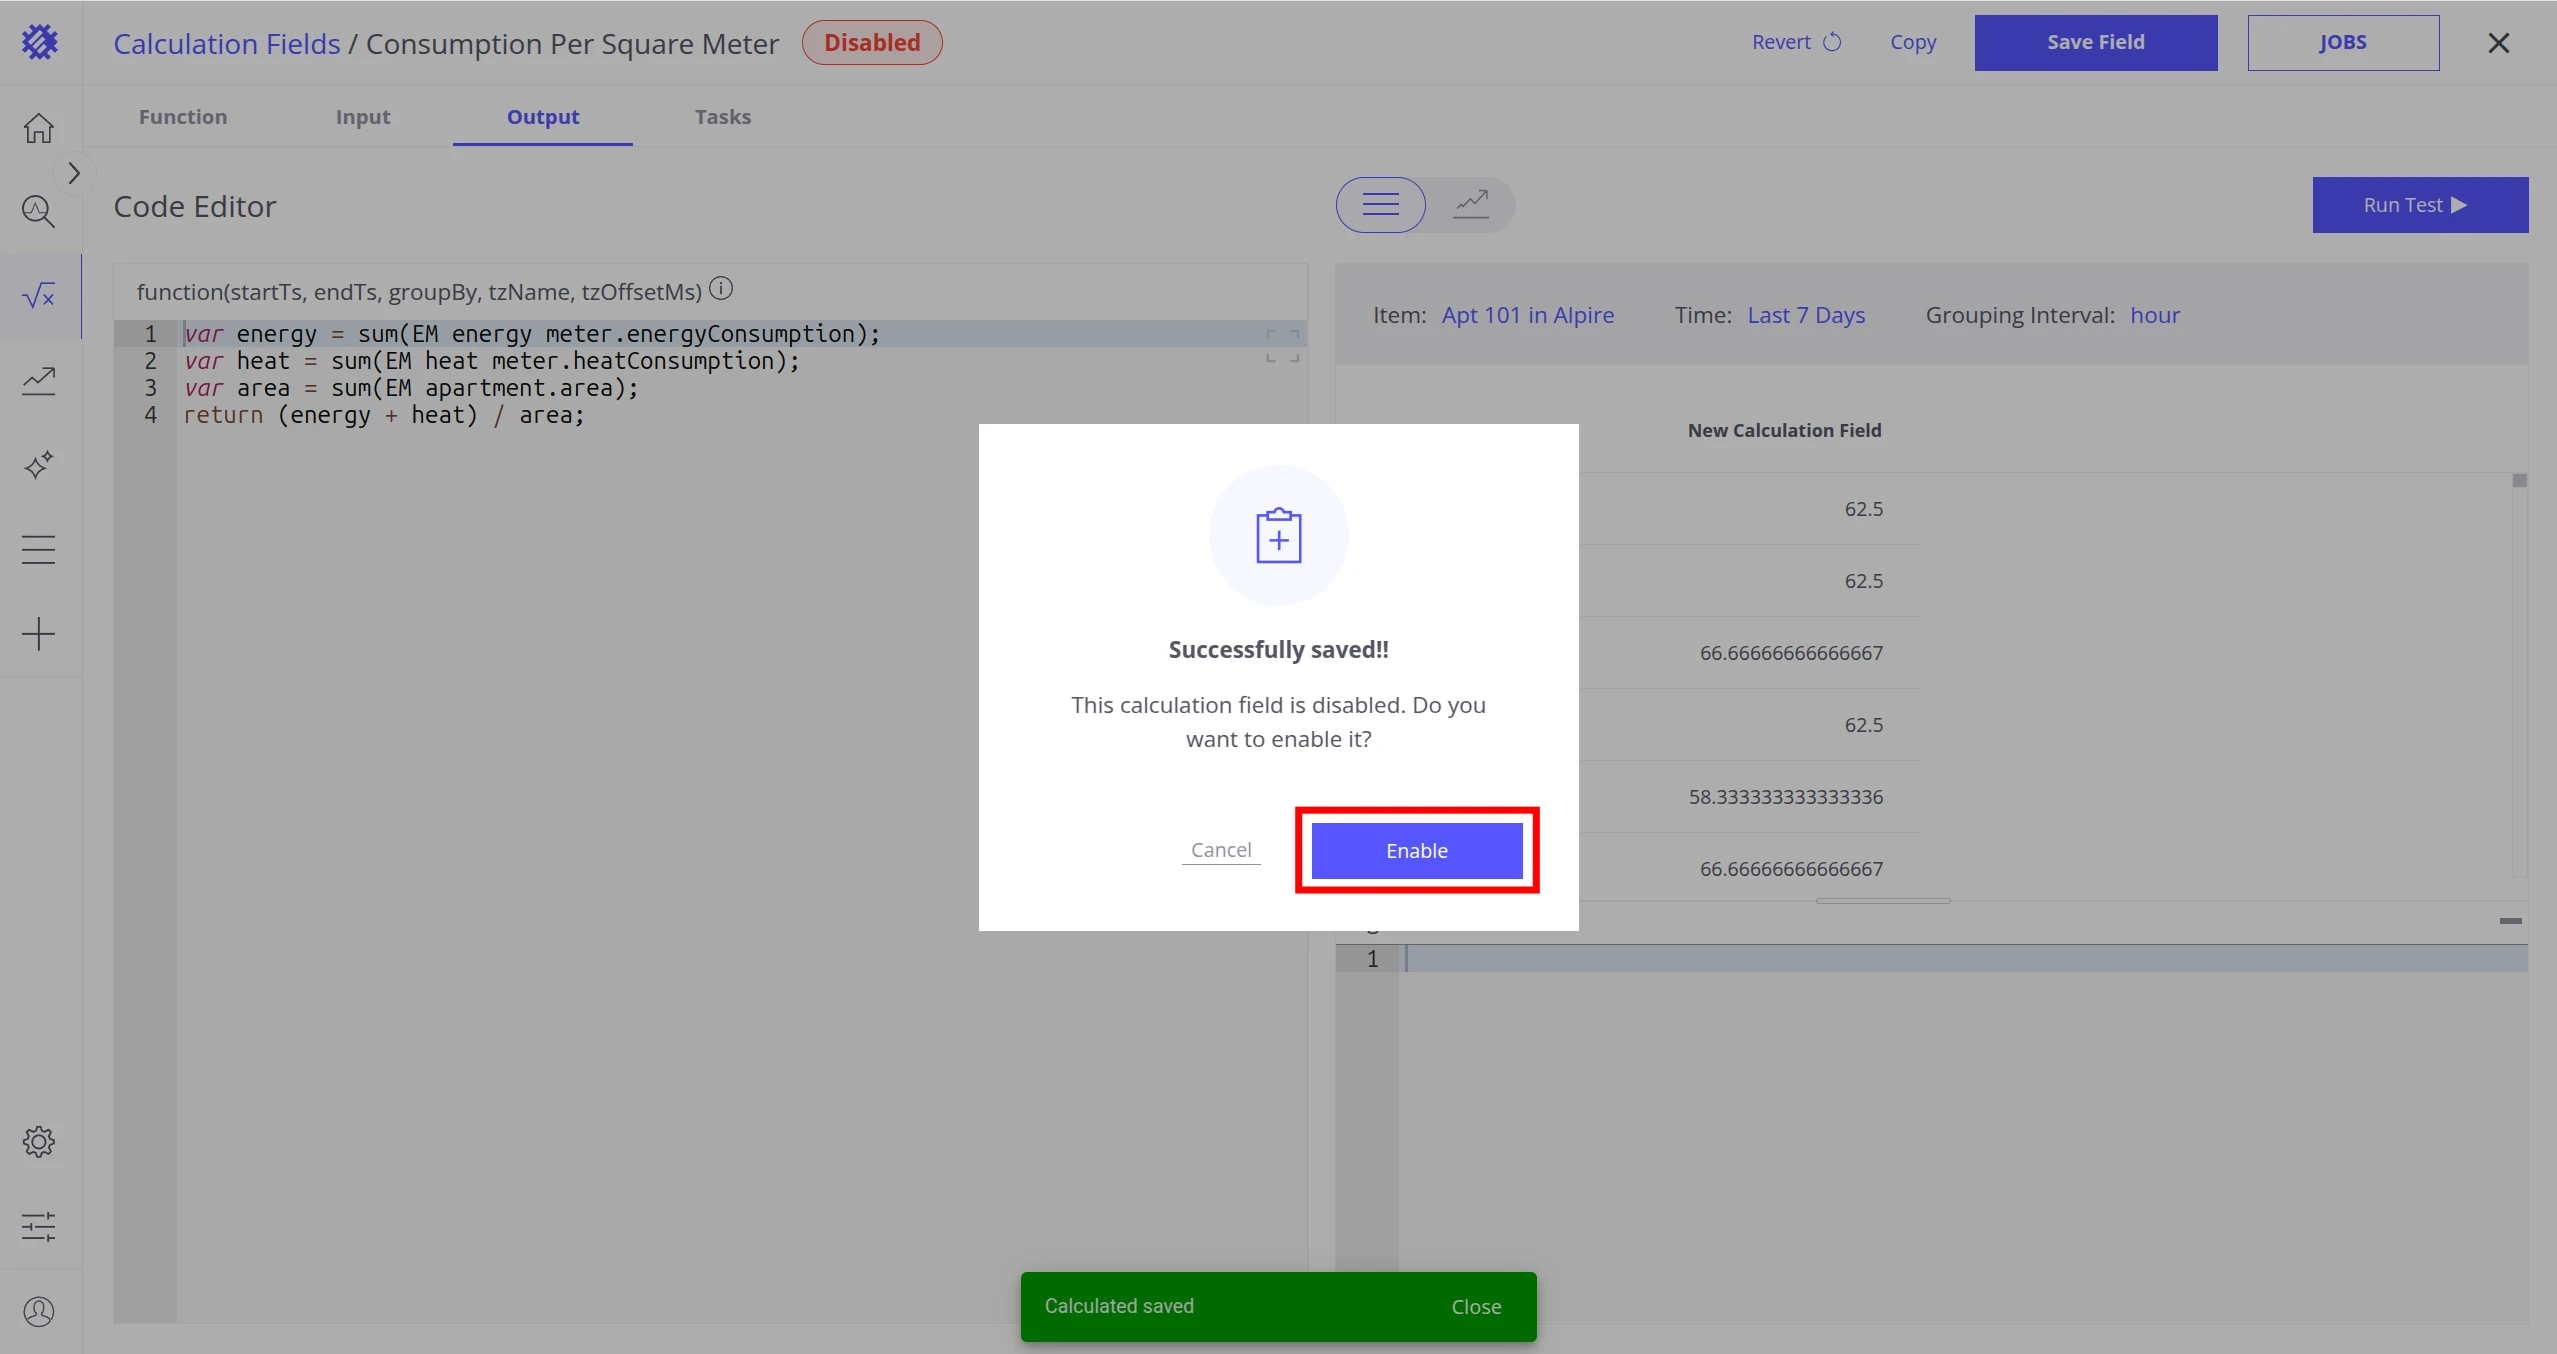
Click Run Test to validate the calculation, then click Save Field.
-
In the pop-up, click Enable.
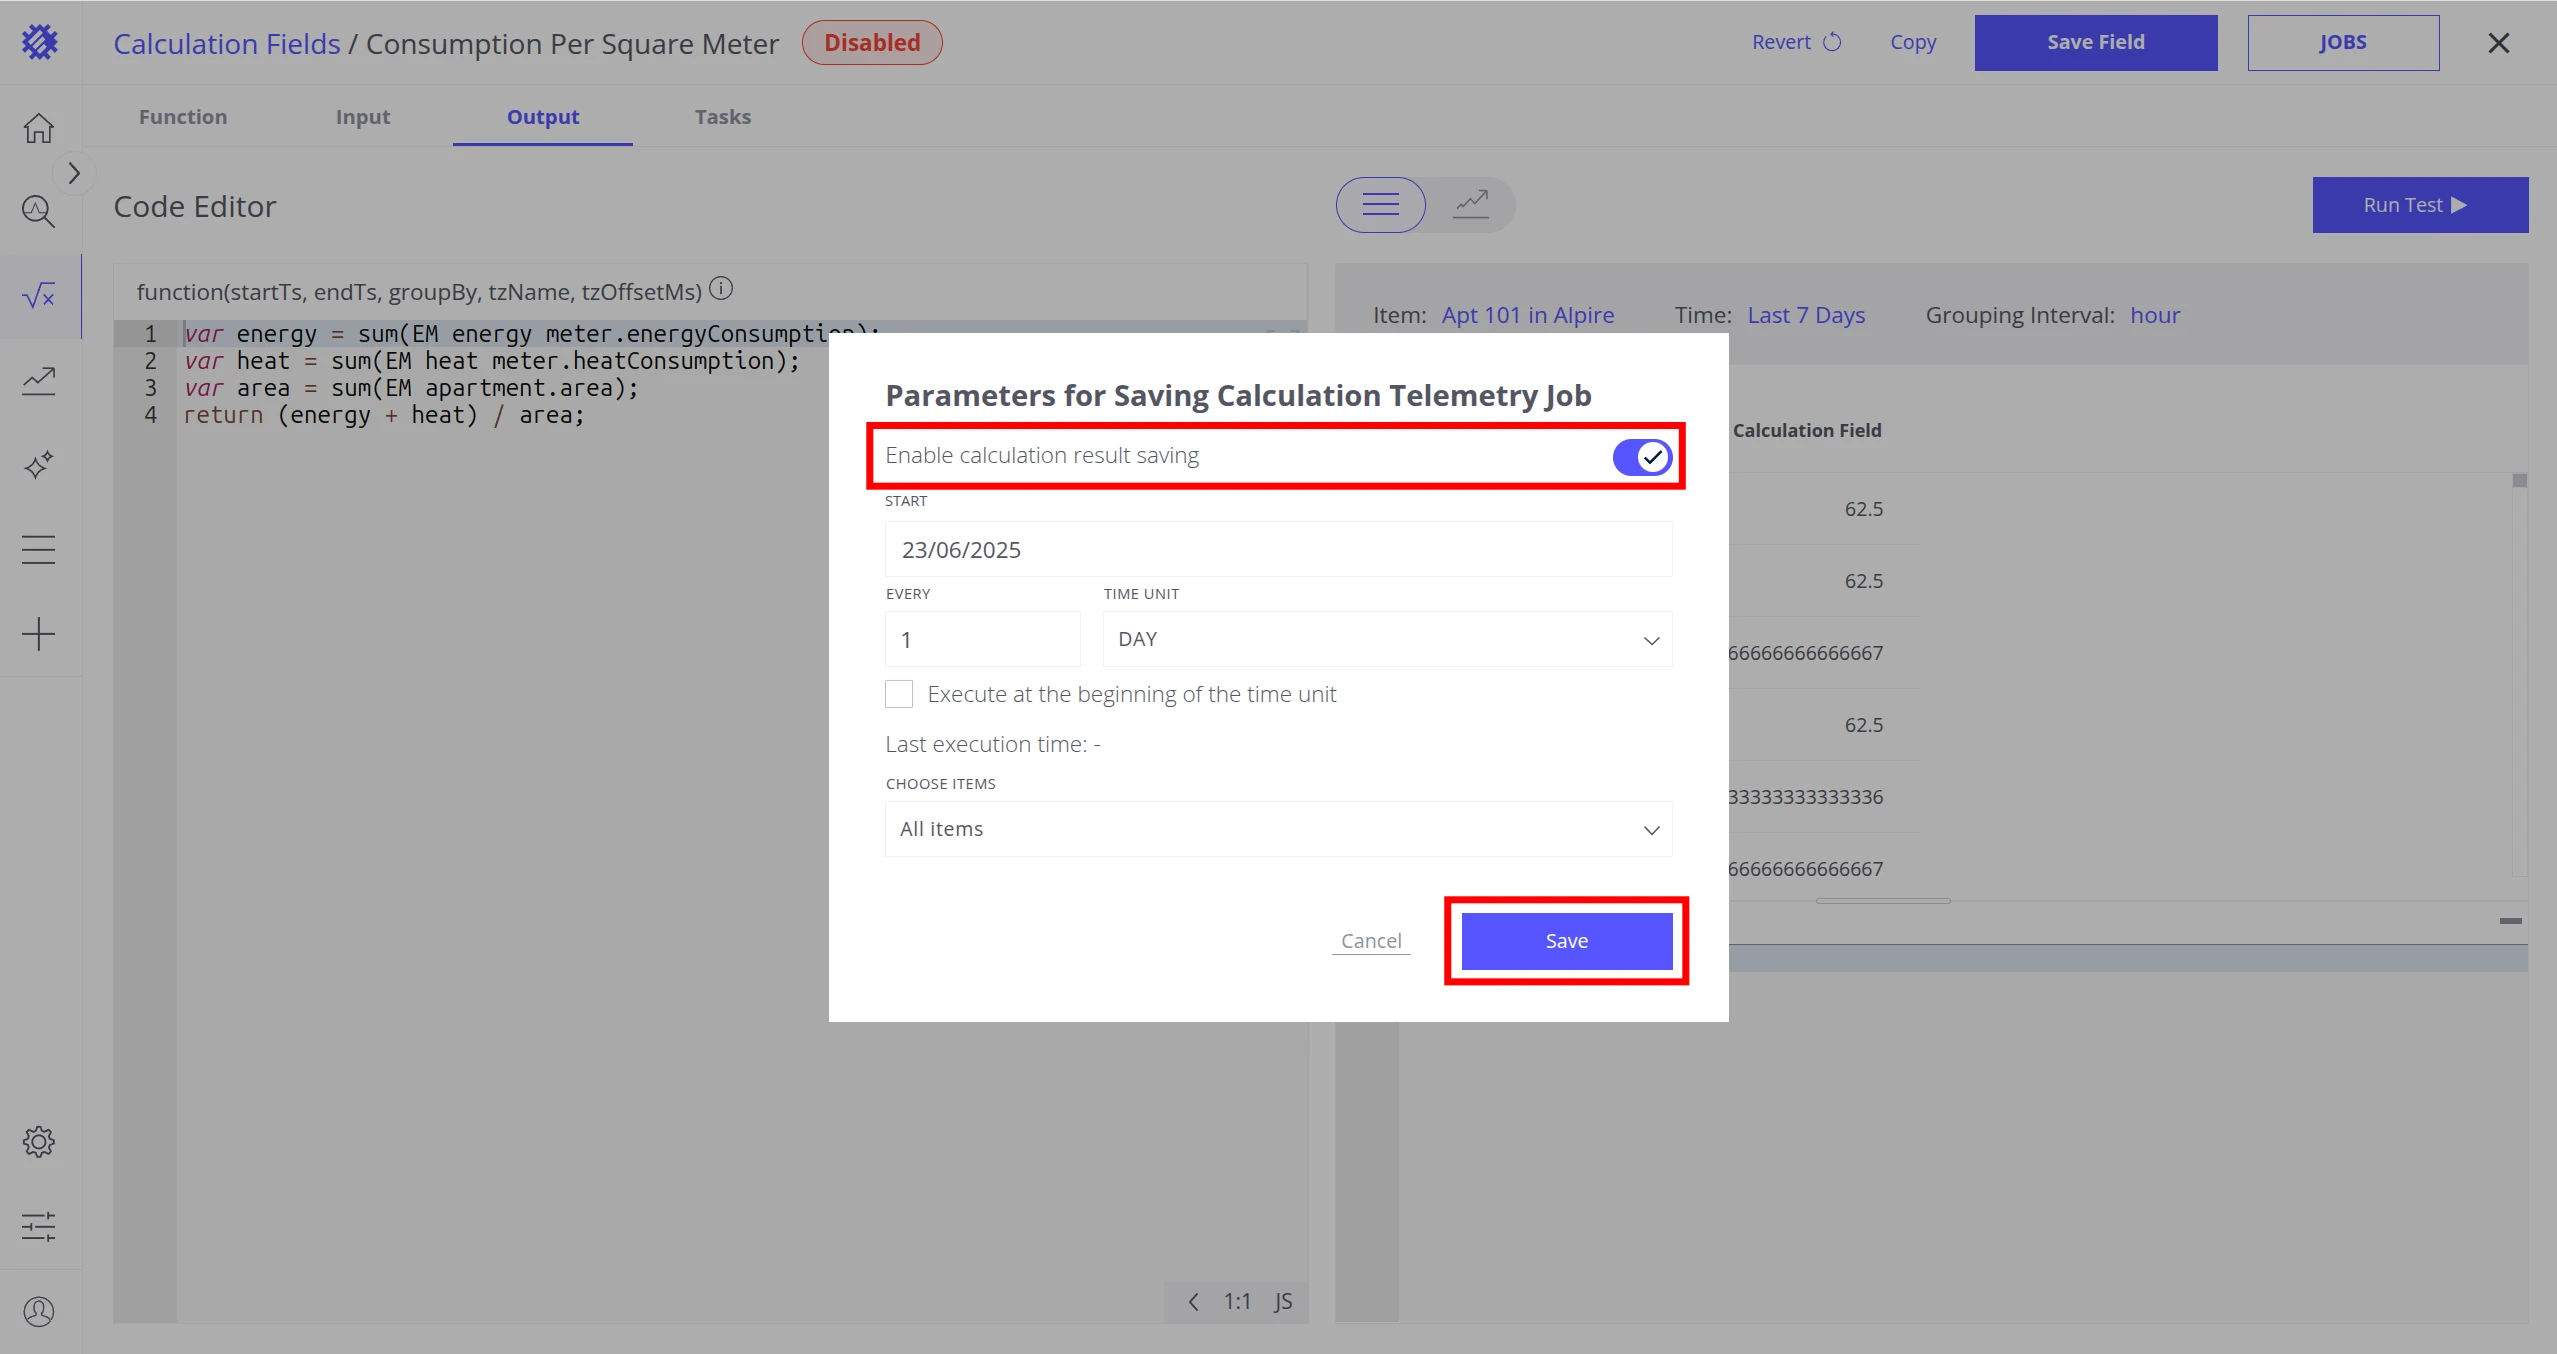
-
Enable calculation result saving and click Save.
Use the calculated field in a table view
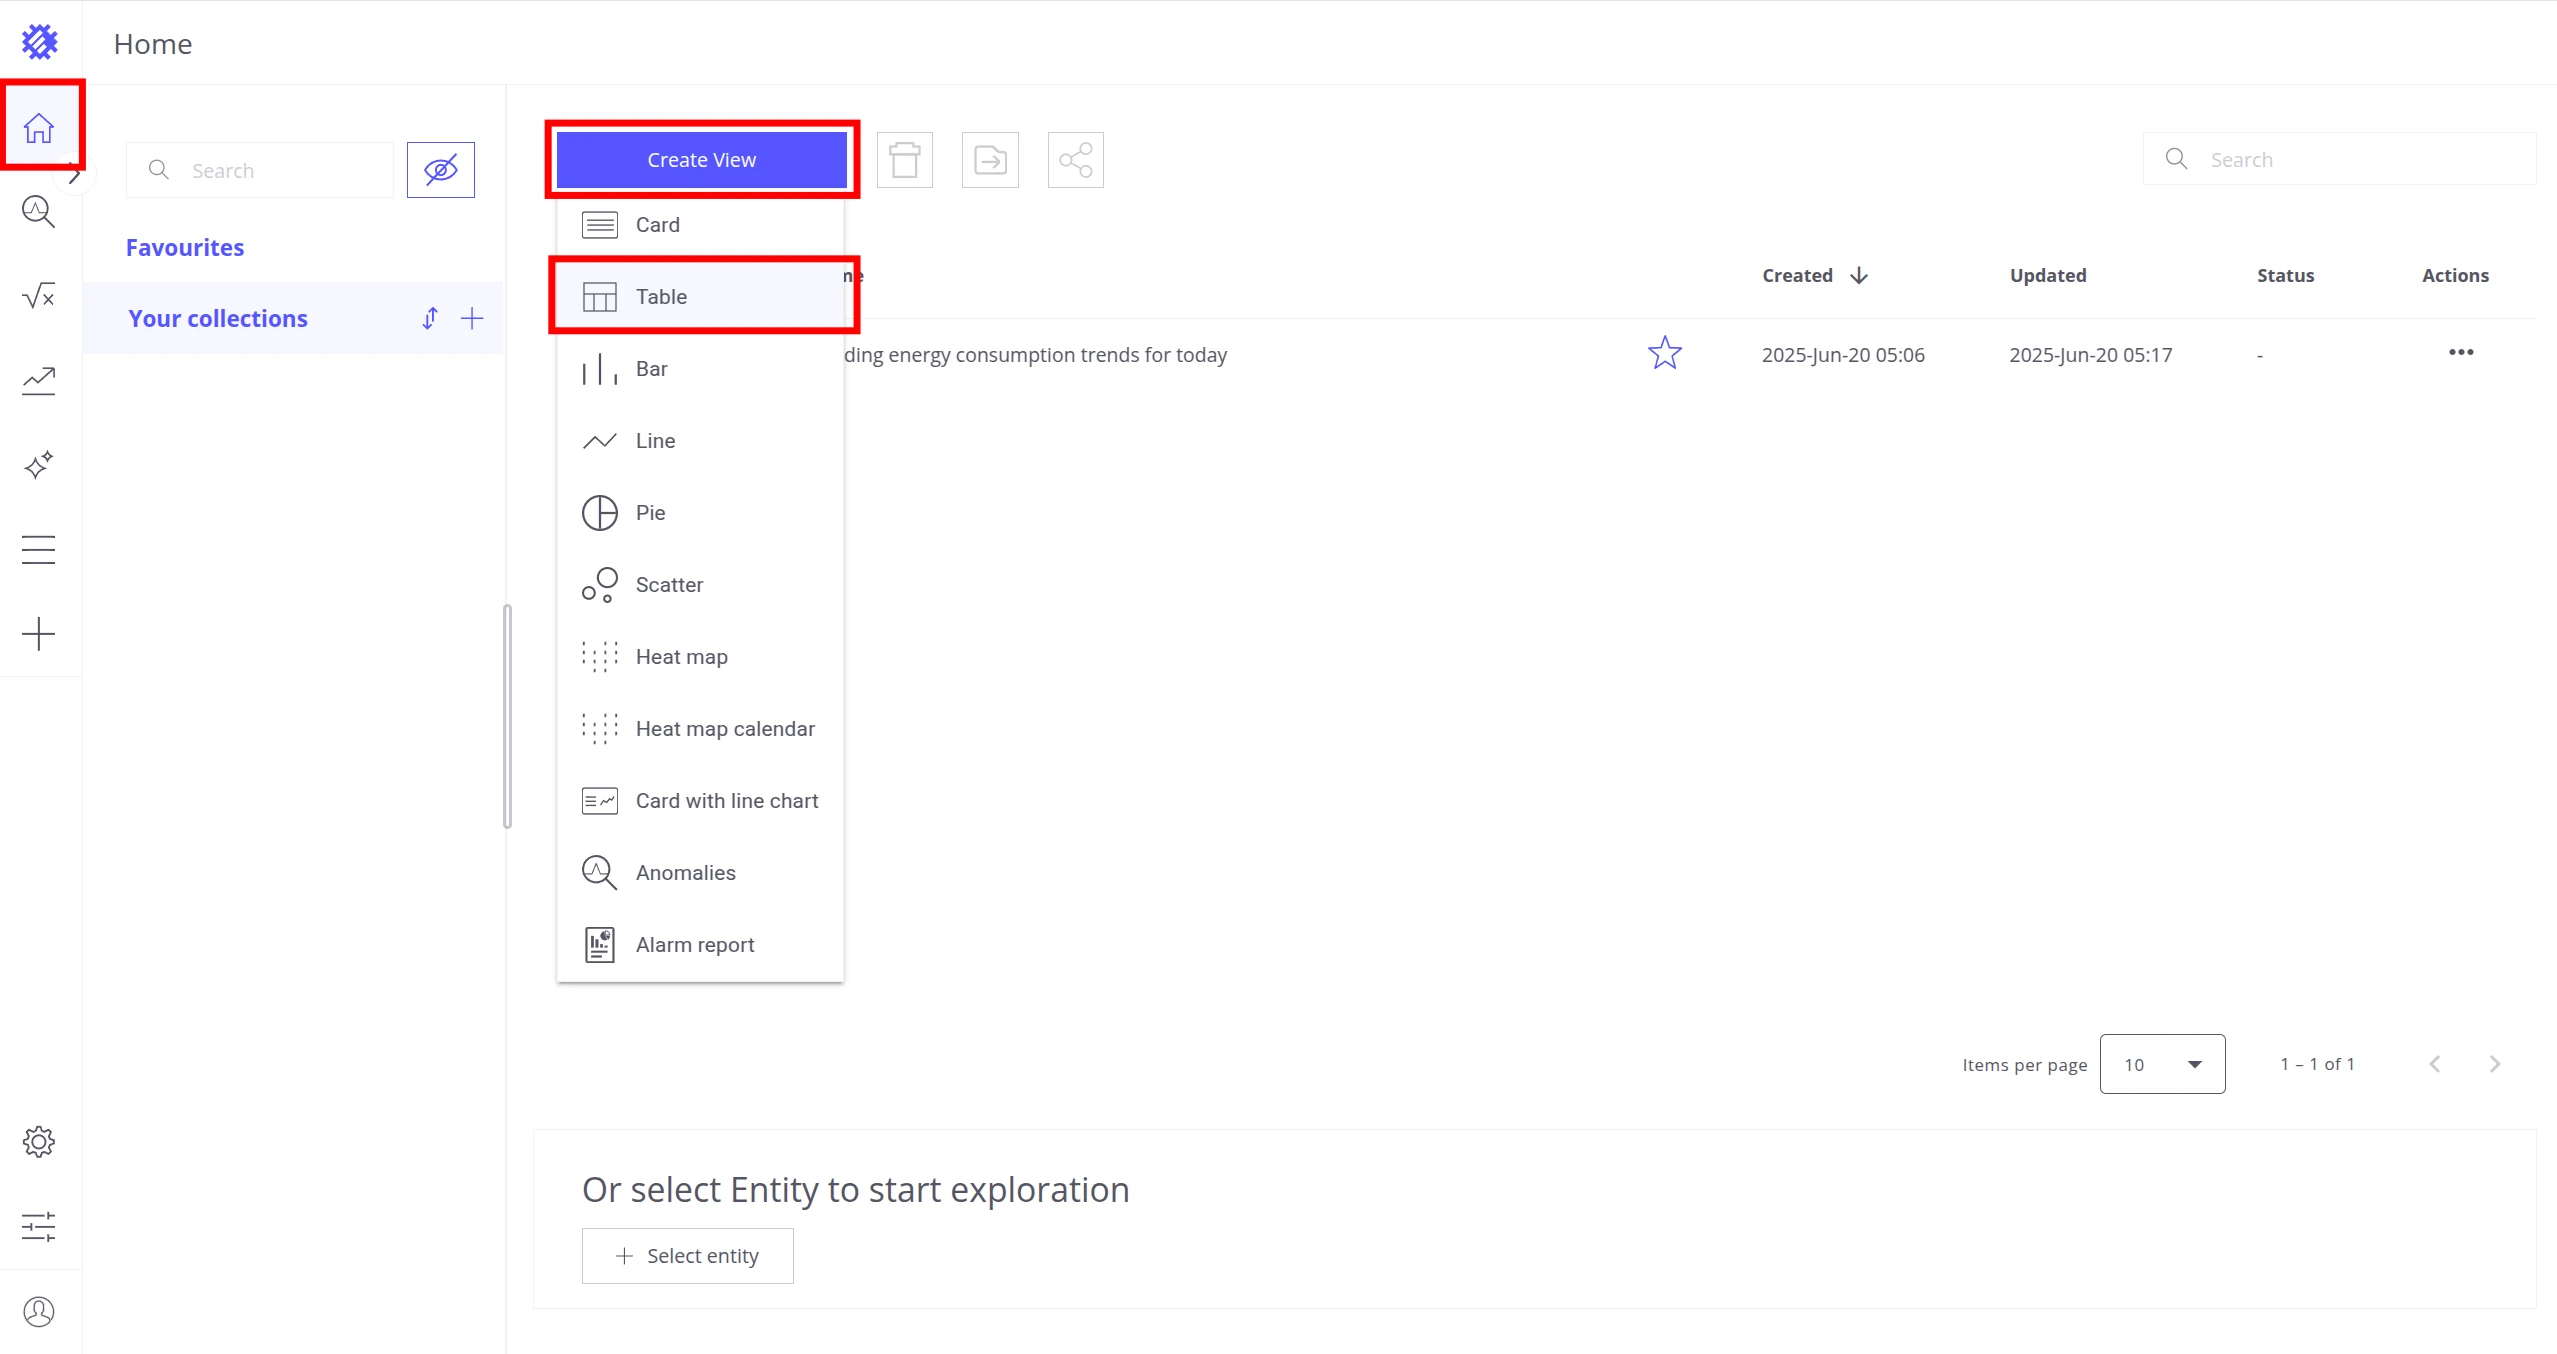
Section titled “Use the calculated field in a table view”-
On the home page, click Create View and select Table.
-
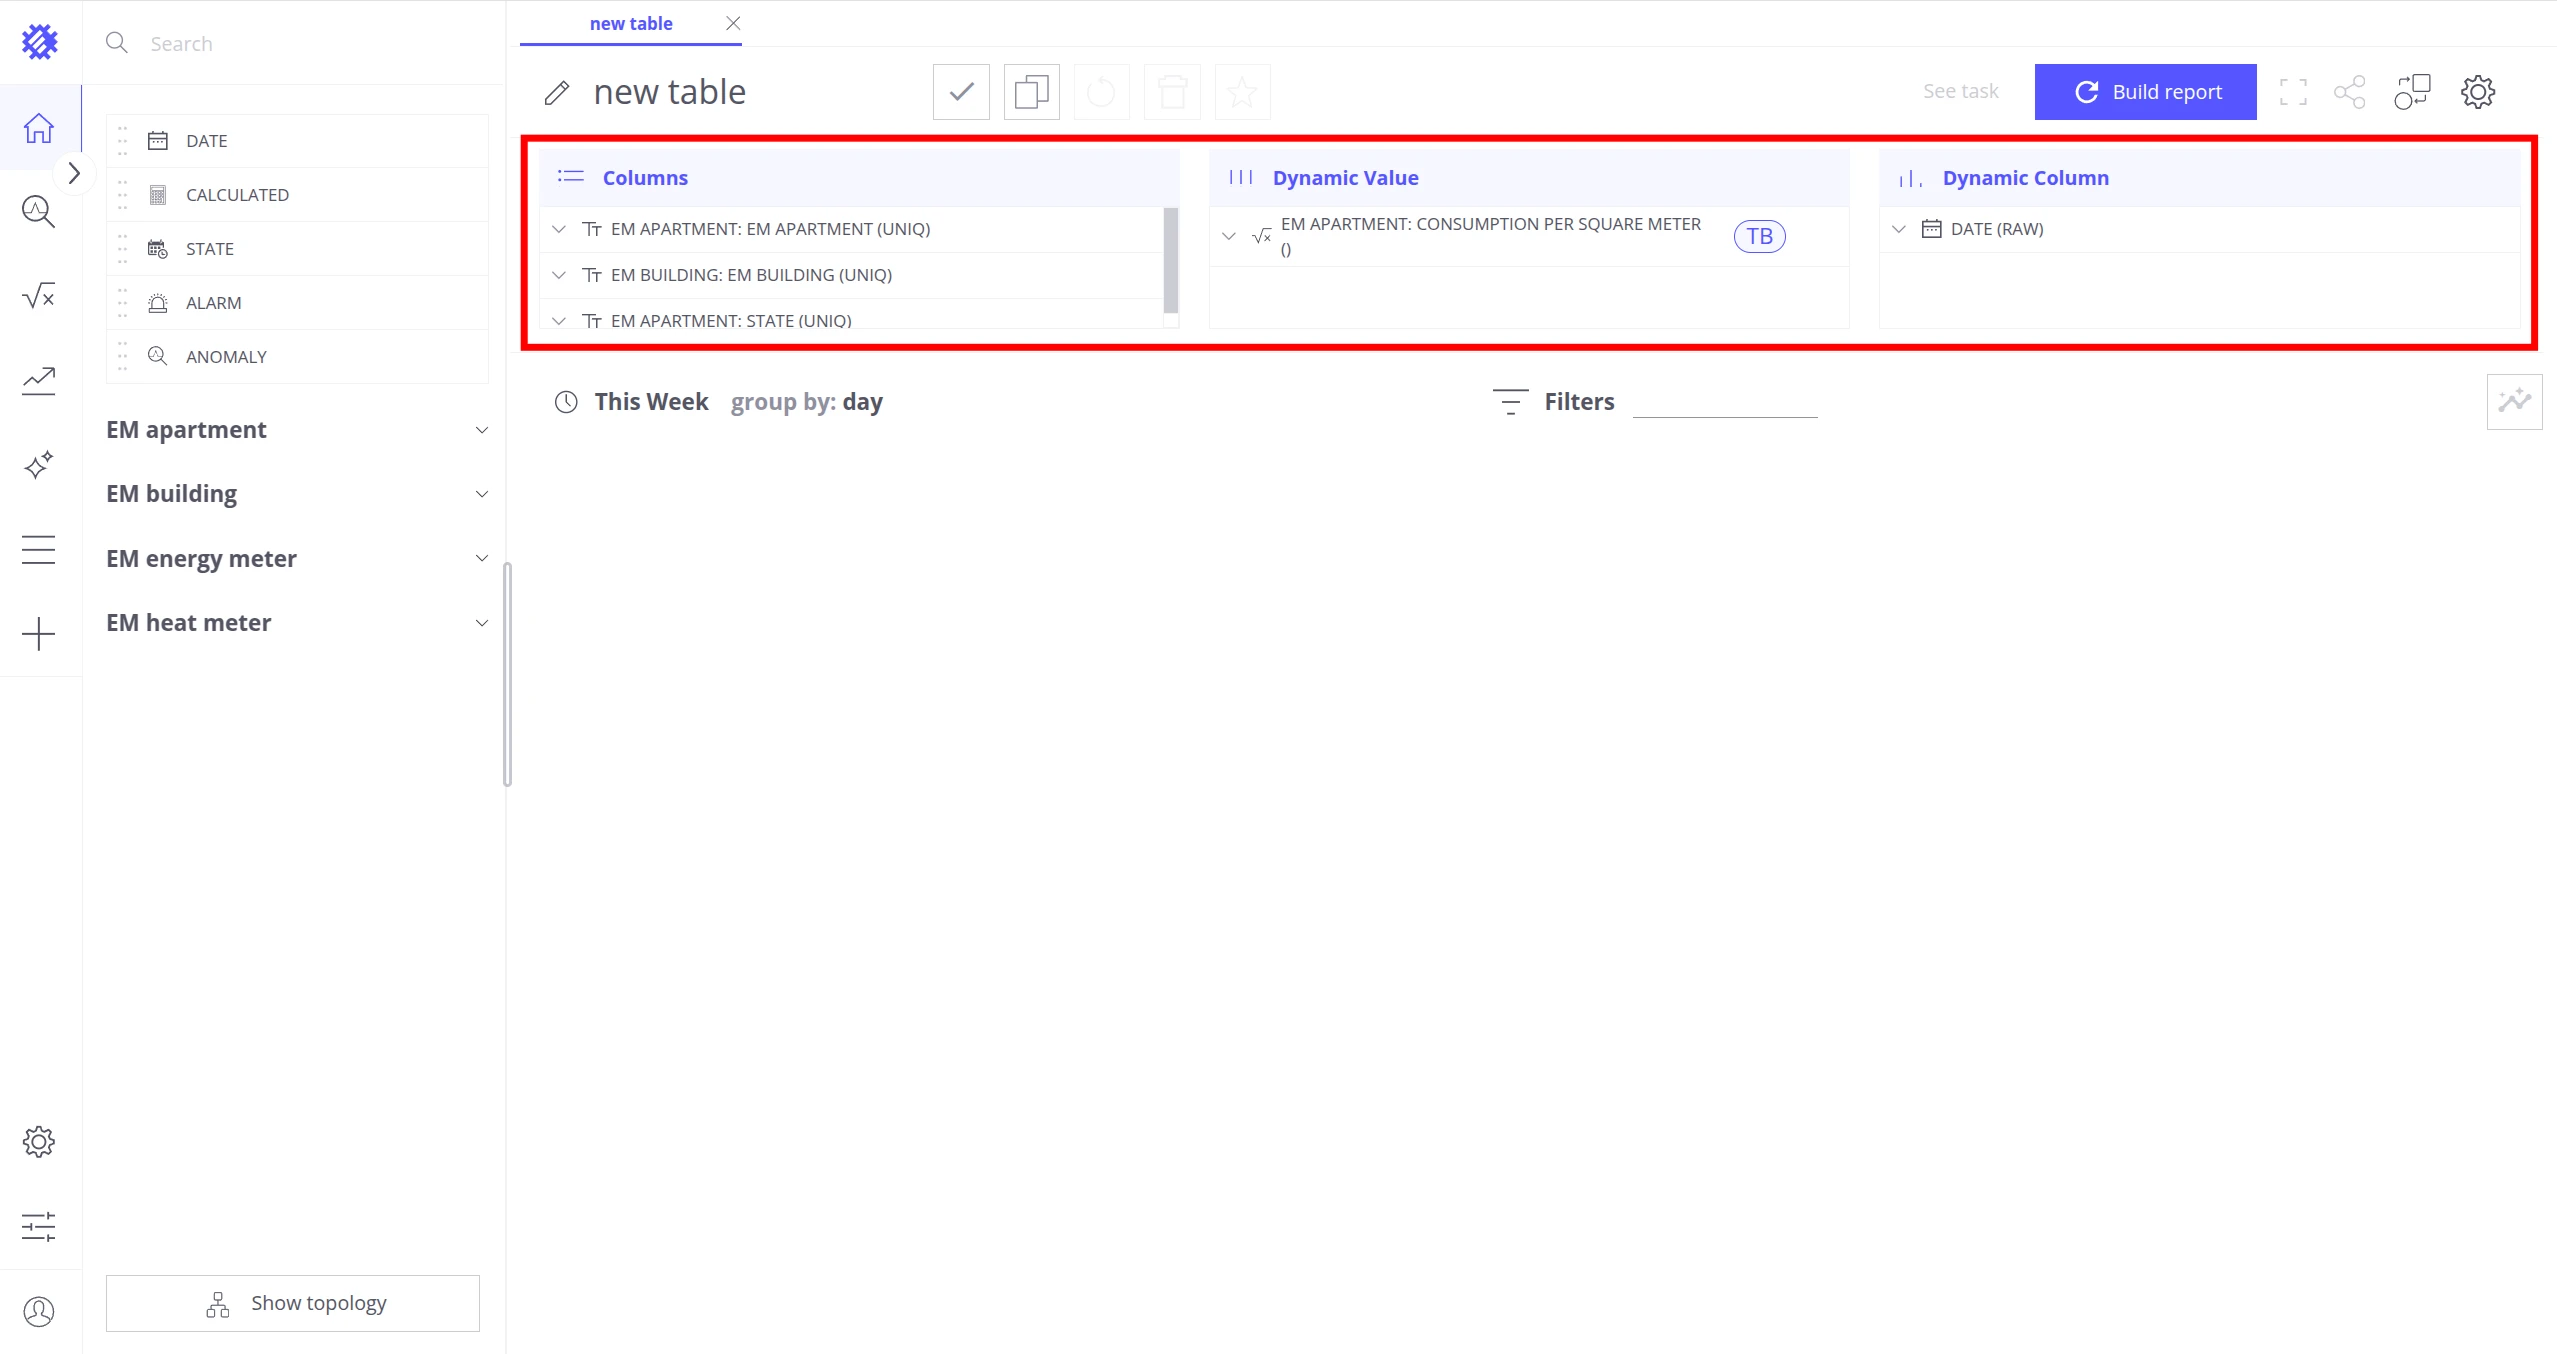
Add fields to each section:
- Columns:
EM apartment.EM apartment,EM building.EM building,EM apartment.state - Dynamic Value:
EM apartment.Consumption Per Square Meter(appears after the field is enabled) - Dynamic Column:
Date (RAW)
- Columns:
-
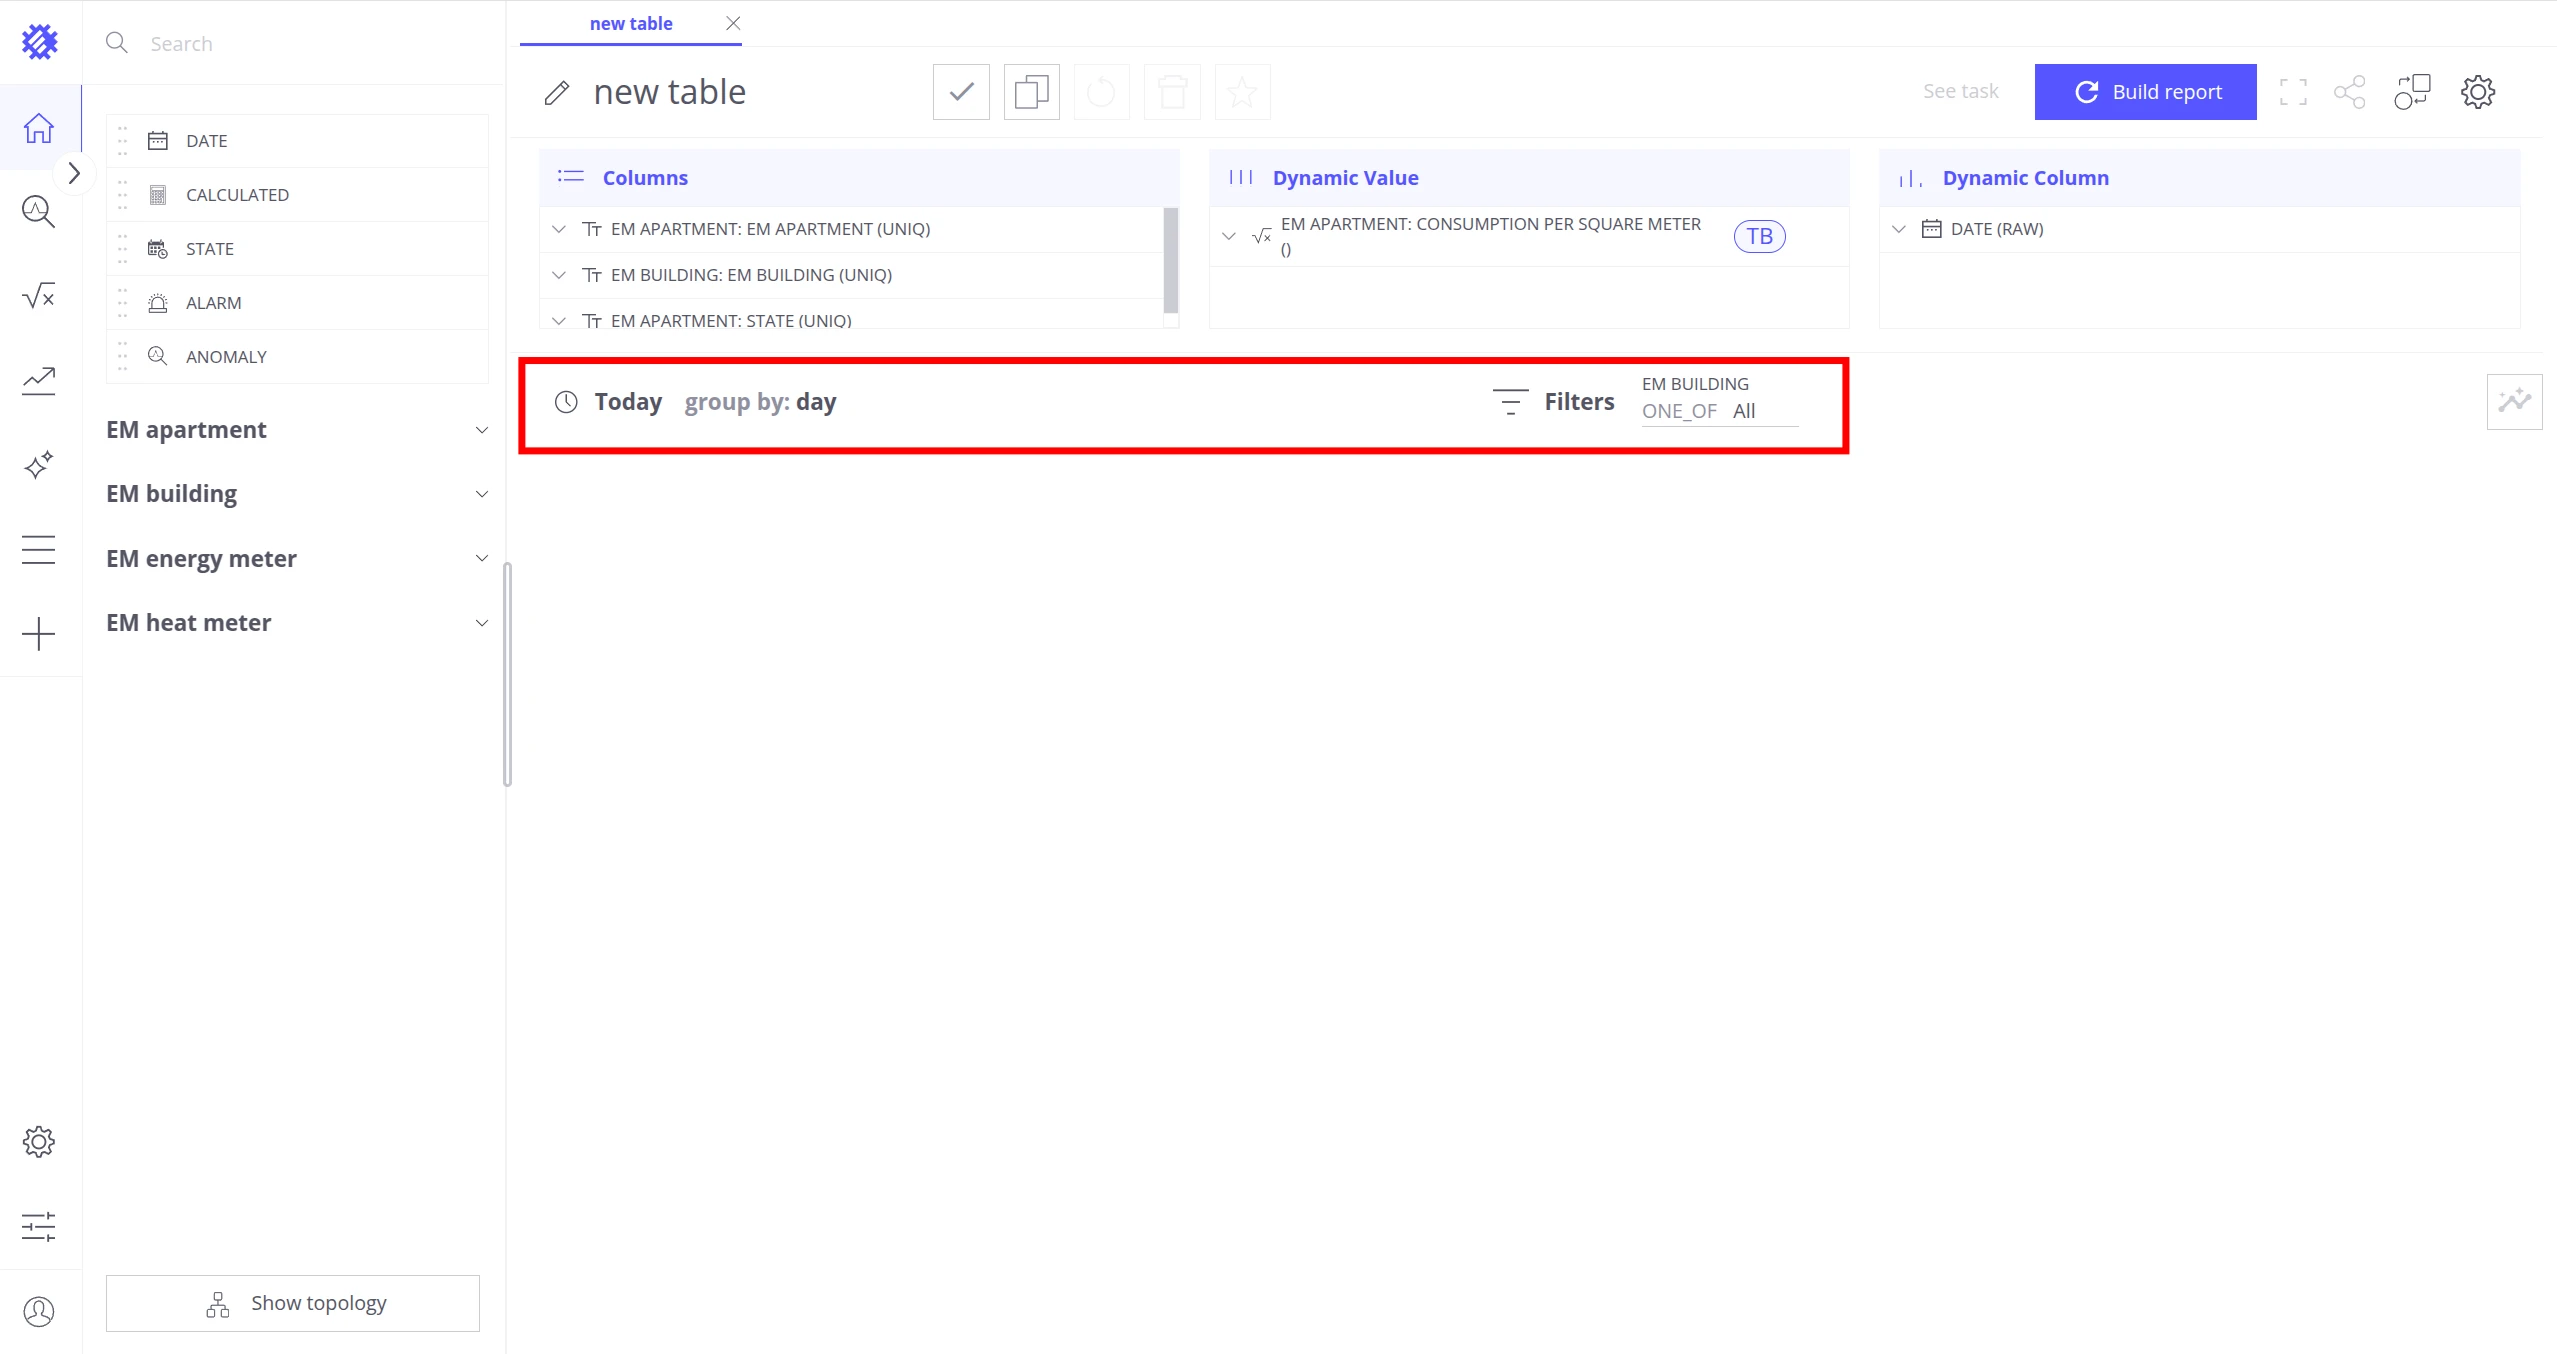
Set the date picker to Today and add
EM building.EM buildingto the Filters section. -
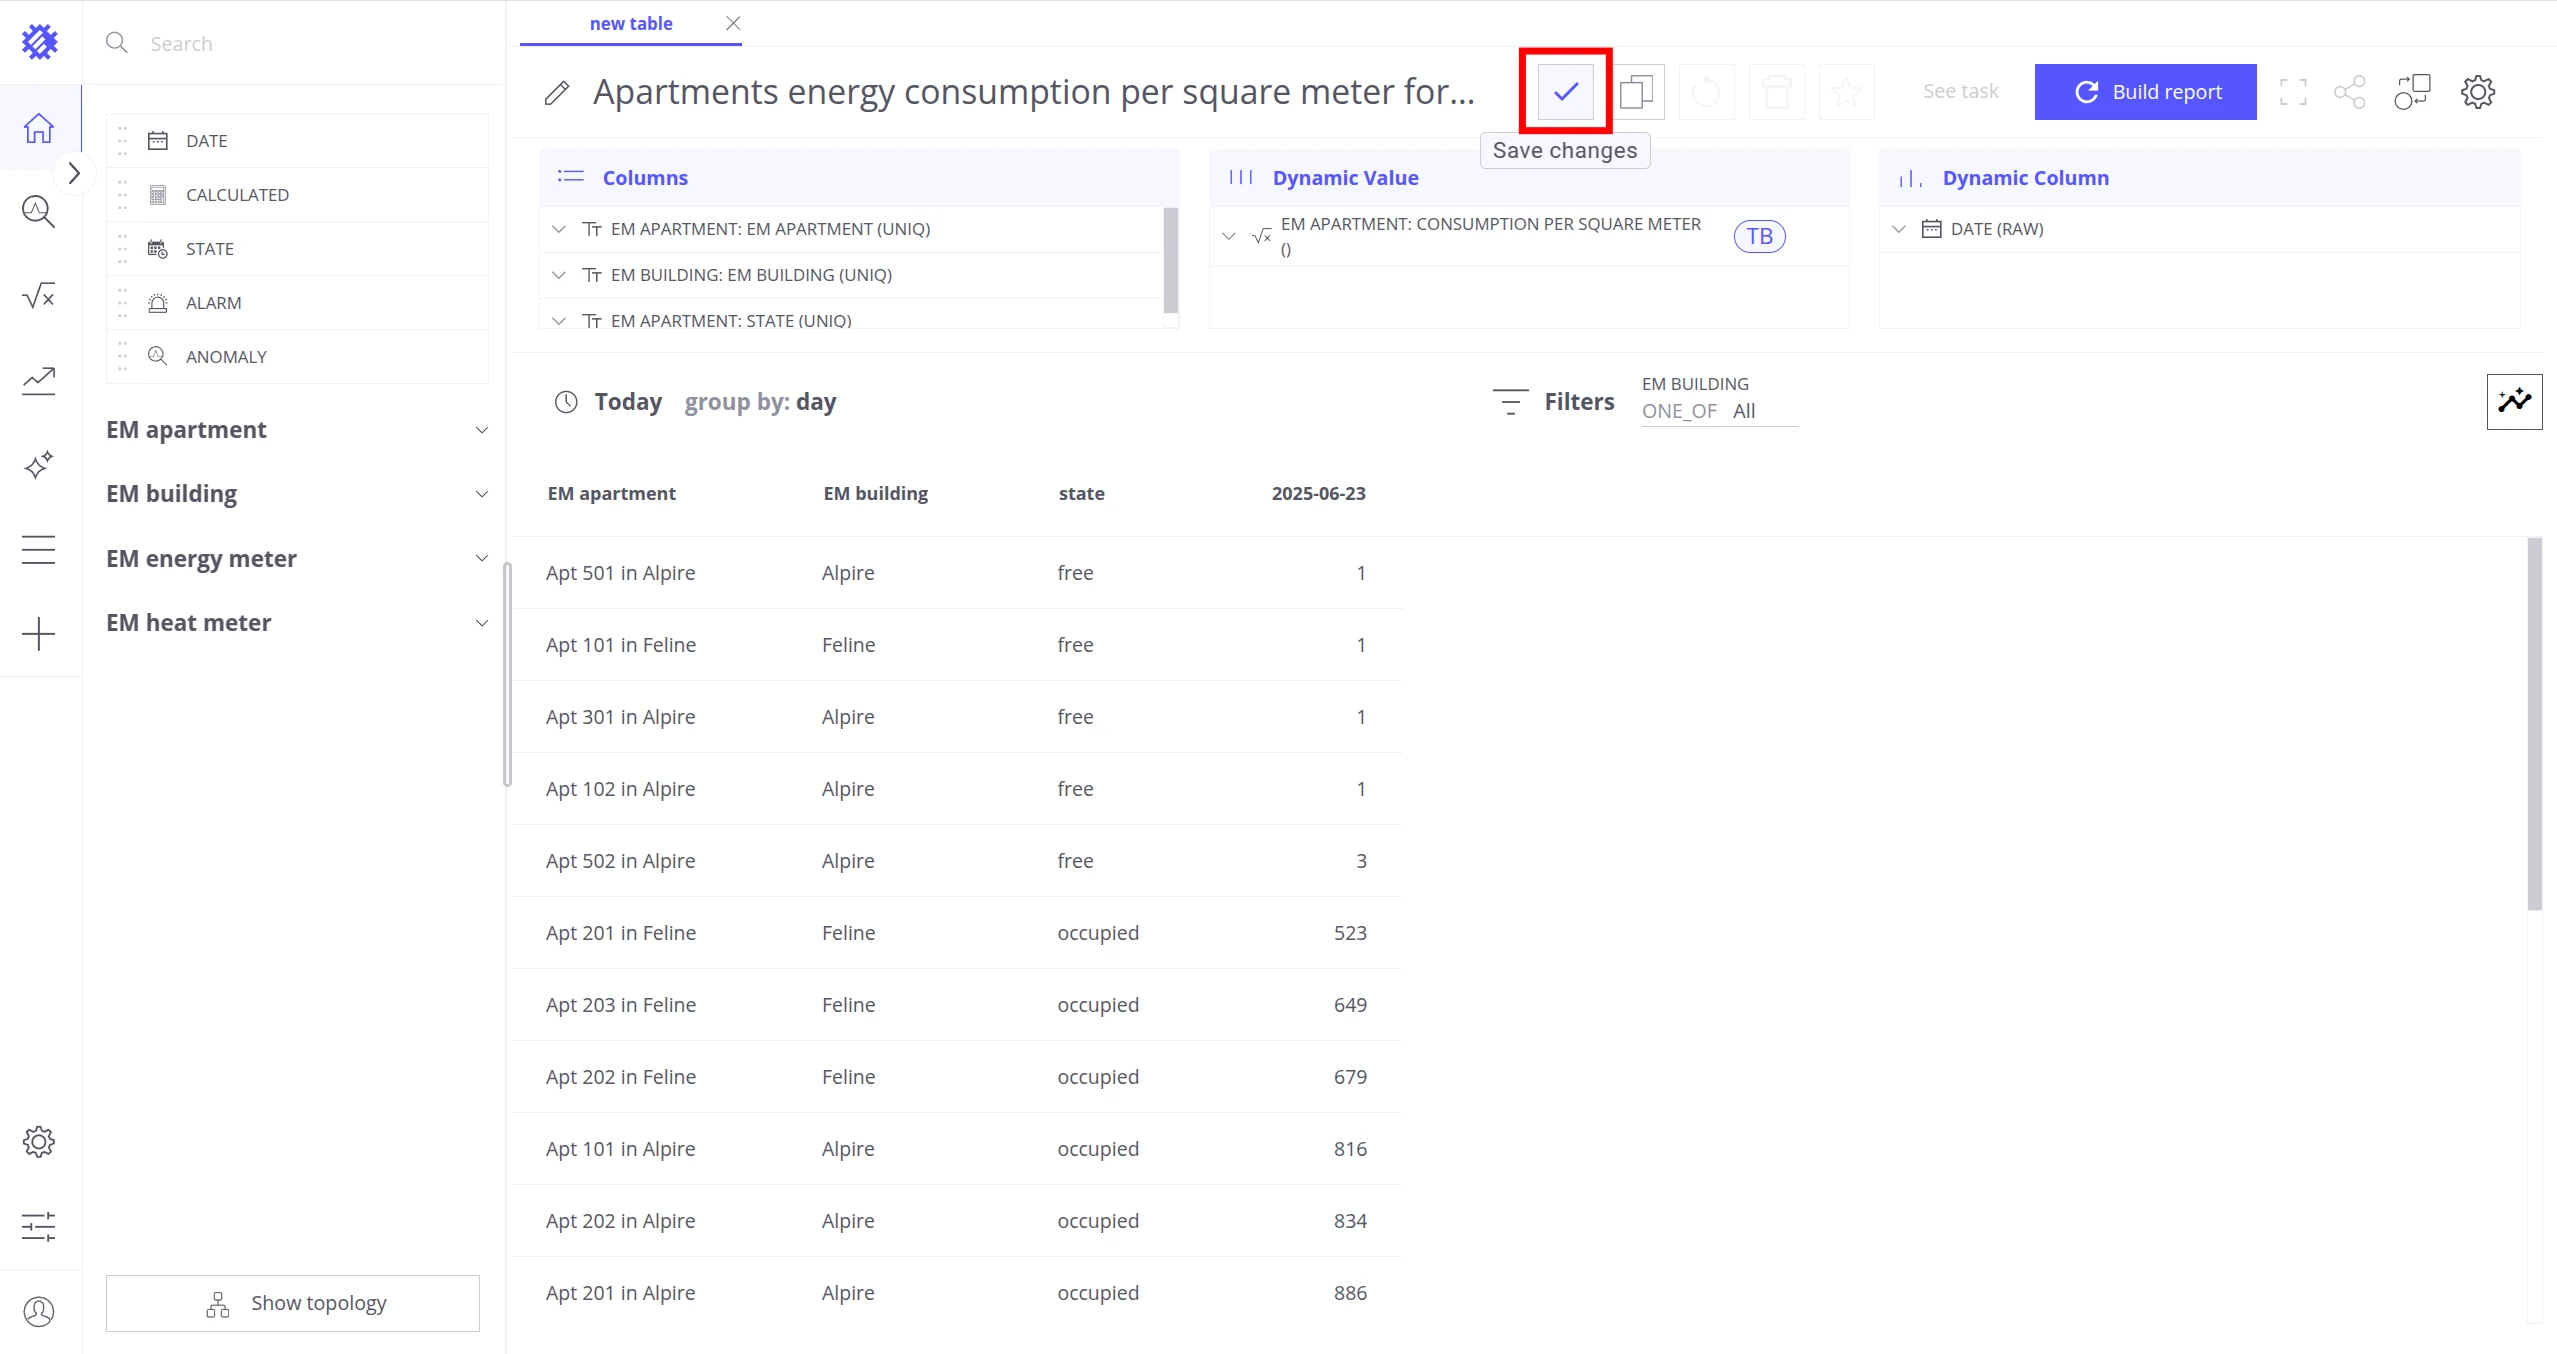
Click Build Report.
-
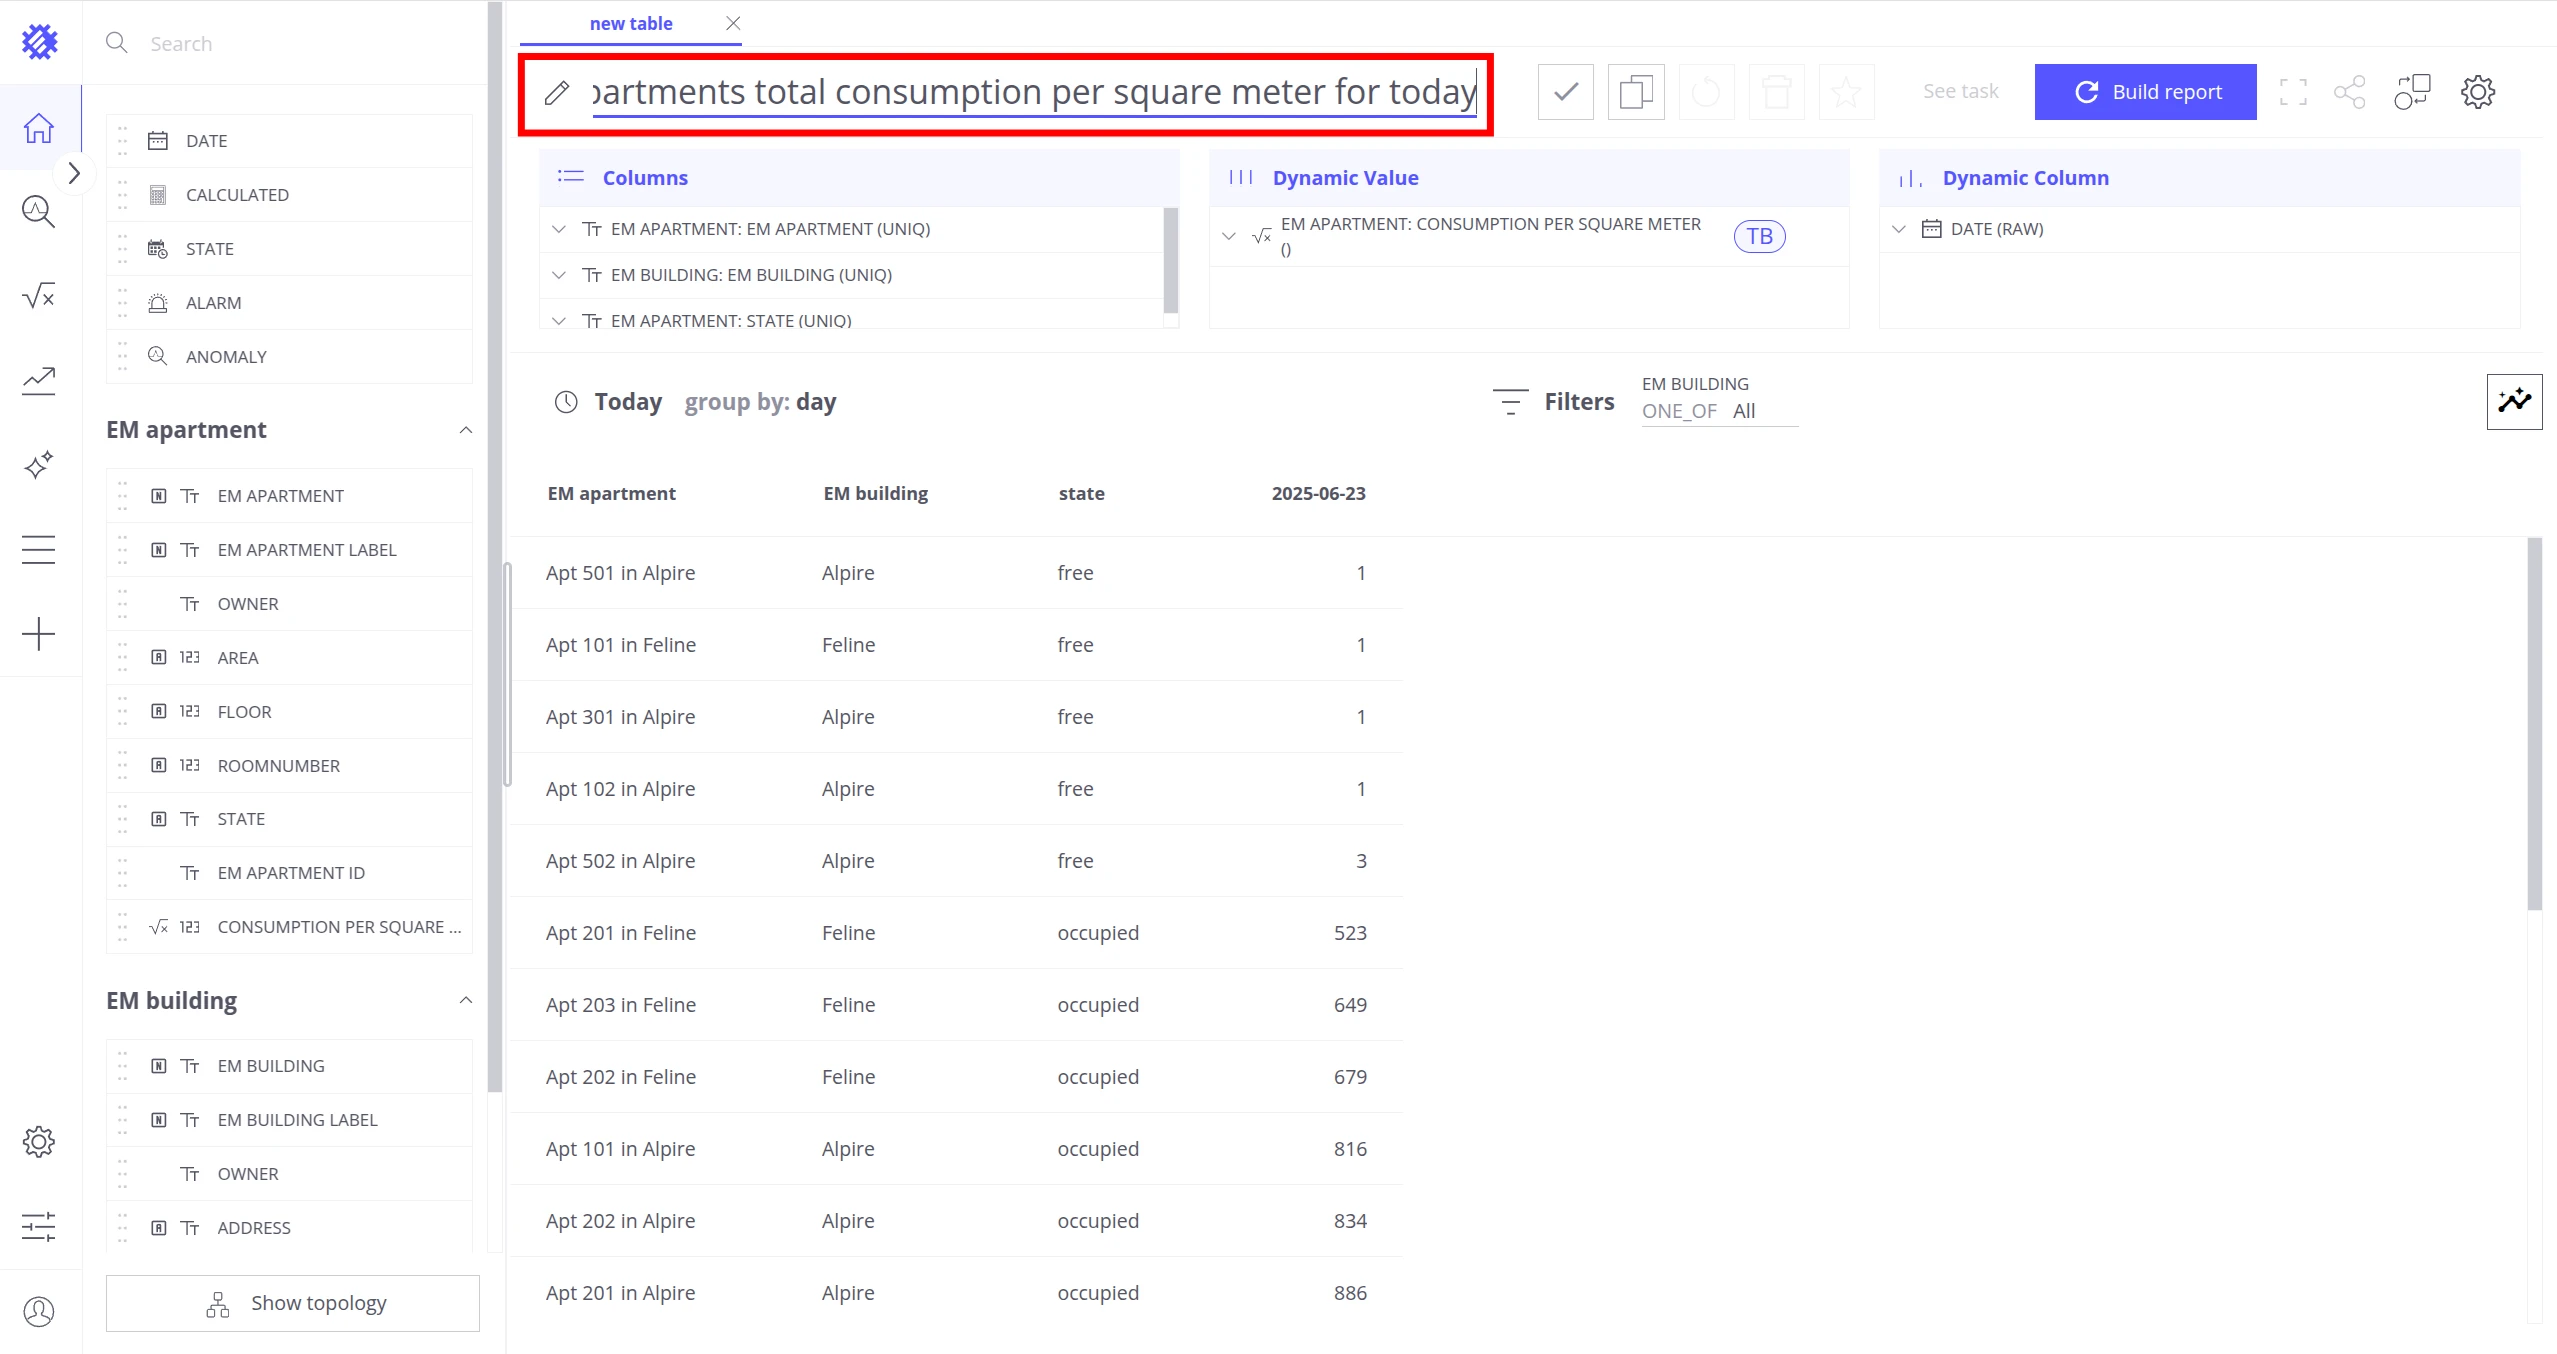
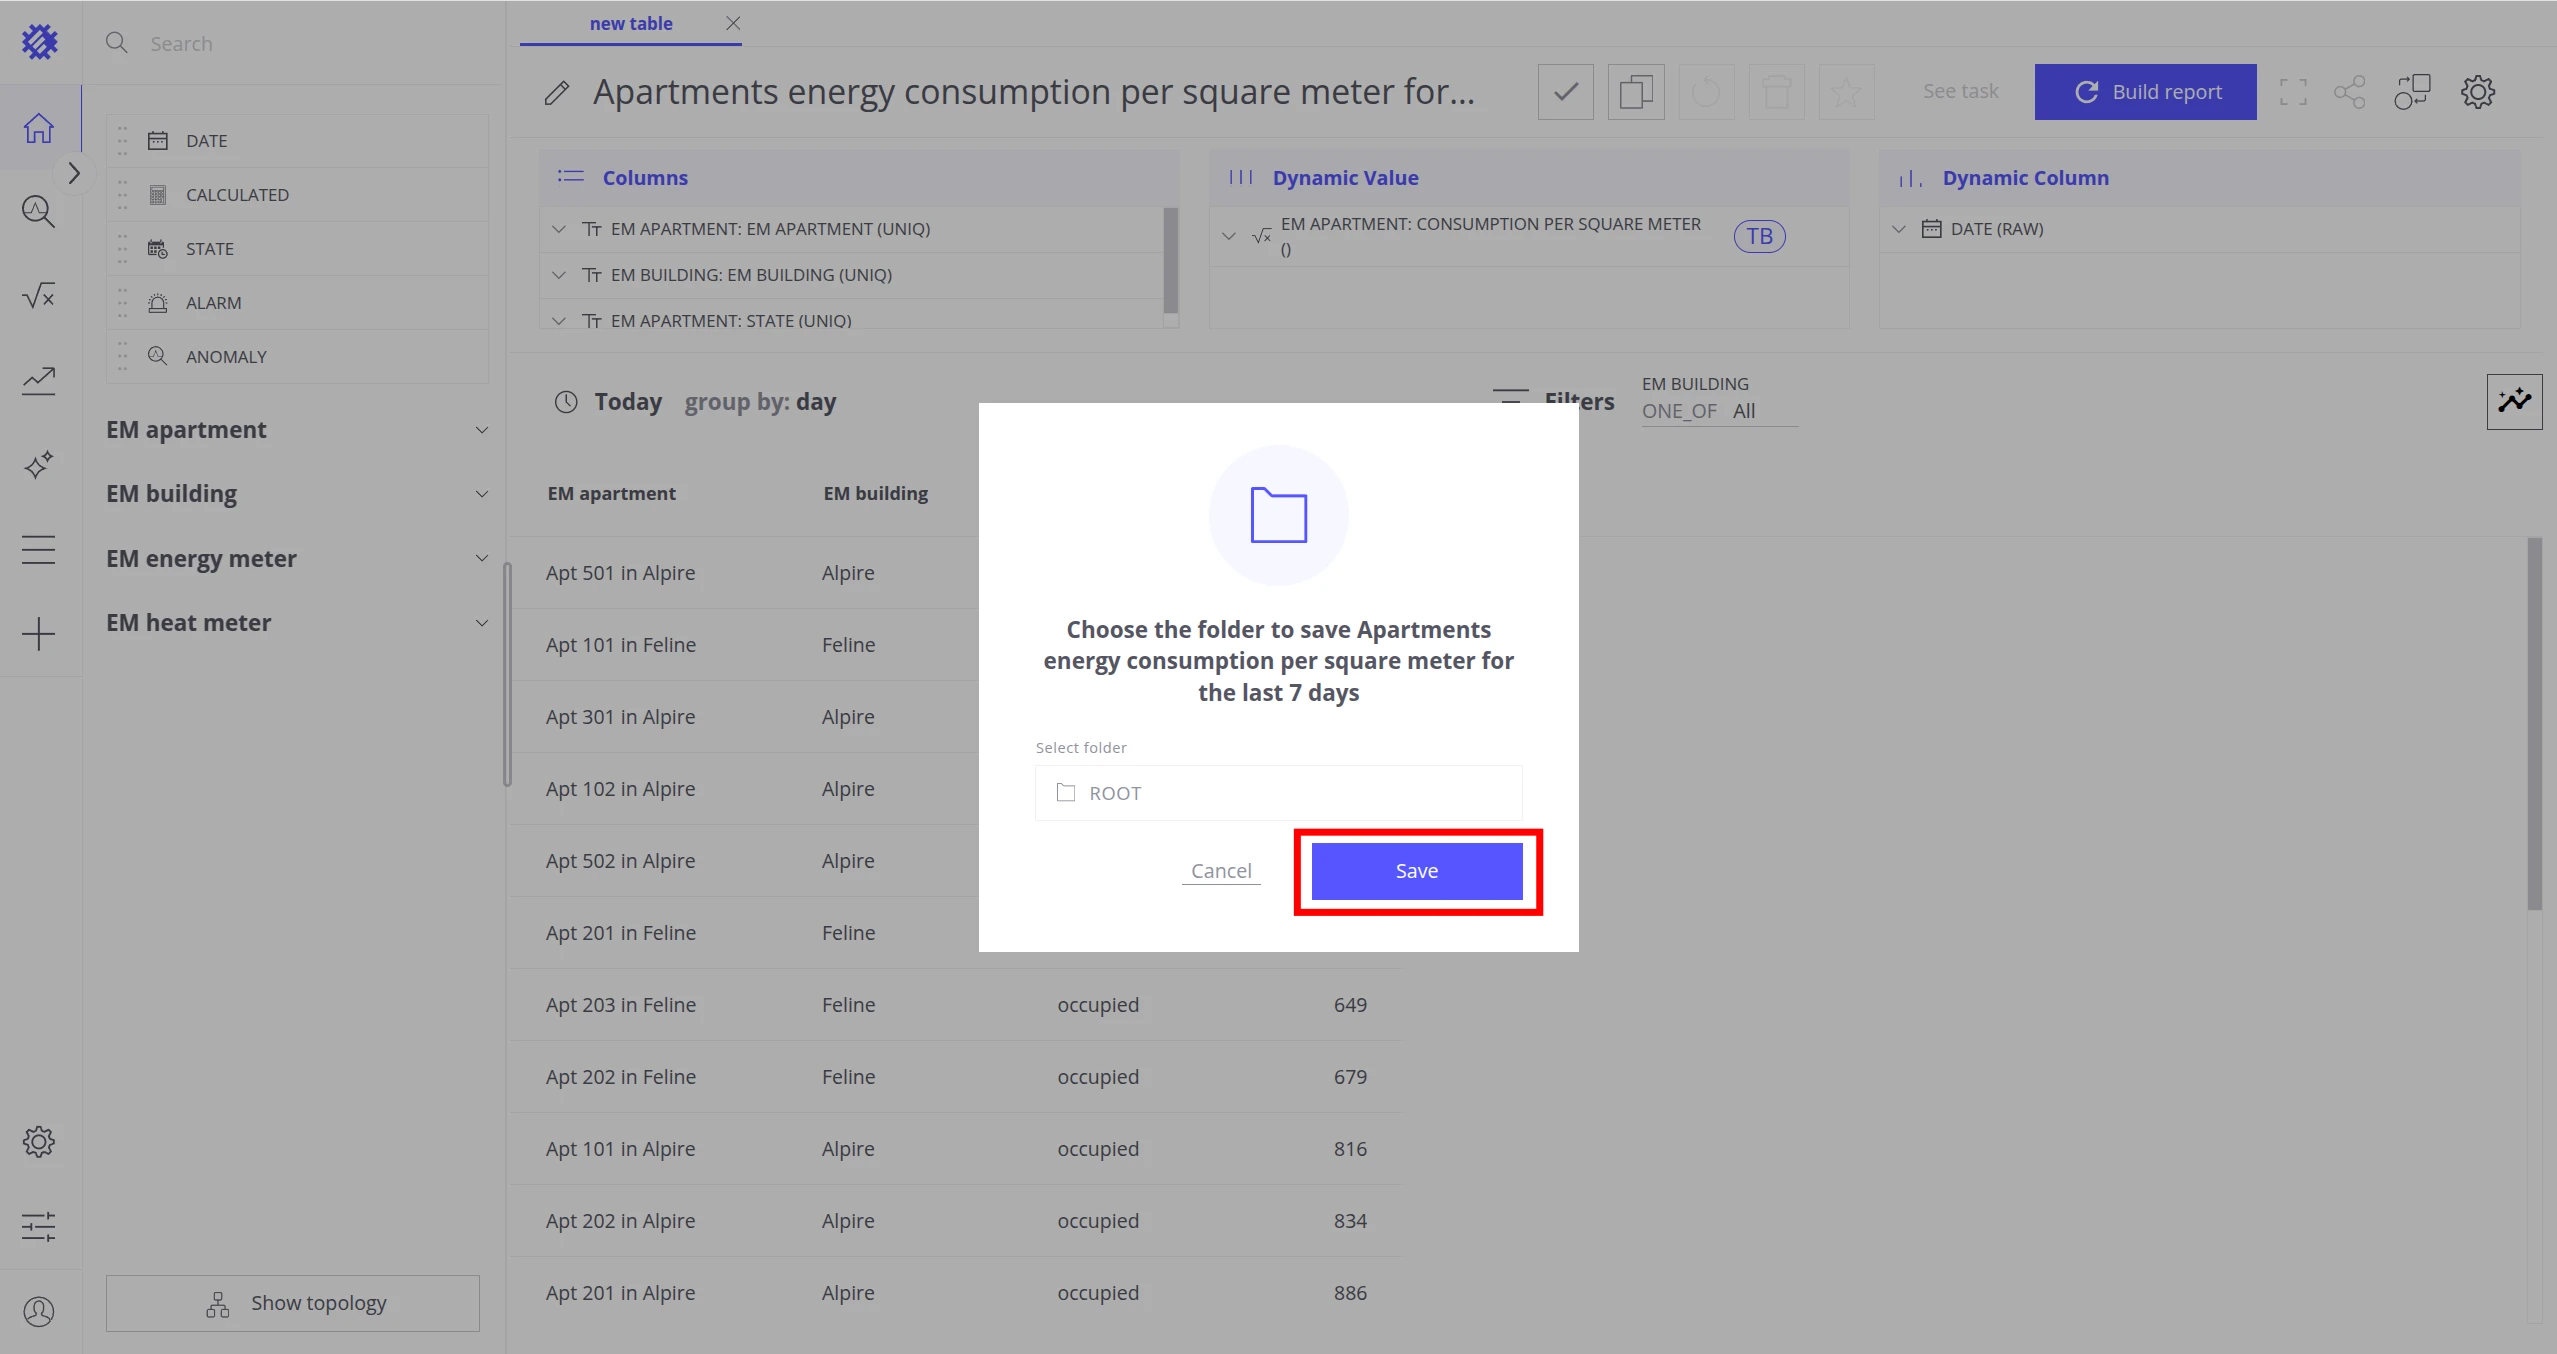
Rename the view to
Apartments total consumption per square meter for today. -
Click Save Changes, then Save in the pop-up.
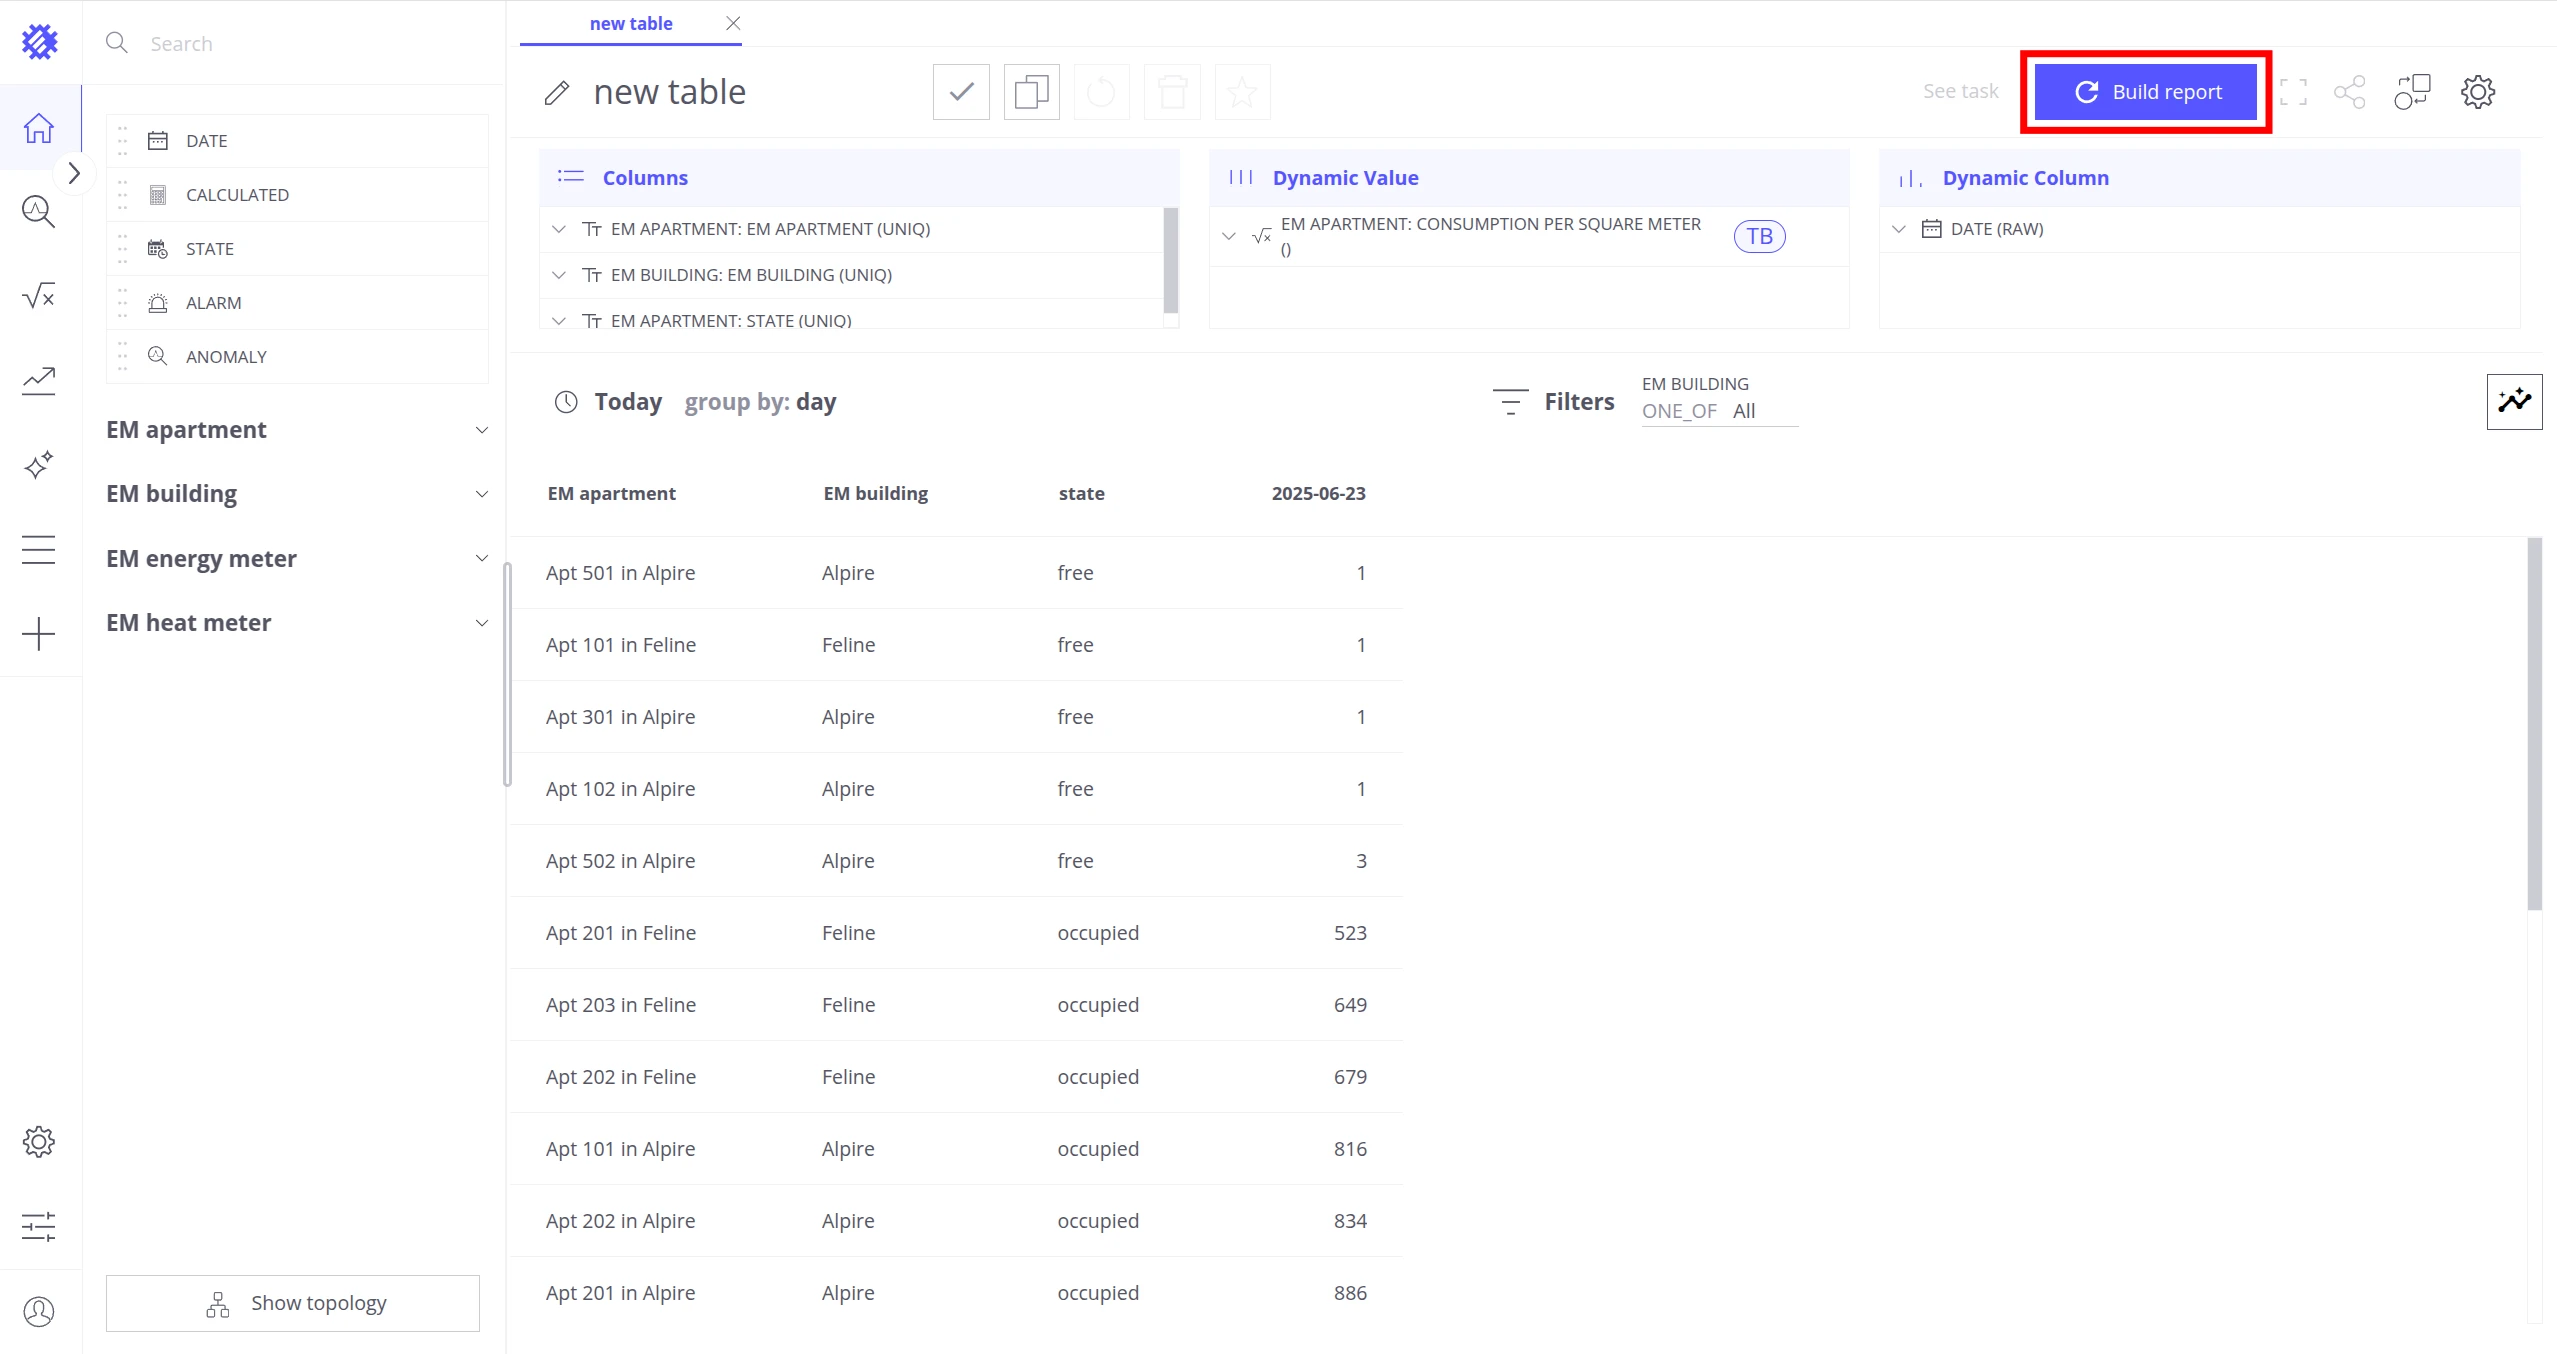
Now we have a calculated field cons_per_sq_meter that computes combined electricity and heat consumption per square meter for each apartment, saves results back to ThingsBoard automatically, and a table view that uses it to compare all apartments side by side.
Read more in Calculated Fields.
Step 6. Predict energy usage
Section titled “Step 6. Predict energy usage”We will train a prediction model that forecasts energy consumption for the current week, then visualize it in a bar chart.
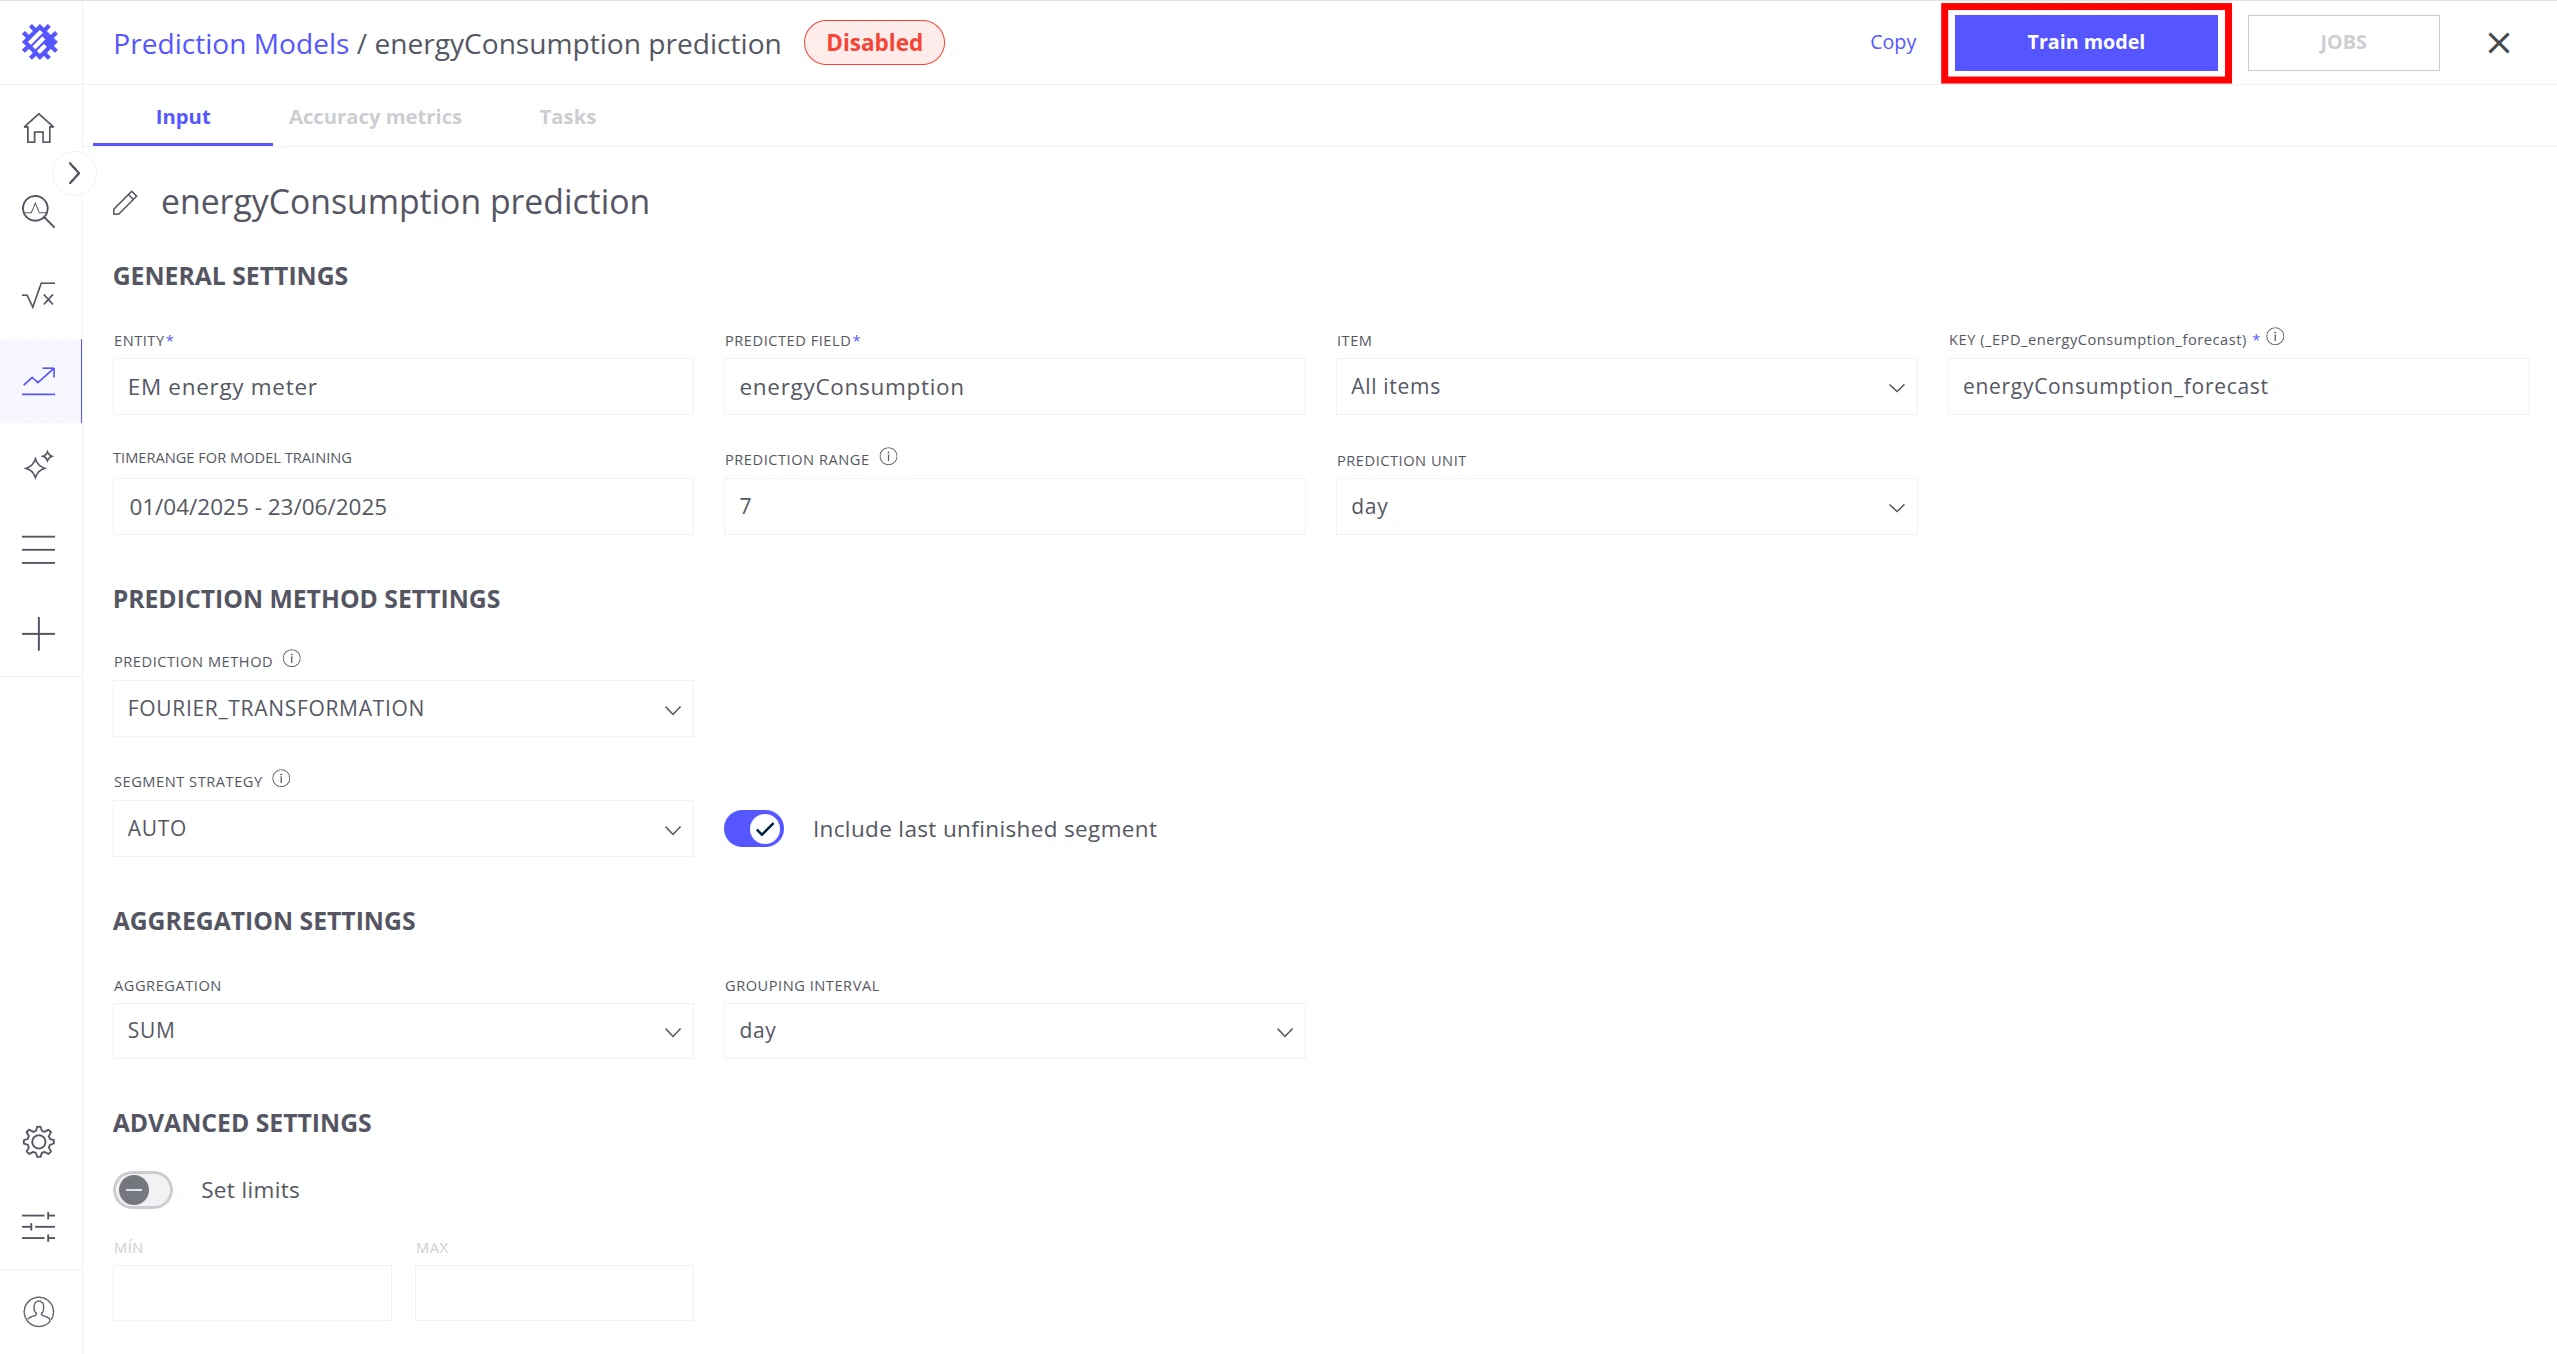
Create a prediction model
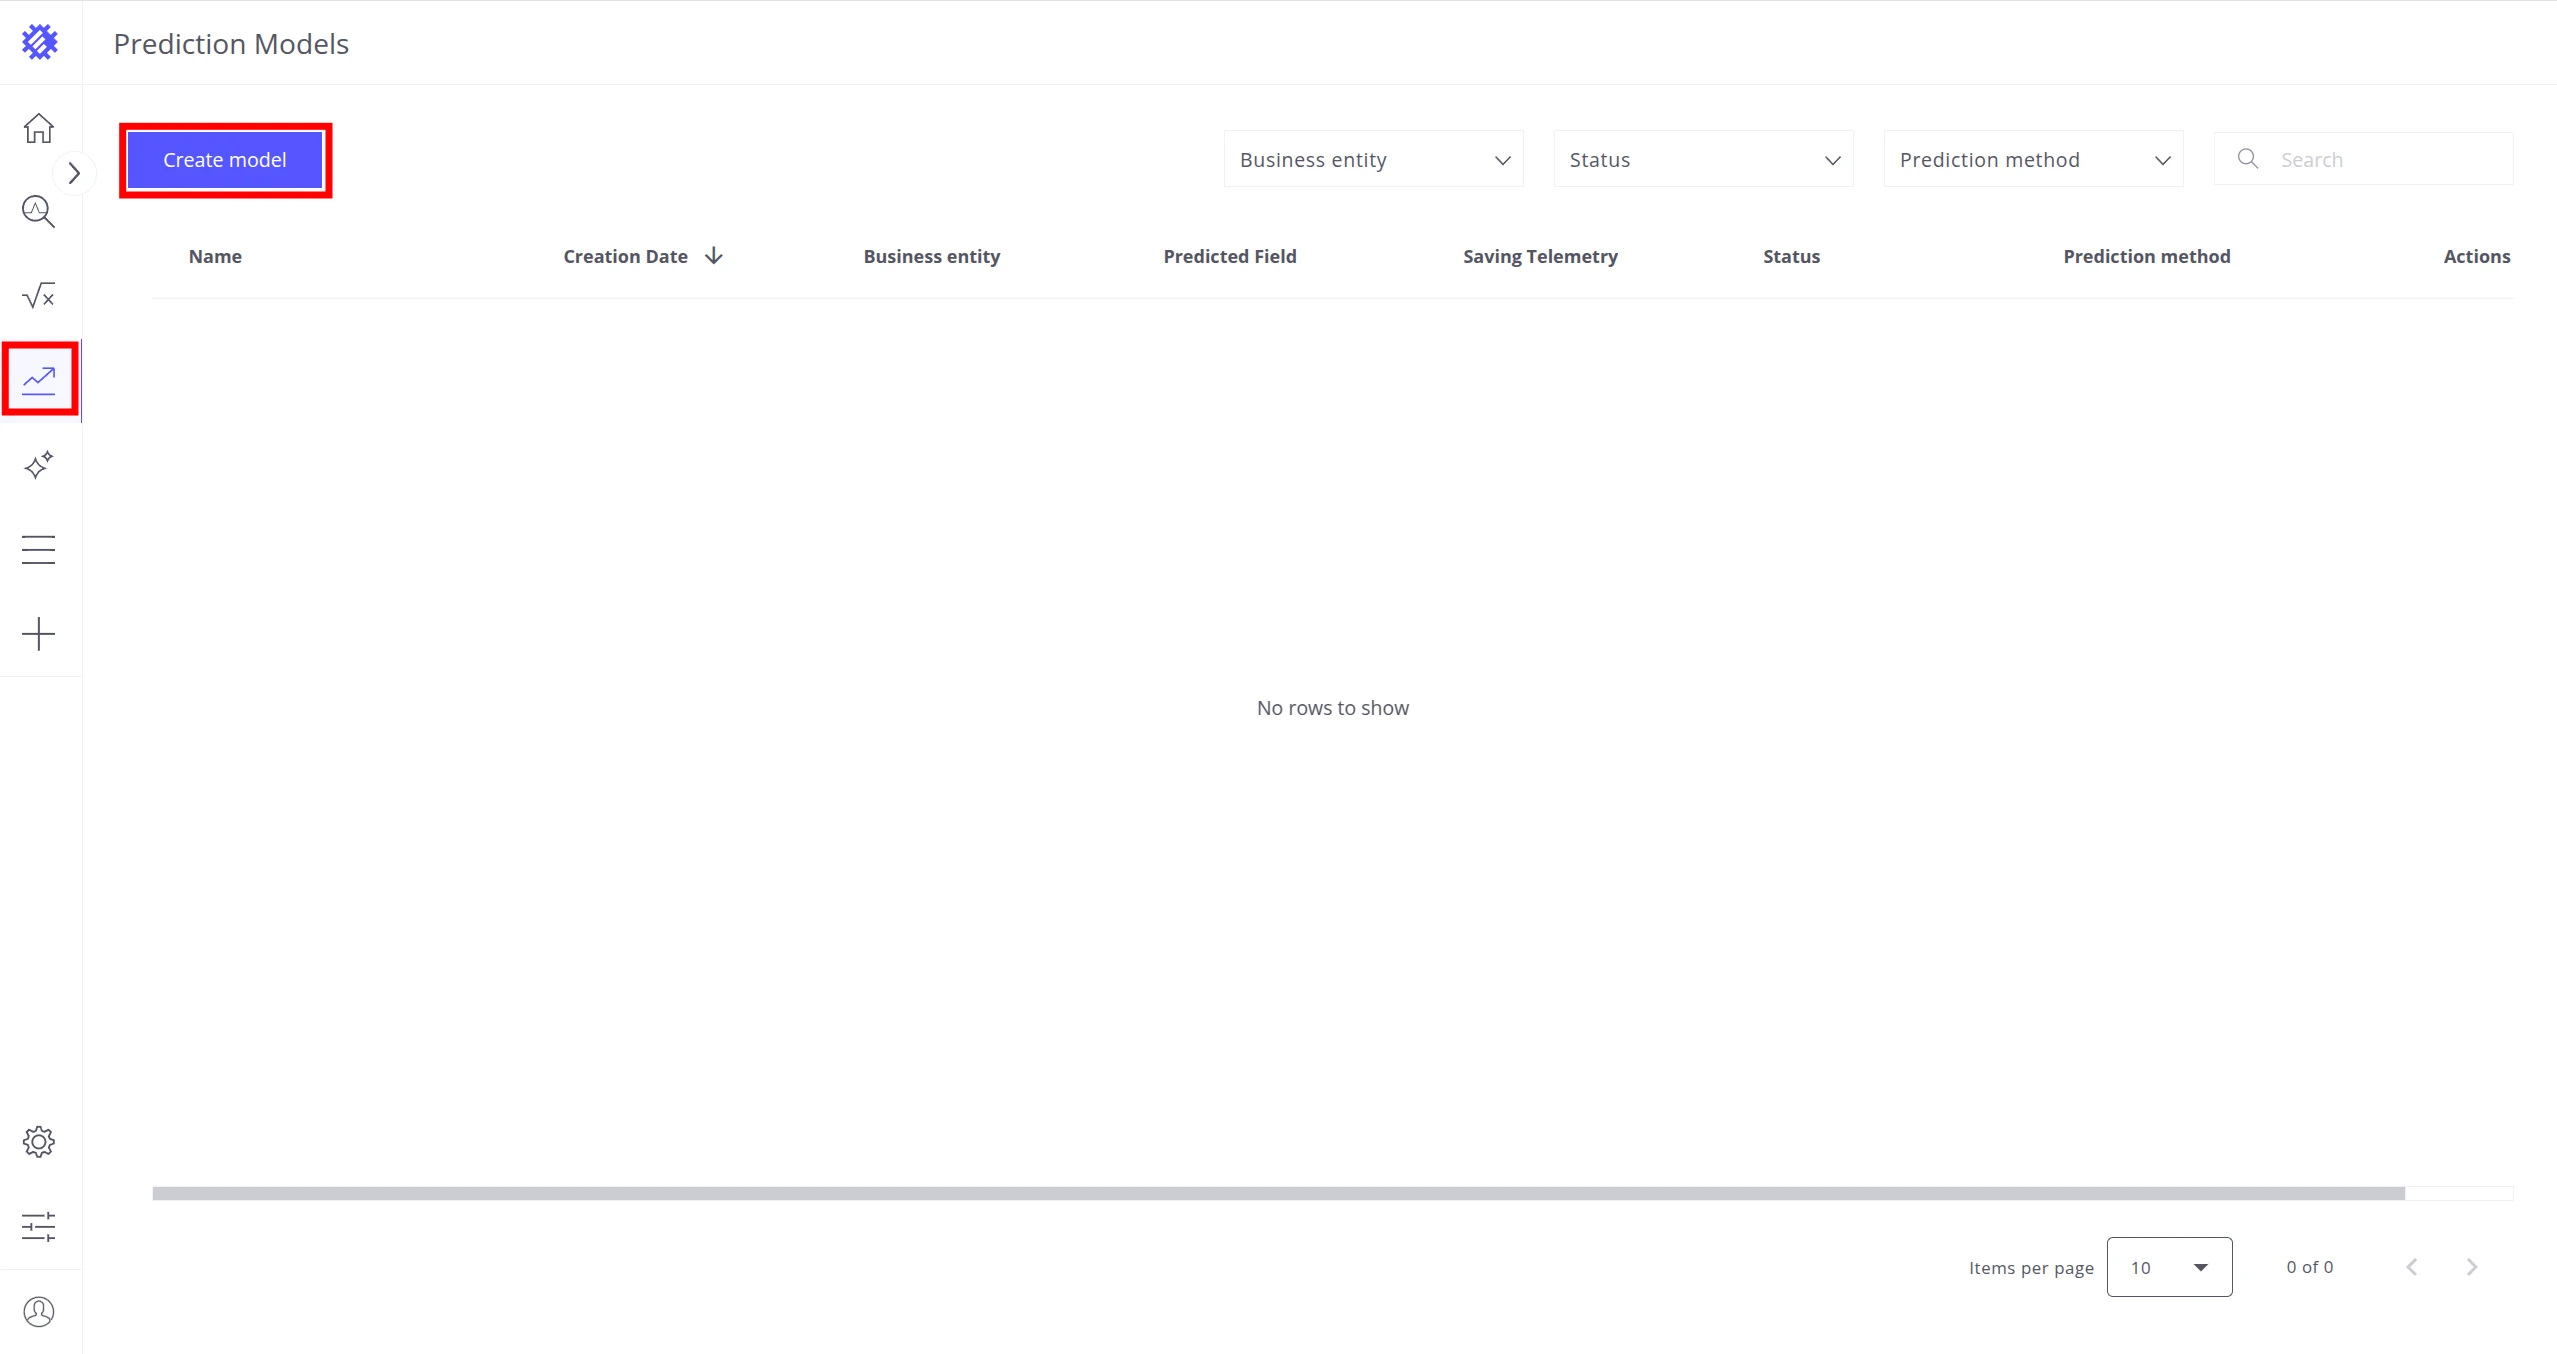
Section titled “Create a prediction model”-
Click the prediction icon on the left panel to open the Prediction Model page.
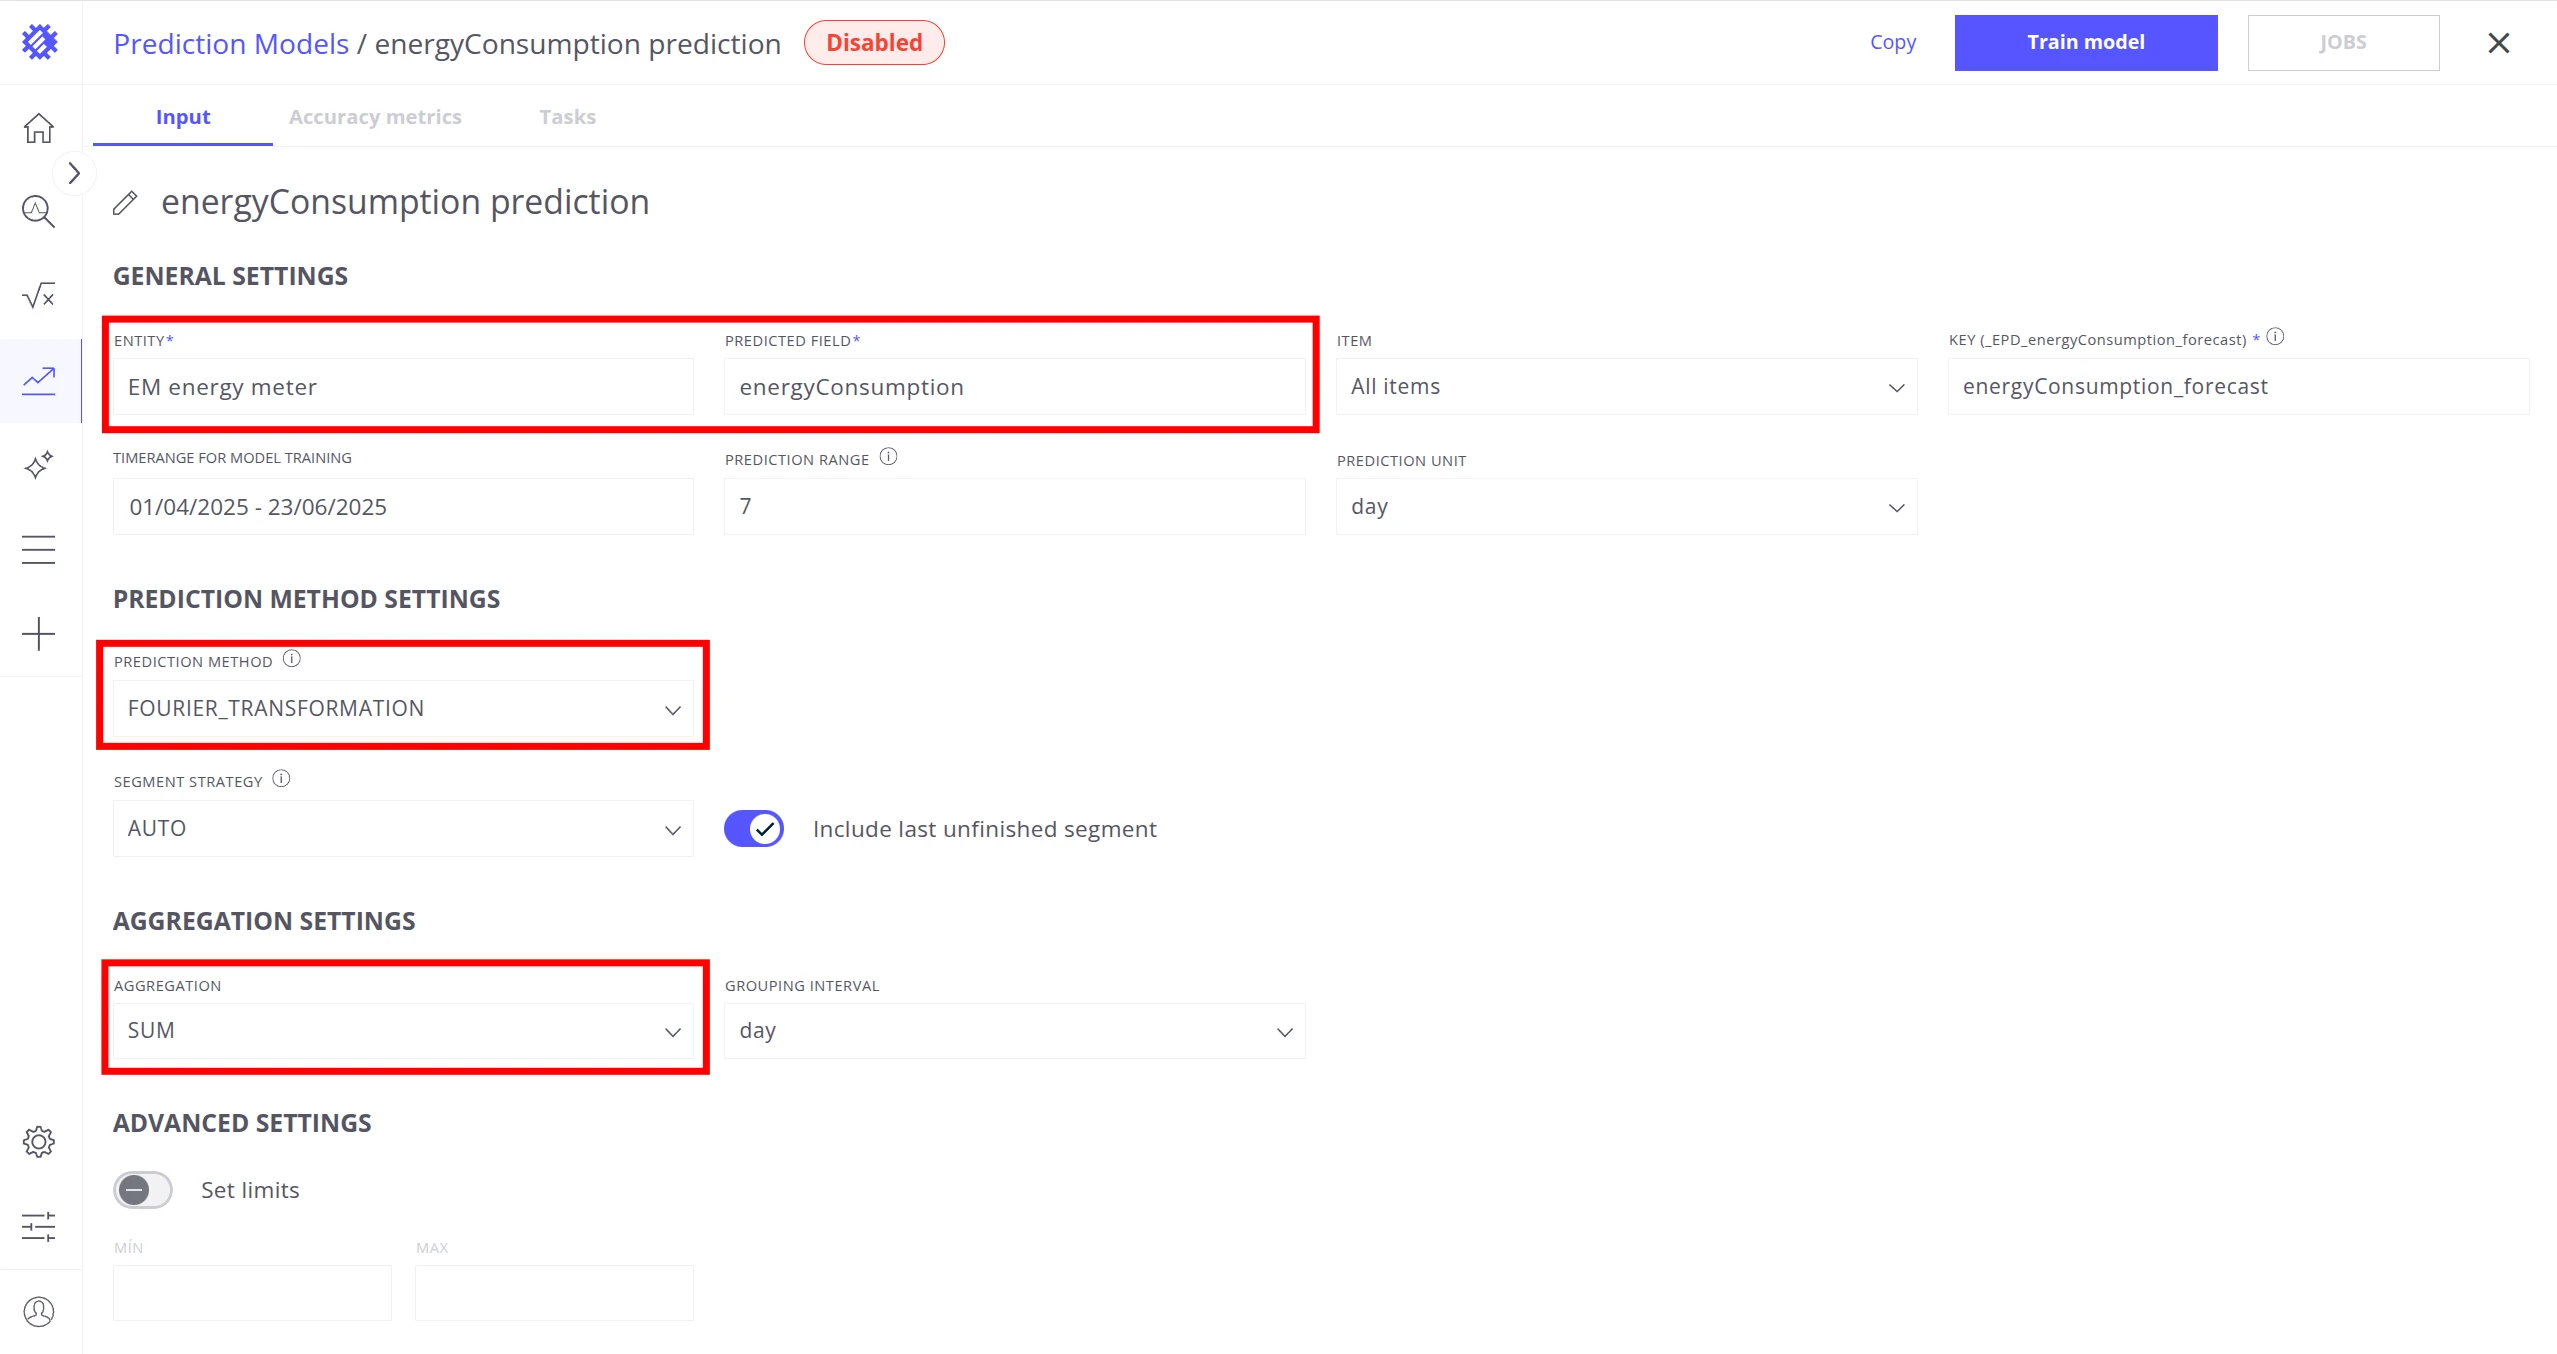
-
Click Create Model and configure:
- Entity:
EM energy meter - Prediction field:
energyConsumption - Prediction method:
FOURIER_TRANSFORMATION - Aggregation:
SUM
- Entity:
-
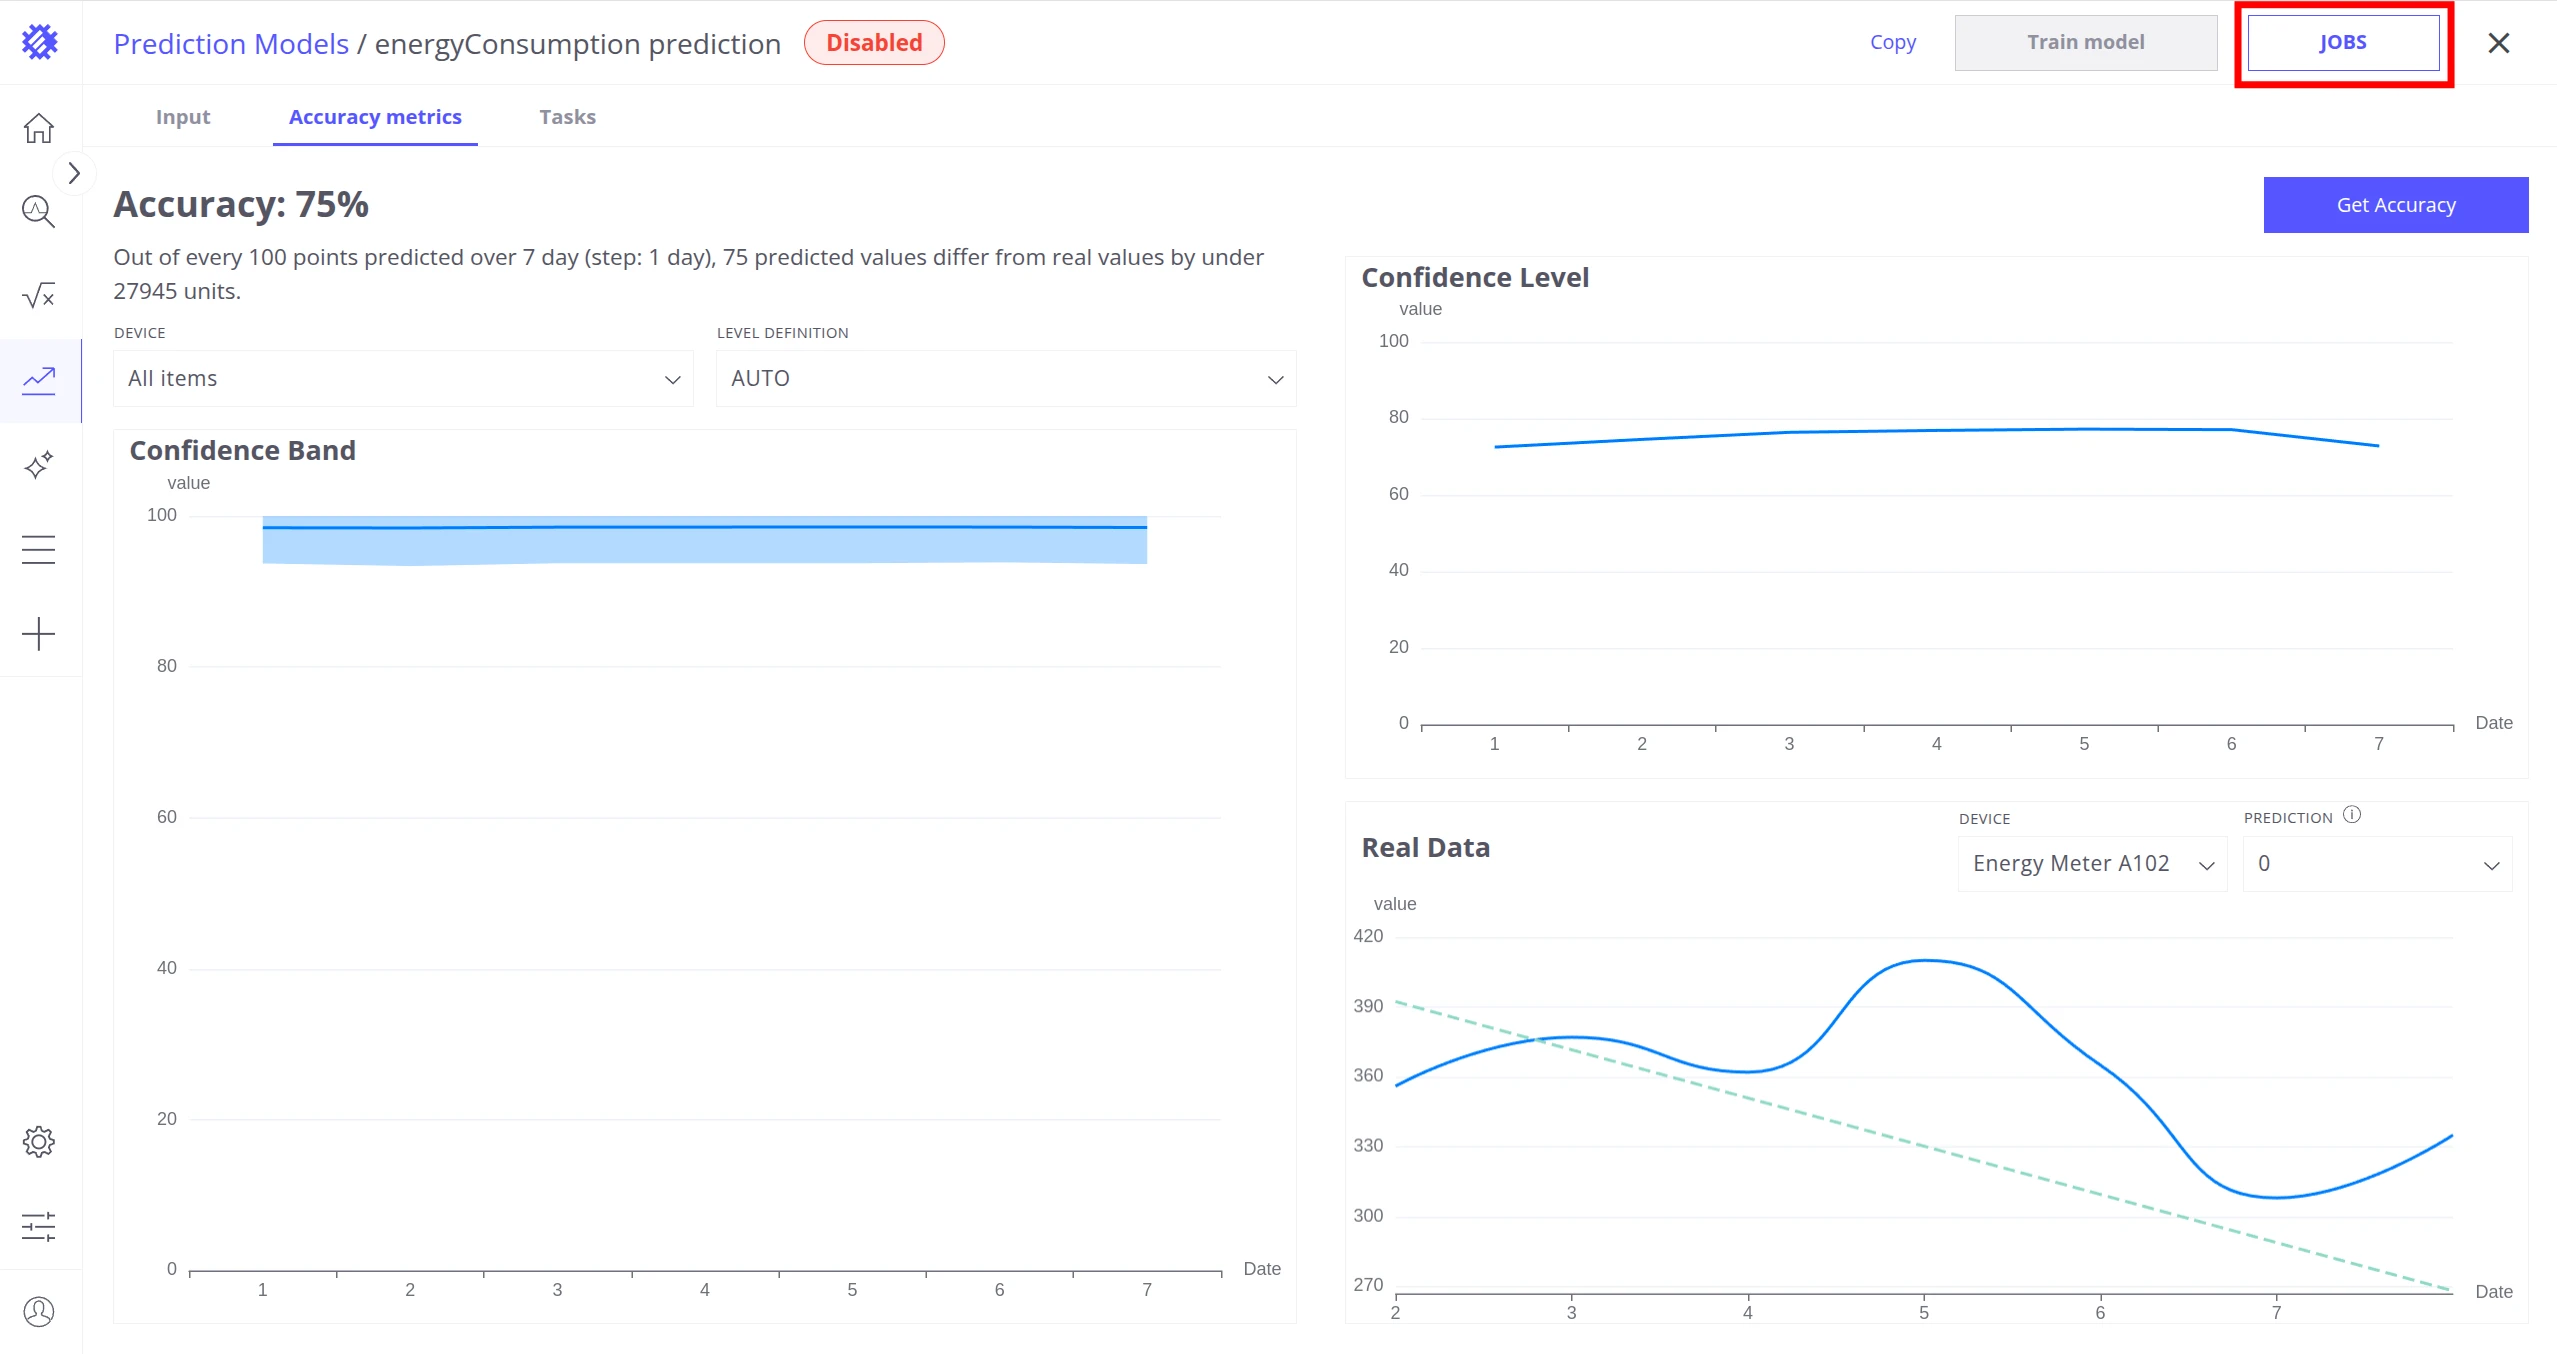
Click Train Model and wait for the accuracy tab to appear.
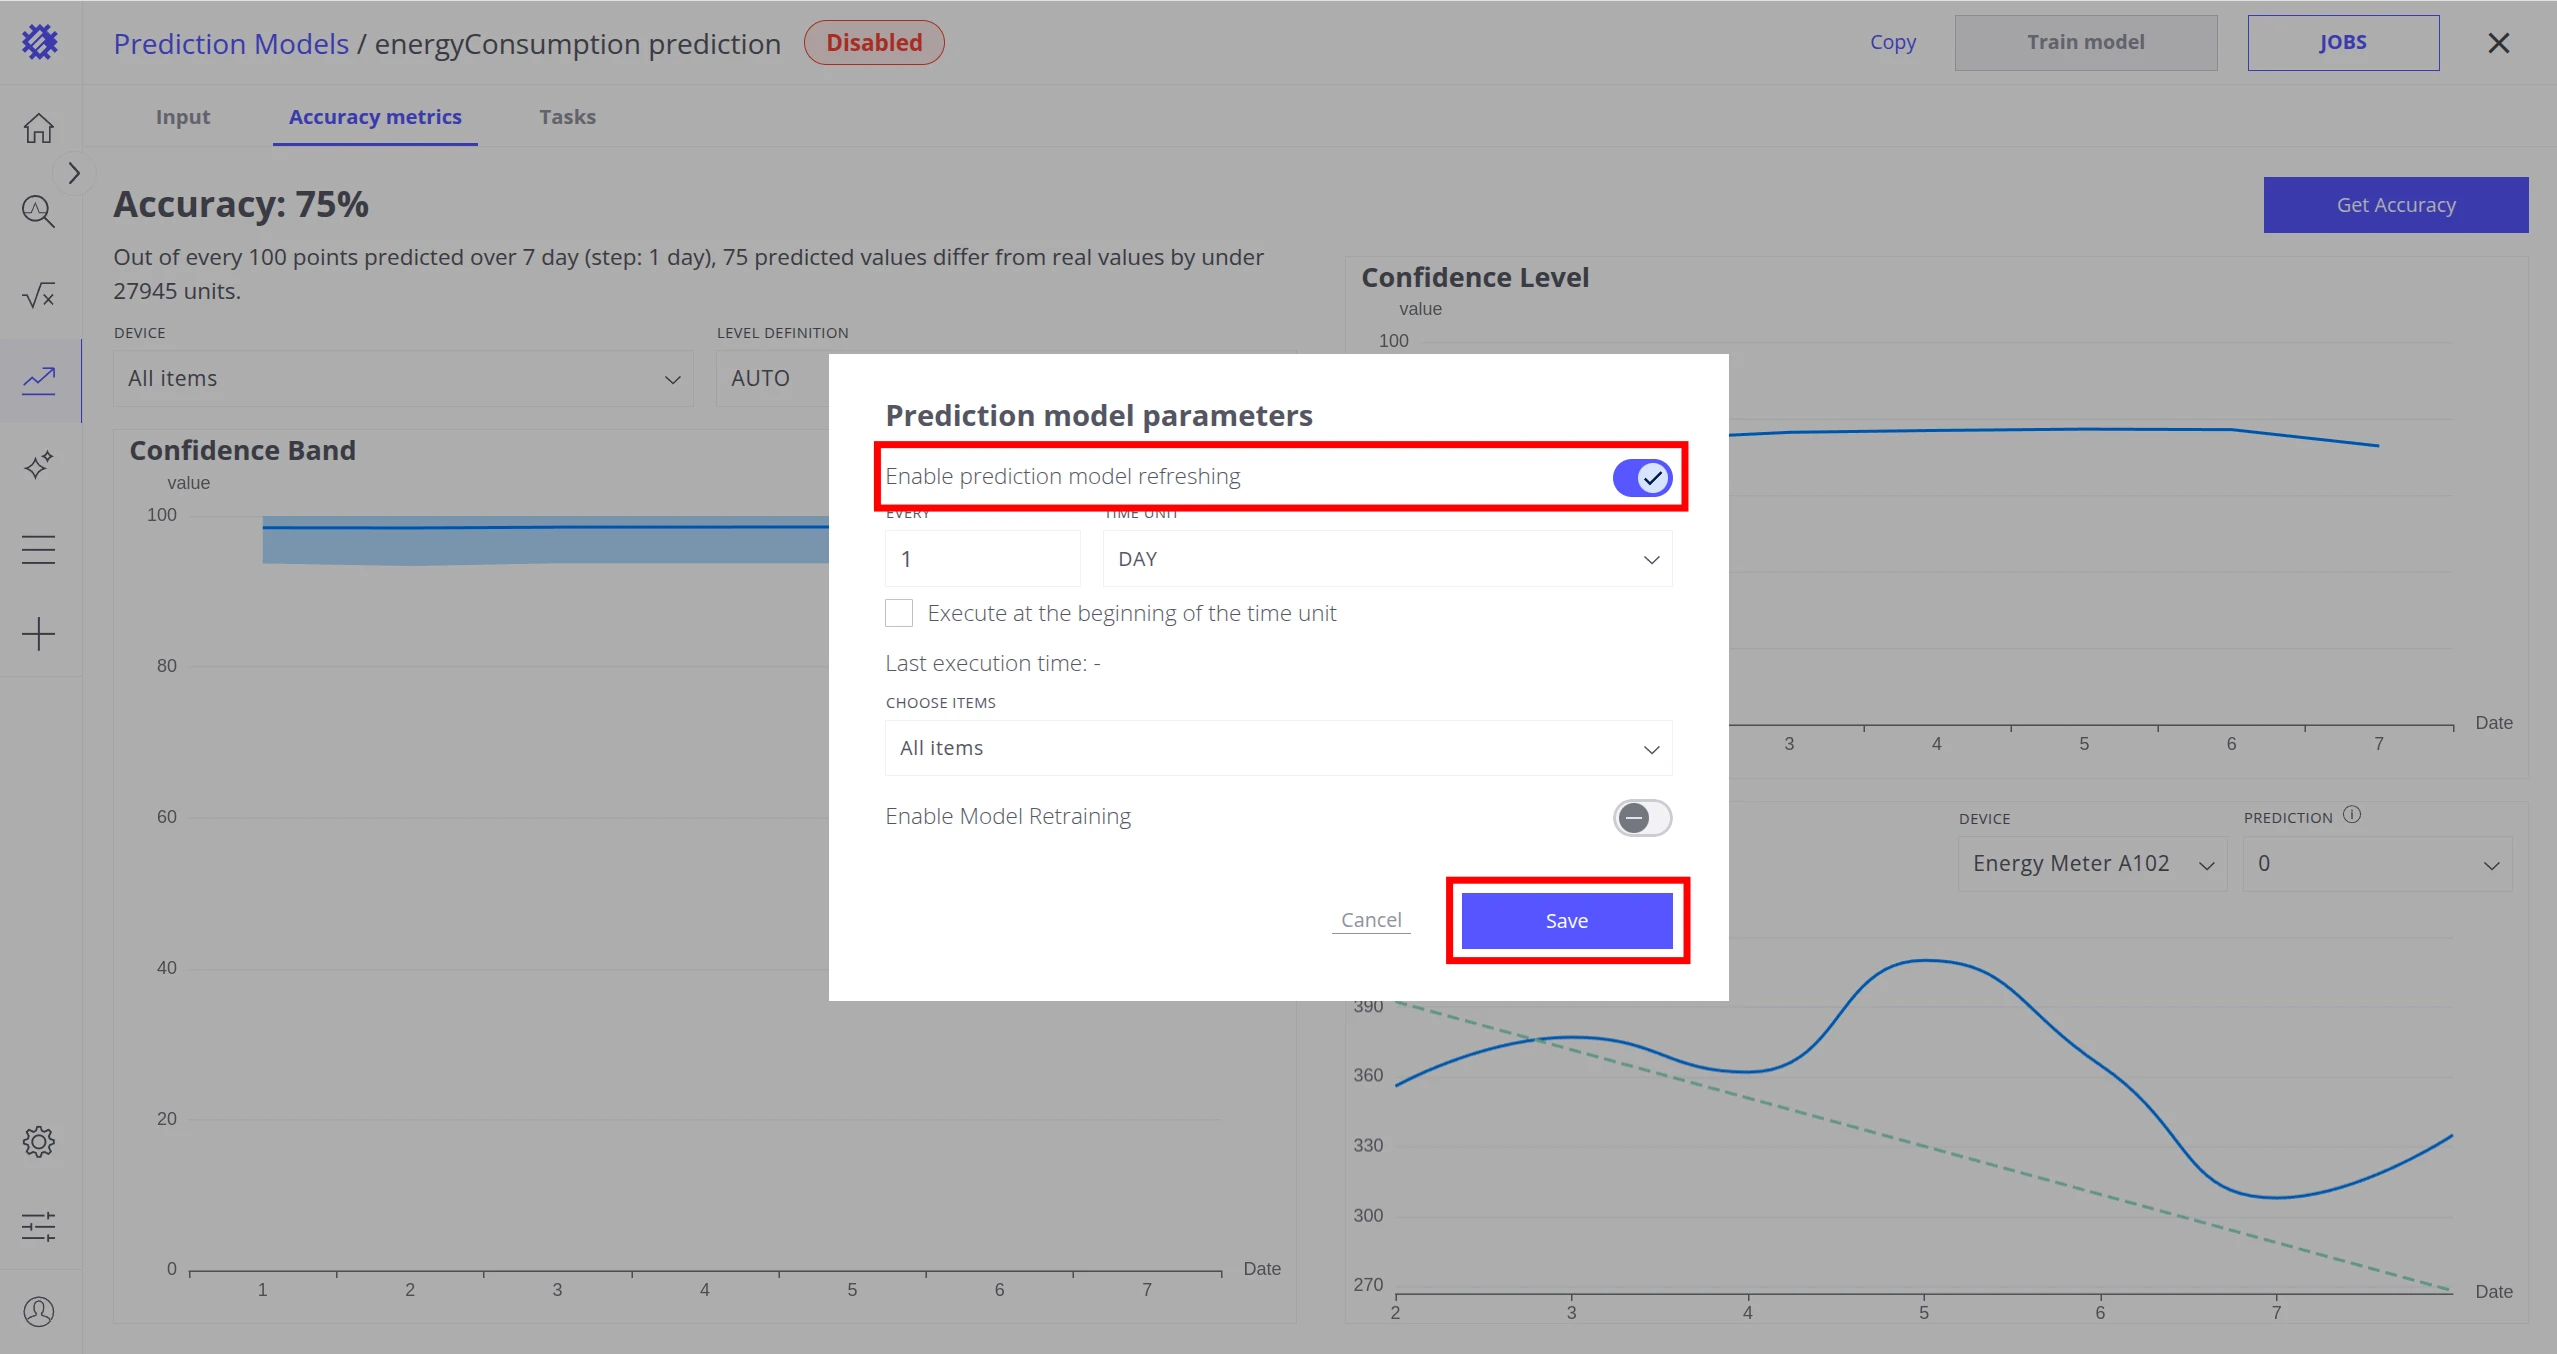
-
Click Jobs; in the pop-up, enable prediction model refreshing and click Save.
Create a view with forecast
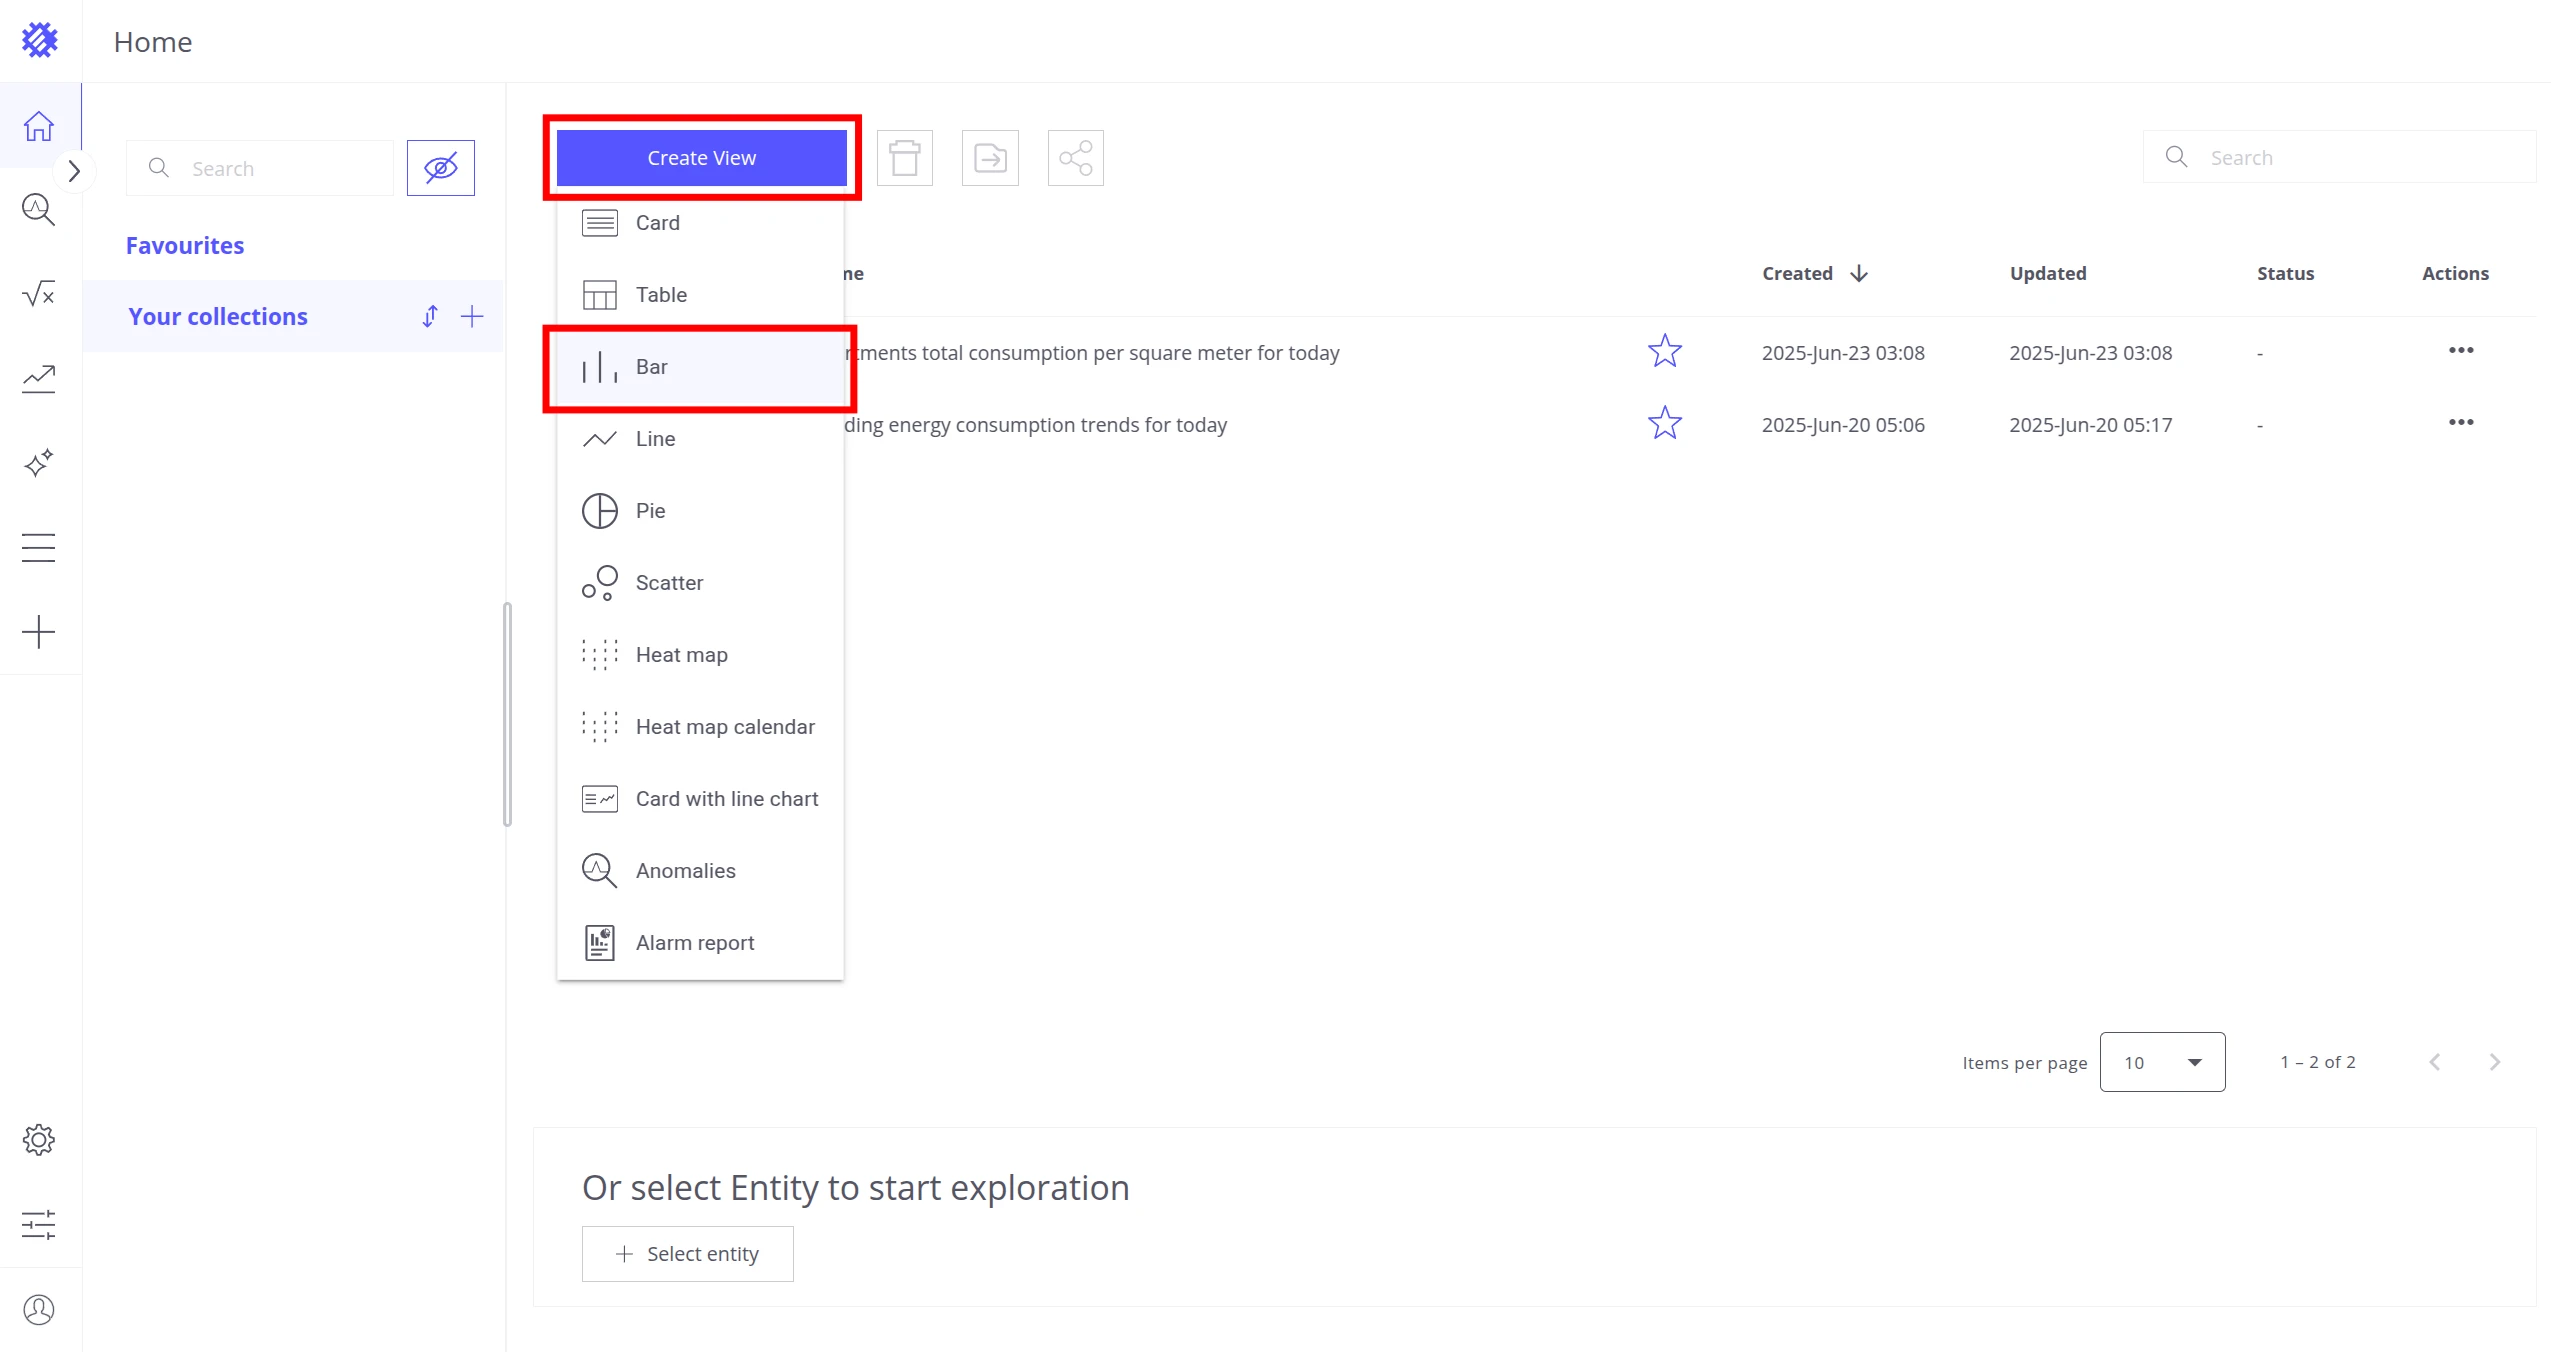
Section titled “Create a view with forecast”-
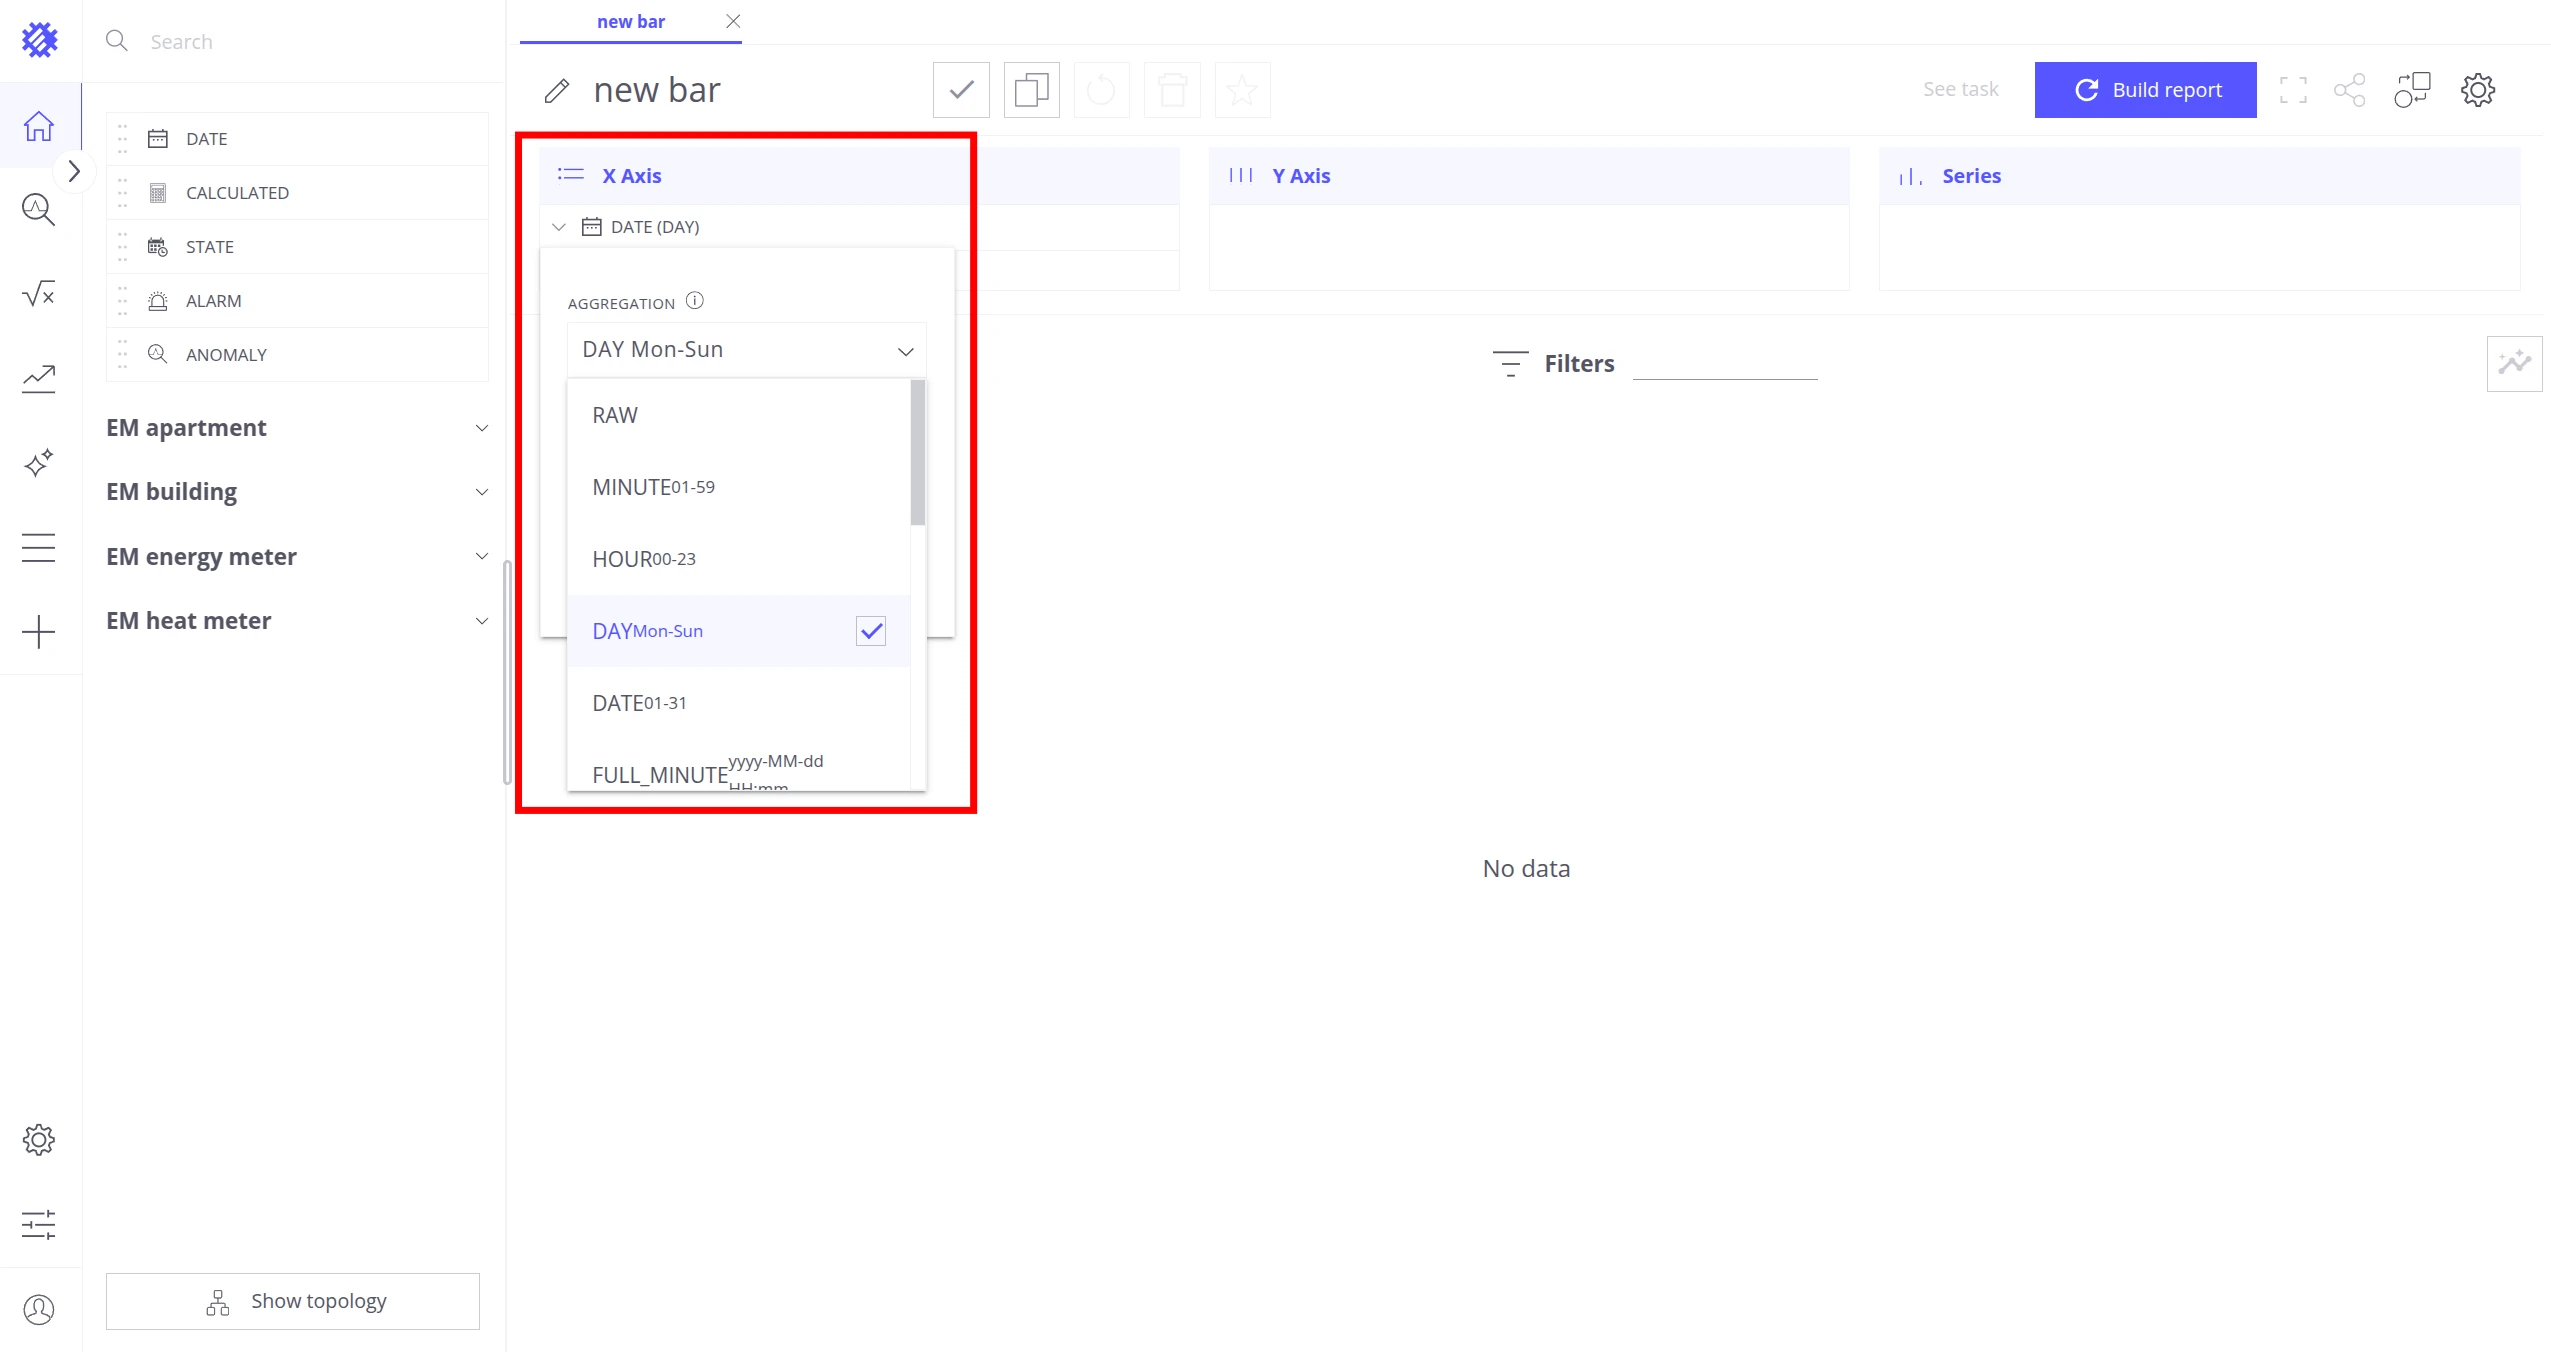
Click Create View and select Bar.
-
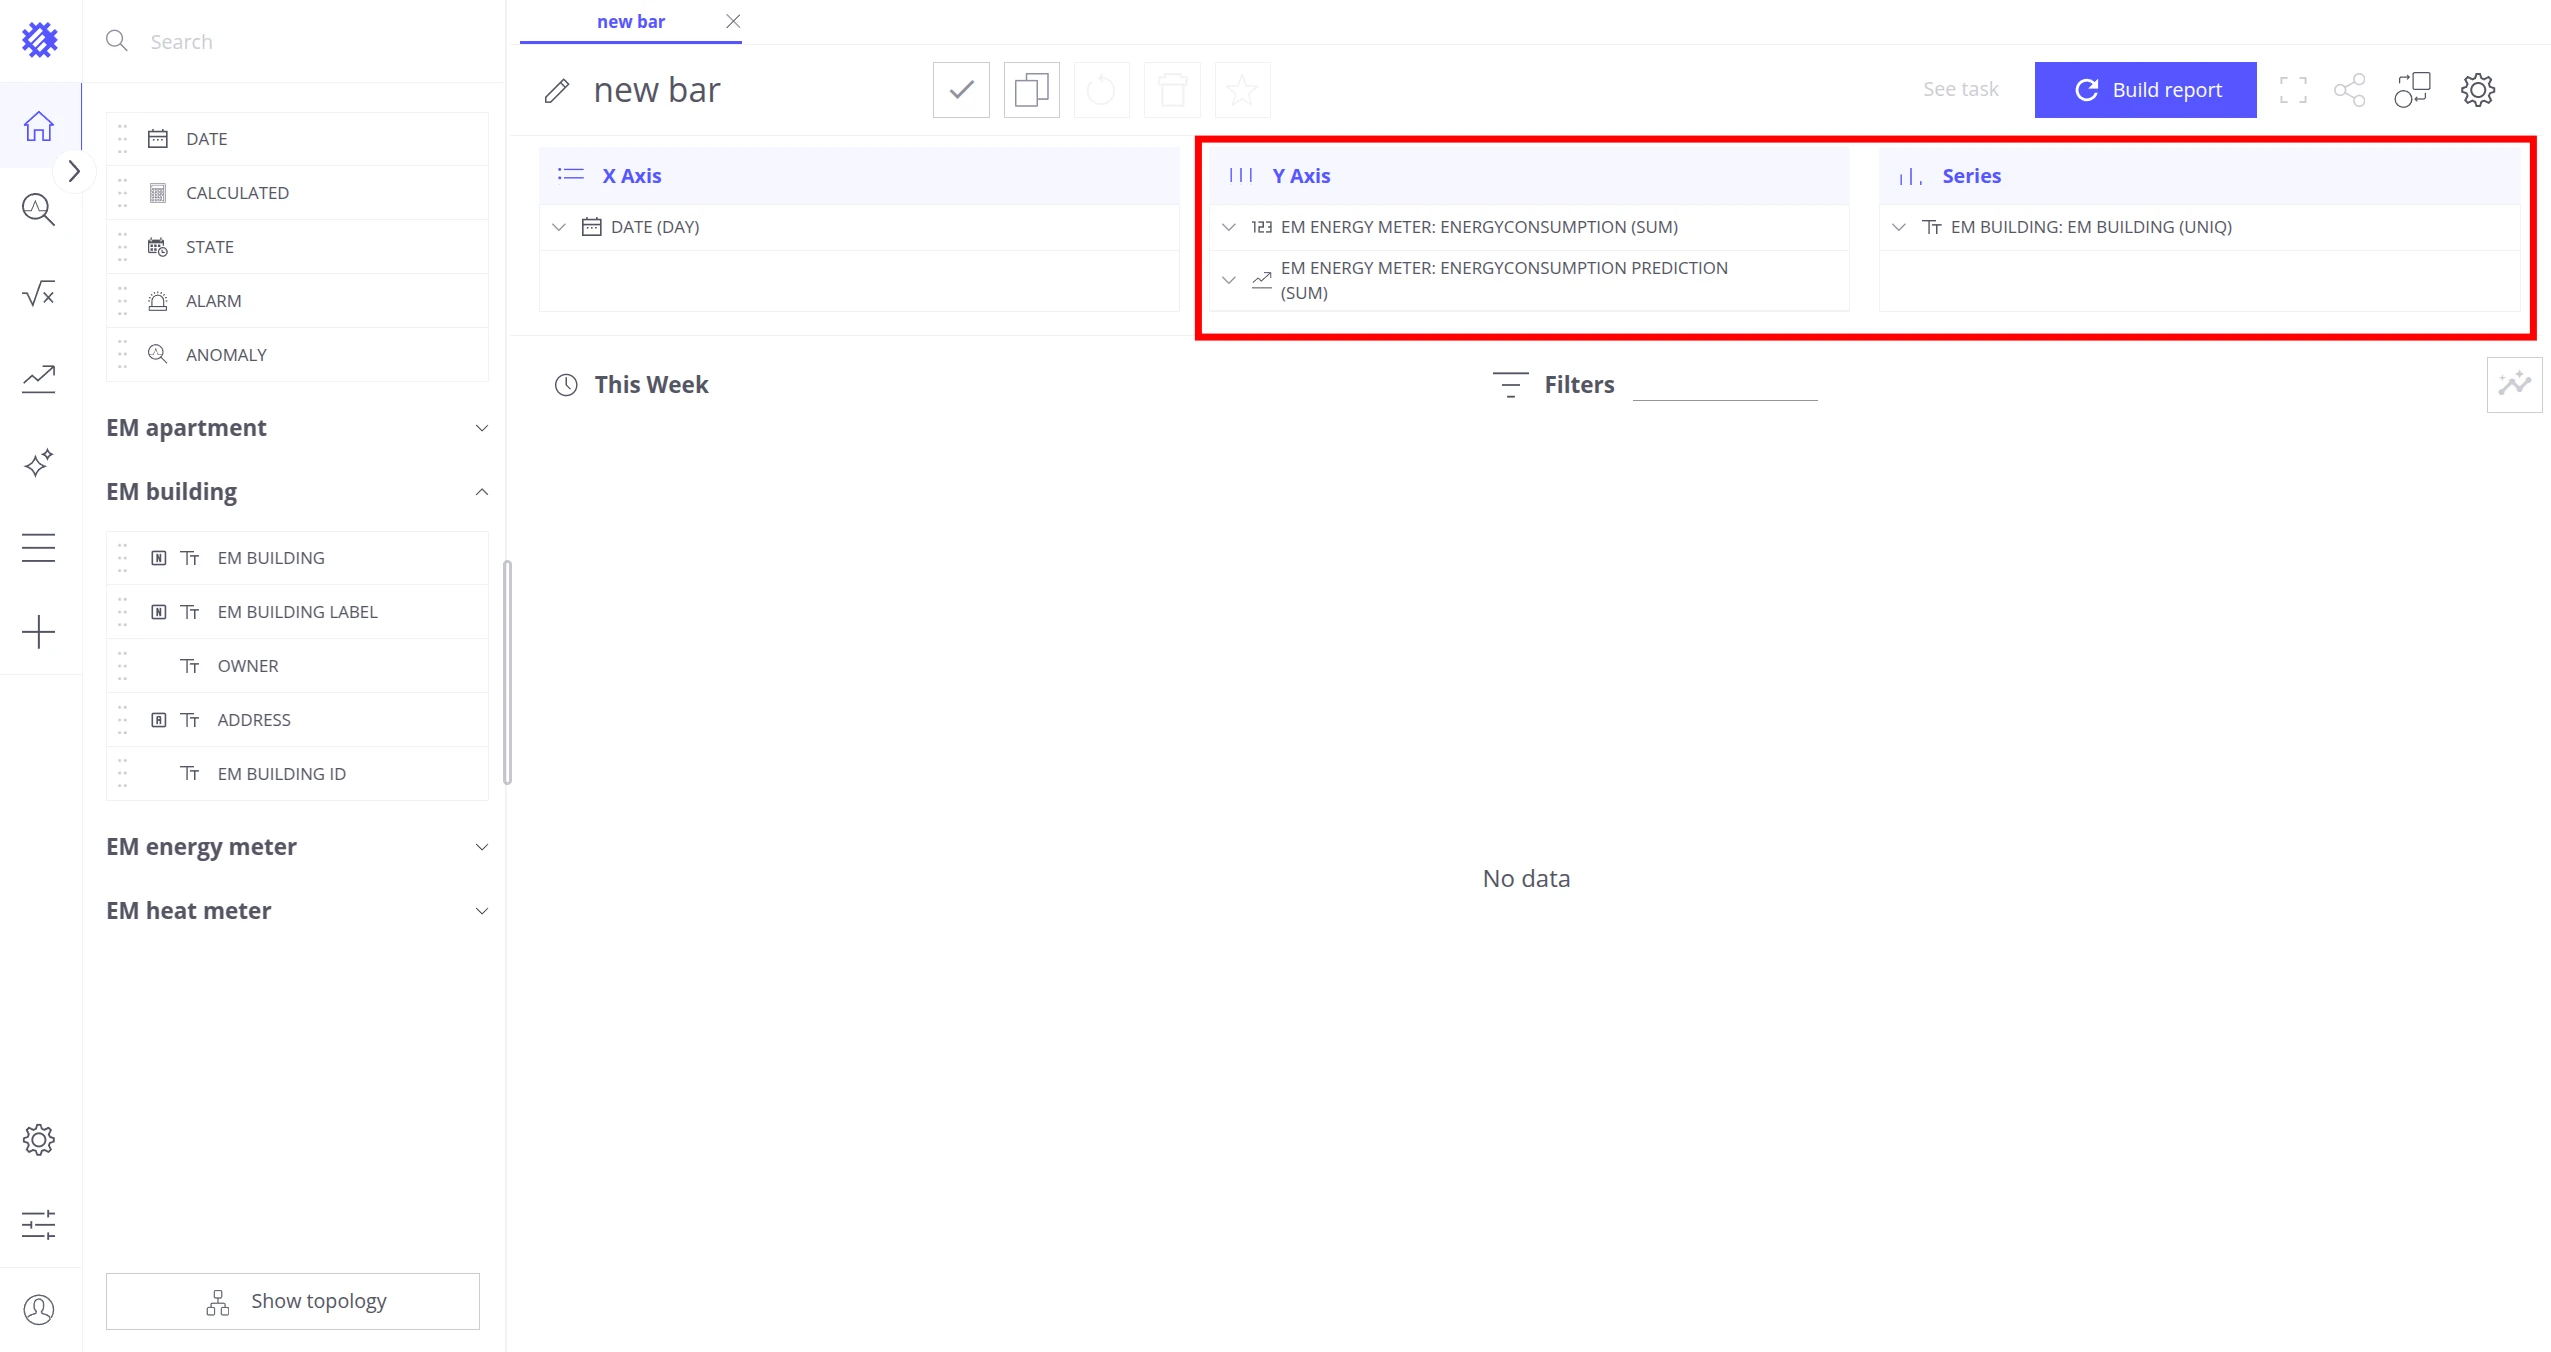
Add fields to each section:
- X axis:
Date (DAY Mon-Sun)(Click the date field in X axis, then choose the aggregation from the dropdown. Click anywhere to close it.) - Y axis:
EM energy meter.energyConsumptionandEM energy meter.Energy Consumption Forecast(The forecast field appears after the prediction model is enabled.) - Series:
EM building.EM building
- X axis:
-
Click Build Report.
-
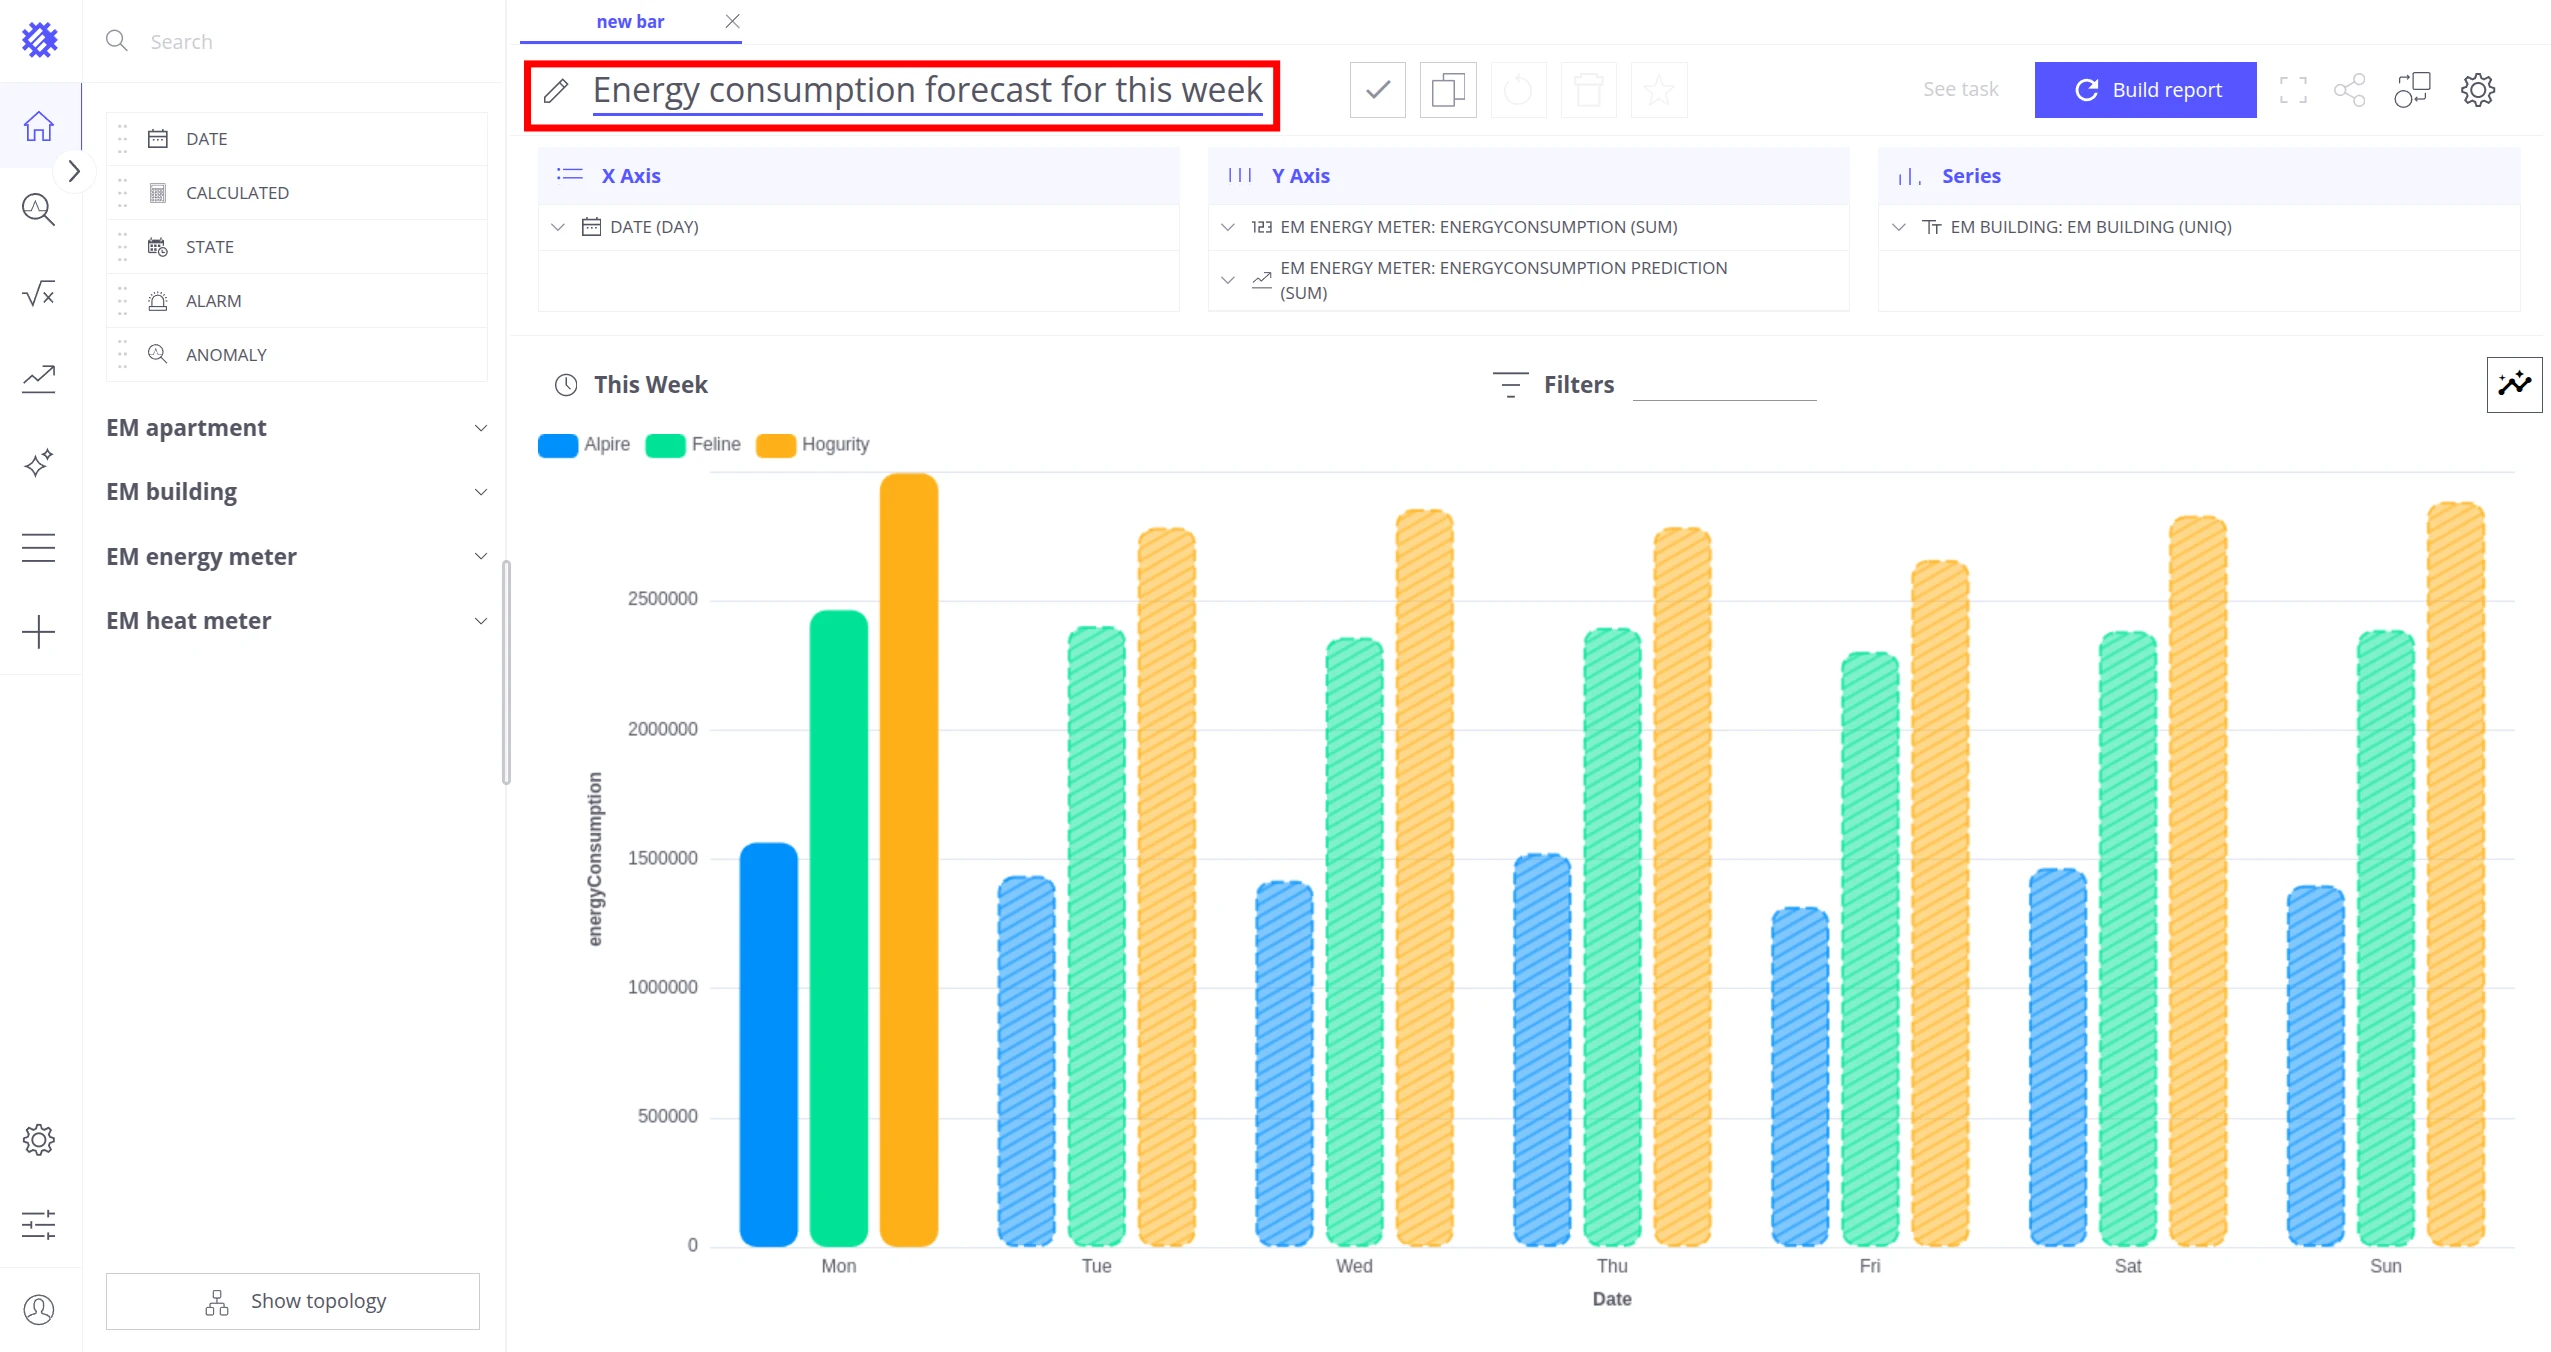
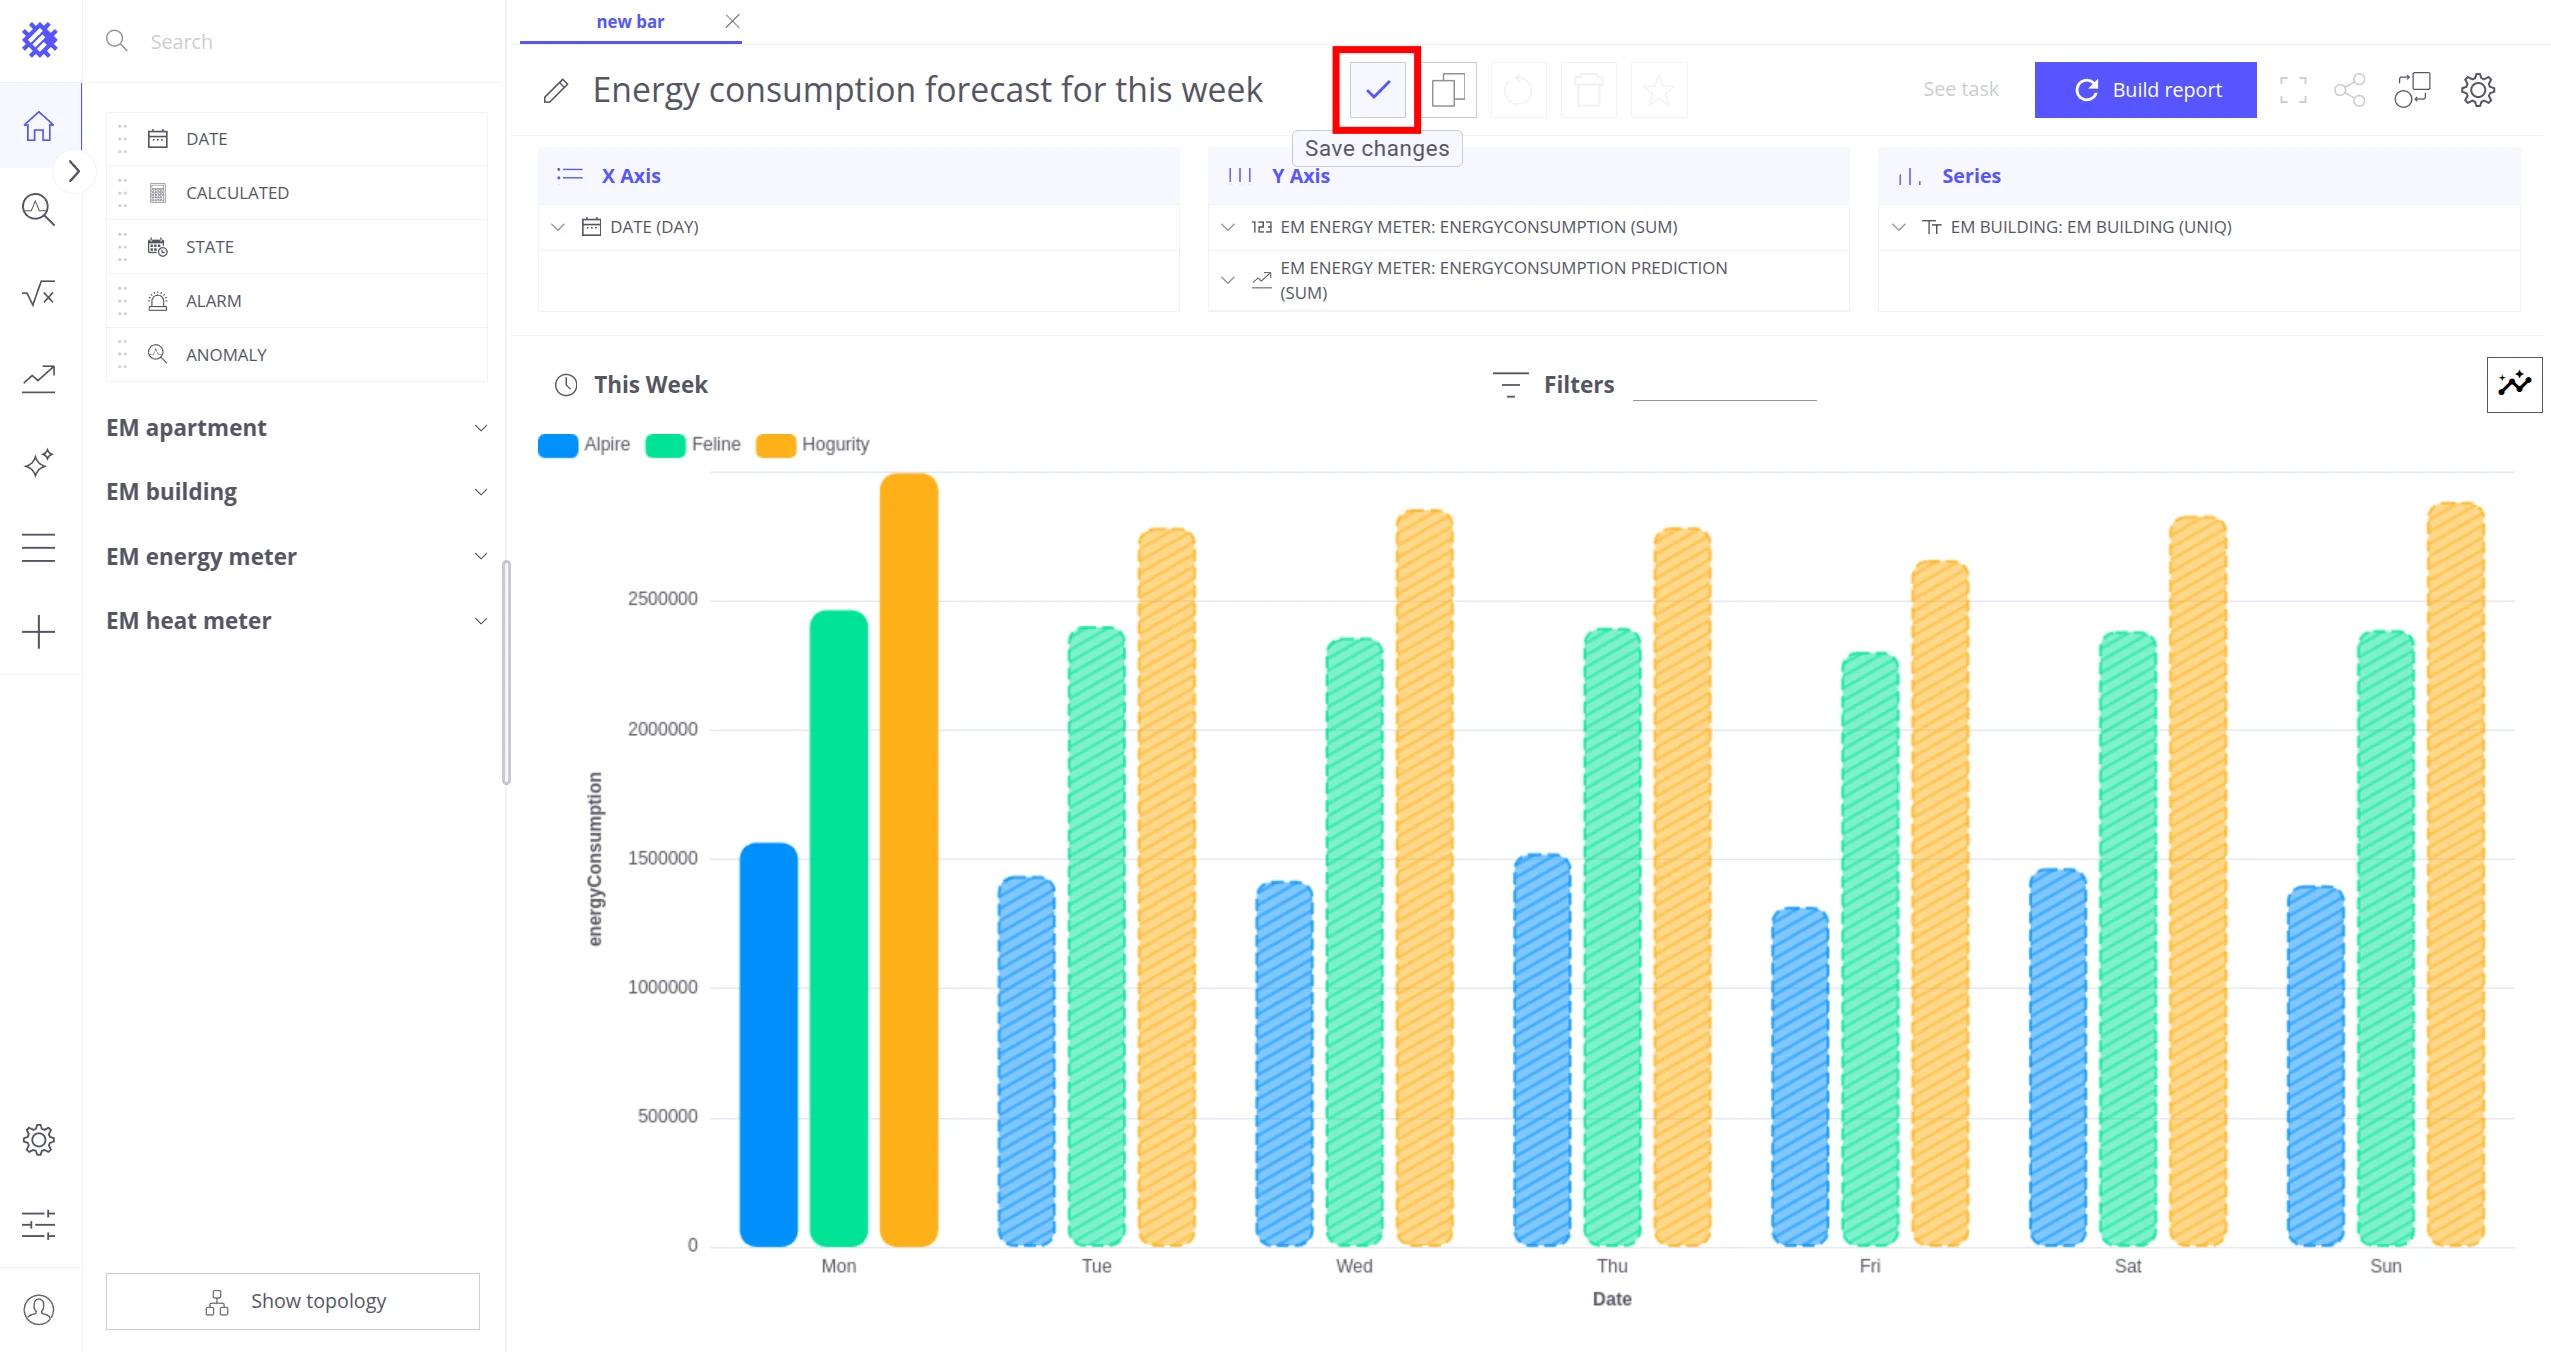
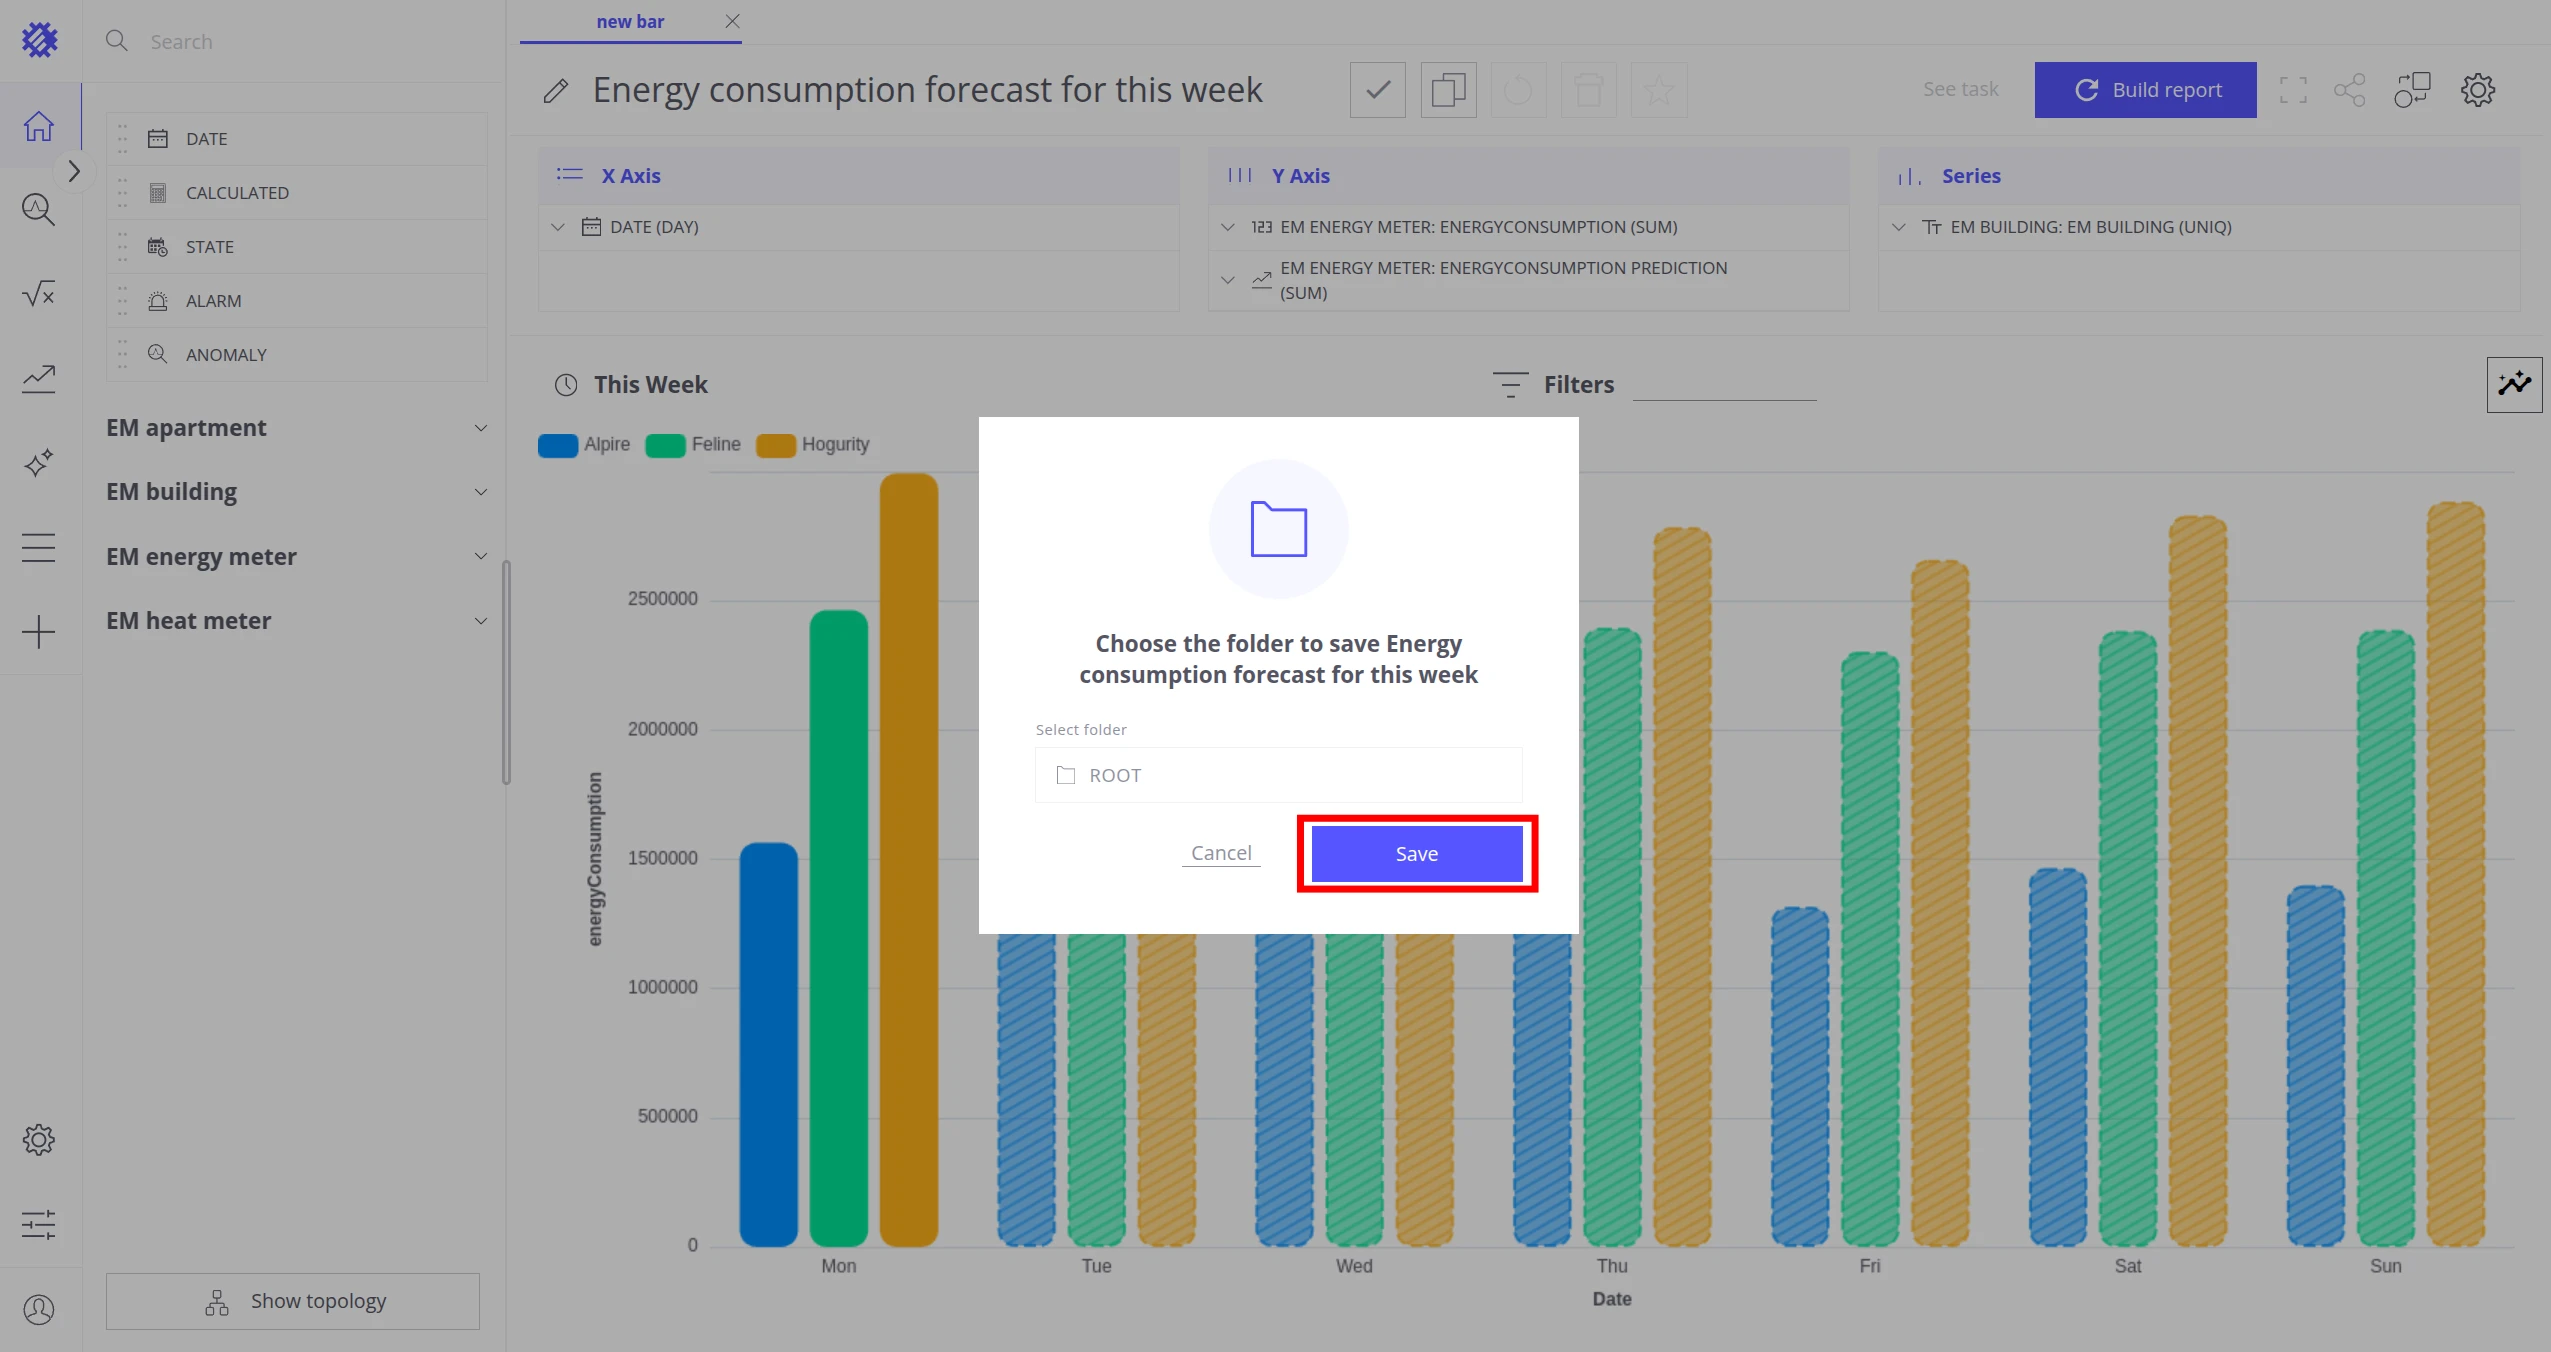
Rename the view to
Energy consumption forecast for this week. -
Click Save Changes, then Save in the pop-up.
Historical bars are solid; forecast bars are dashed. You can repeat this with a line chart to compare the styles.
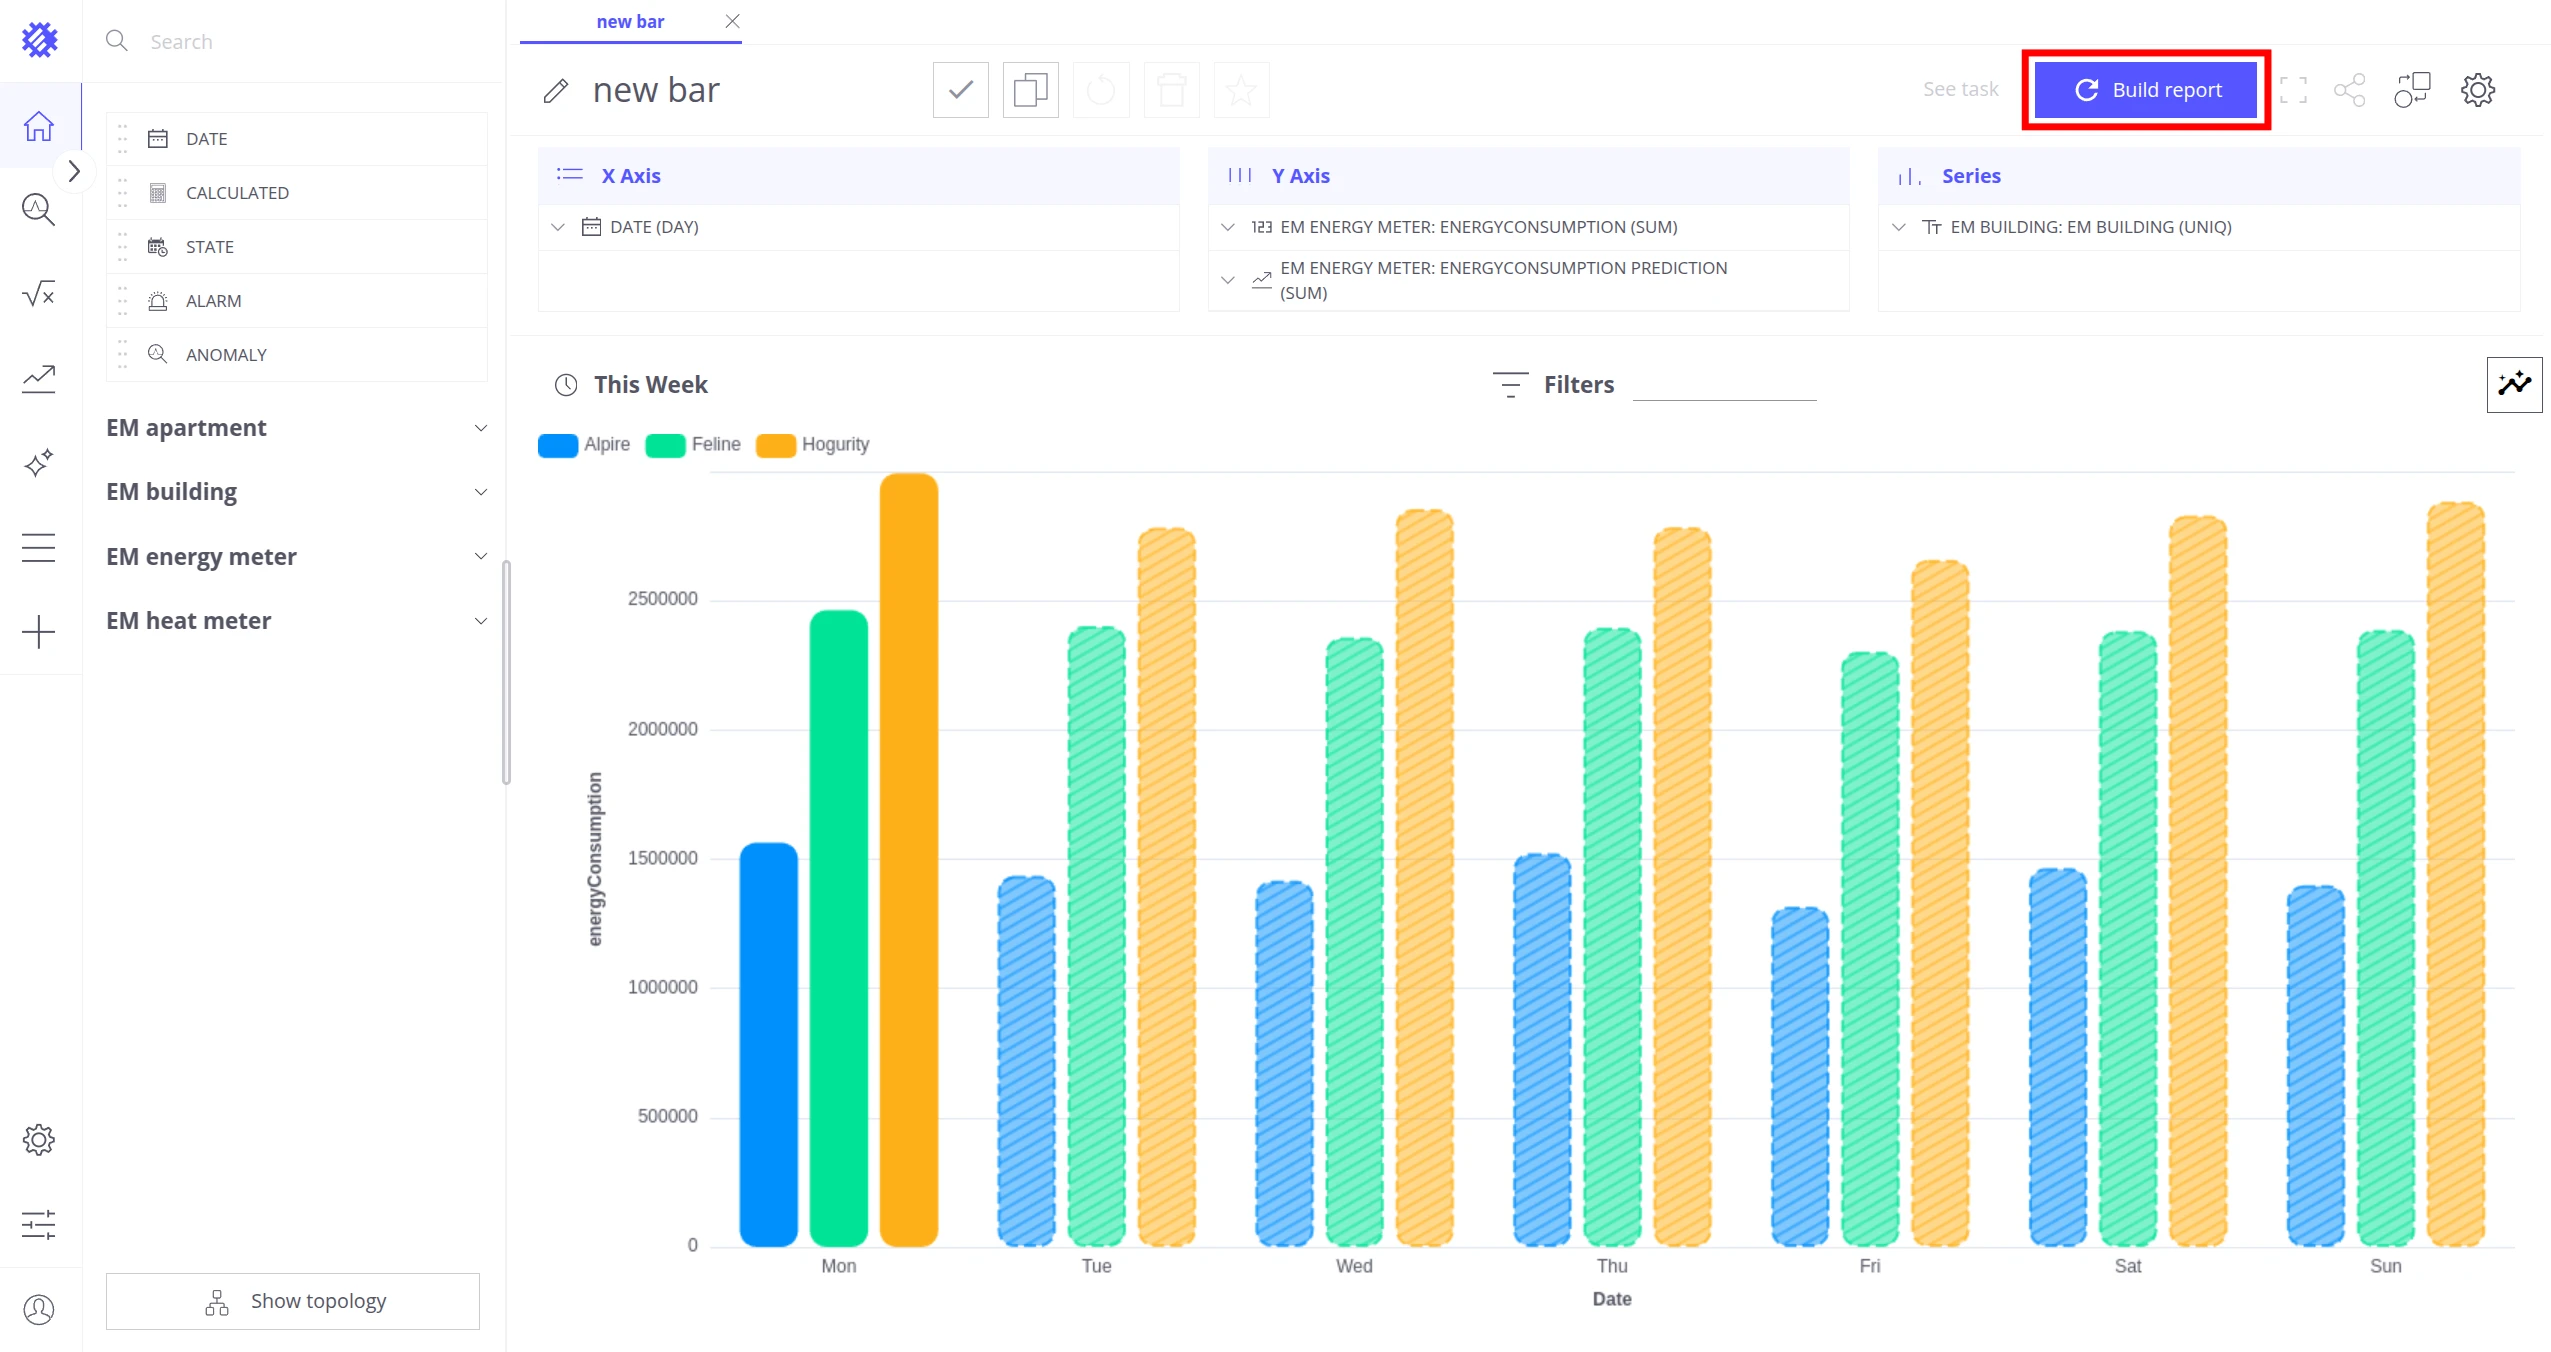
Now we have a Fourier transformation prediction model trained on energy consumption data, refreshing automatically as new data arrives, and a bar chart that visualizes historical consumption alongside the forecast for the current week.
Read more in Prediction.
Step 7. Find anomalies in energy consumption
Section titled “Step 7. Find anomalies in energy consumption”-
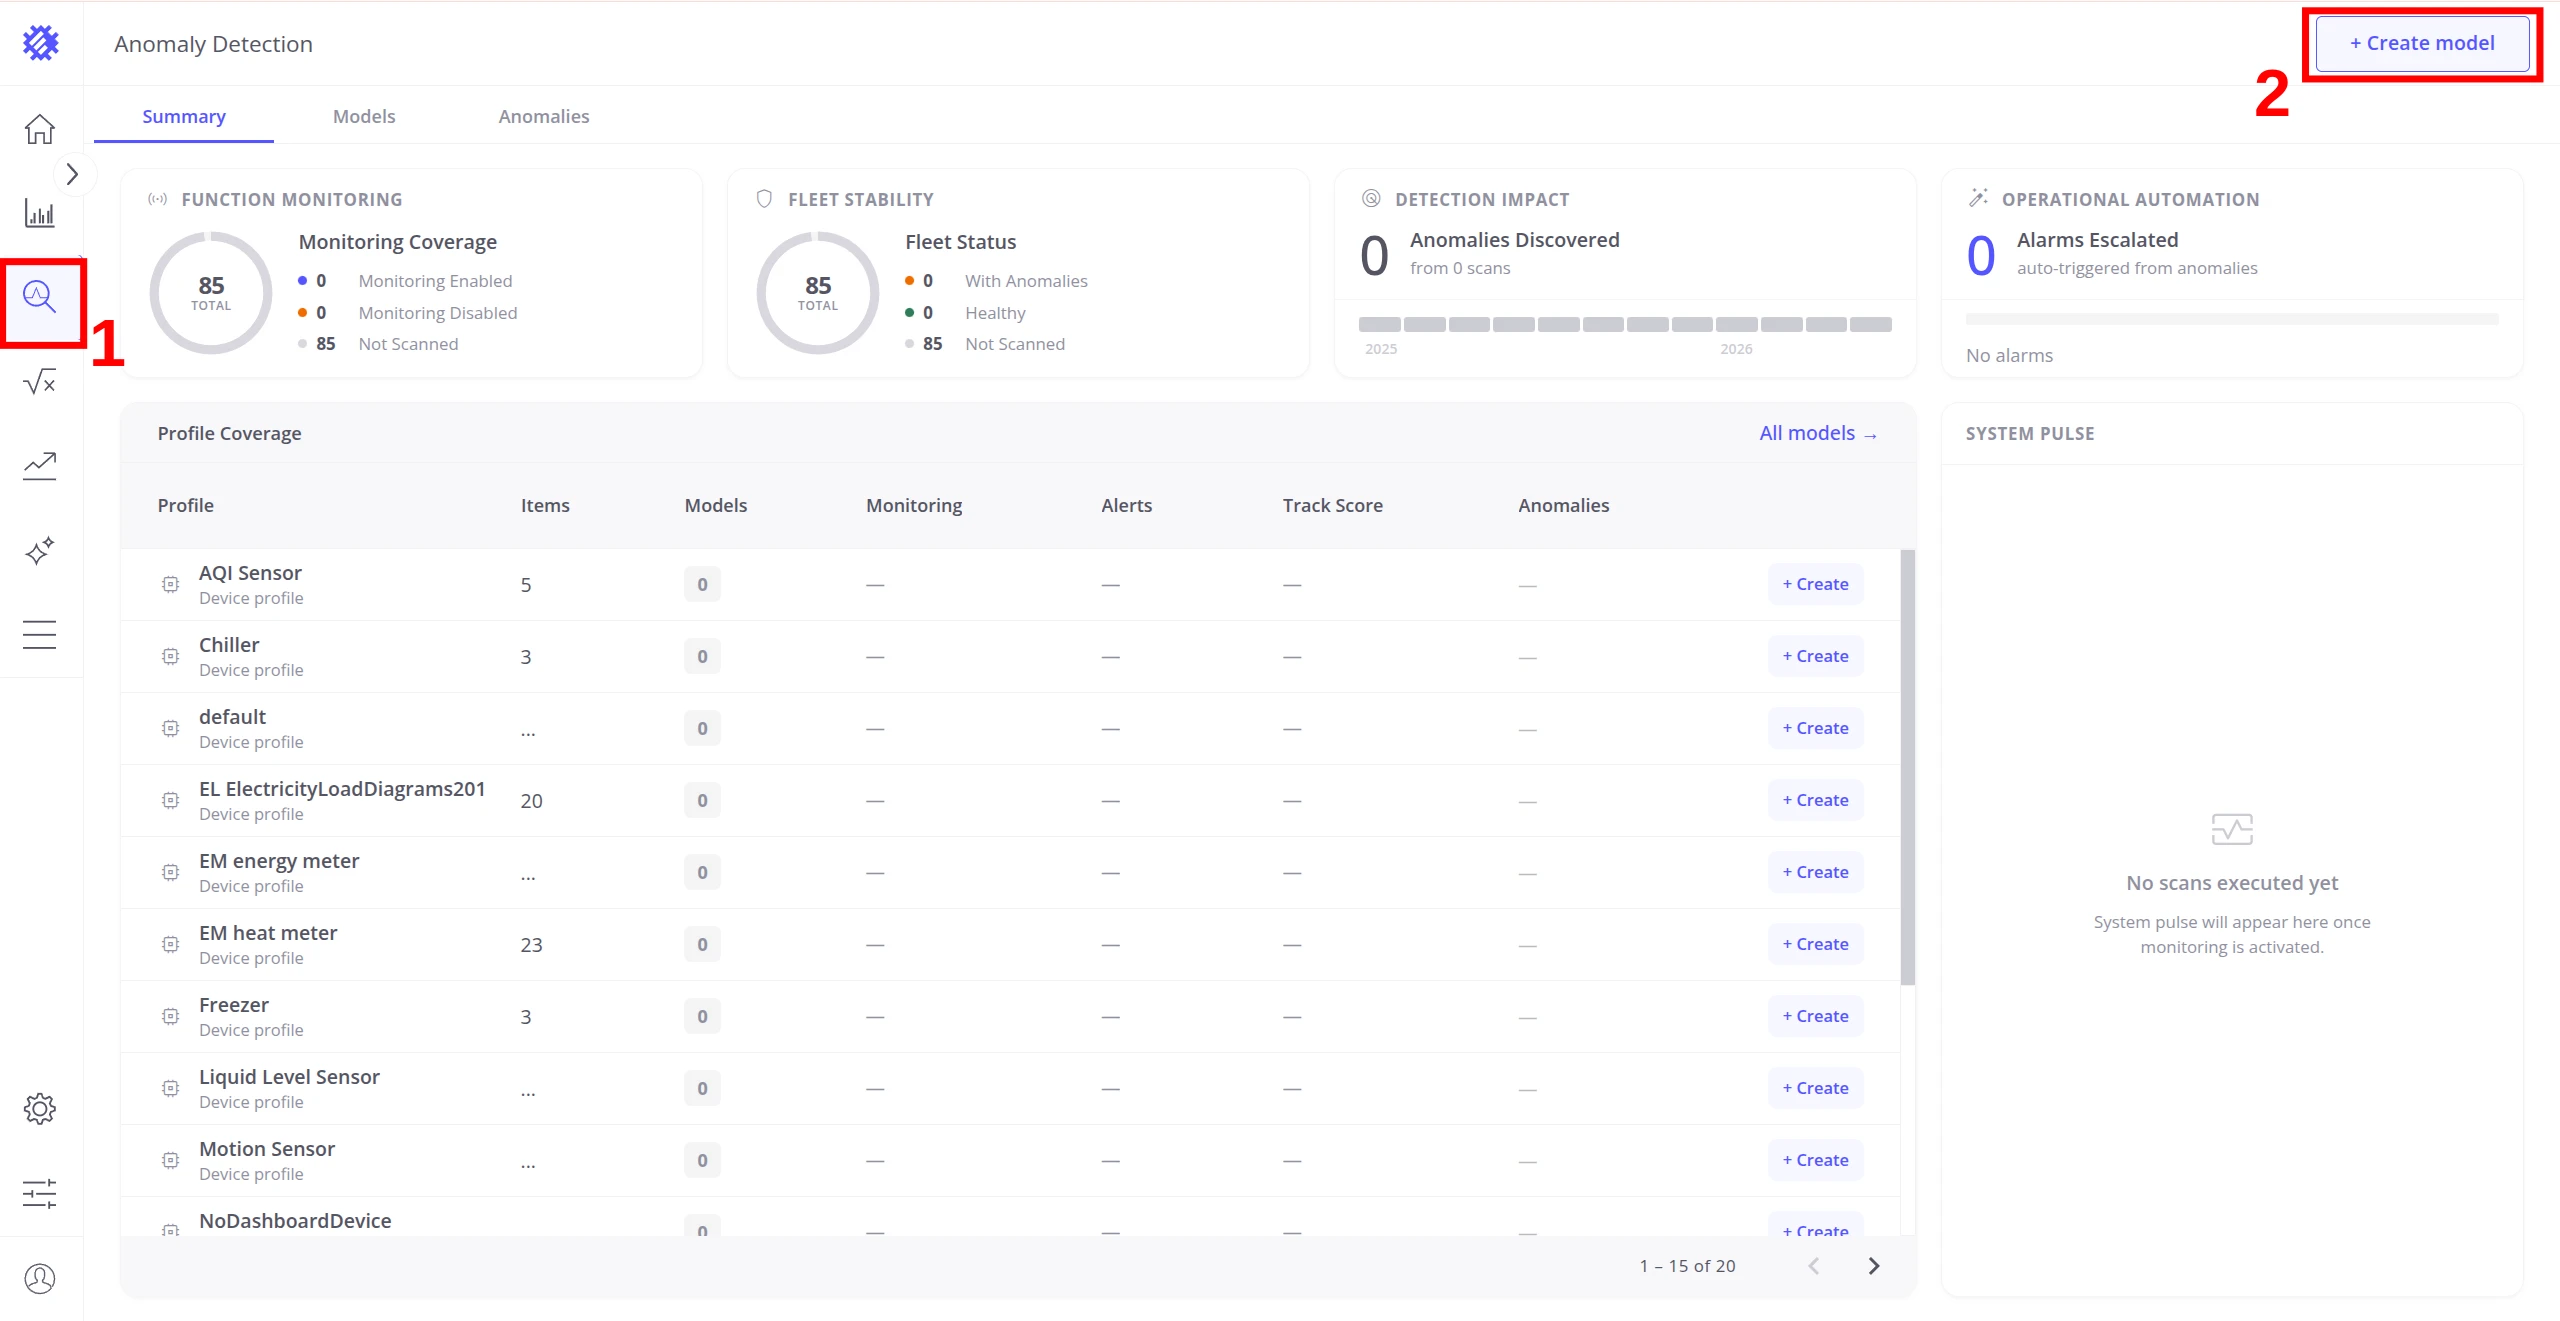
Click the Anomaly Detection icon on the left panel. The Summary tab opens — it shows coverage, fleet health, and detected anomalies across all models.
-
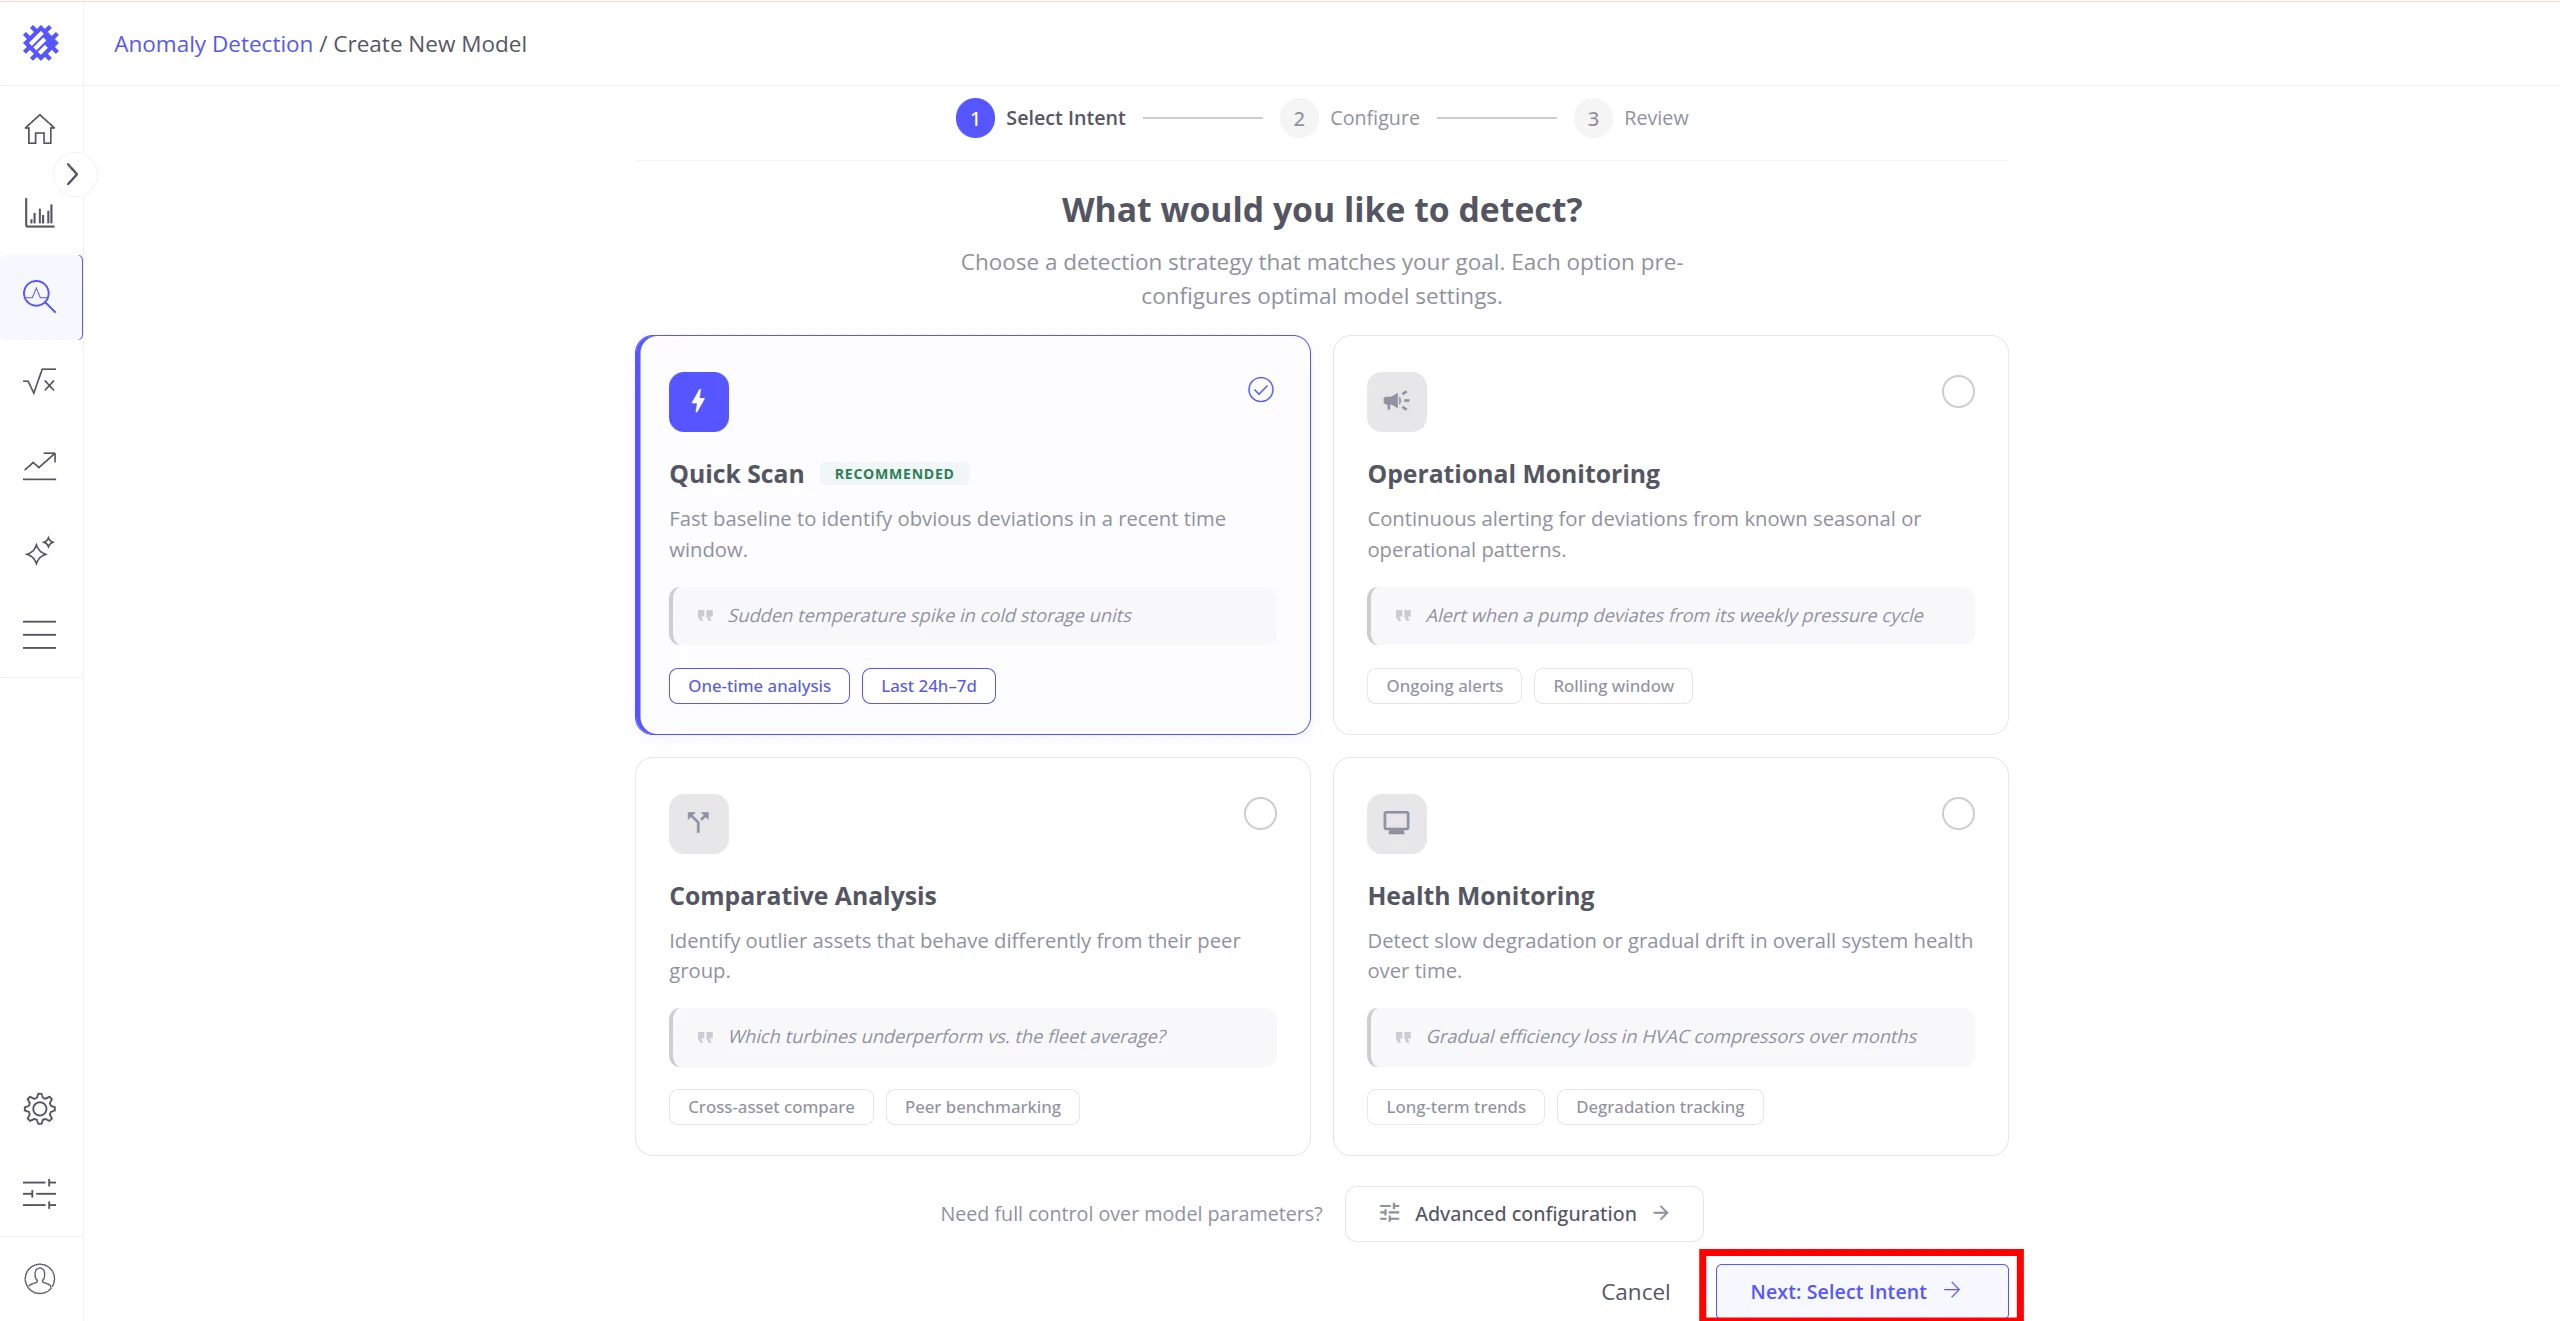
Click + Create model in the top right. The wizard opens at Select Intent — choose Quick Scan and click Next: Select Intent.
-
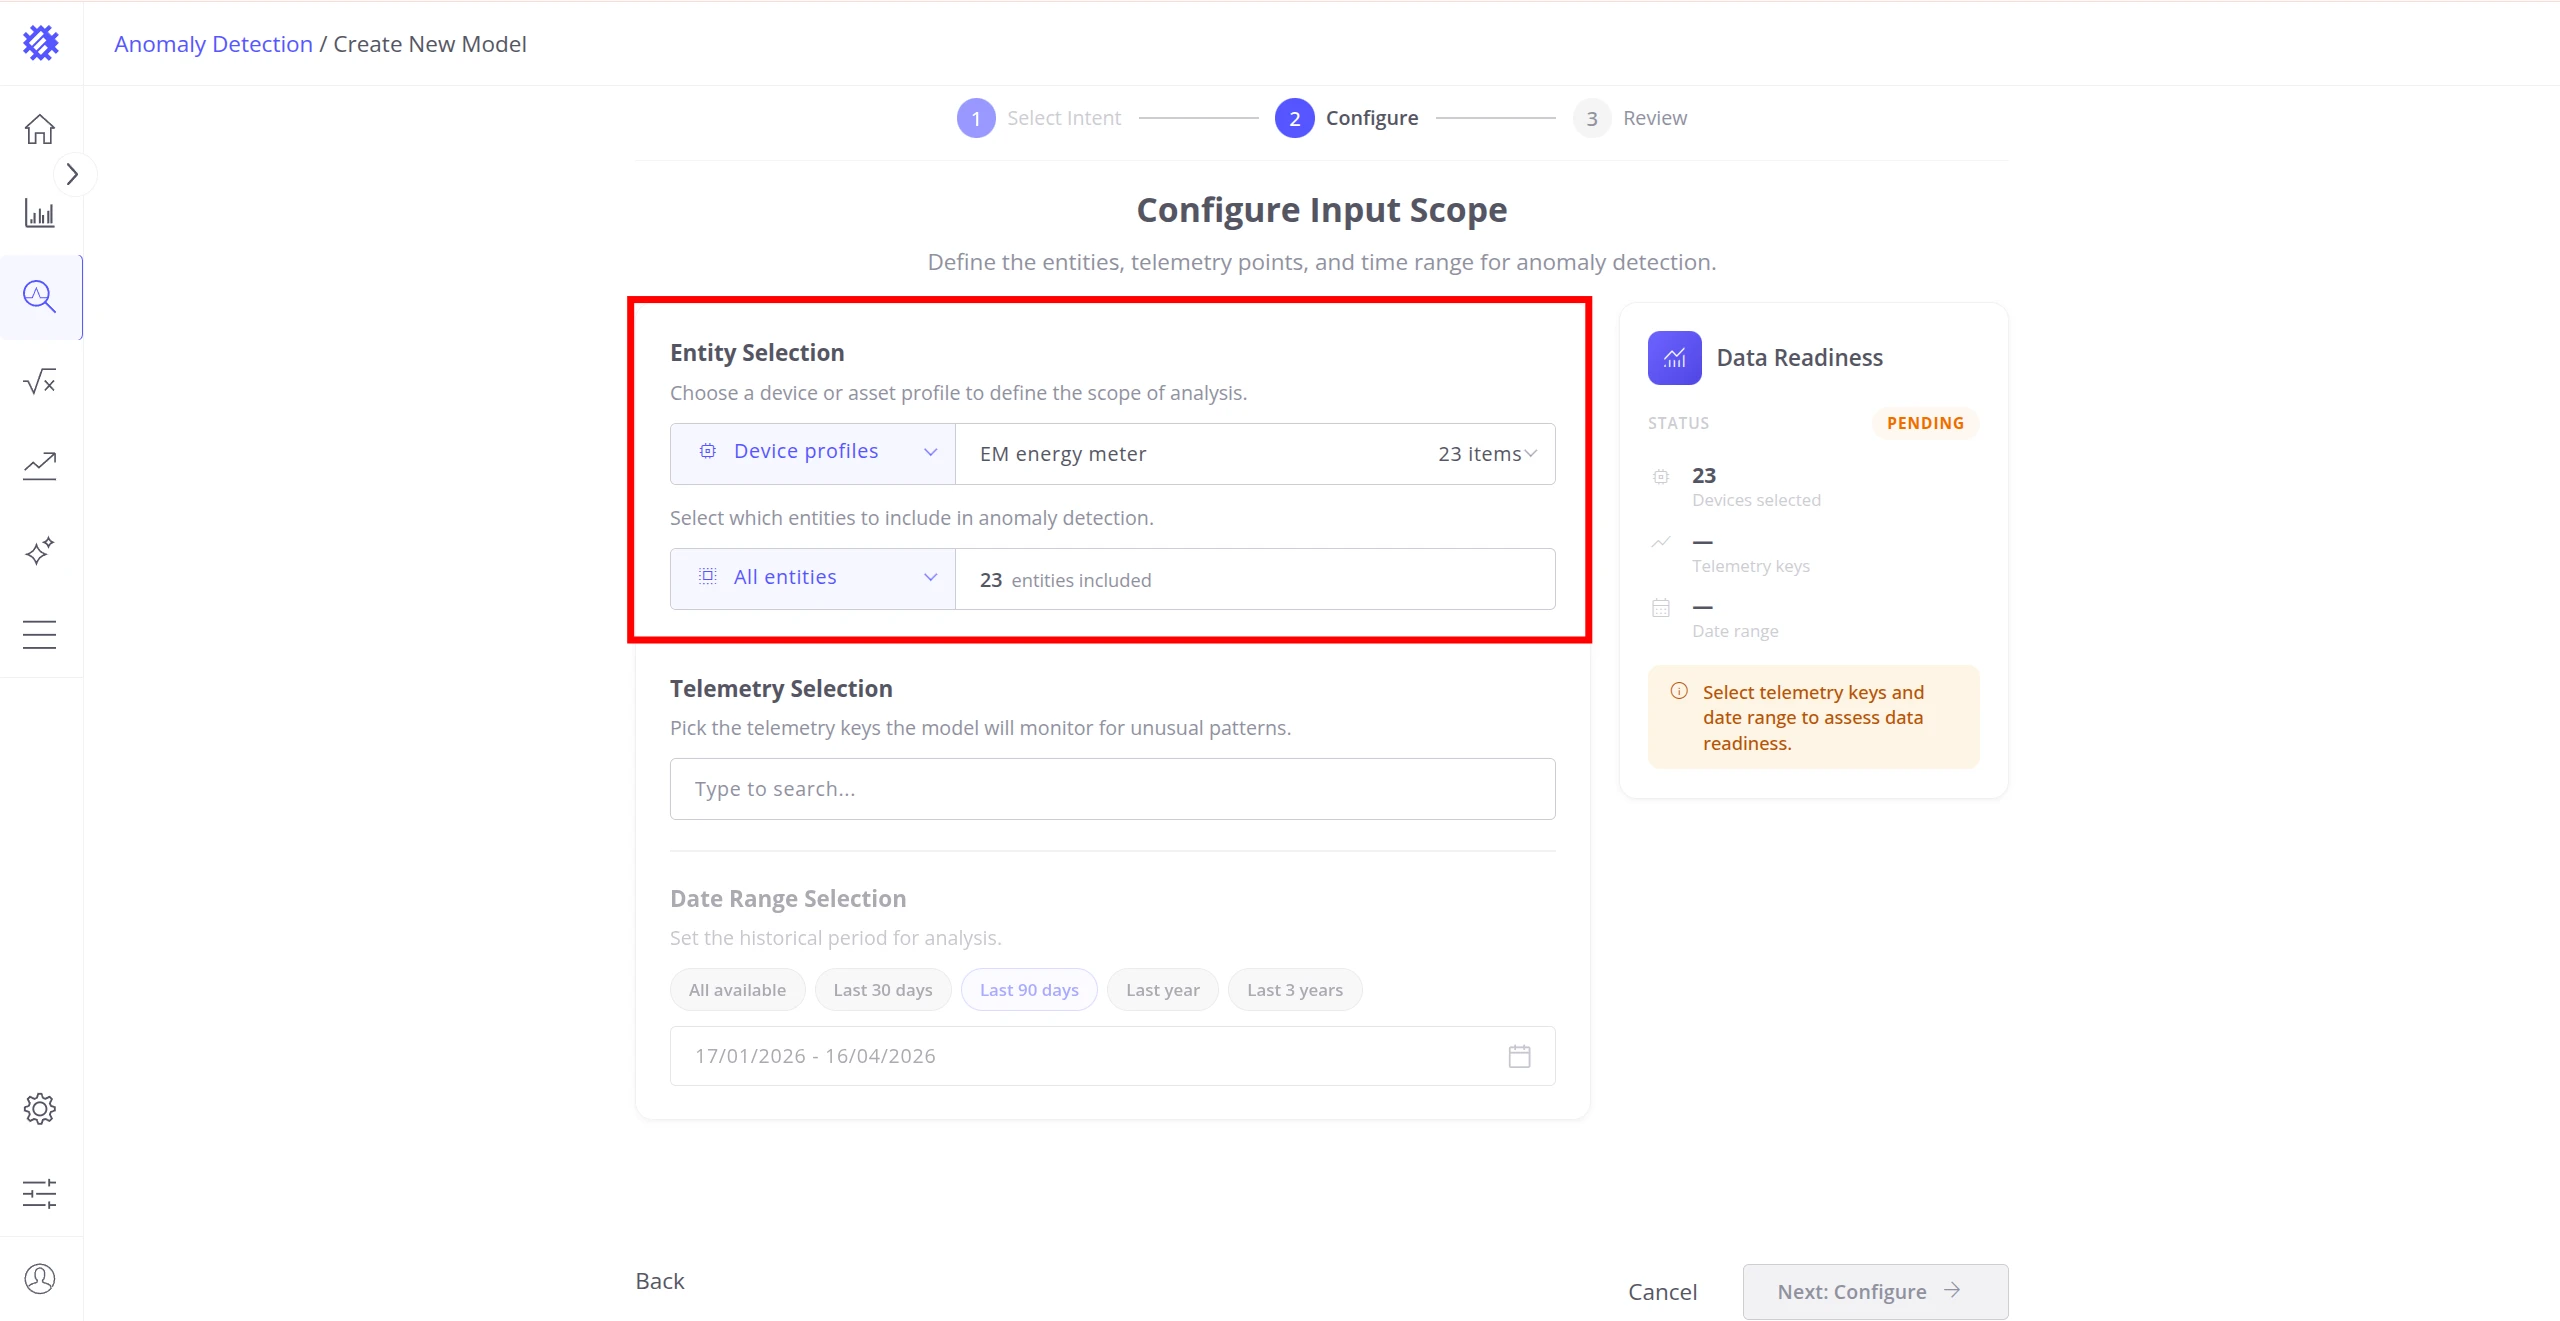
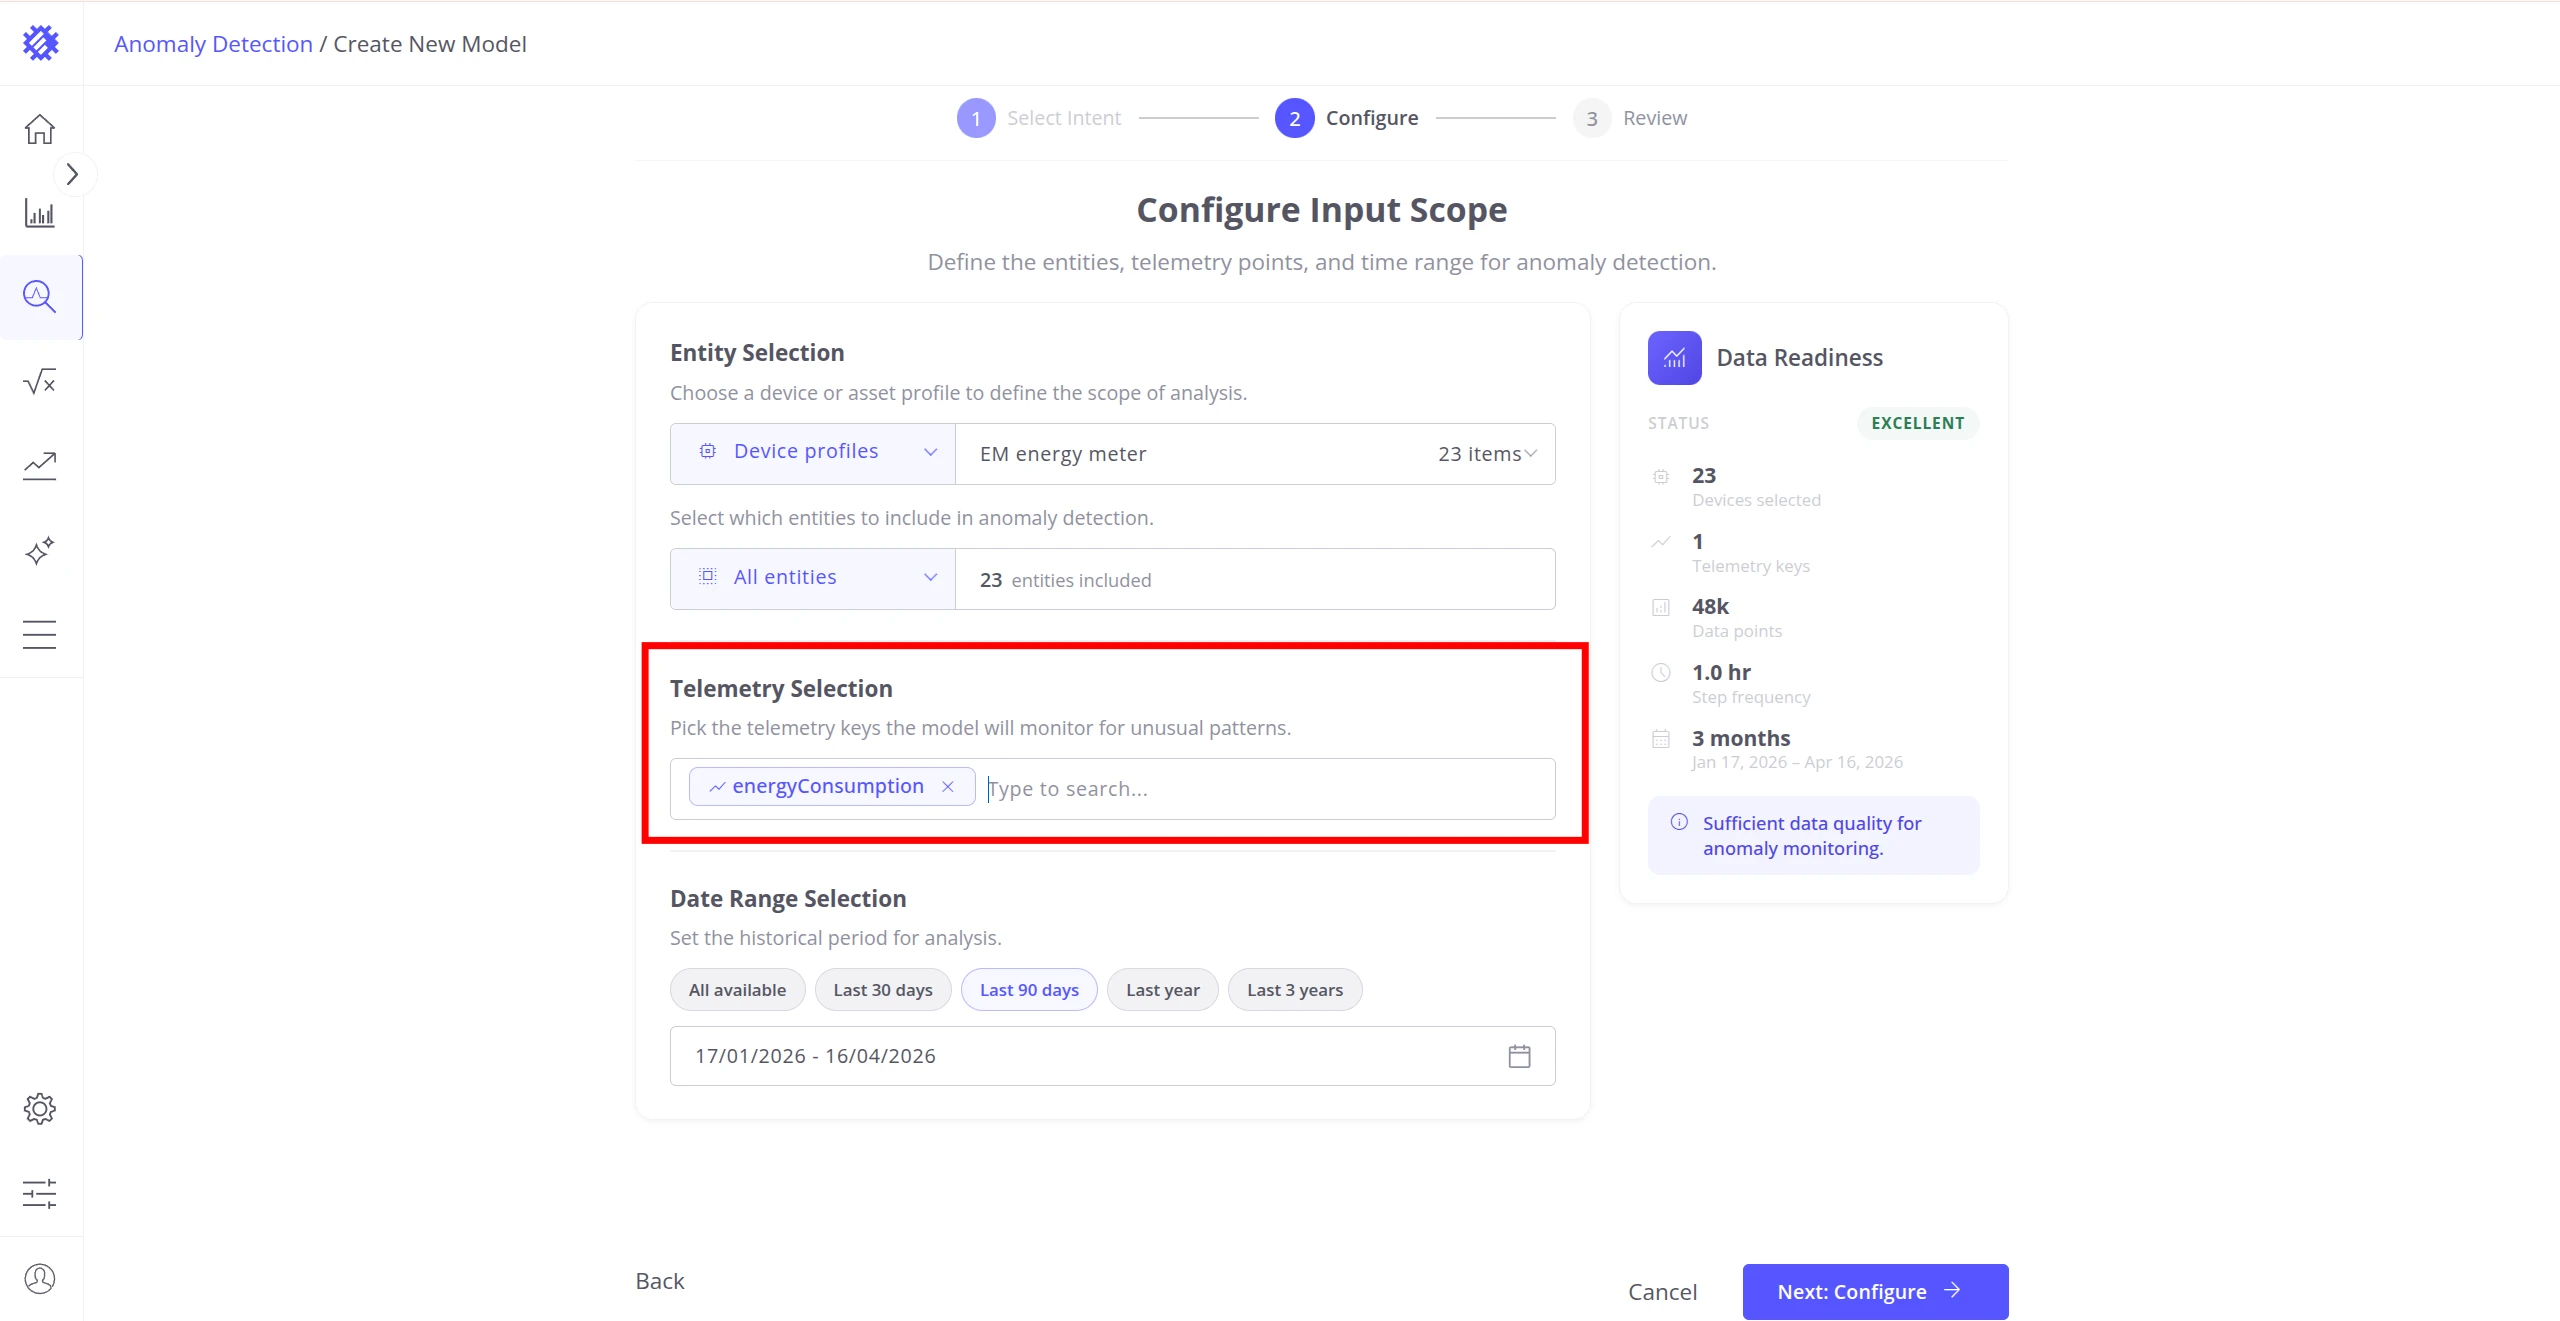
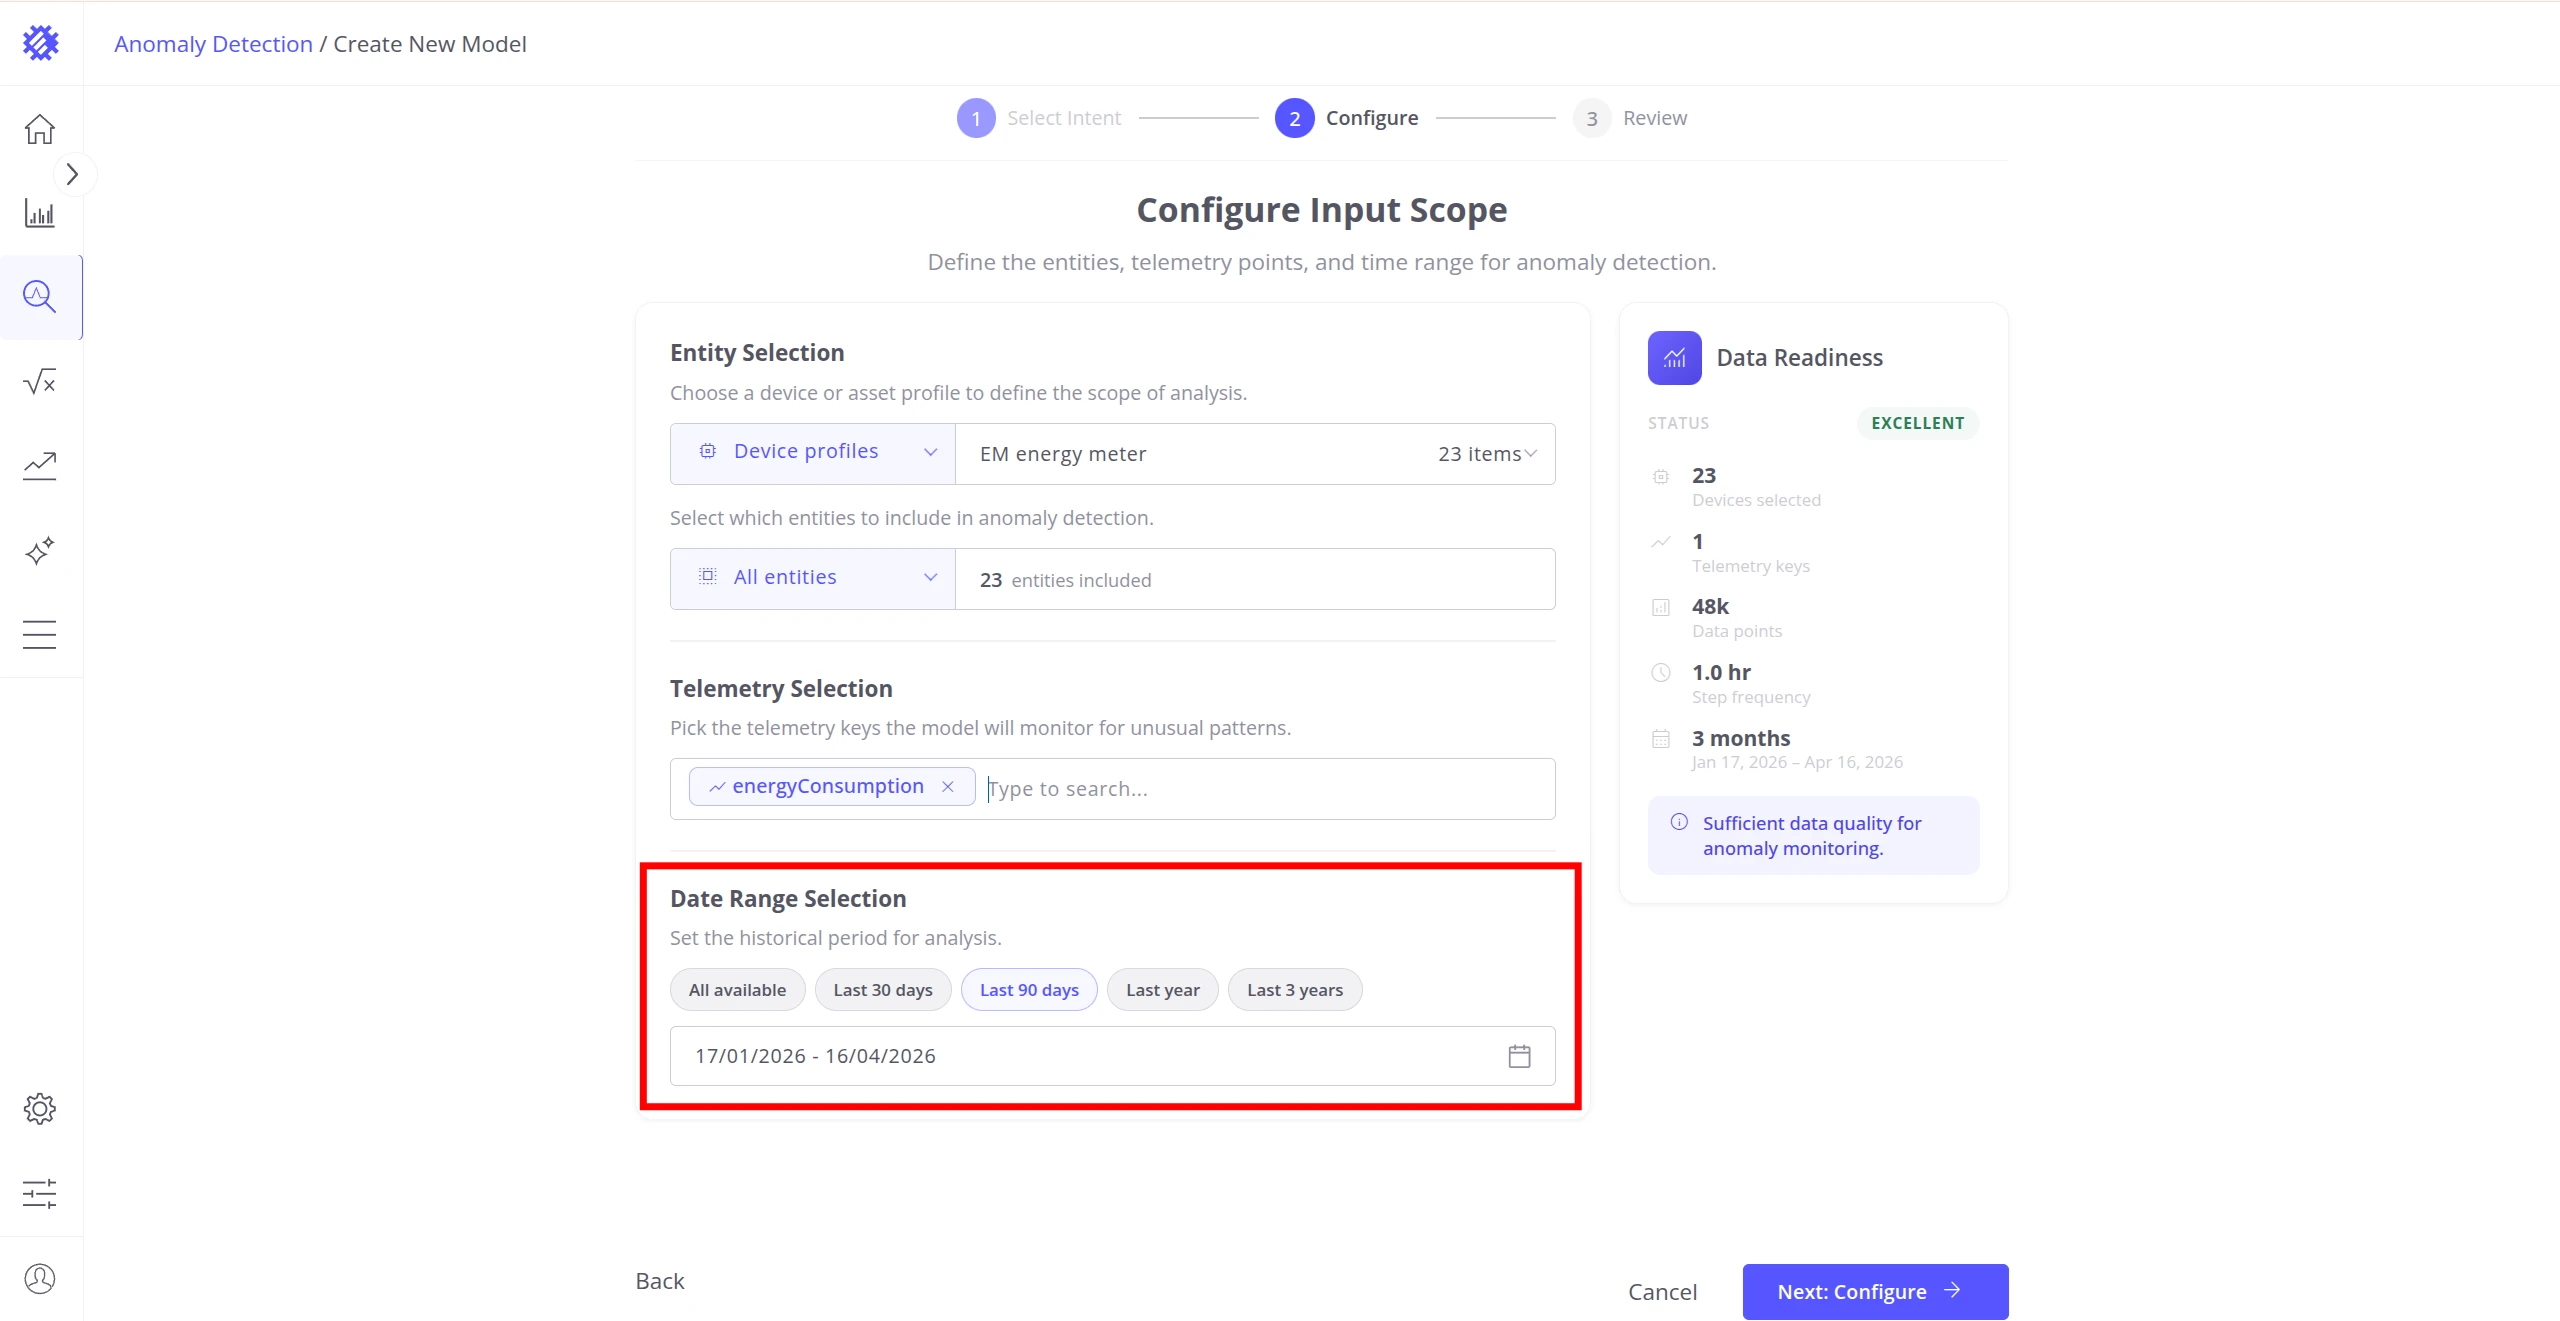
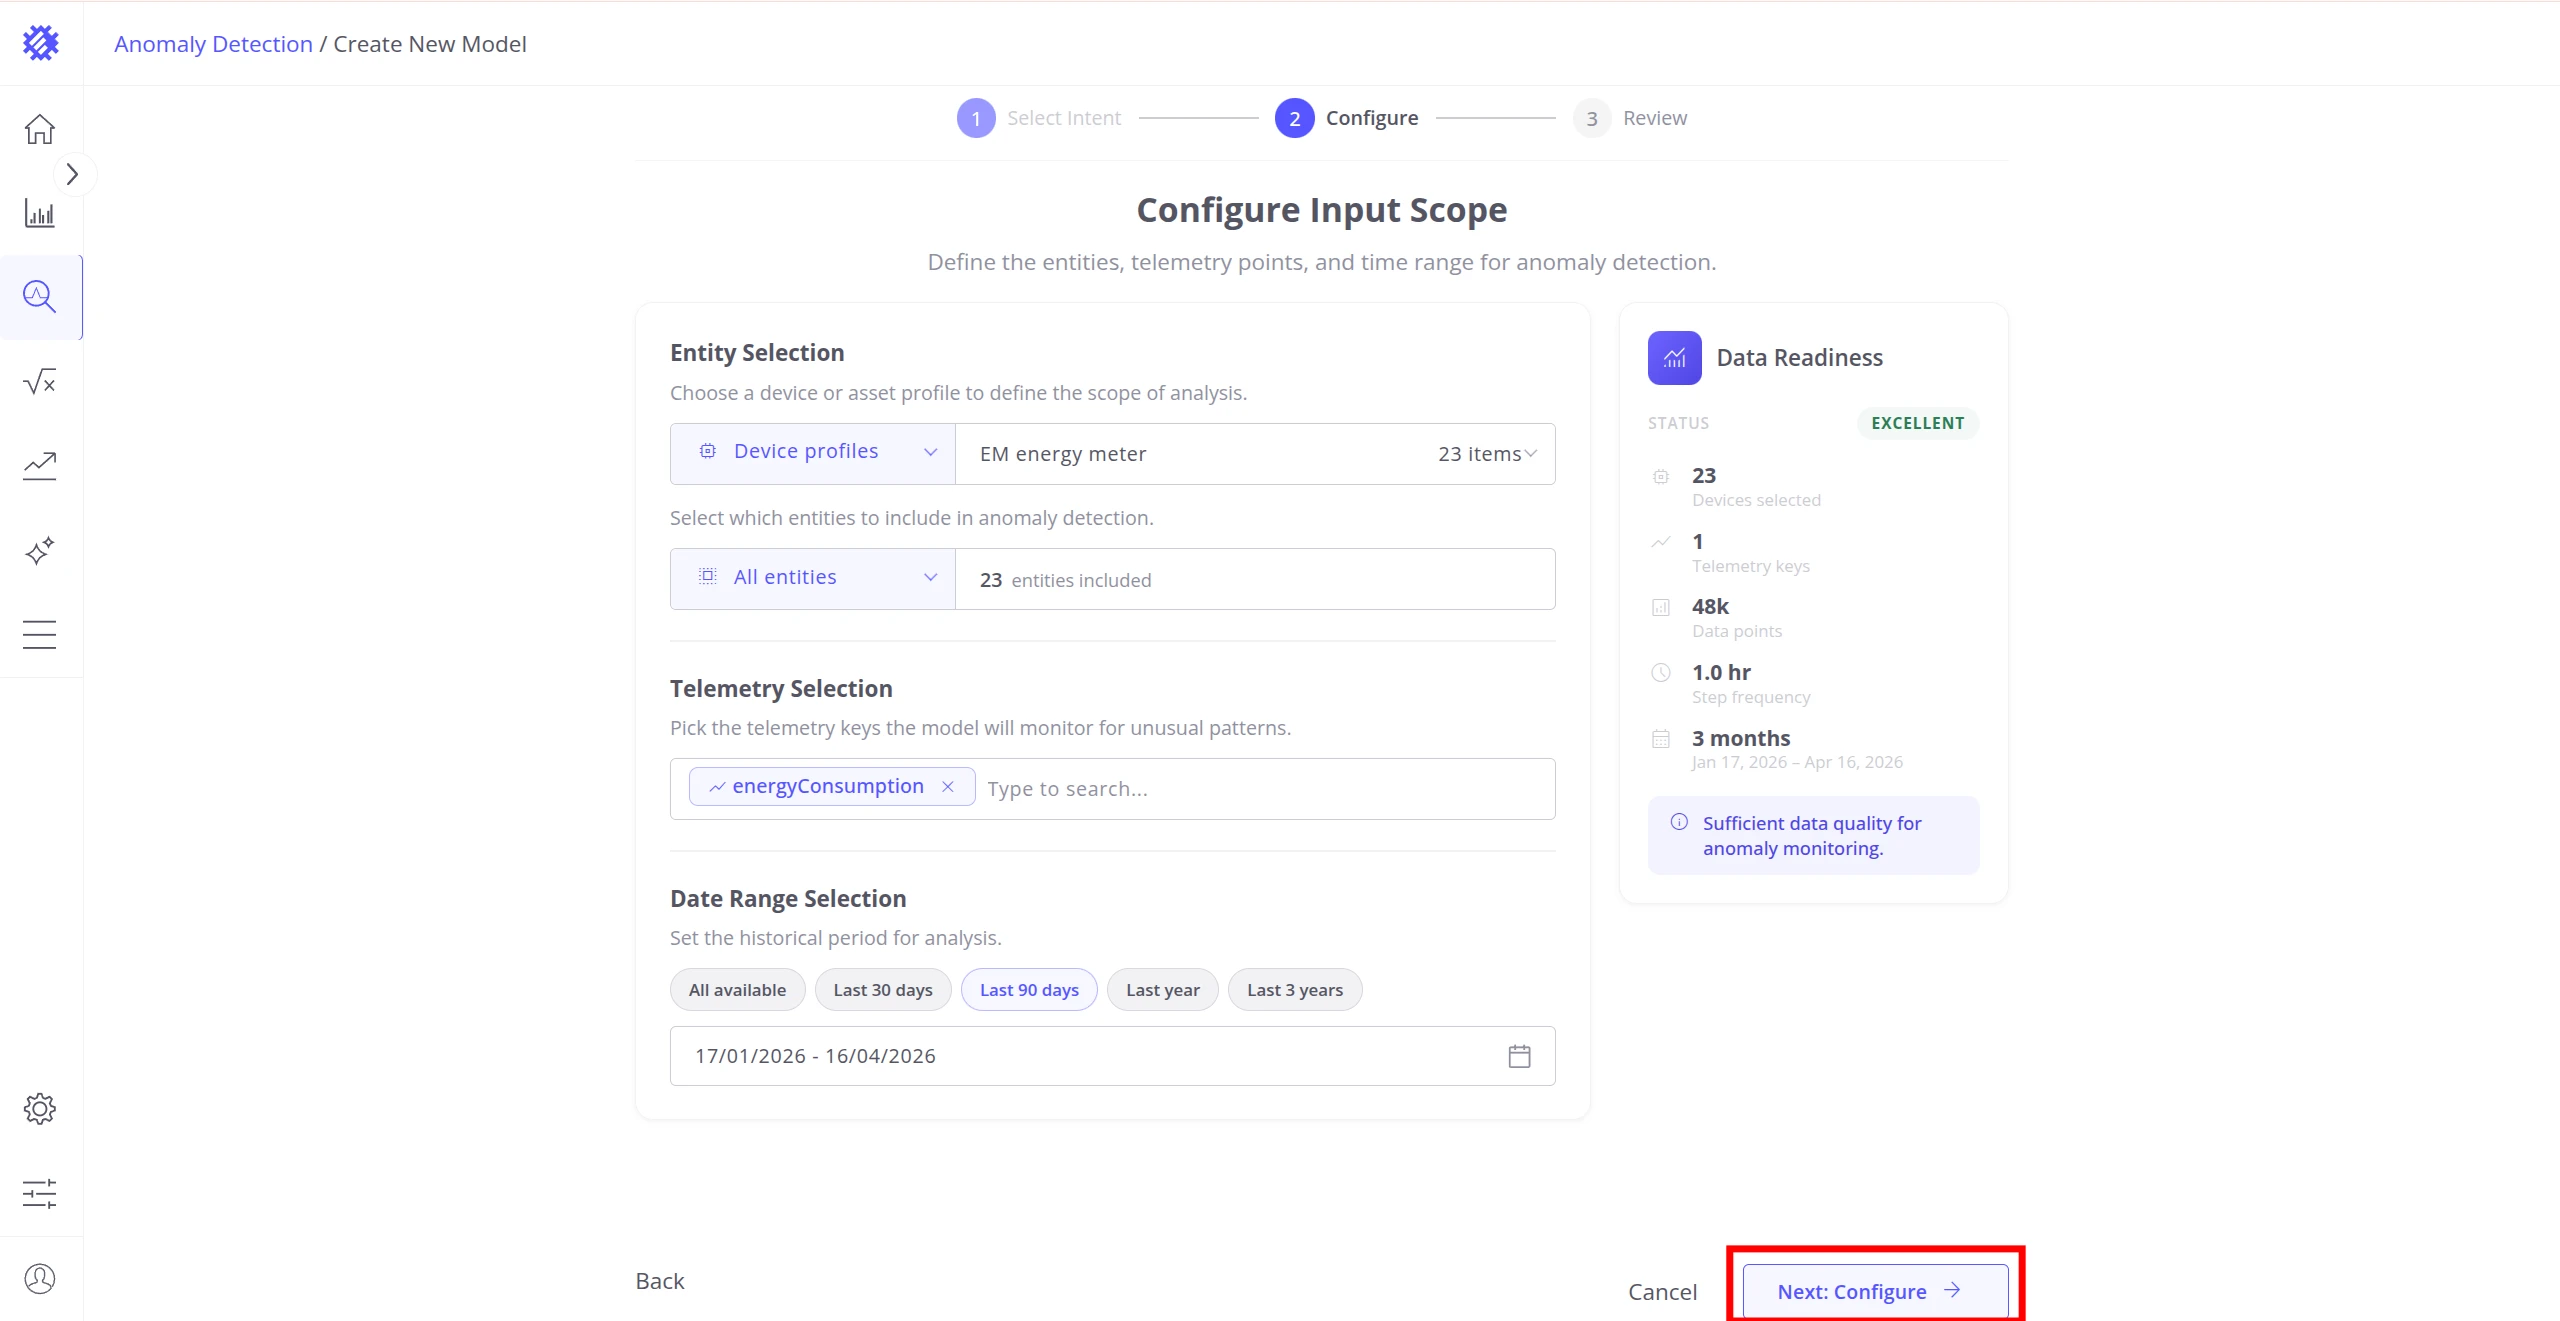
On the Configure step, set:
- Device profiles →
EM energy meter - Telemetry →
energyConsumption - Date Range →
Last 90 days
Click Next: Configure.
- Device profiles →
-
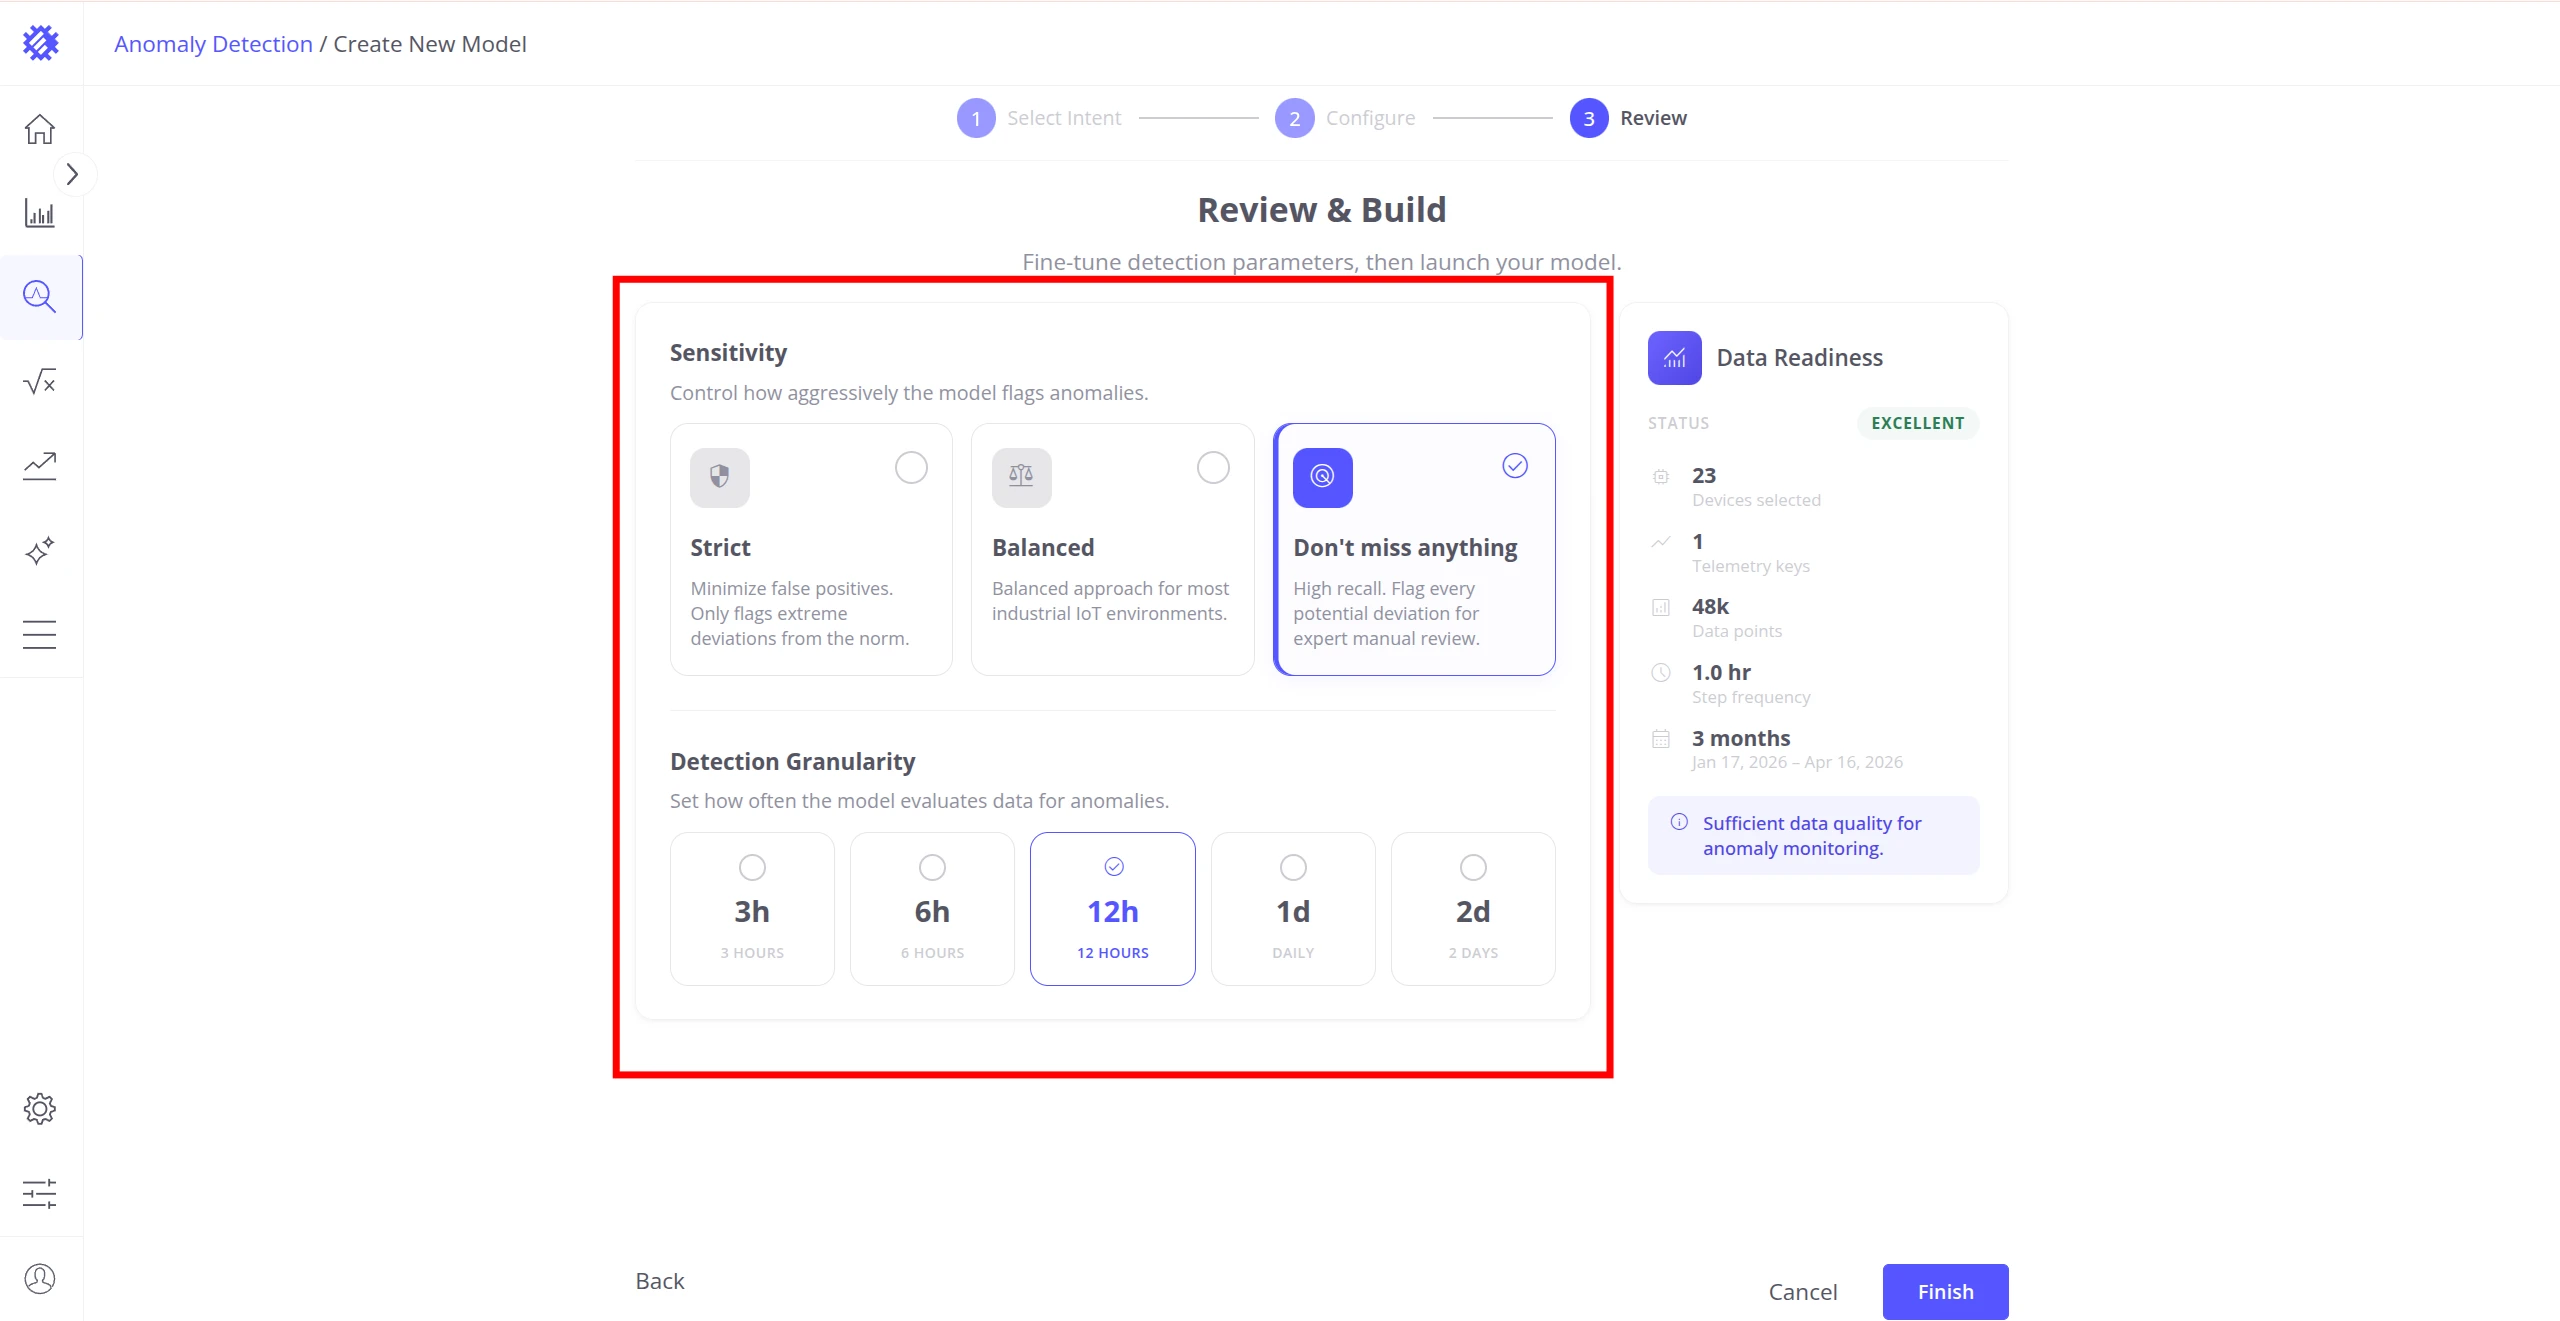
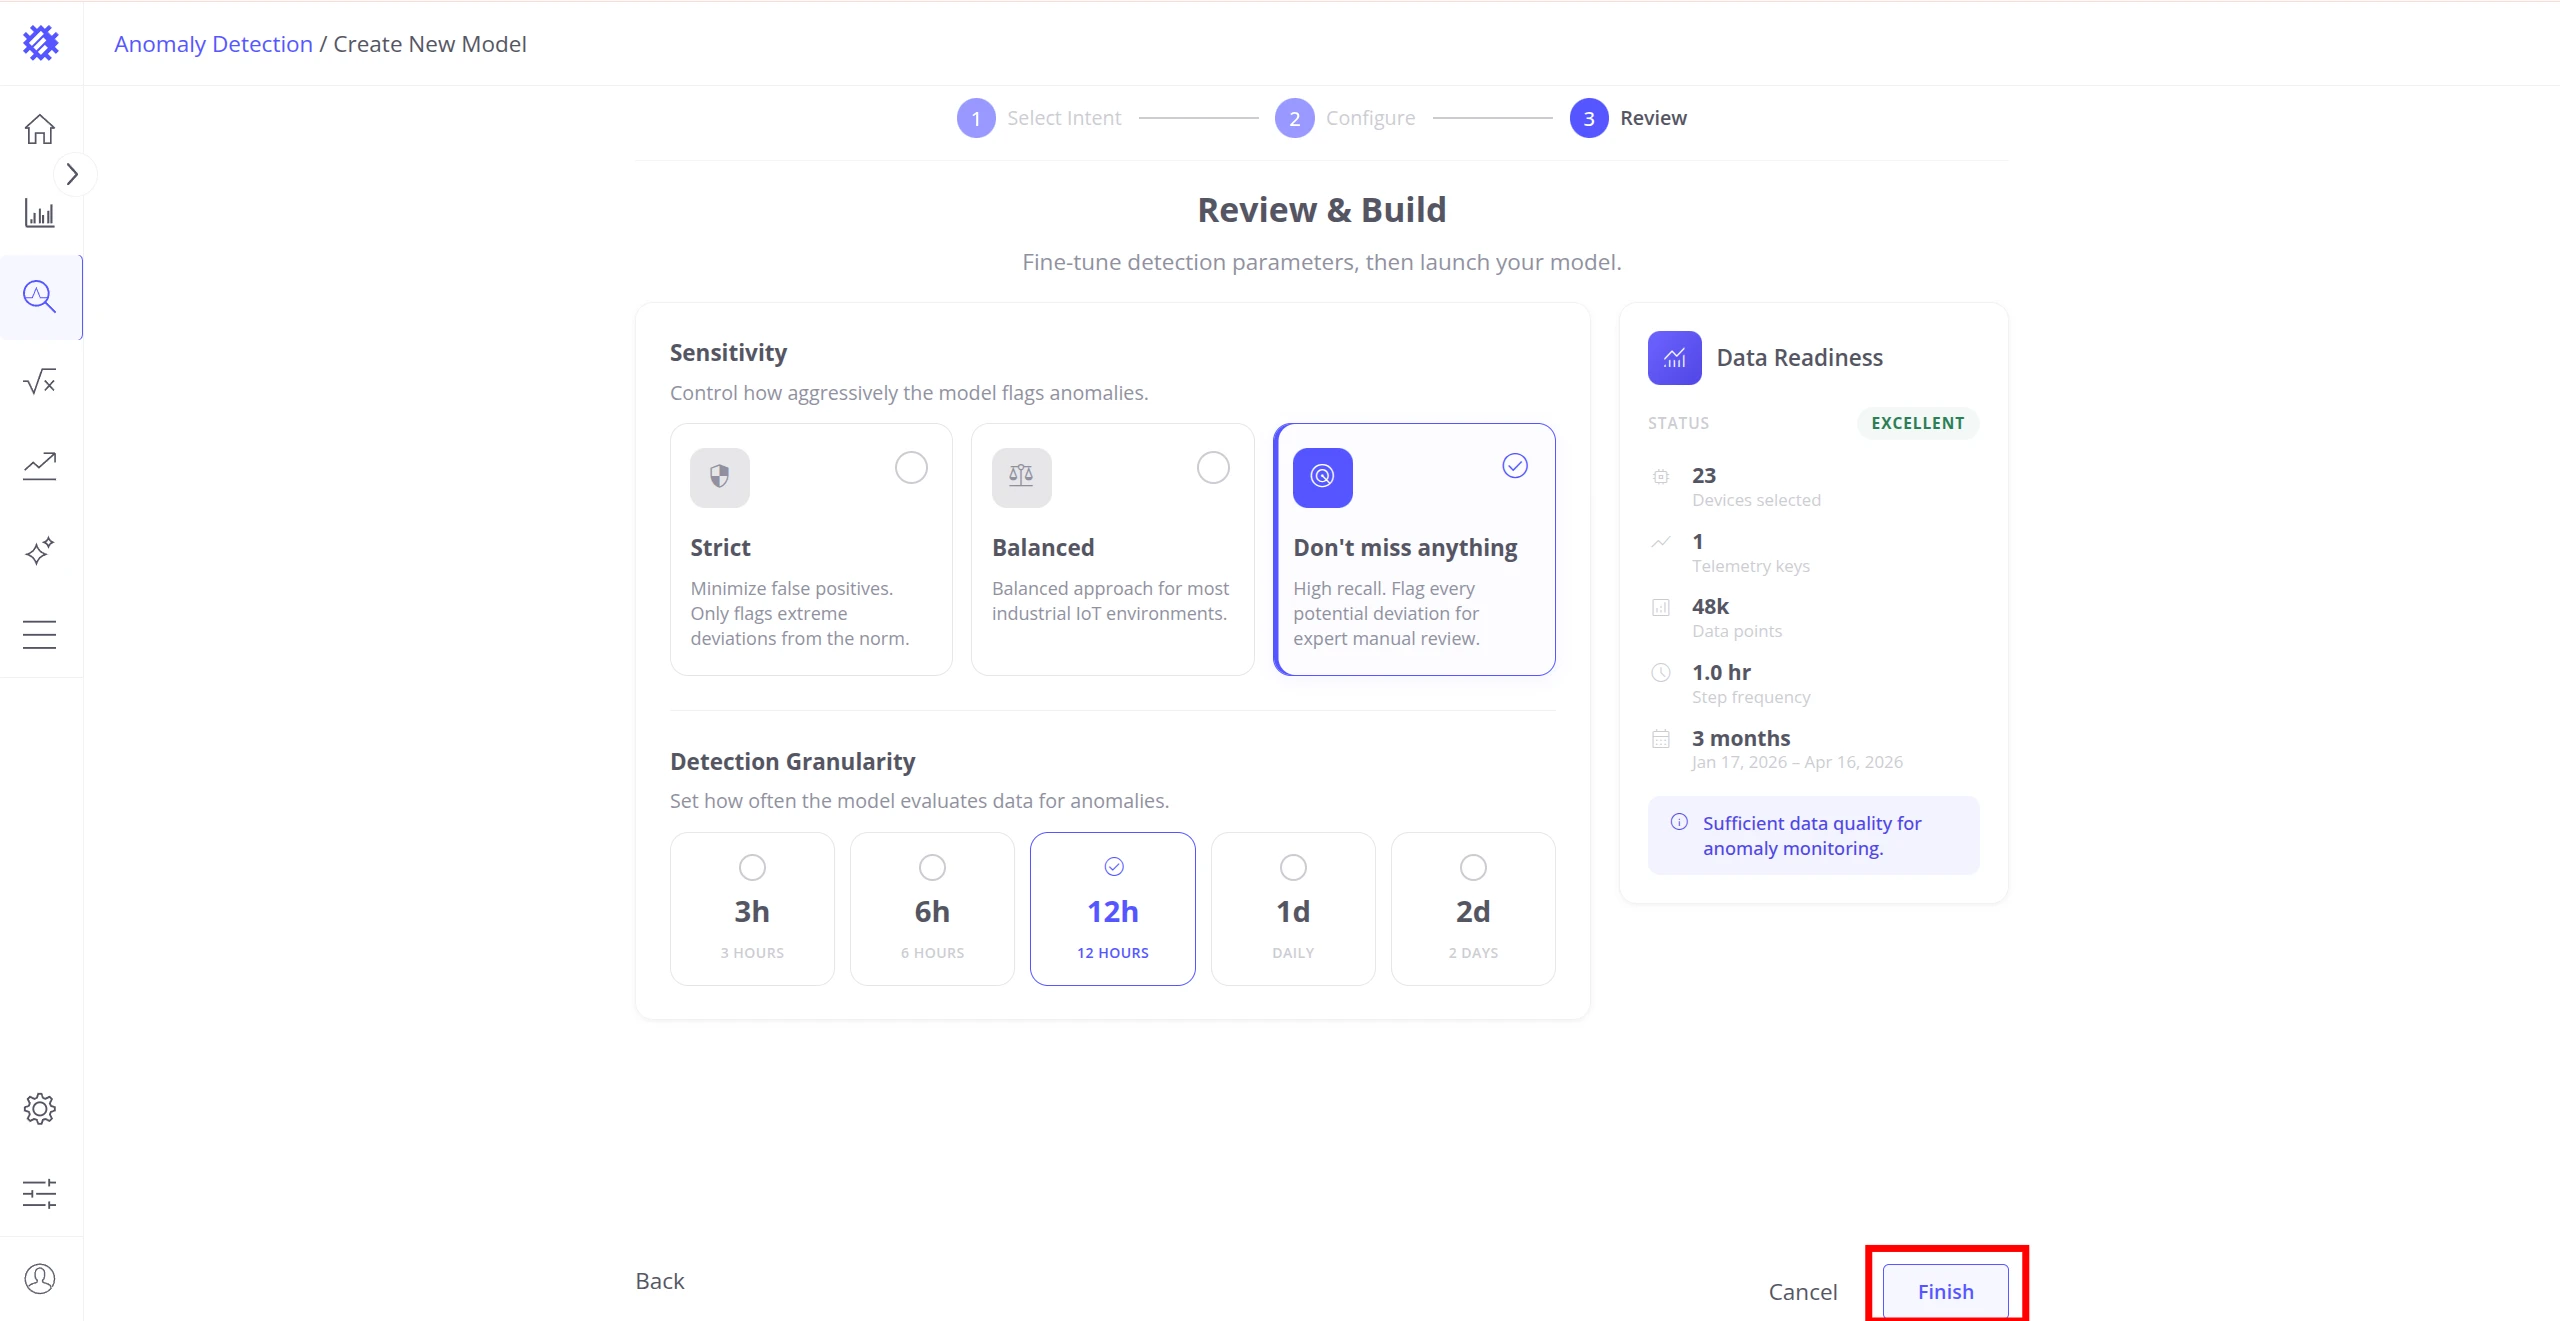
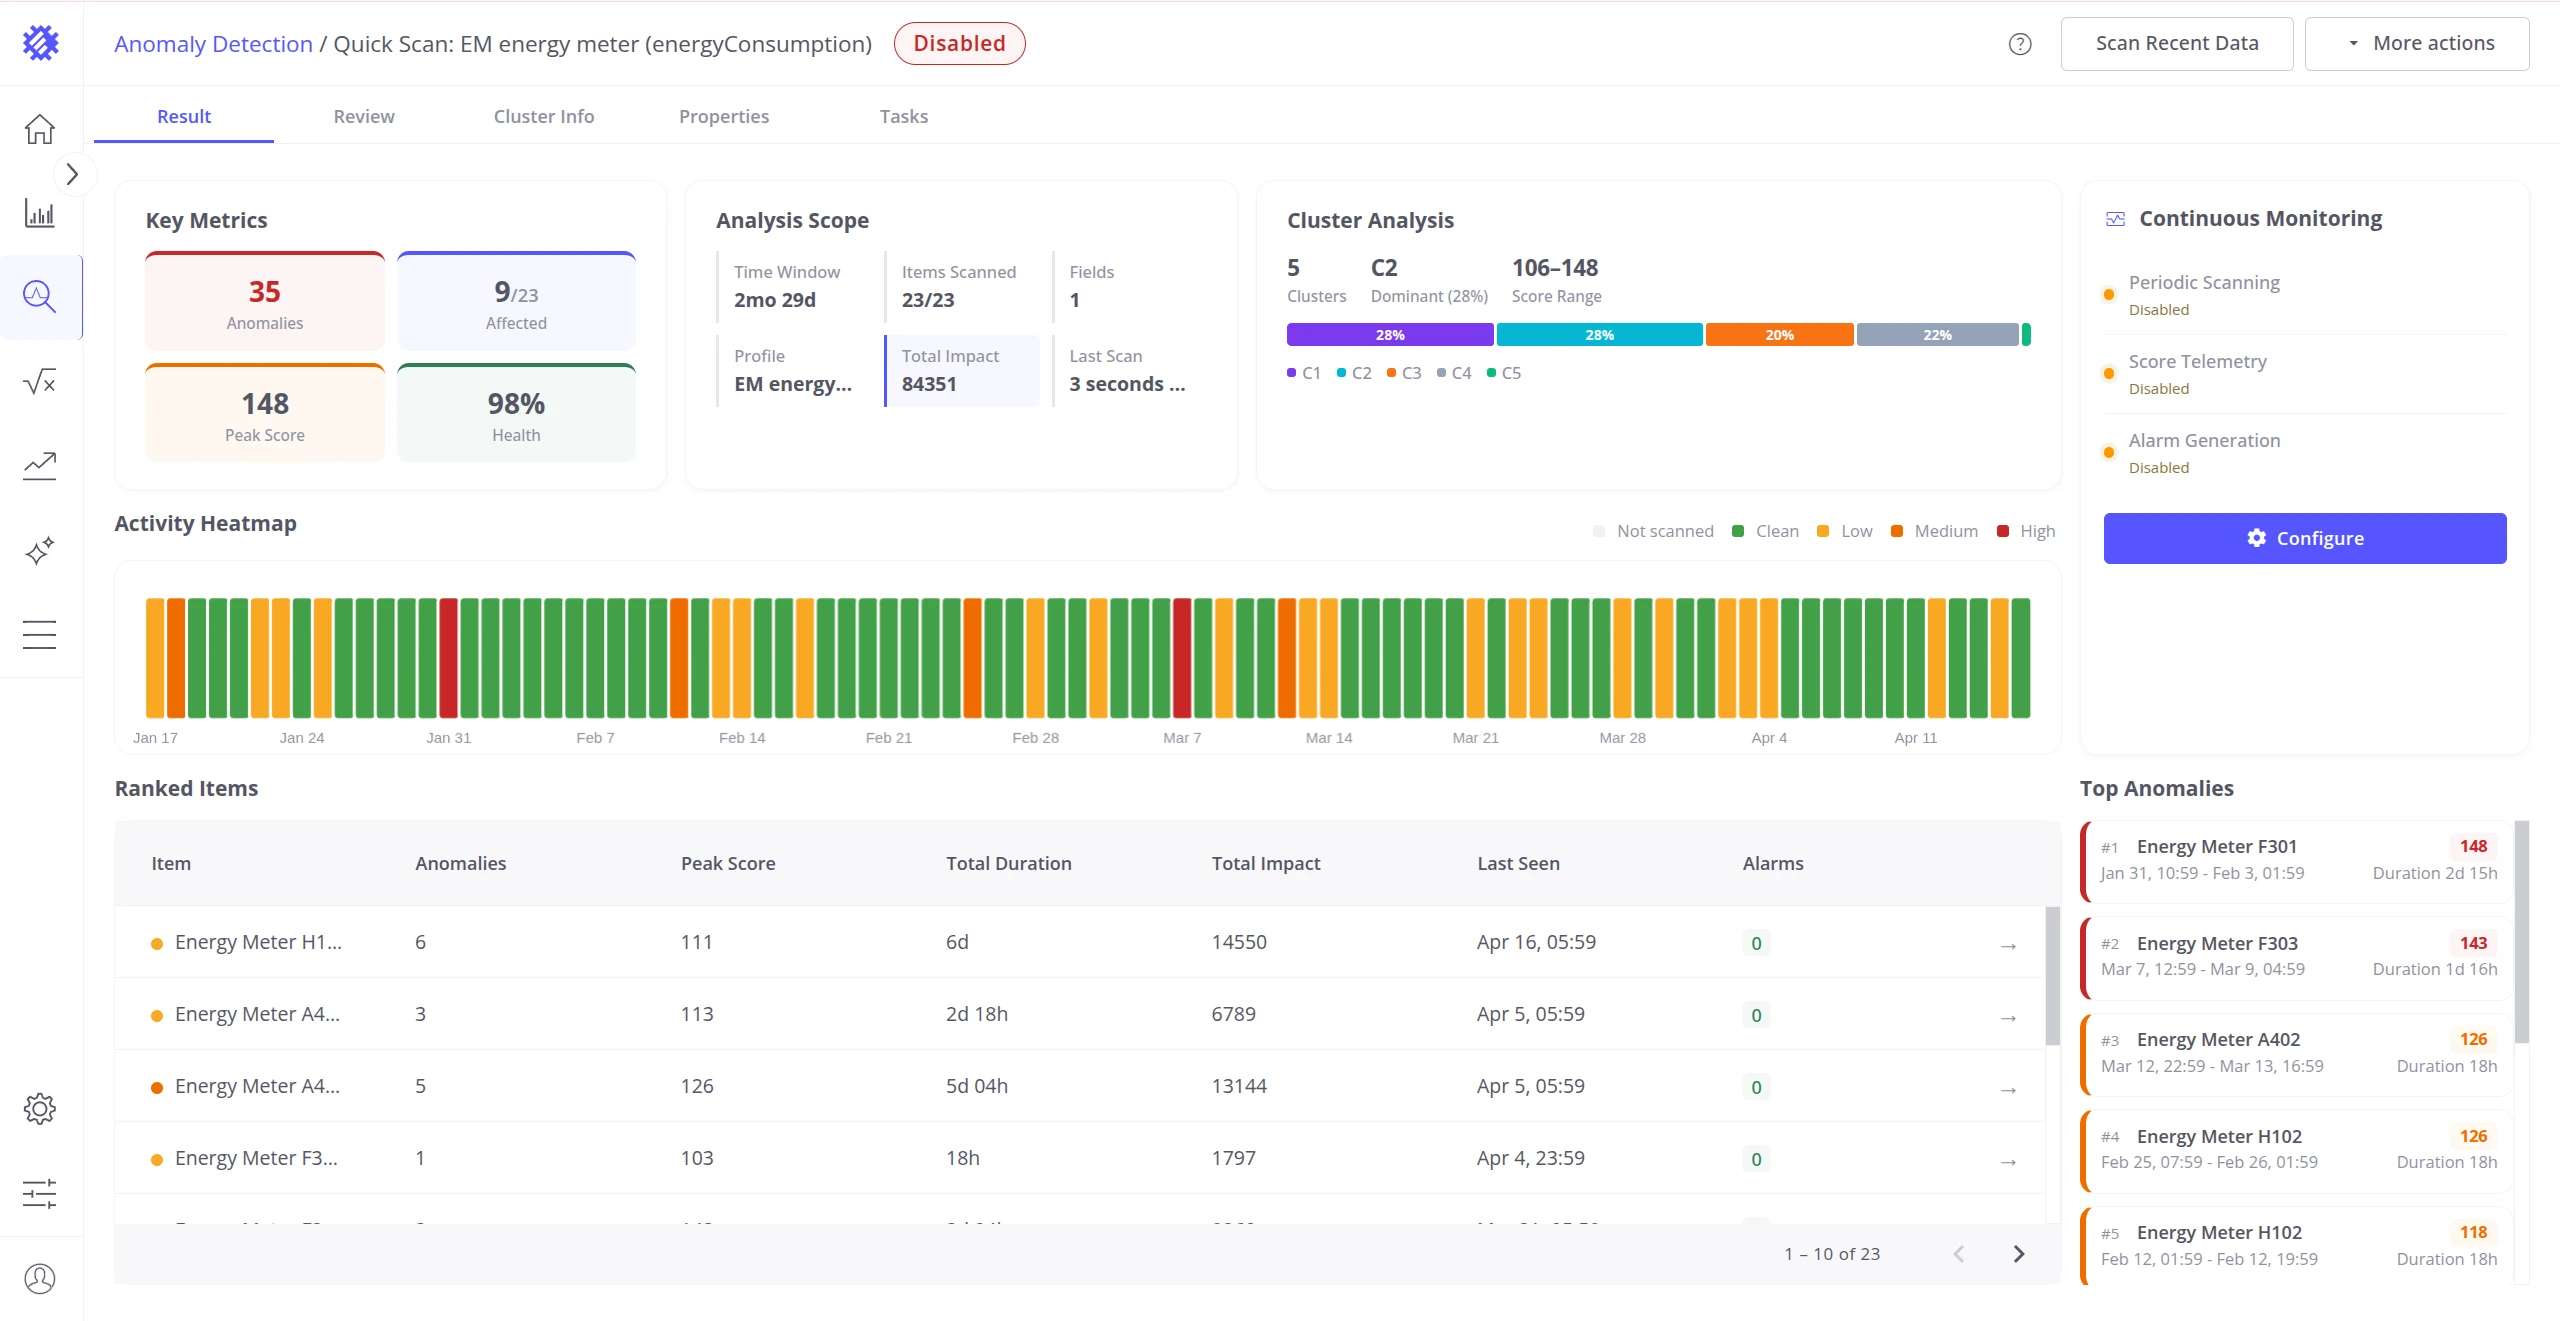
On the Review & Build step, review the Sensitivity and Detection Granularity settings, then click Finish. The model trains and opens automatically in the Result tab.
-
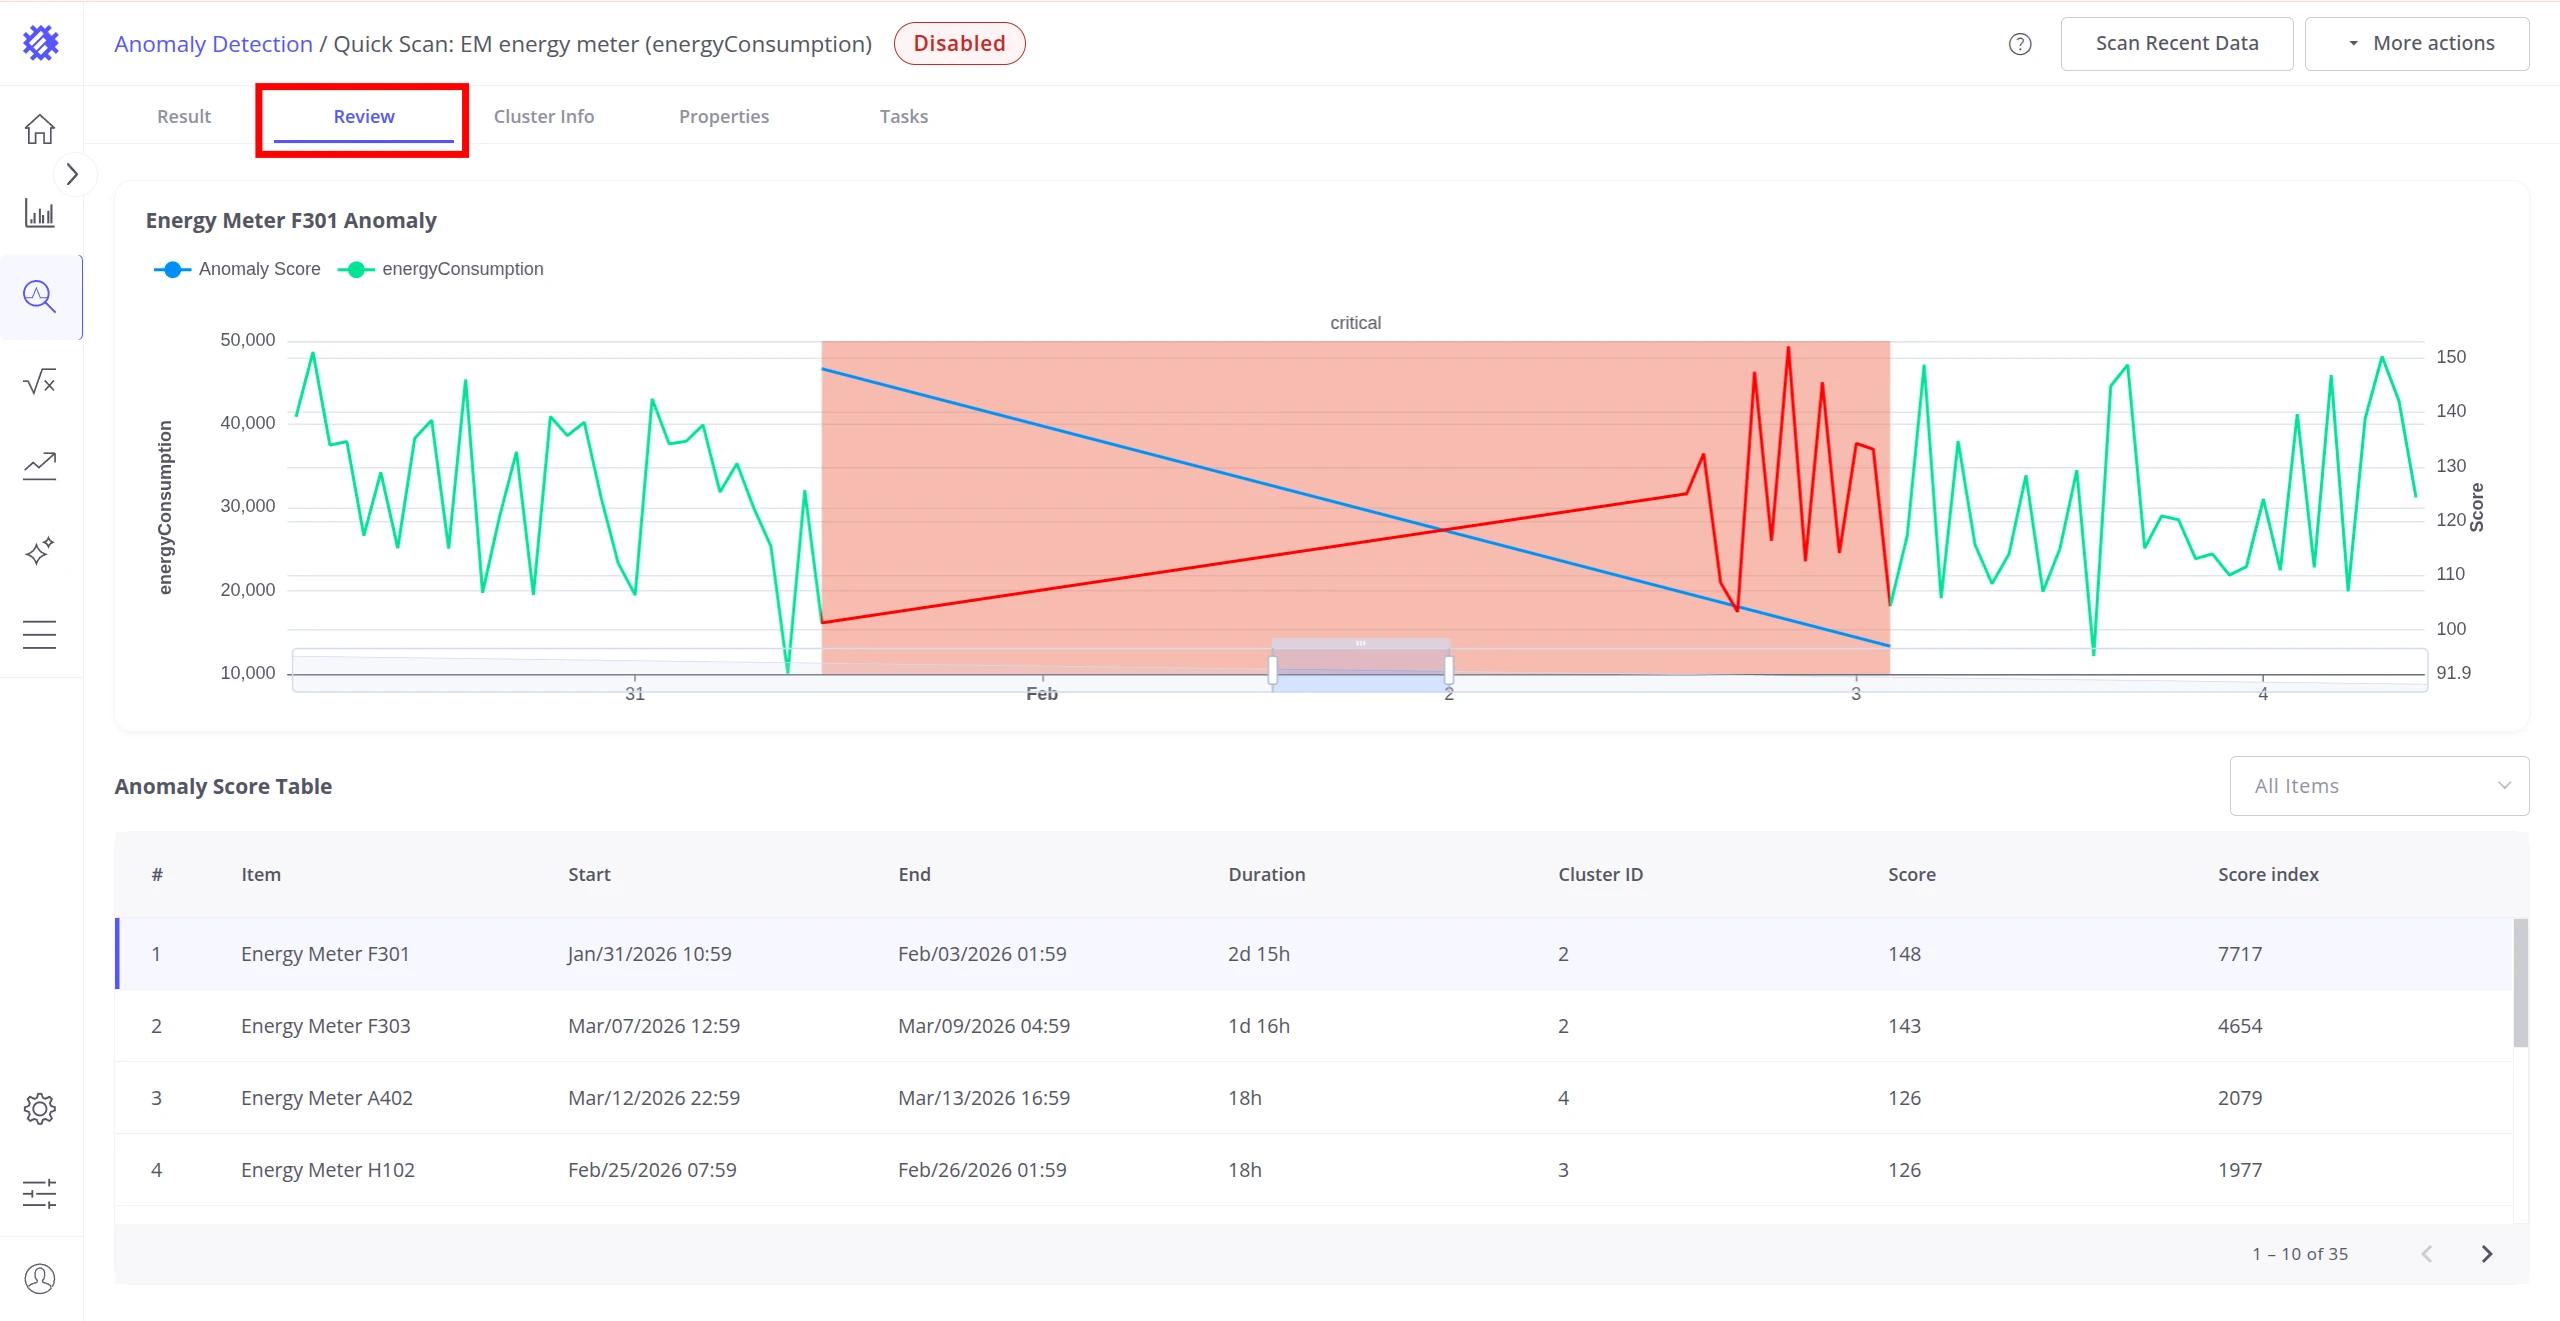
Click the Review tab to inspect detected anomalies overlaid on raw telemetry.
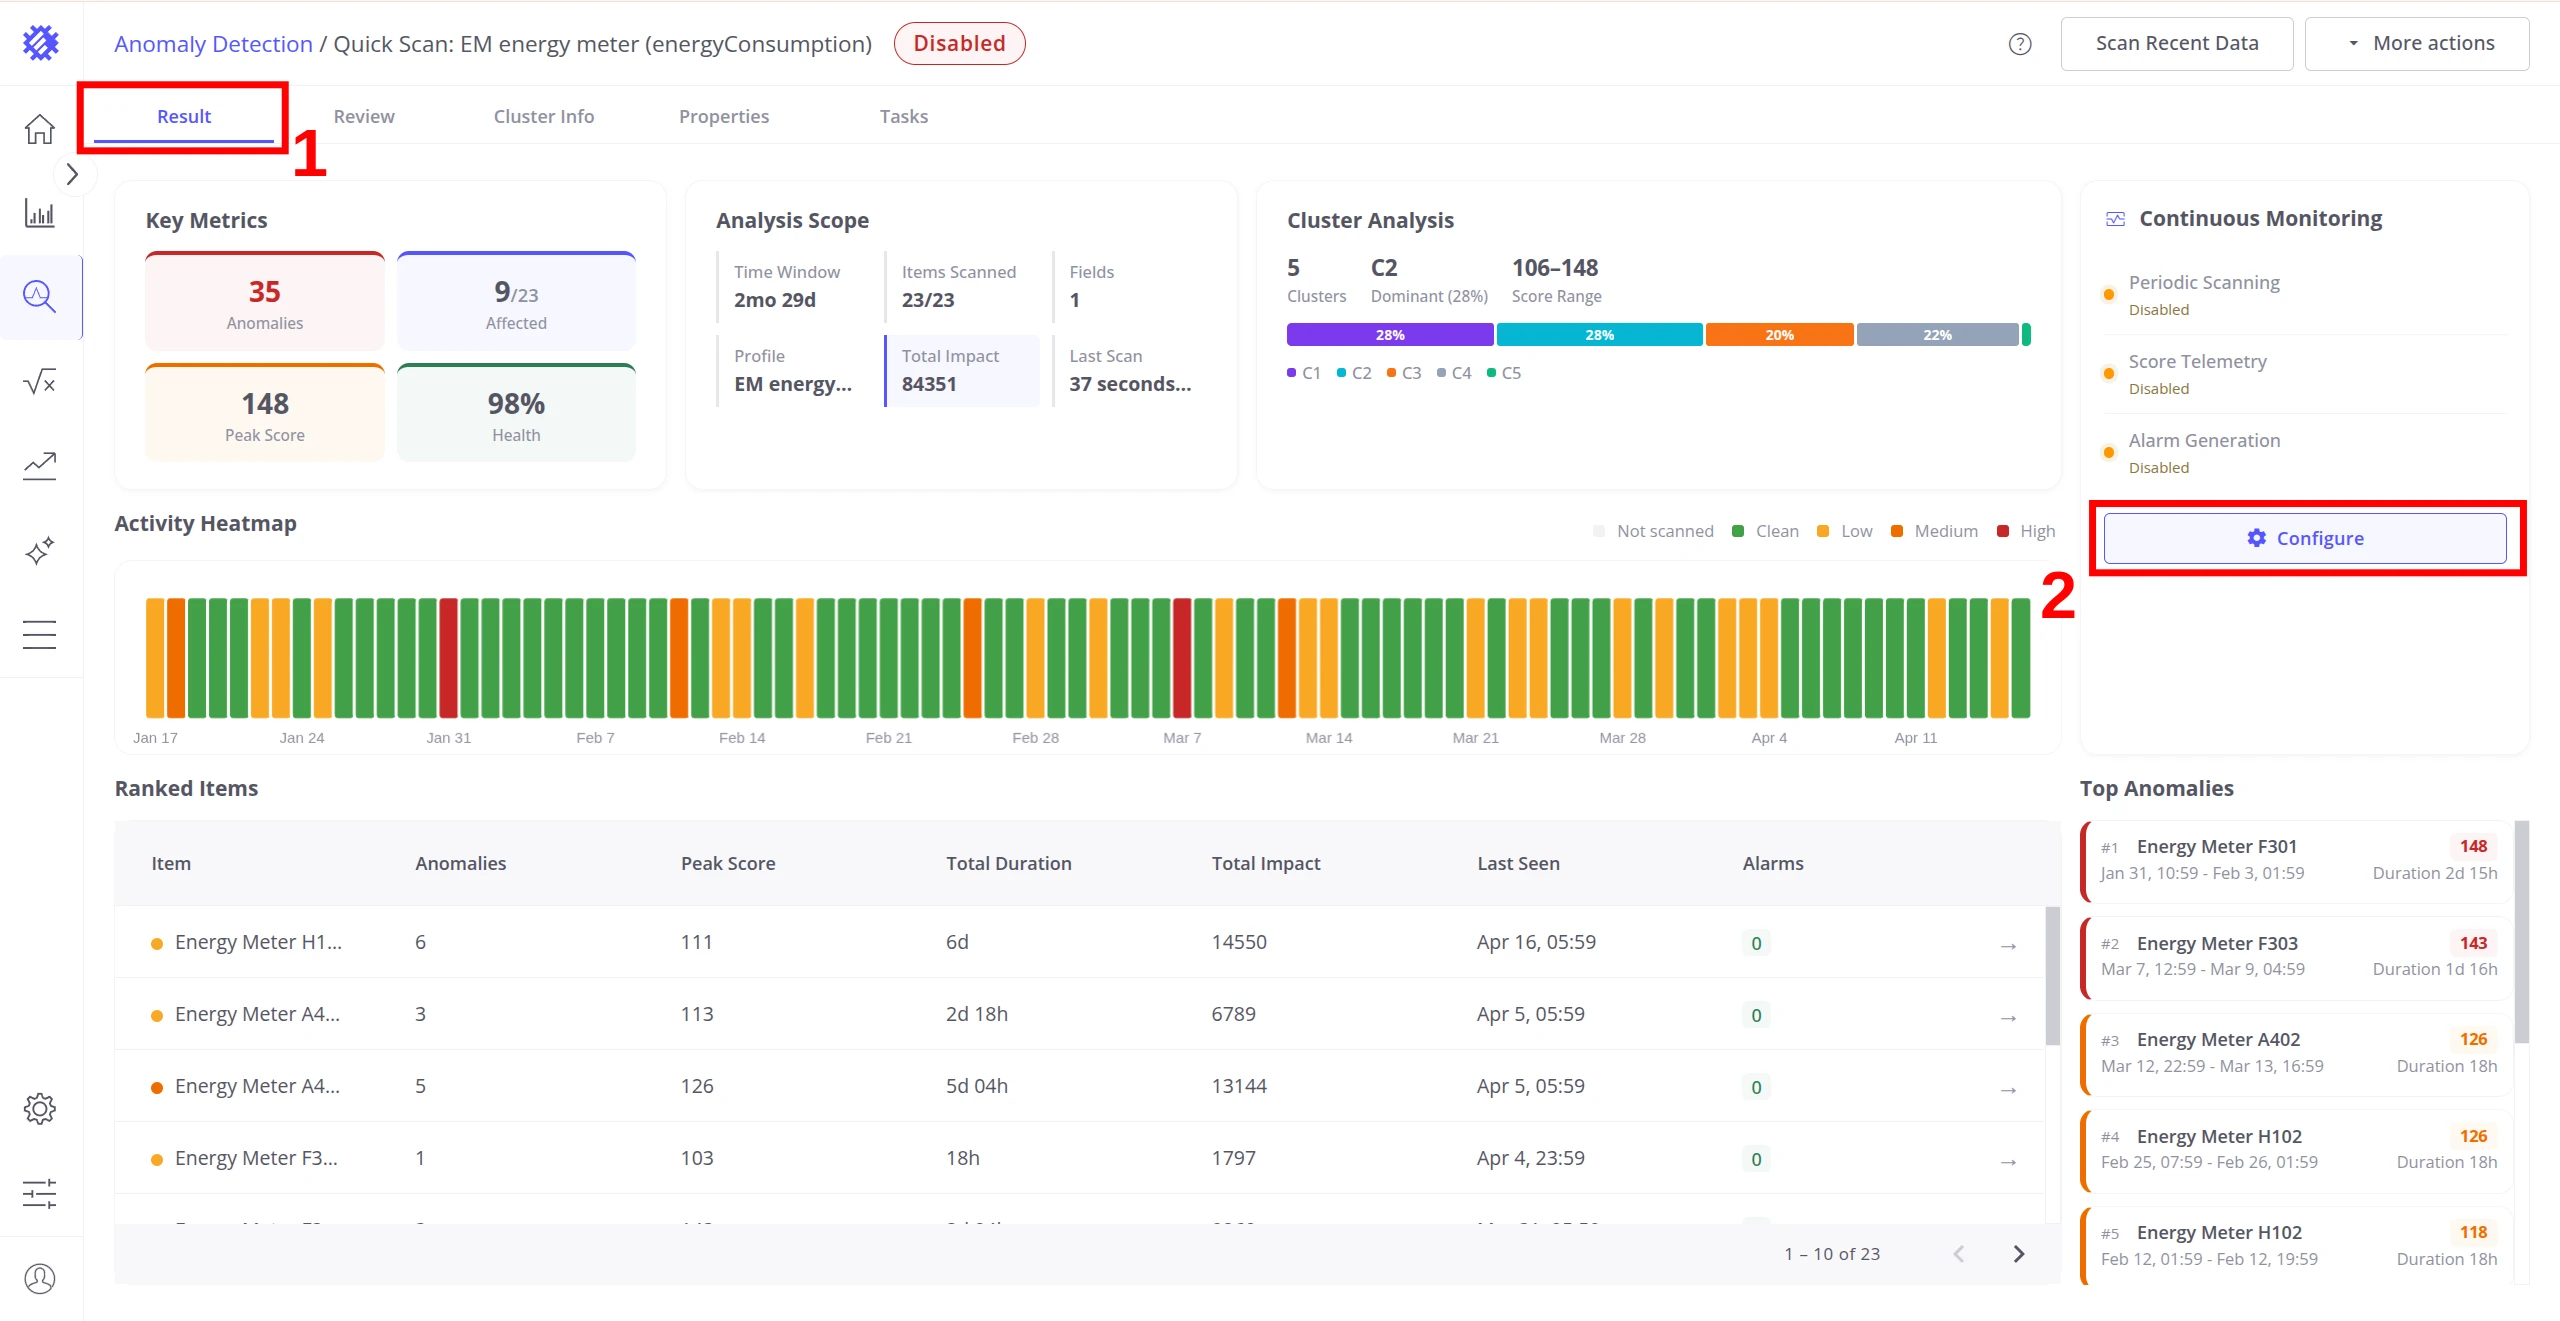
To run detection continuously and create ThingsBoard alarms automatically, set up monitoring:
-
In the Result tab, click Configure in the Continuous Monitoring panel on the right.
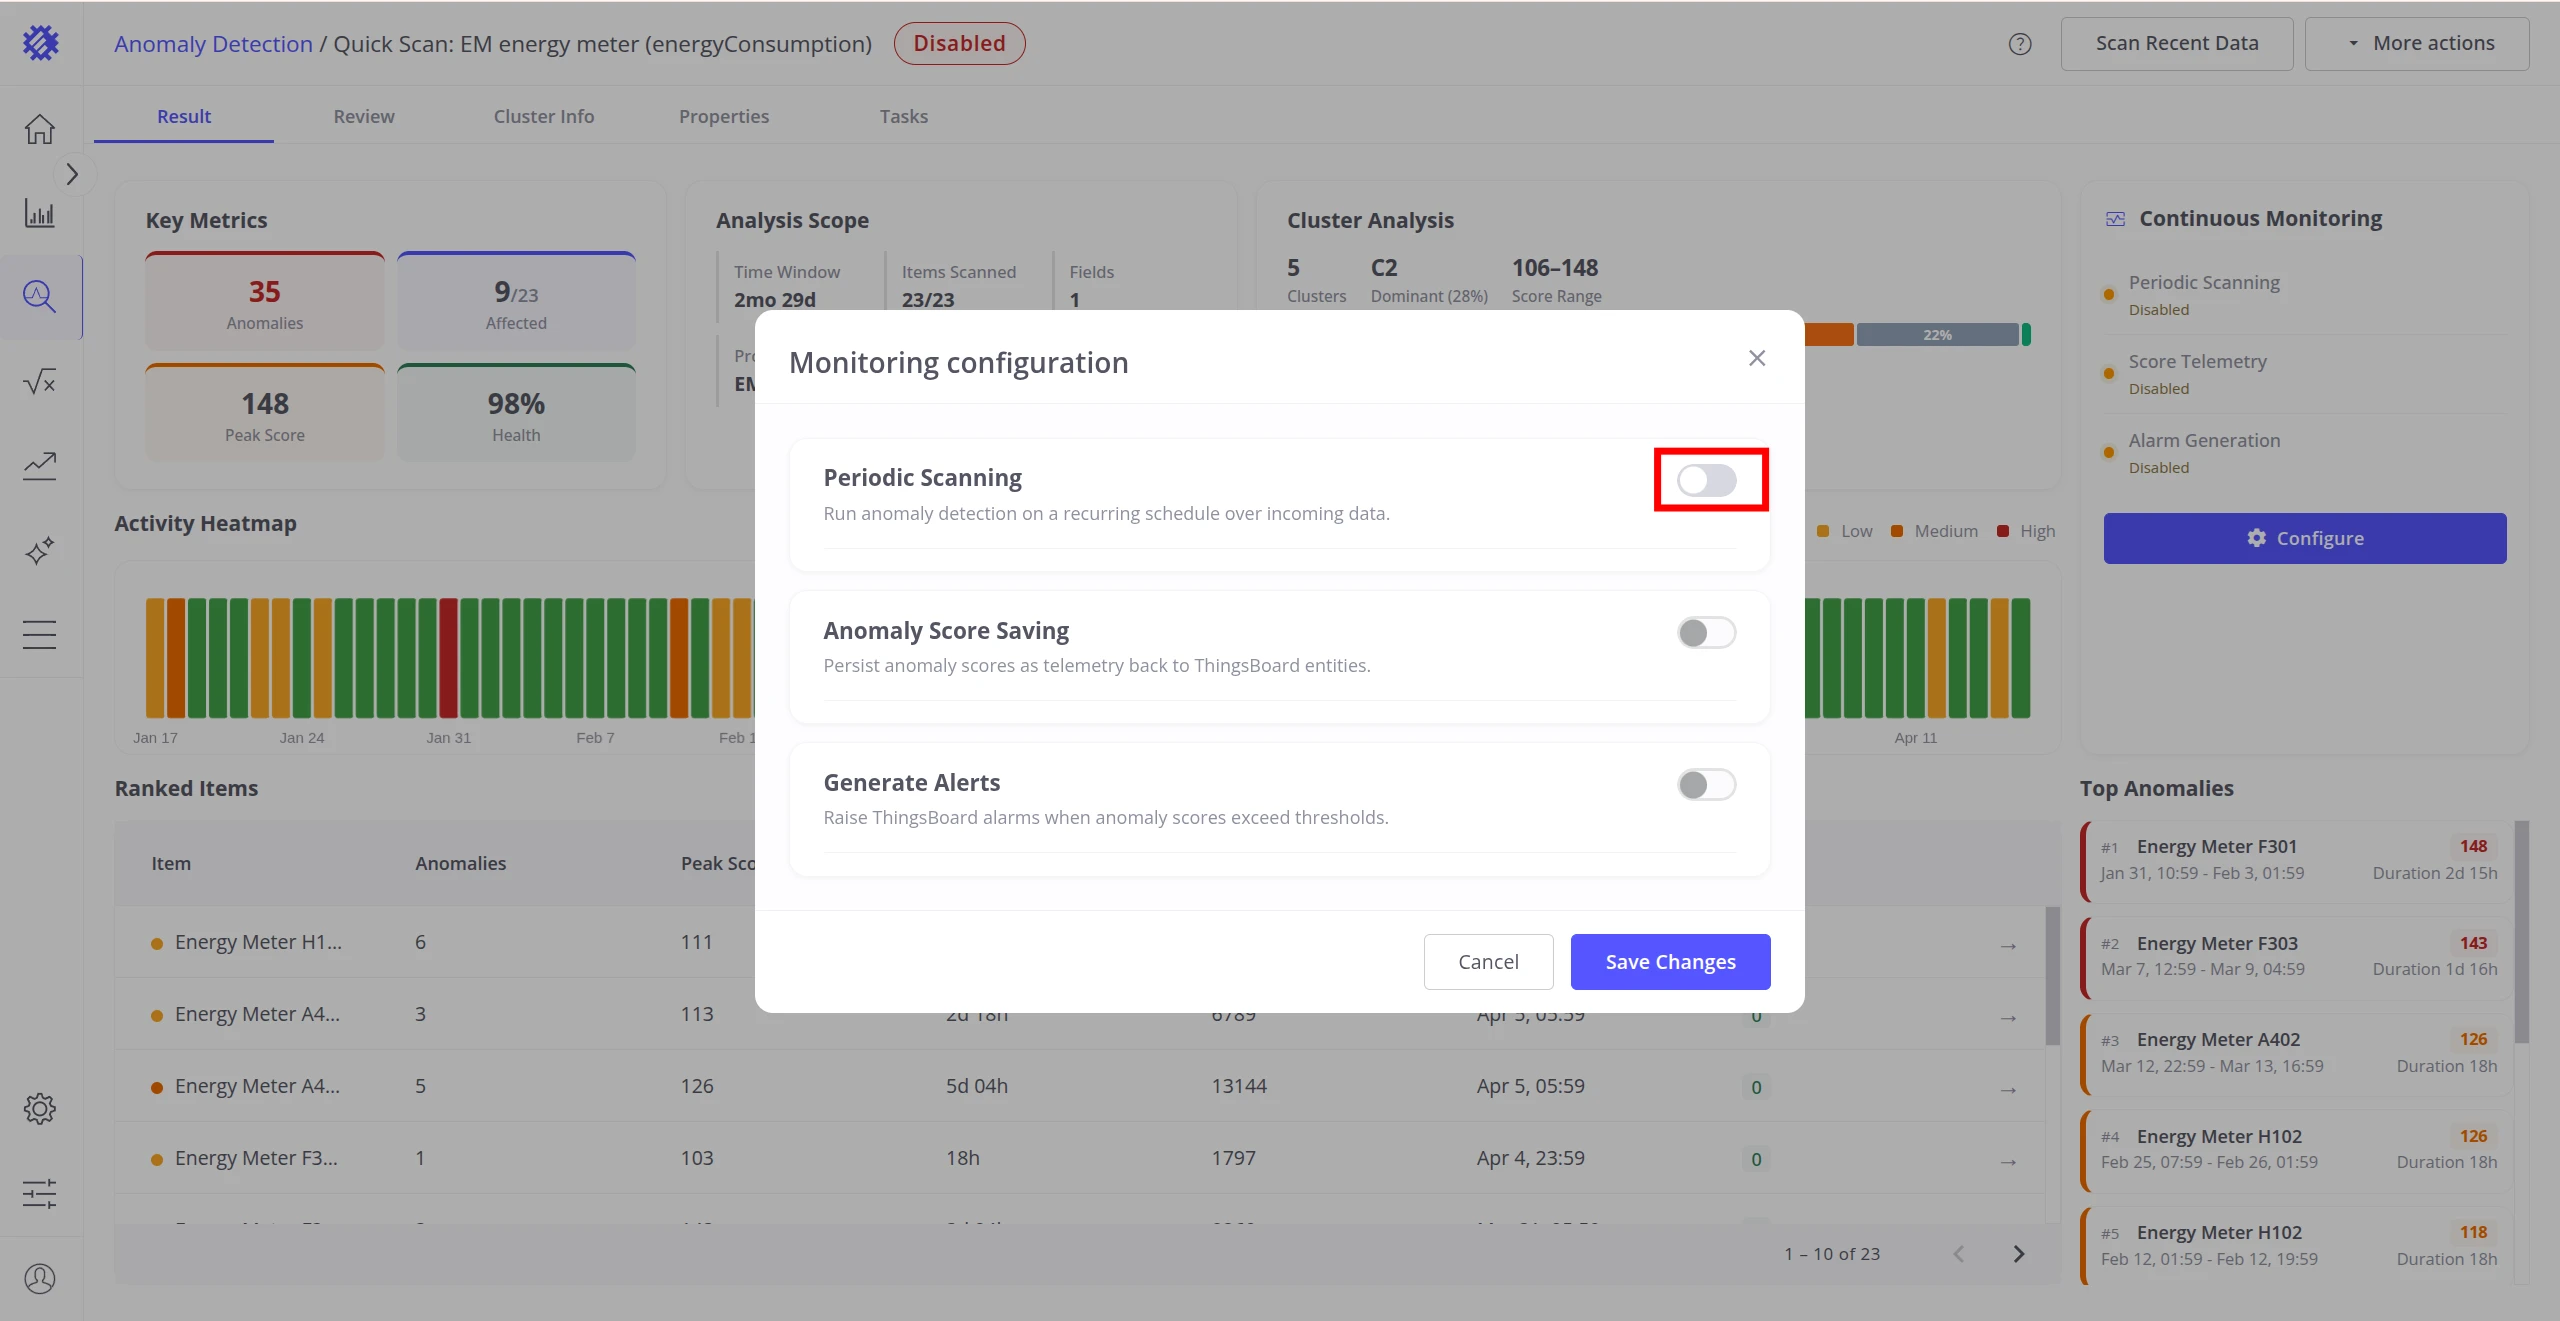
-
Enable Periodic Scanning to run detection on a schedule.
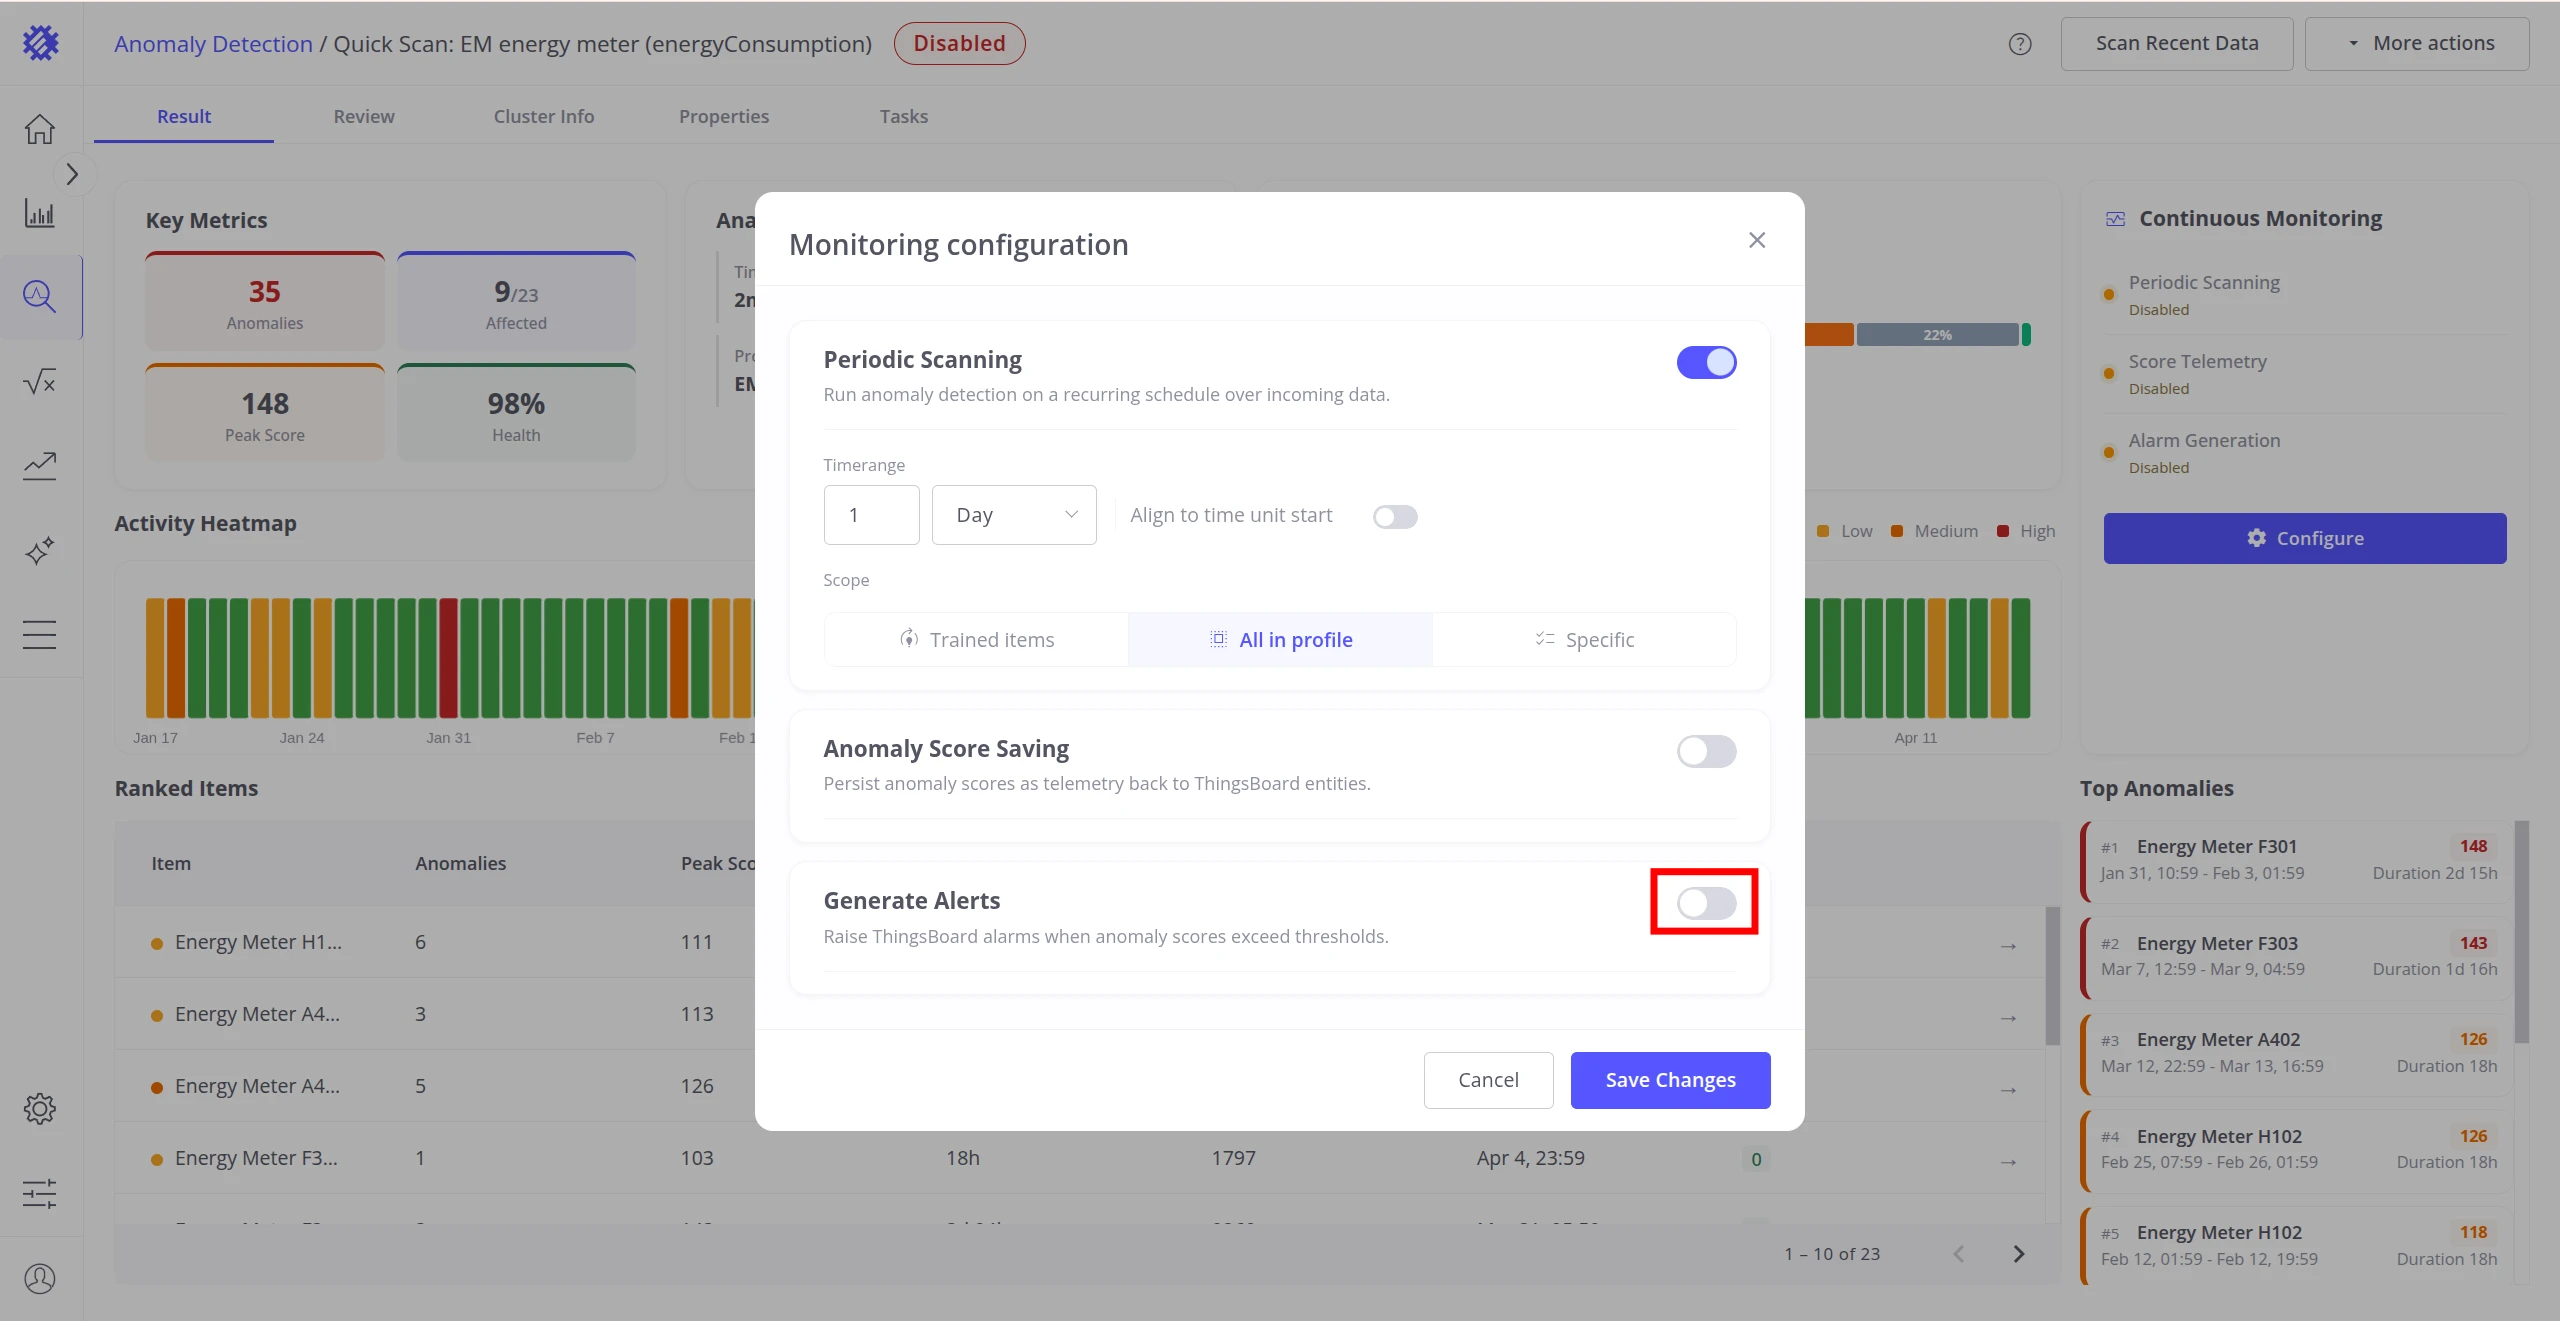
-
Enable Generate Alerts to create ThingsBoard alarms when anomalies exceed severity thresholds.
-
Click Save Changes. The model status changes to Enabled.
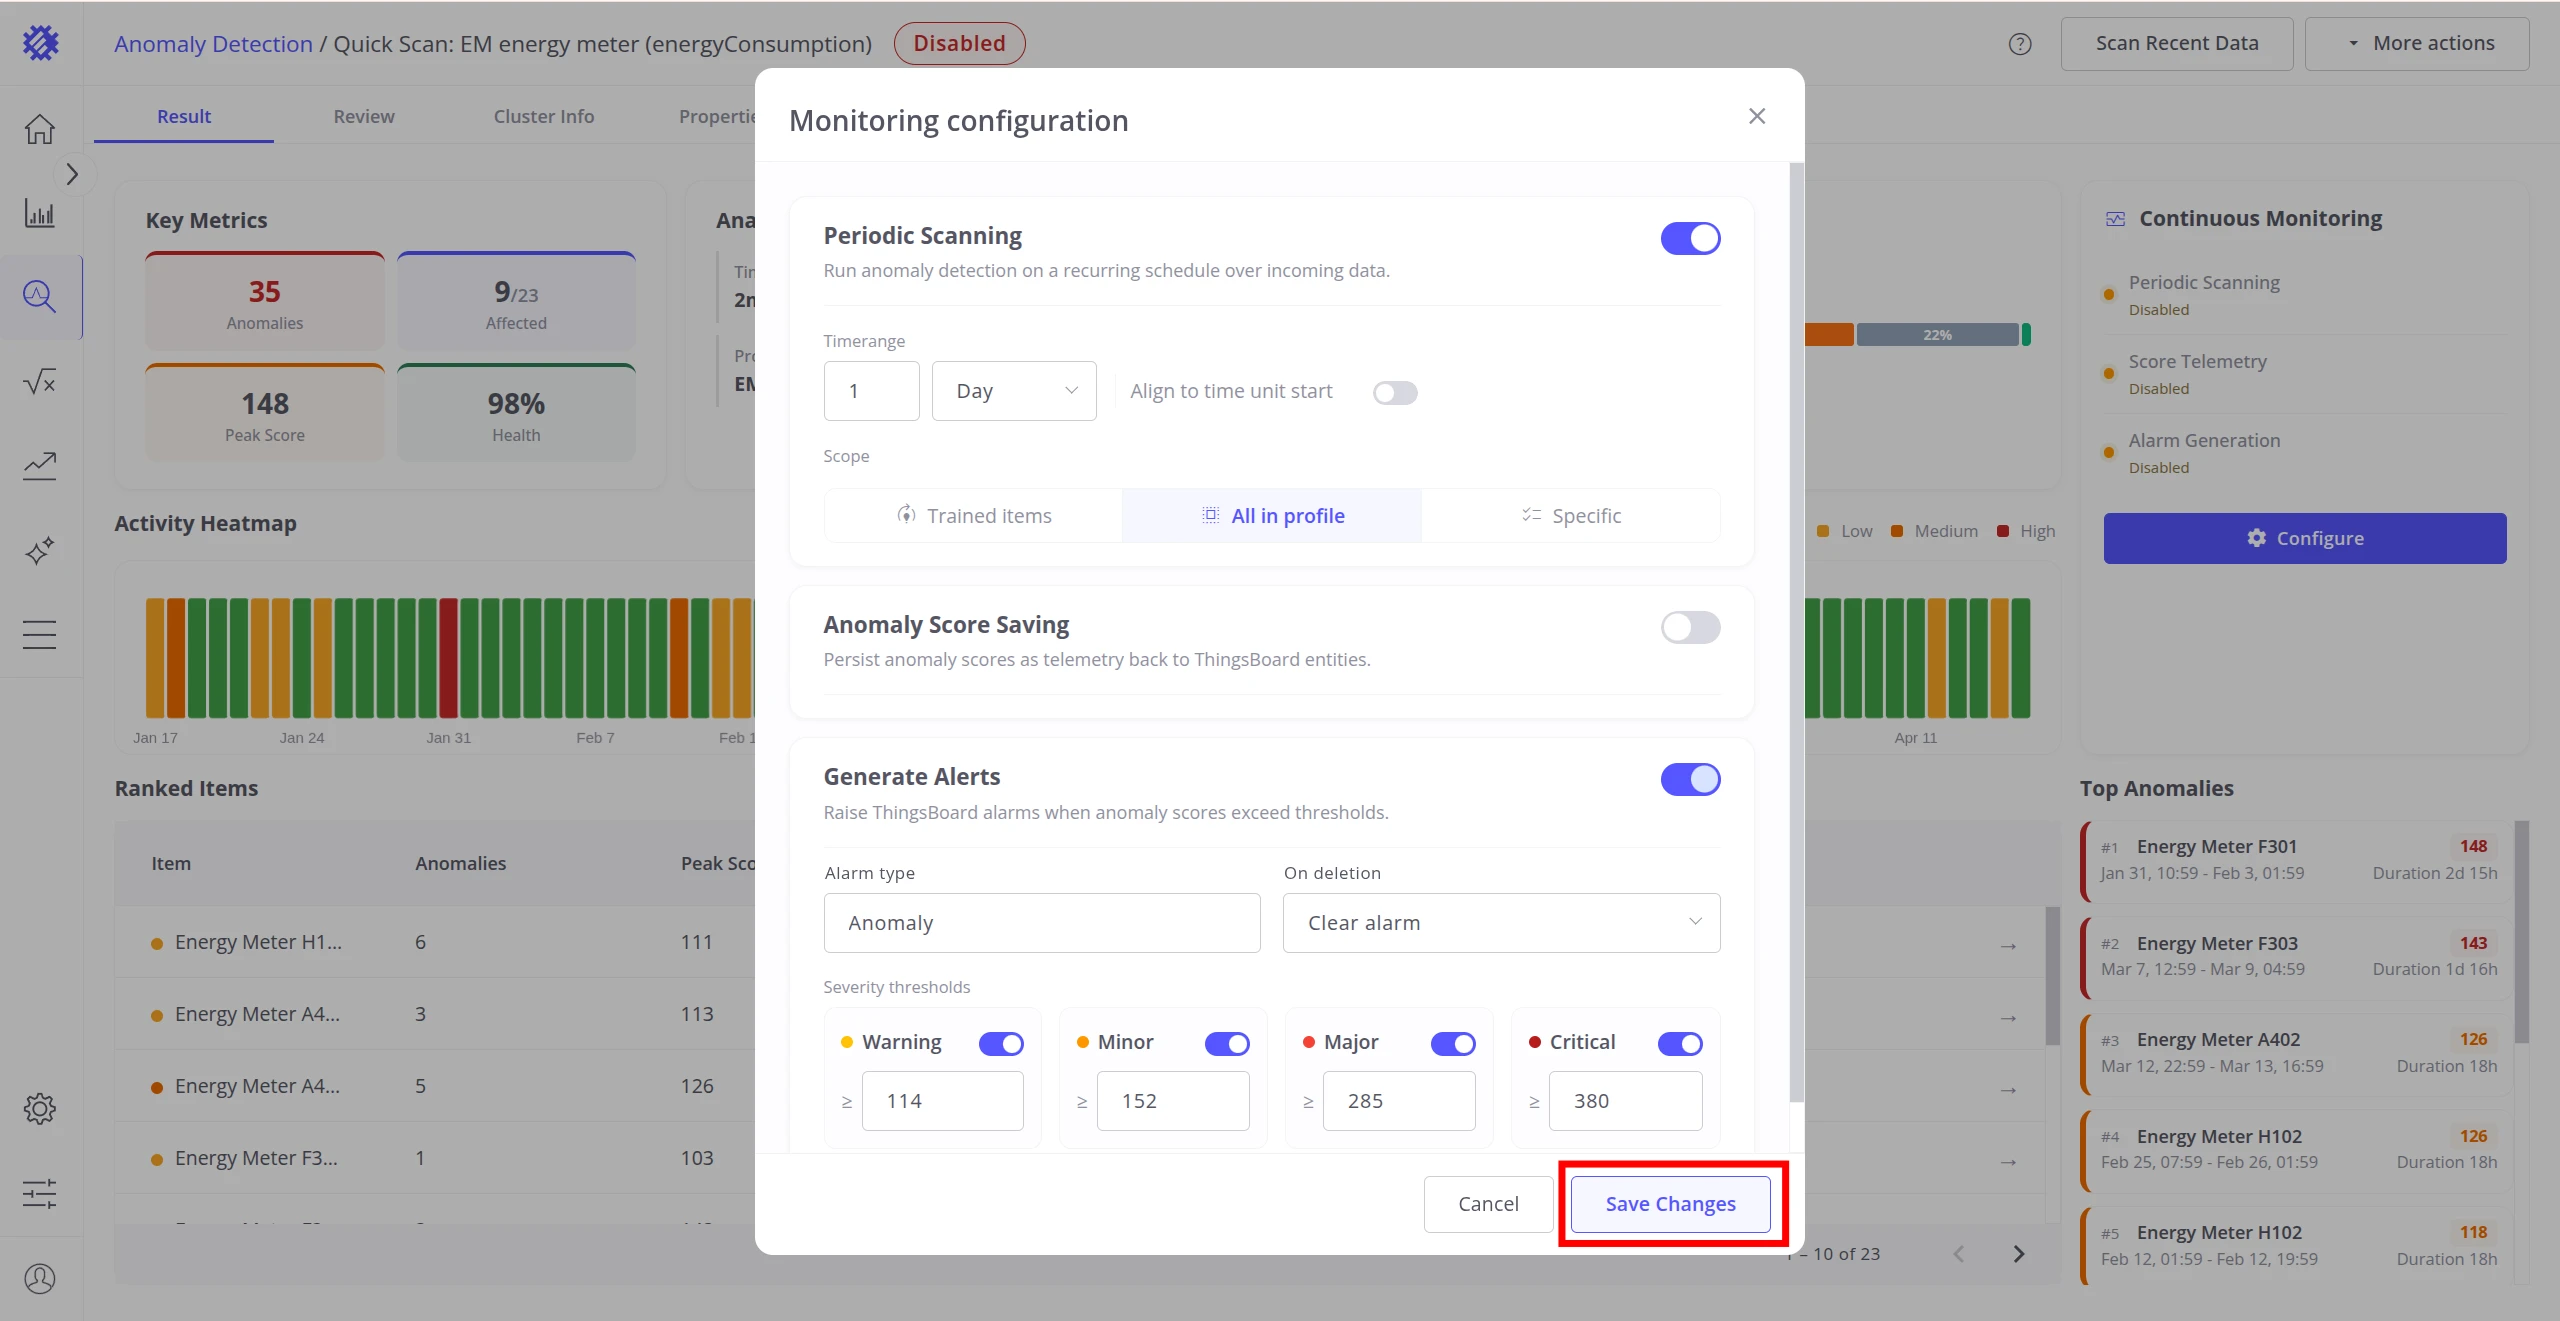
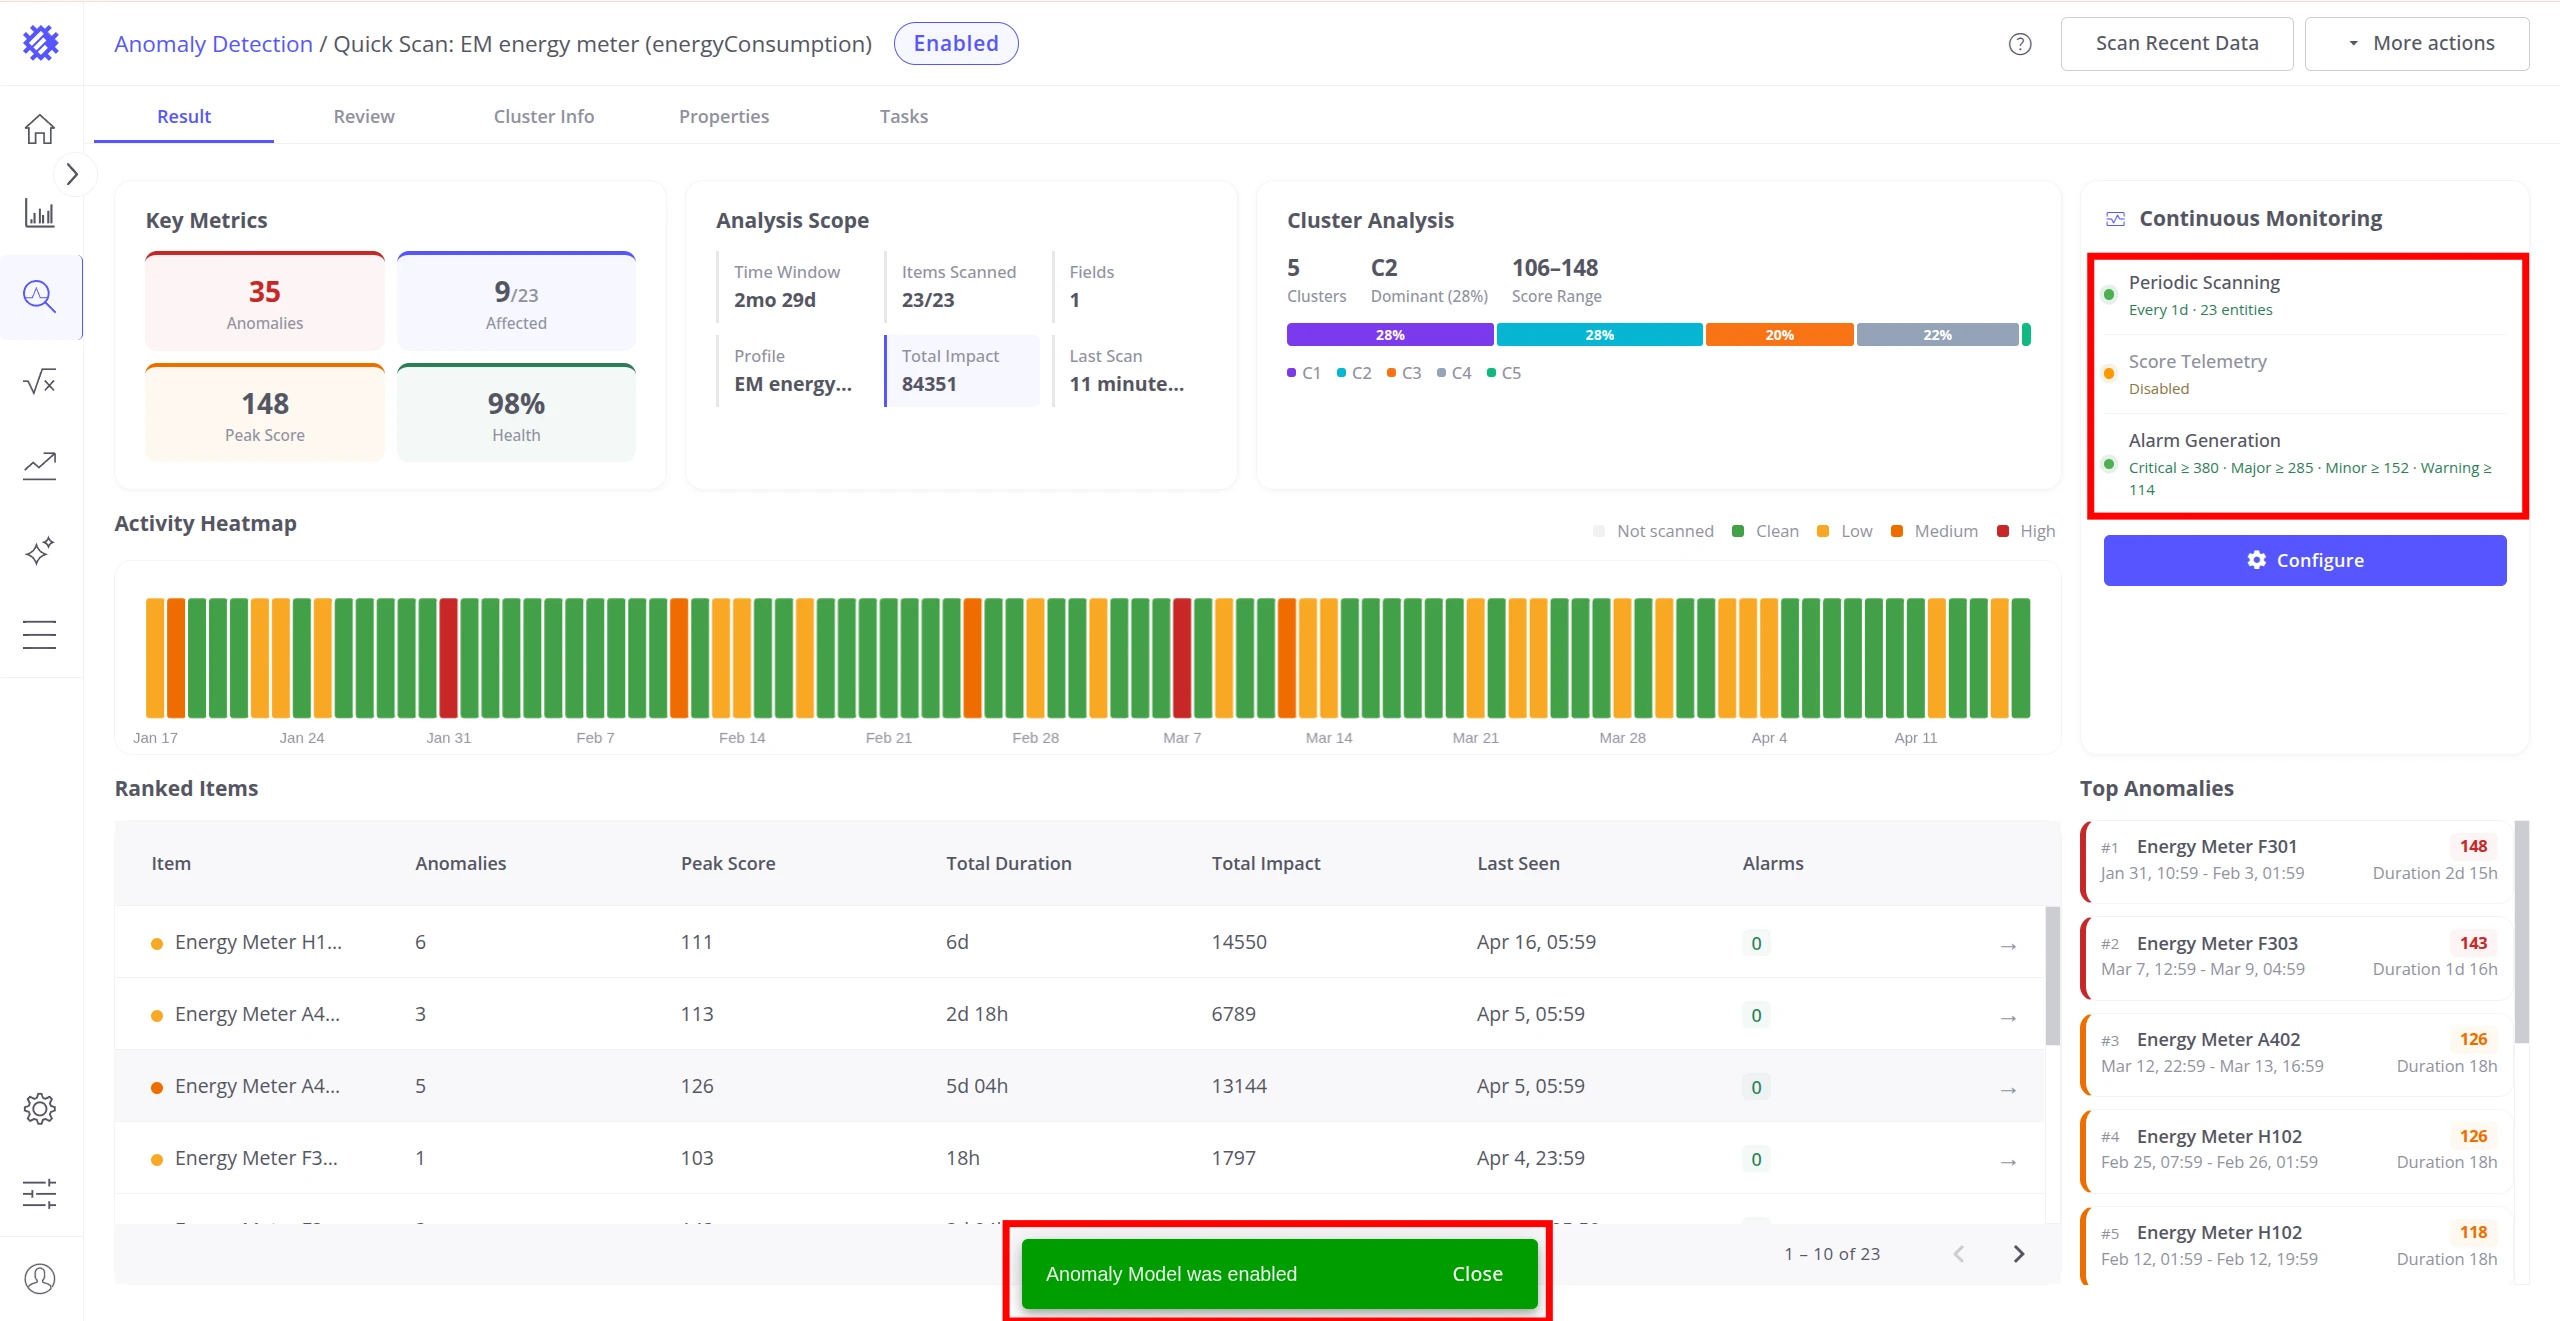
Now we have an anomaly detection model trained on energy consumption data, running periodic scans automatically and triggering ThingsBoard alarms when anomaly scores exceed the configured thresholds.
Read more in Anomaly Detection.
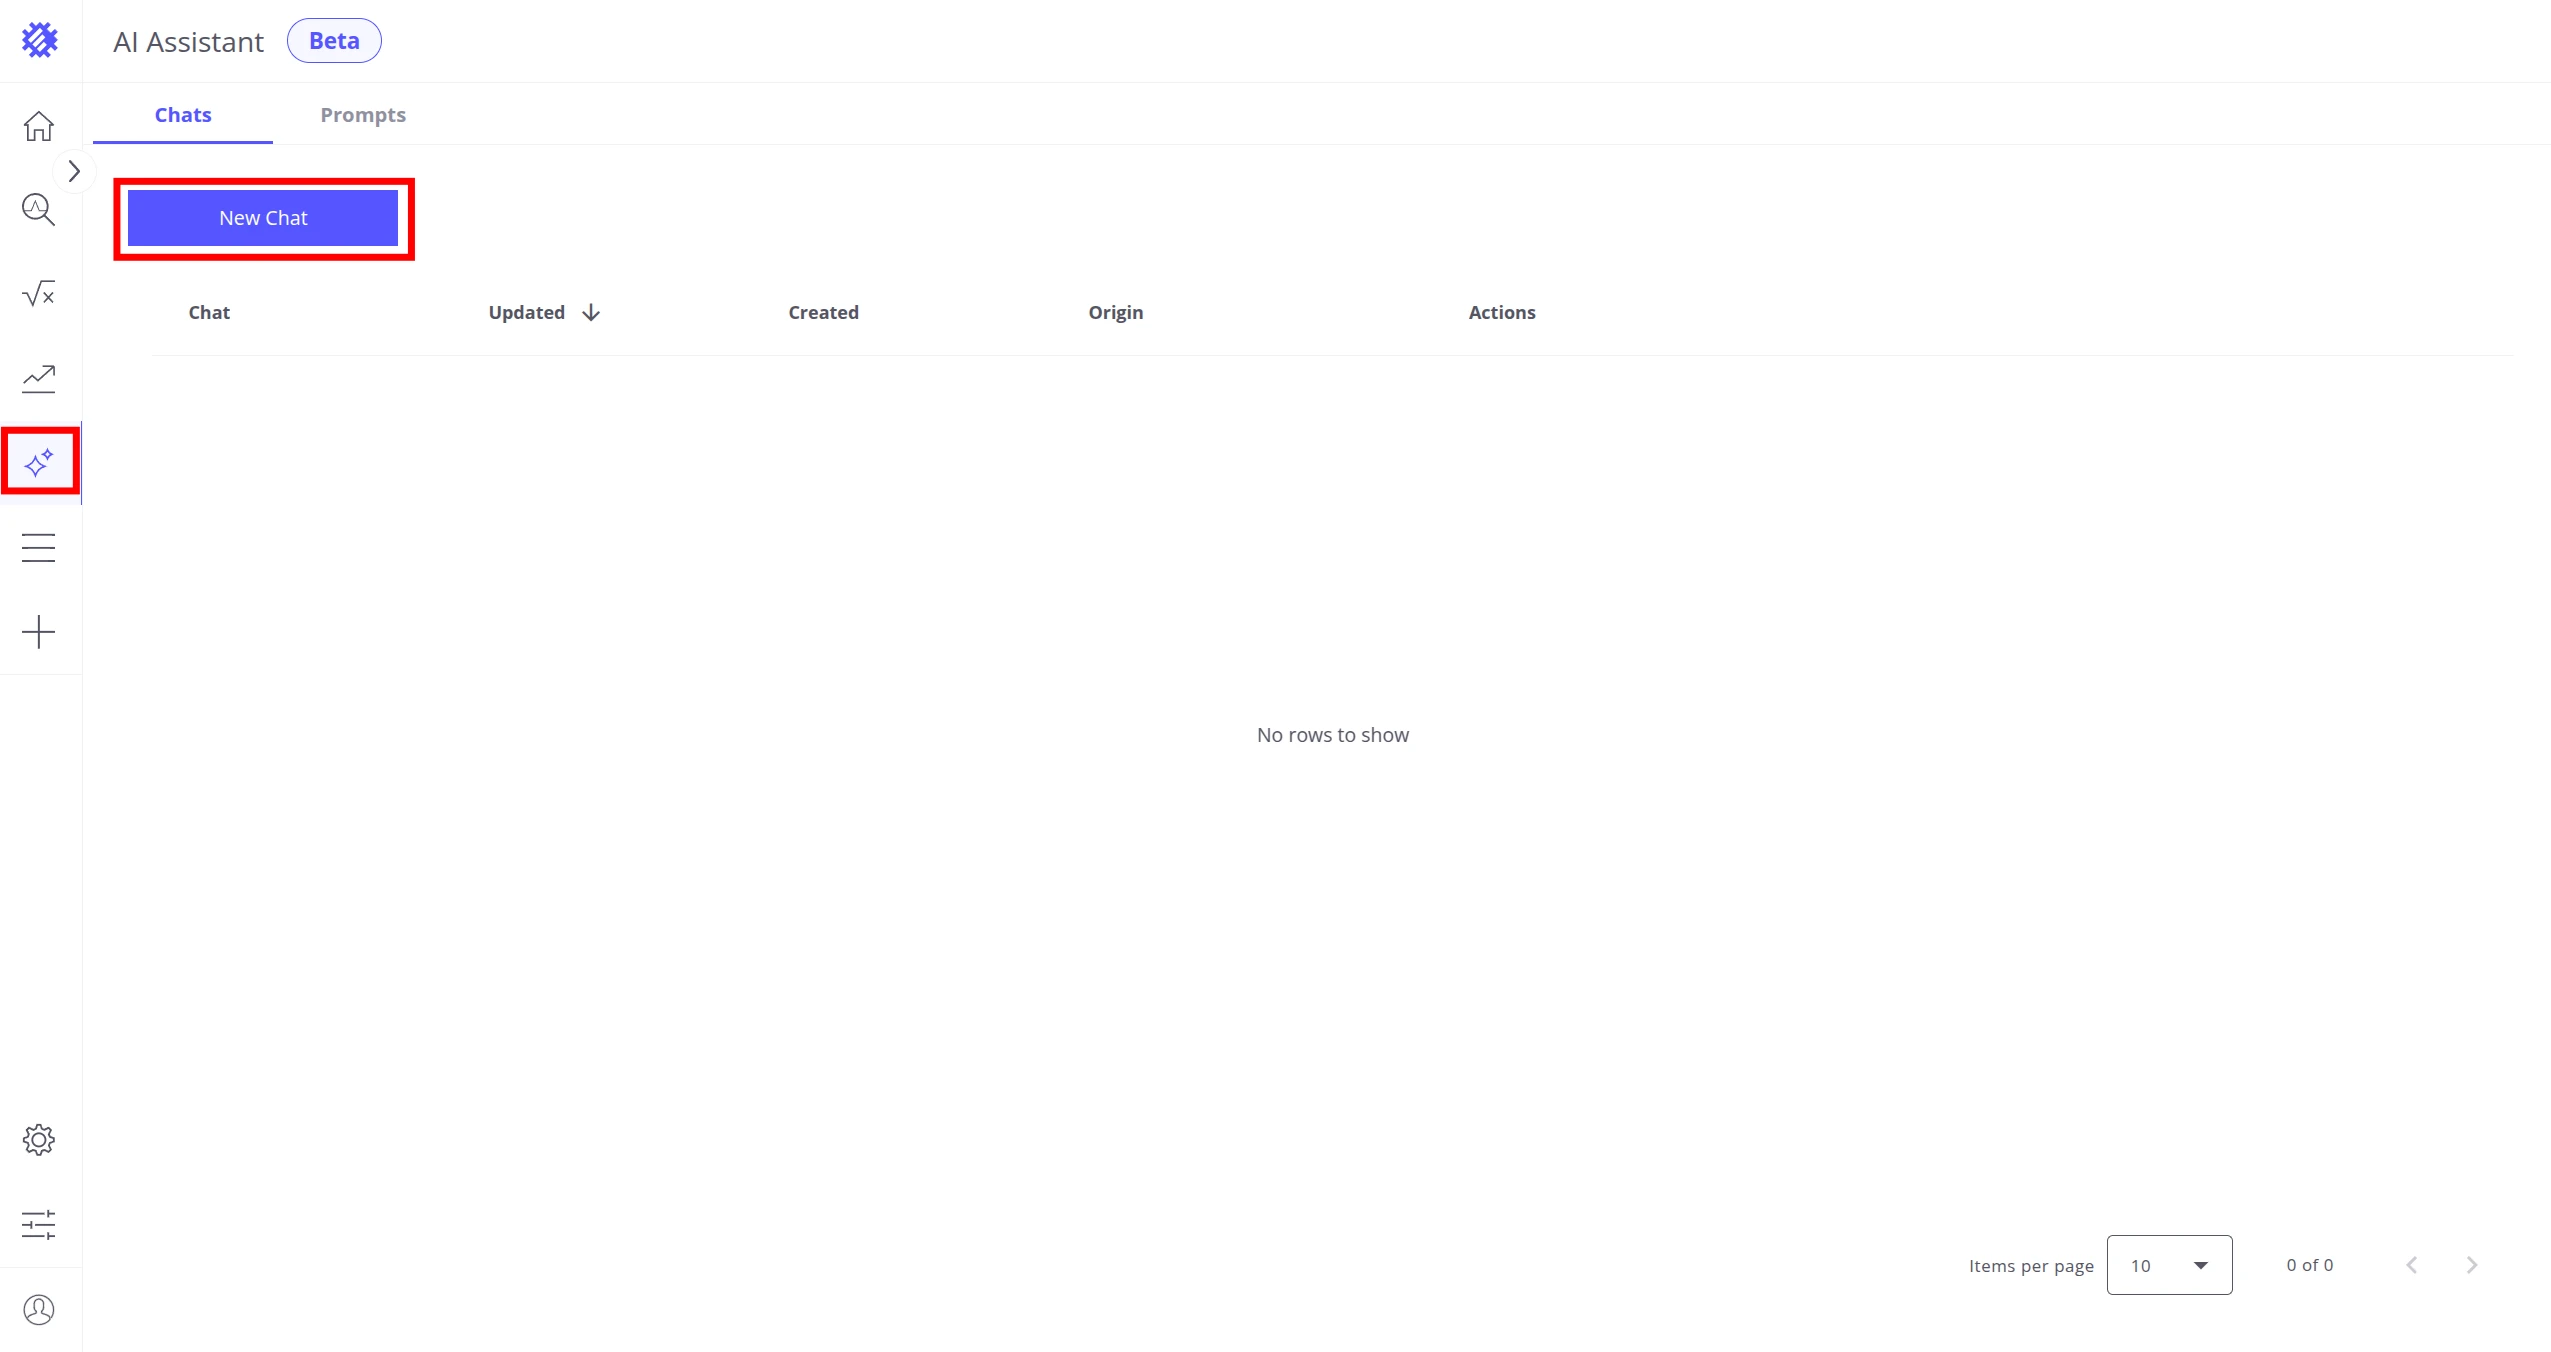
Step 8. Try the AI Assistant
Section titled “Step 8. Try the AI Assistant”The AI Assistant builds Trendz views from natural language requests.
-
Click the Assistant icon to open the Assistant page, then click New Chat.
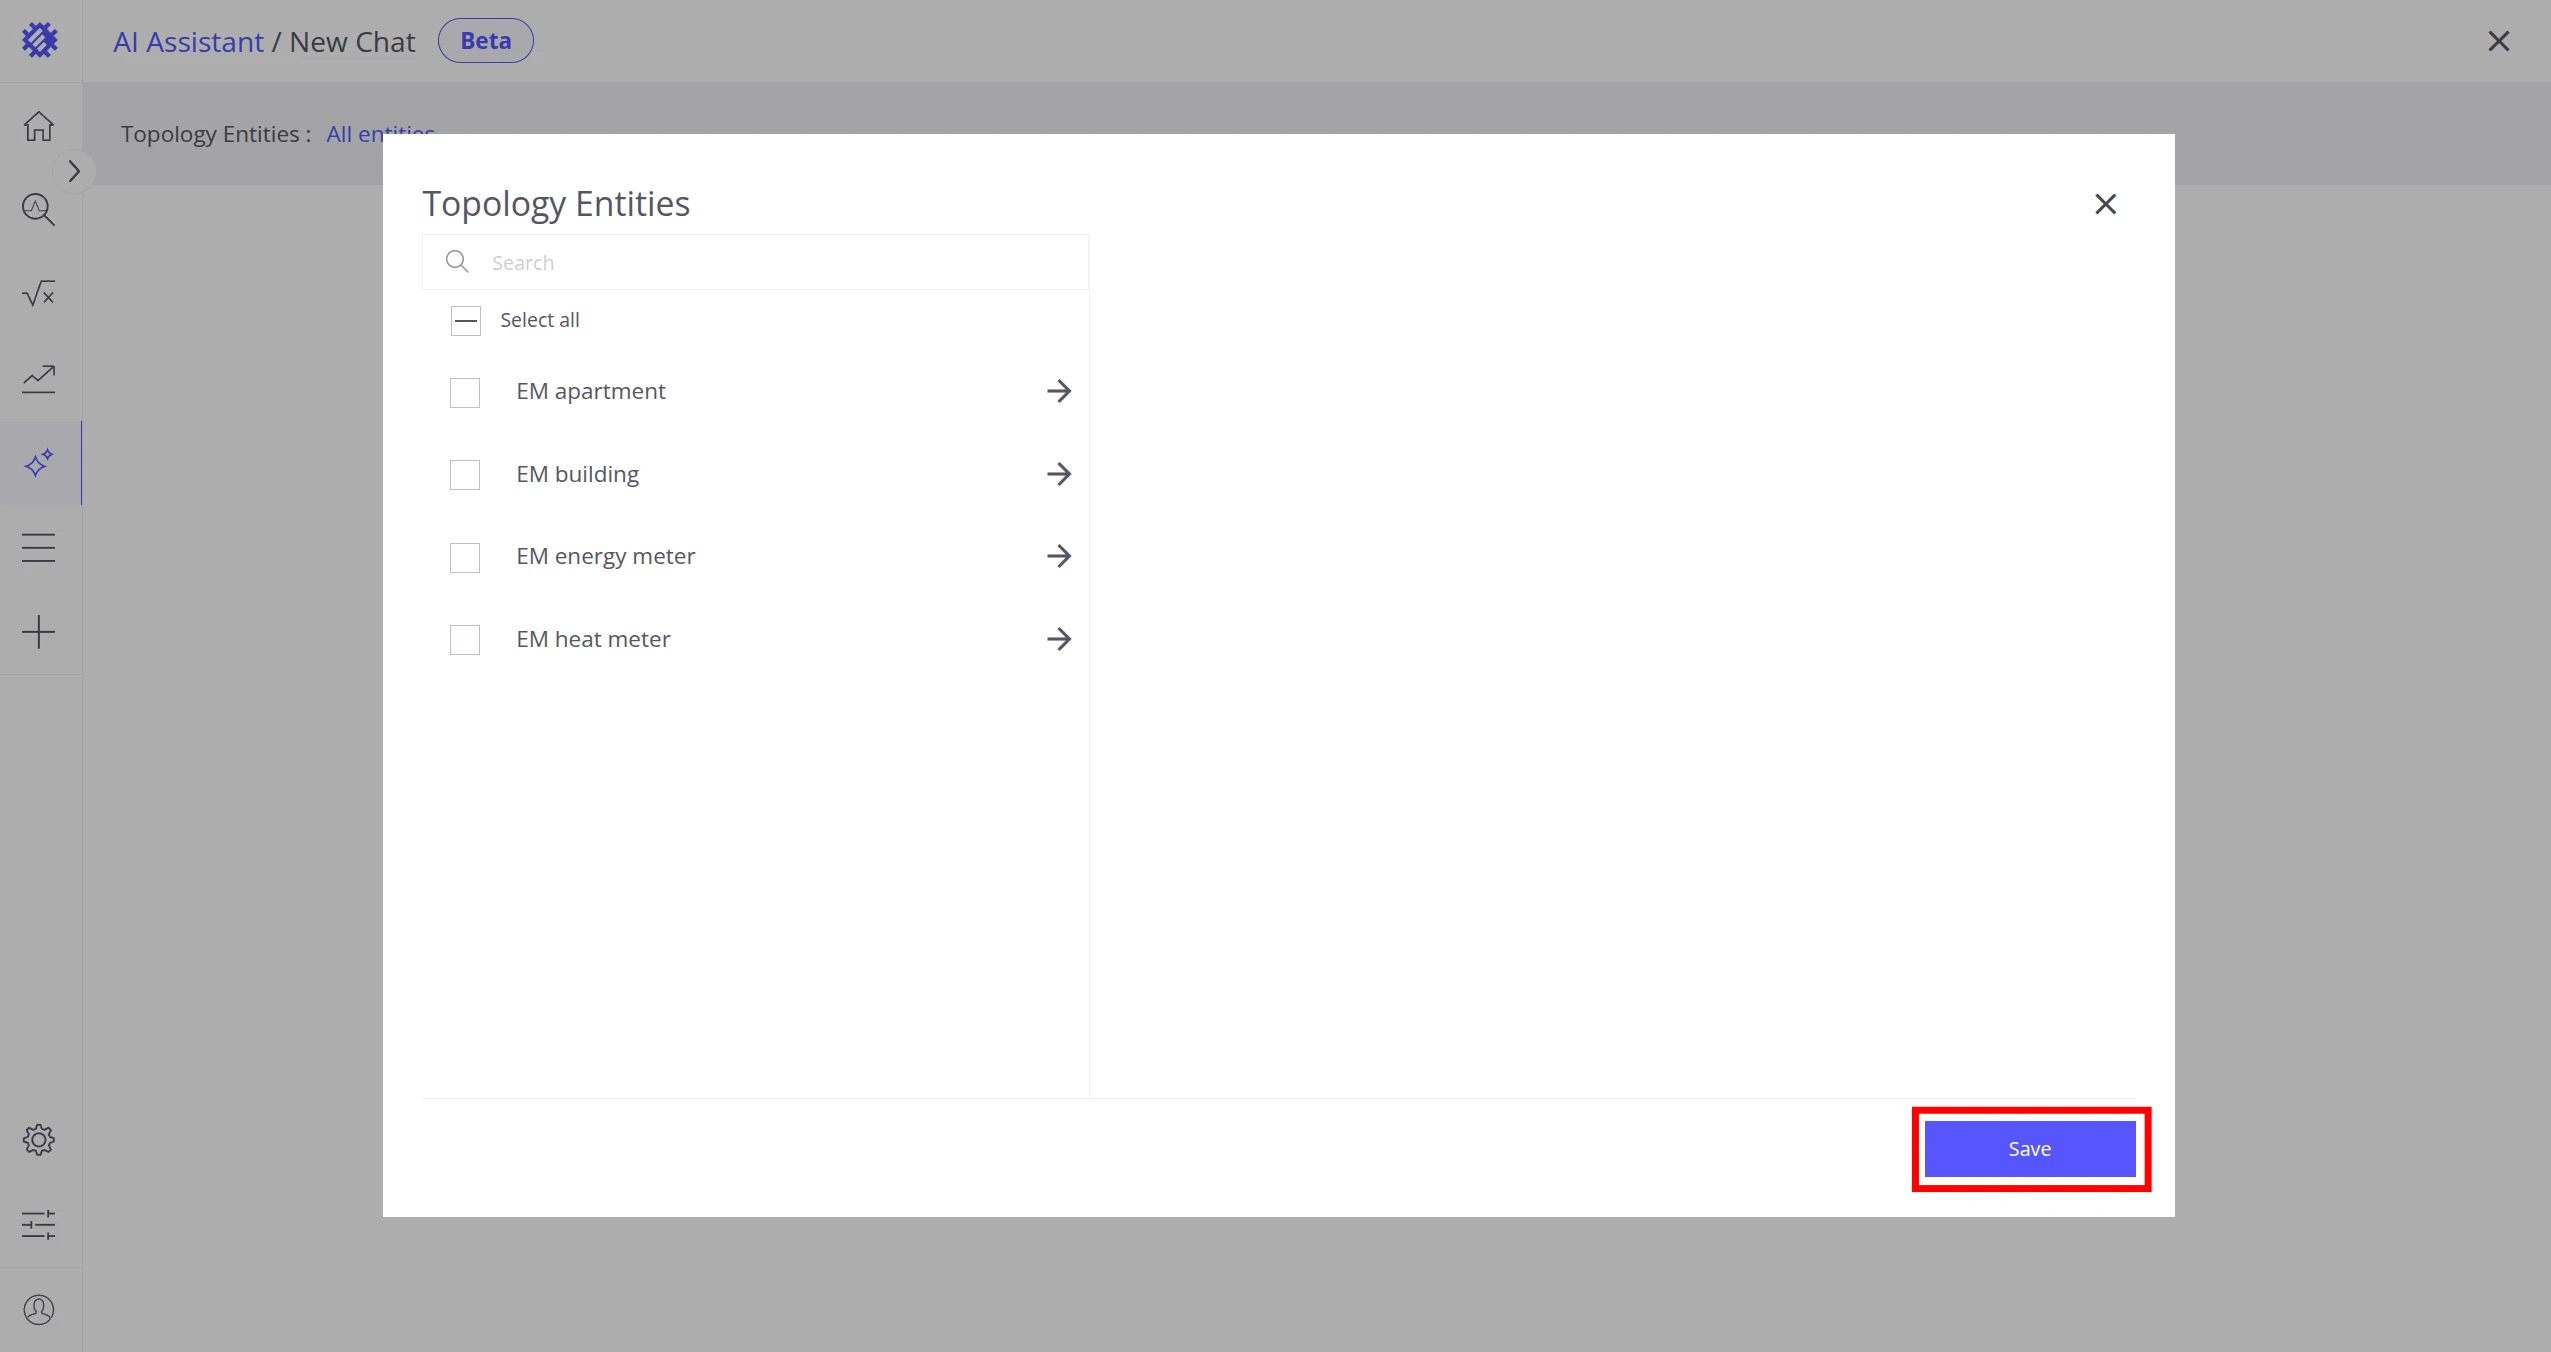
-
When prompted to select topology entities, click Save.
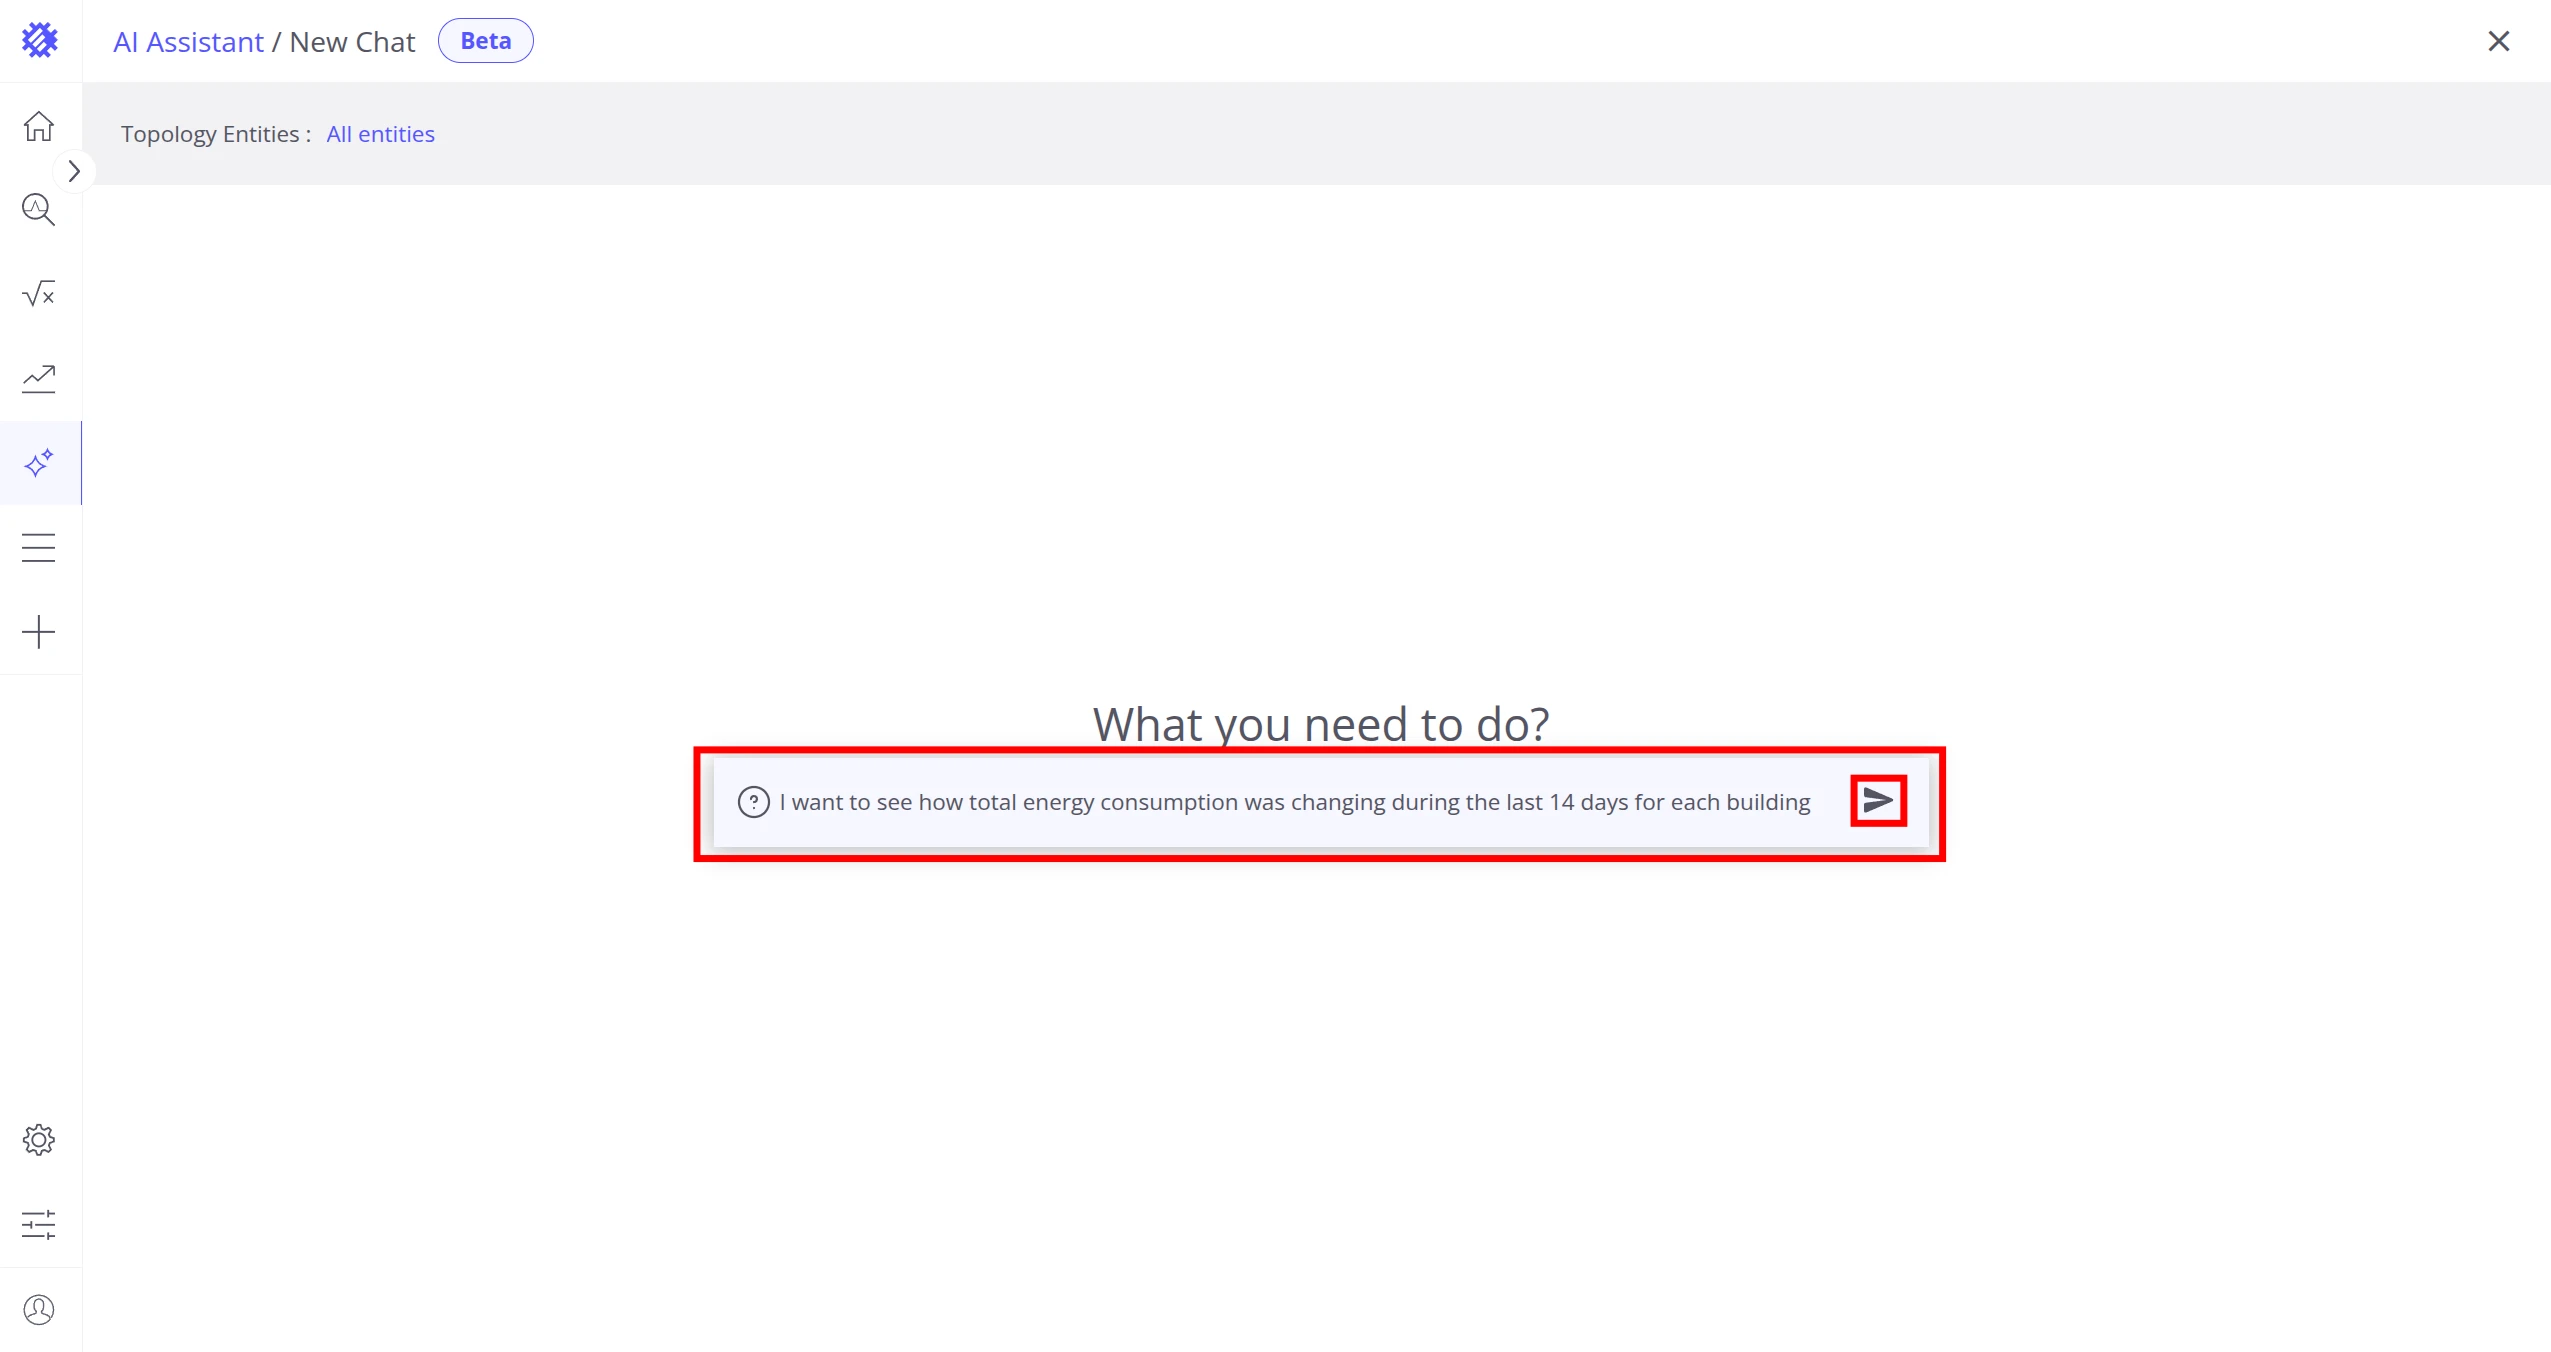
-
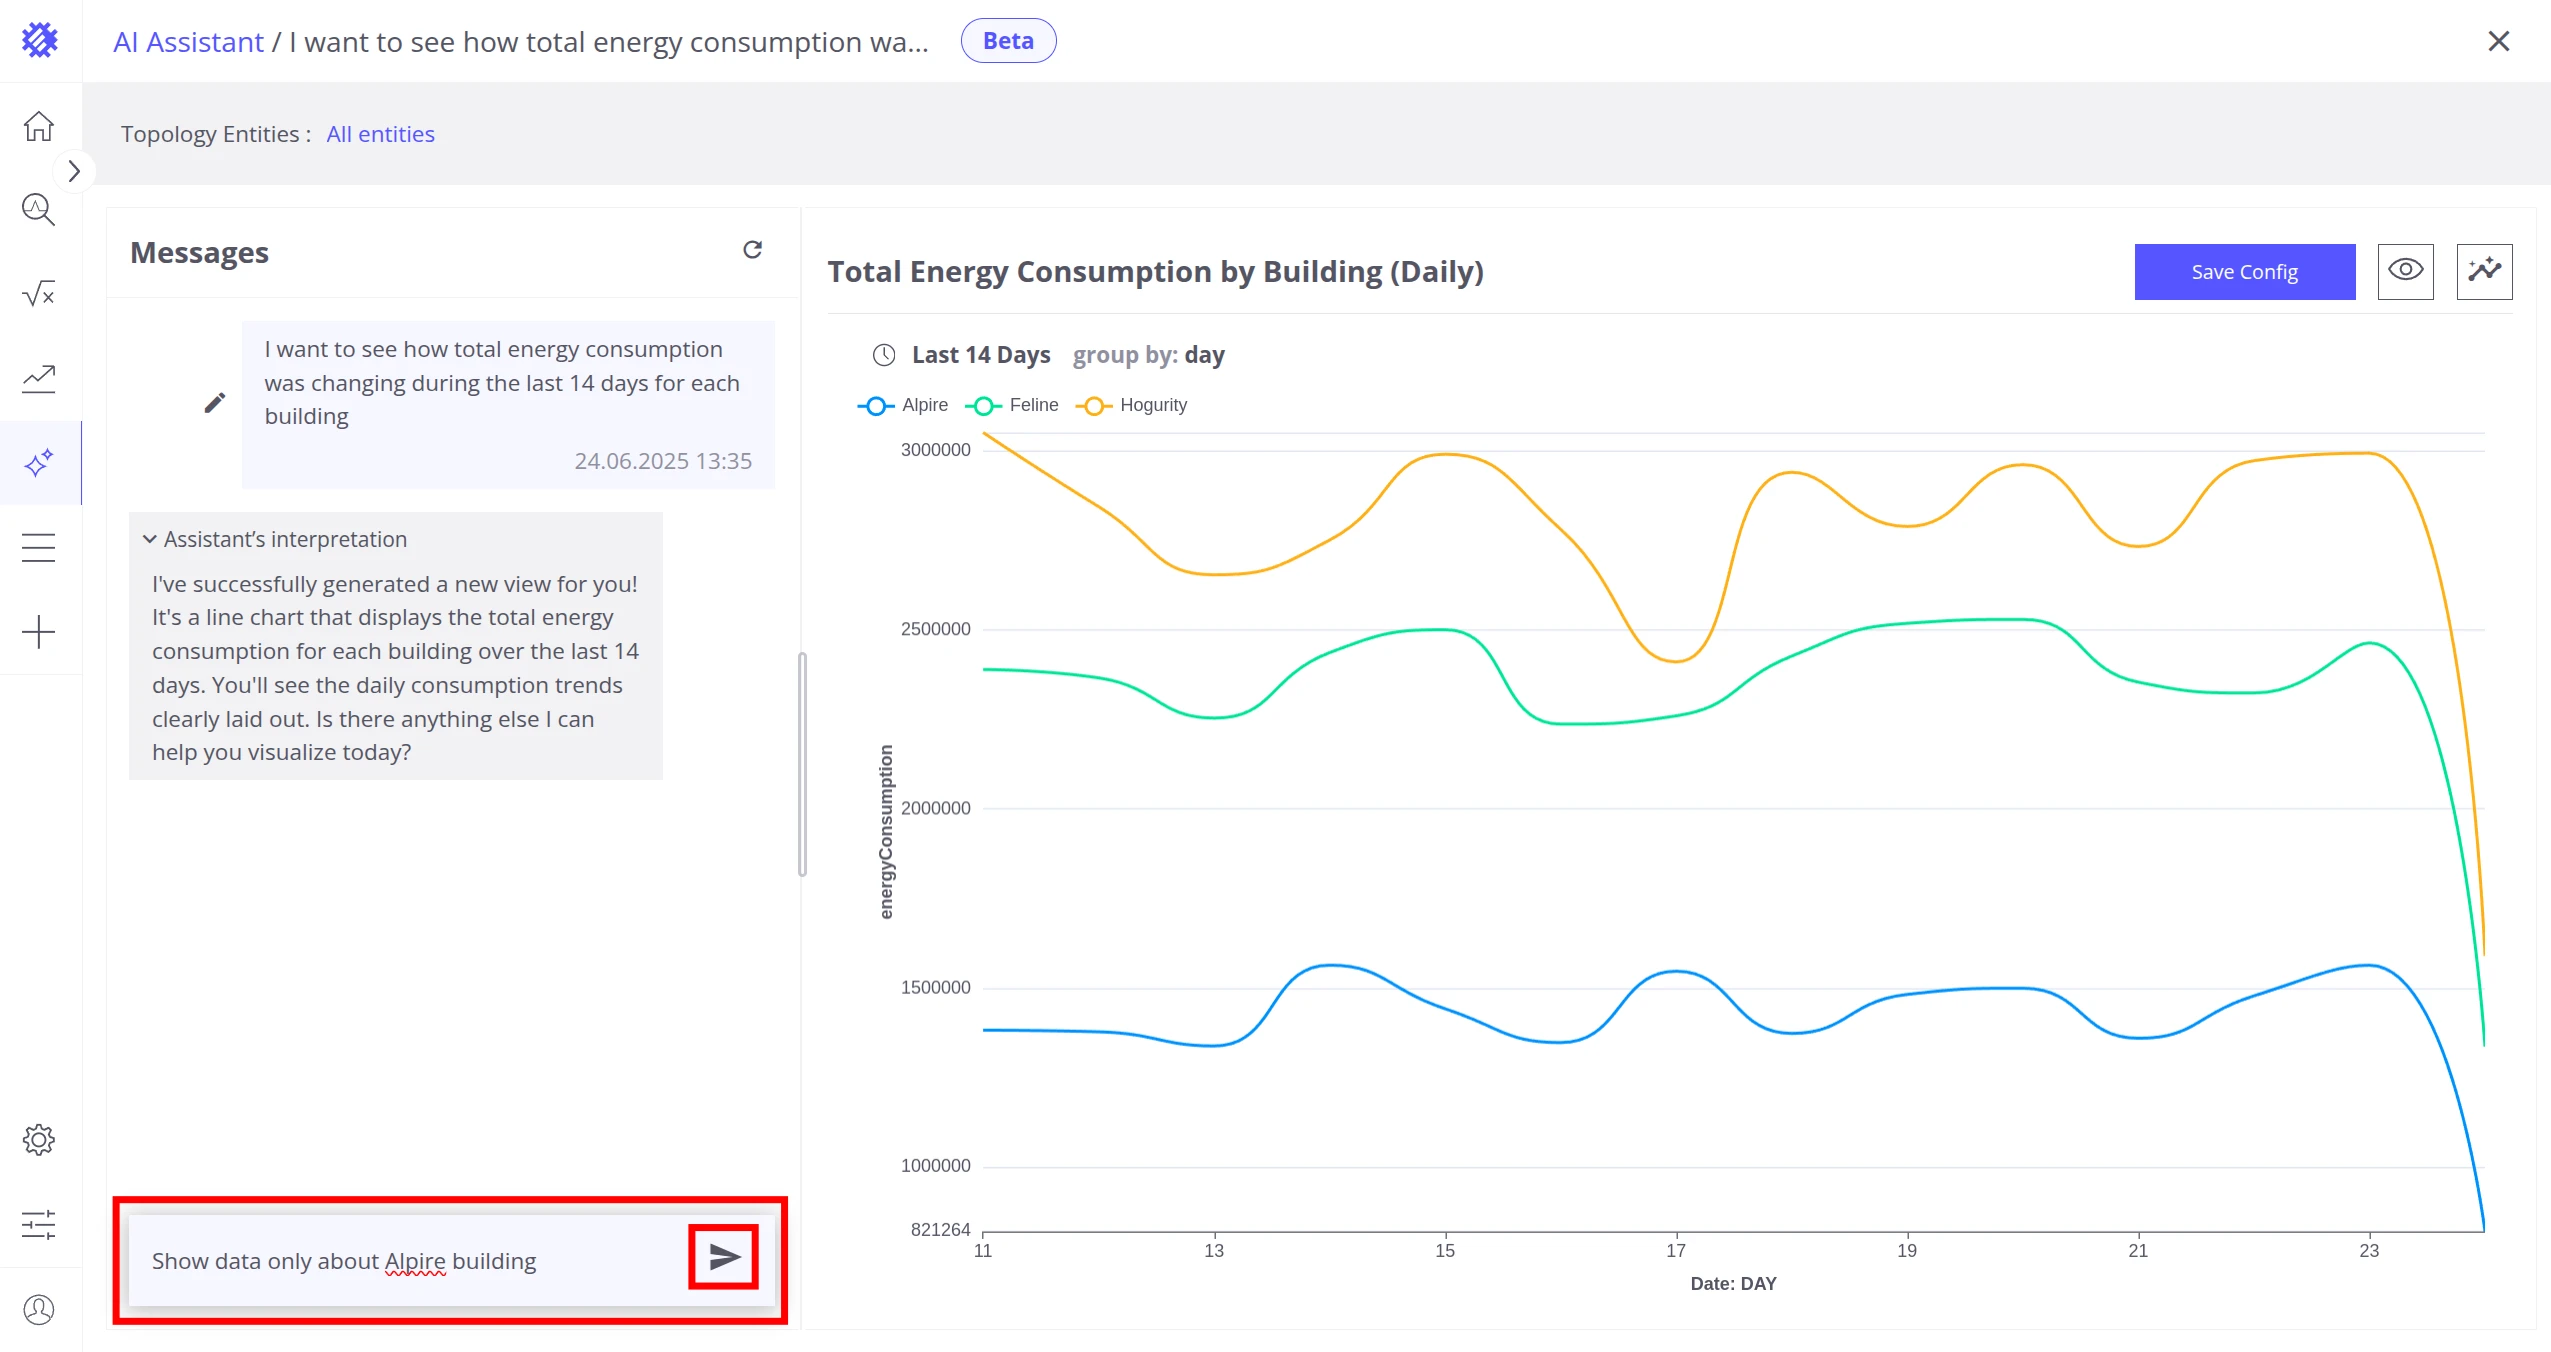
Type the following in the chat input:
I want to see how total energy consumption was changing during the last 14 days for each building
-
Review the generated view and validate the results.
-
Type a follow-up instruction:
Show data only about Alpire building
-
Observe that a building filter has been added automatically.
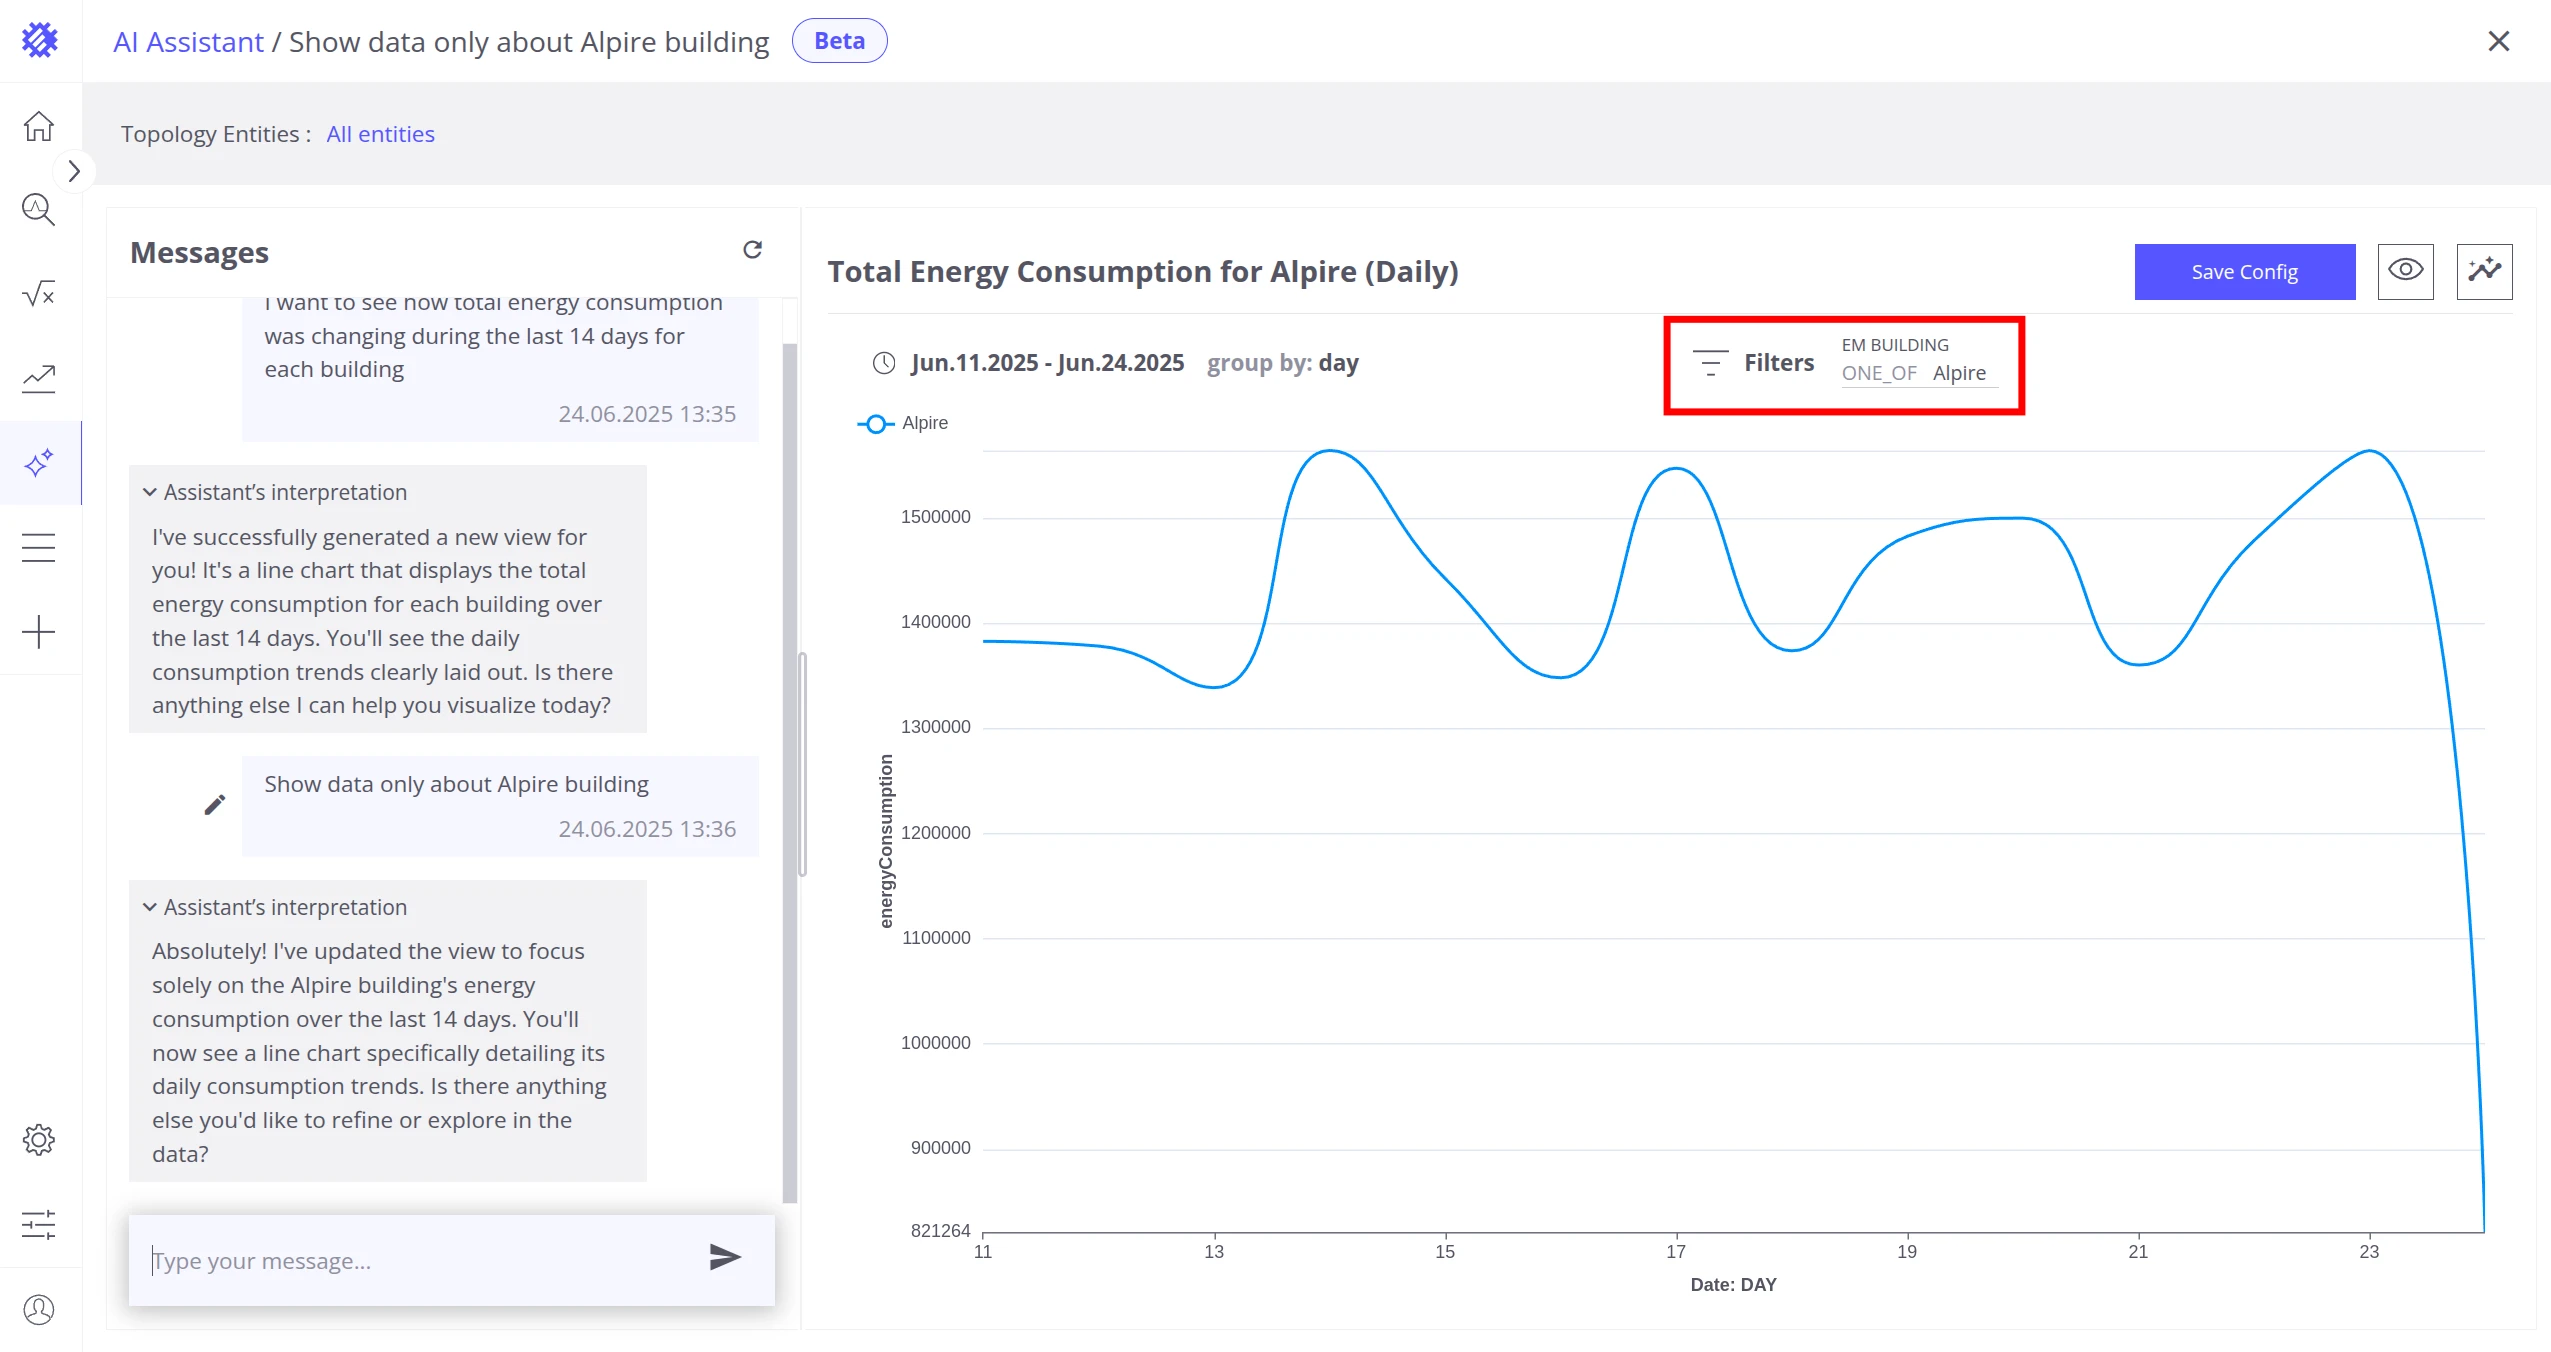
Now we have used the AI Assistant to generate a Trendz view from a natural language prompt and refined it with a follow-up filter instruction — no manual field configuration needed.
Read more in AI Assistance.
Was this helpful?