Create interactive dashboards that turn raw IoT data into actionable intelligence.
Try it now
IoT Data visualization is the process of turning raw device data into visual formats like charts, graphs, and gauges to help users quickly understand patterns and trends. In ThingsBoard, you can create real-time dashboards using a variety of widgets—charts, tables, SCADA symbols, and more—for monitoring and control. Dashboards support responsive layouts, navigation flows, and can be easily shared with customers.

A widget is a dashboard element that displays specific information or provides functionality. Widgets can show static, latest, or historical device data, enable remote control, and support alarm monitoring and management.

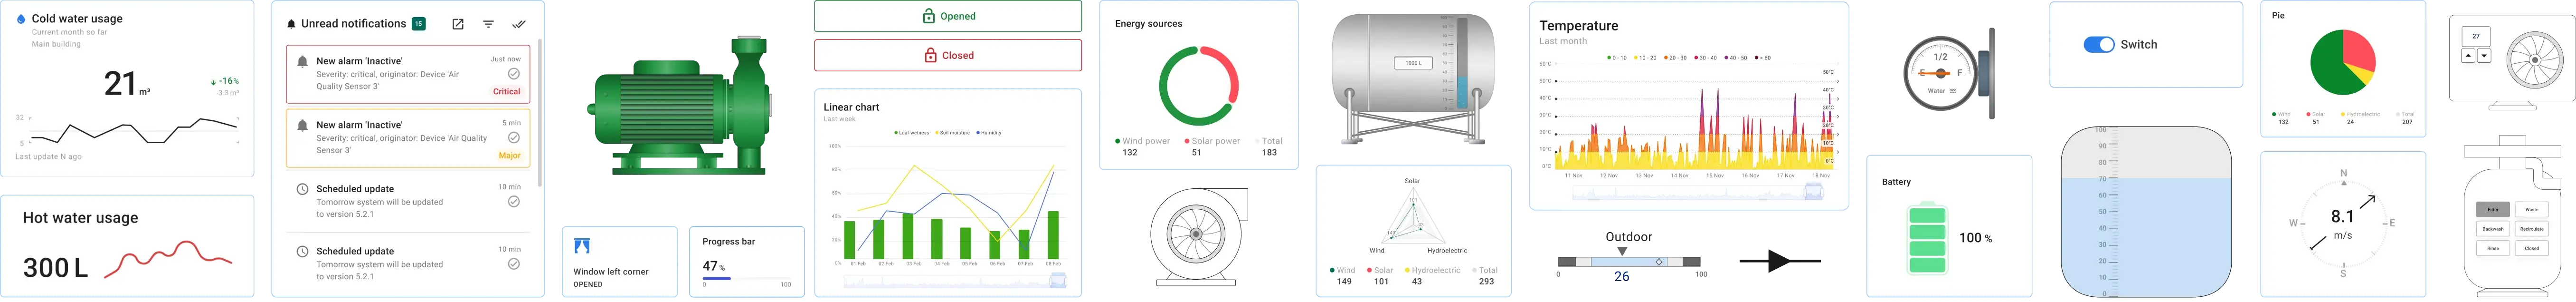
The Cards bundle is useful for visualization of time series data or attributes in table or card widgets.

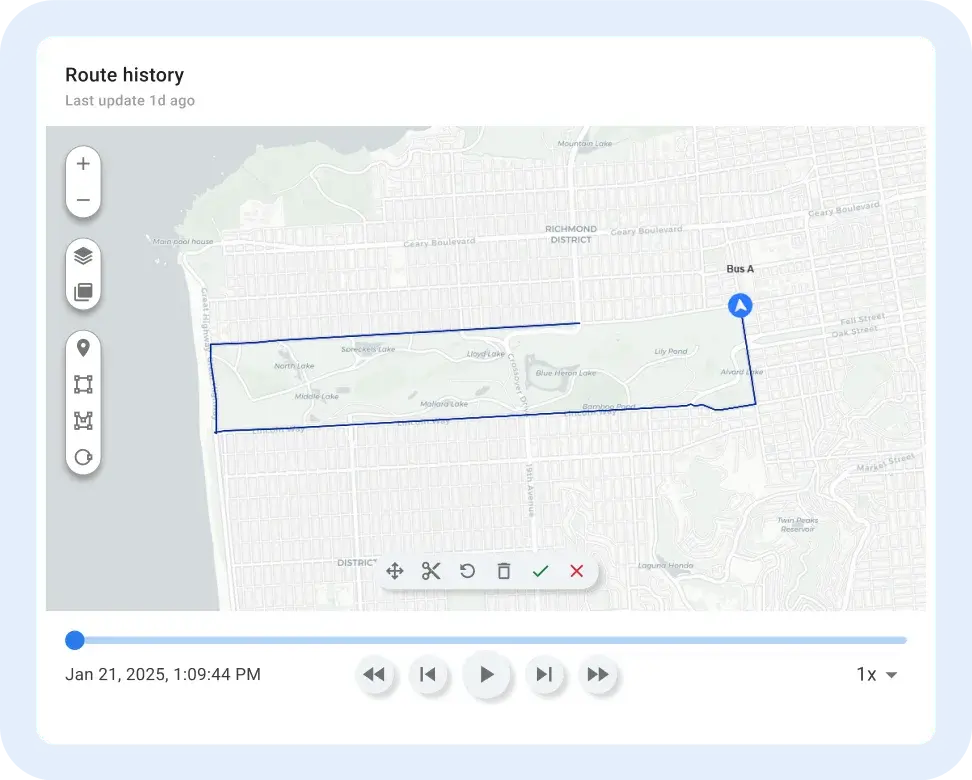
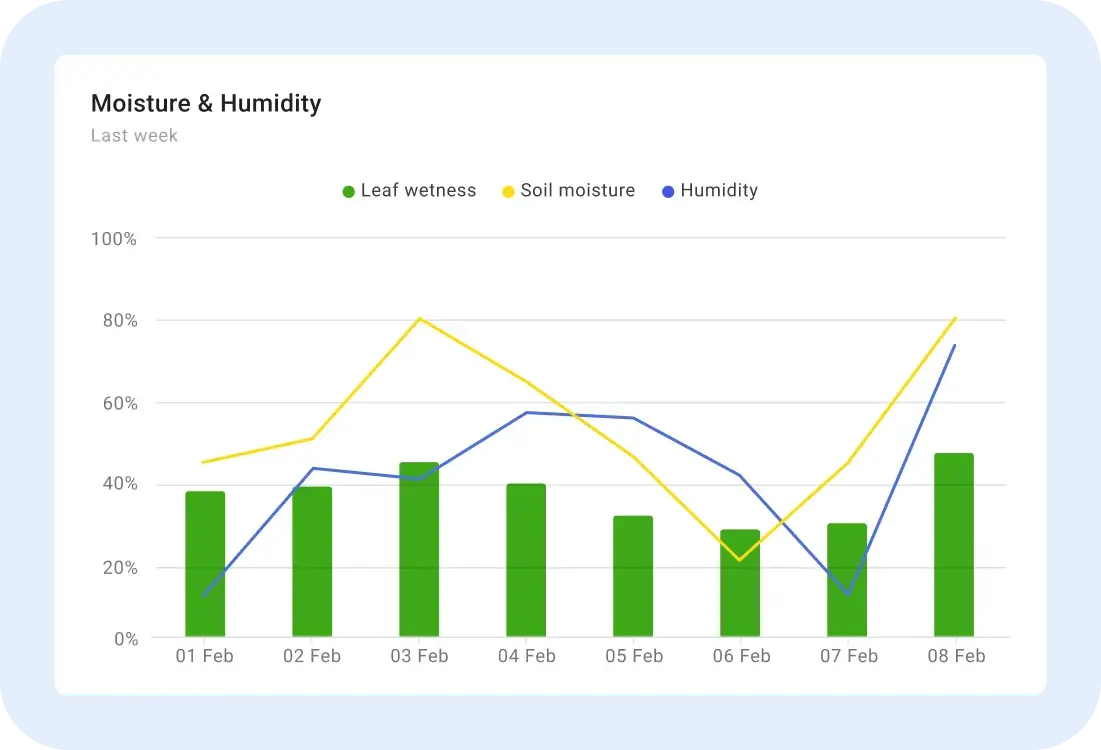
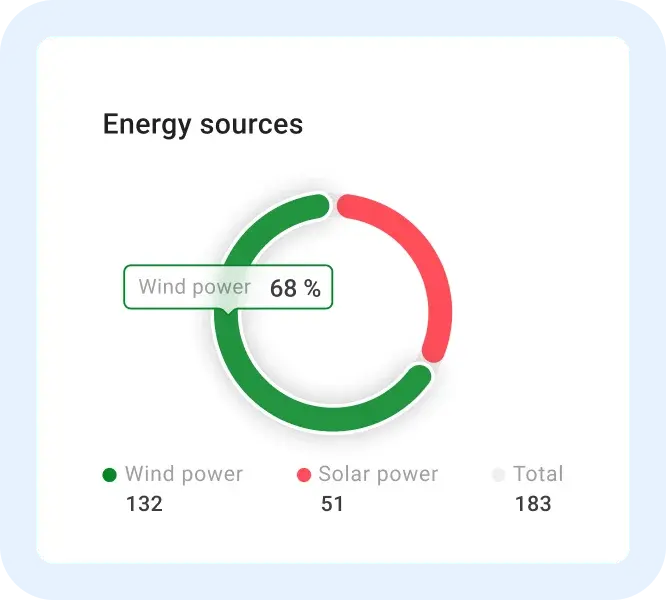
The Charts bundle is useful for visualization of historical or real-time data with a time window.

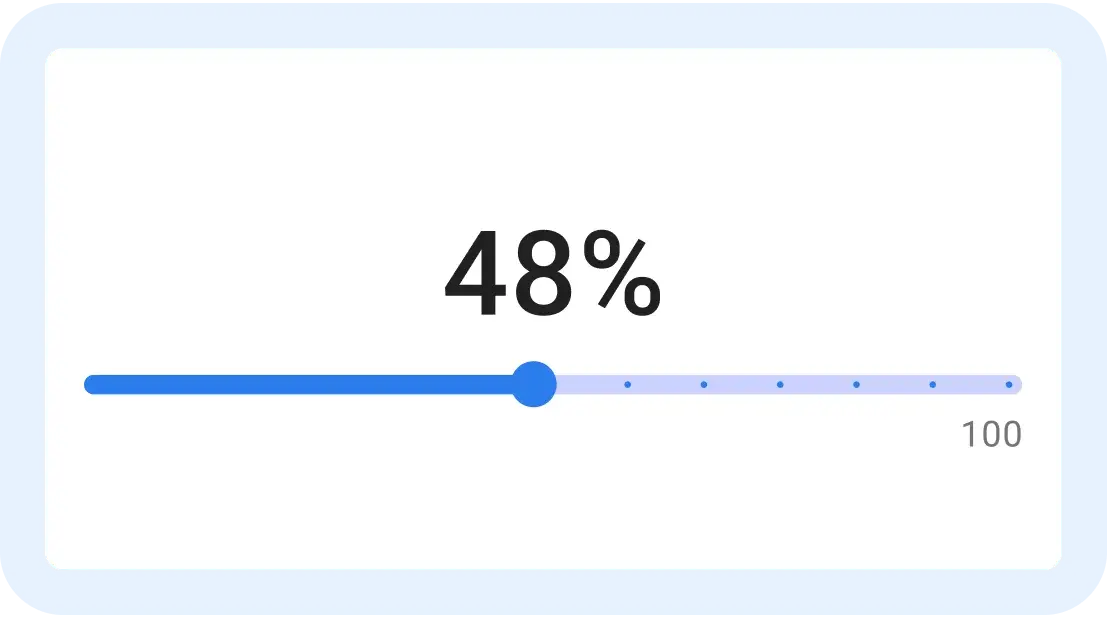
The Control & Status widgets bundle is useful for visualization of the current state and sending RPC commands to target devices, battery level, signal strength, and progress bar.

The Gauges bundles are useful for visualization of temperature, humidity, speed and other integer or float values.
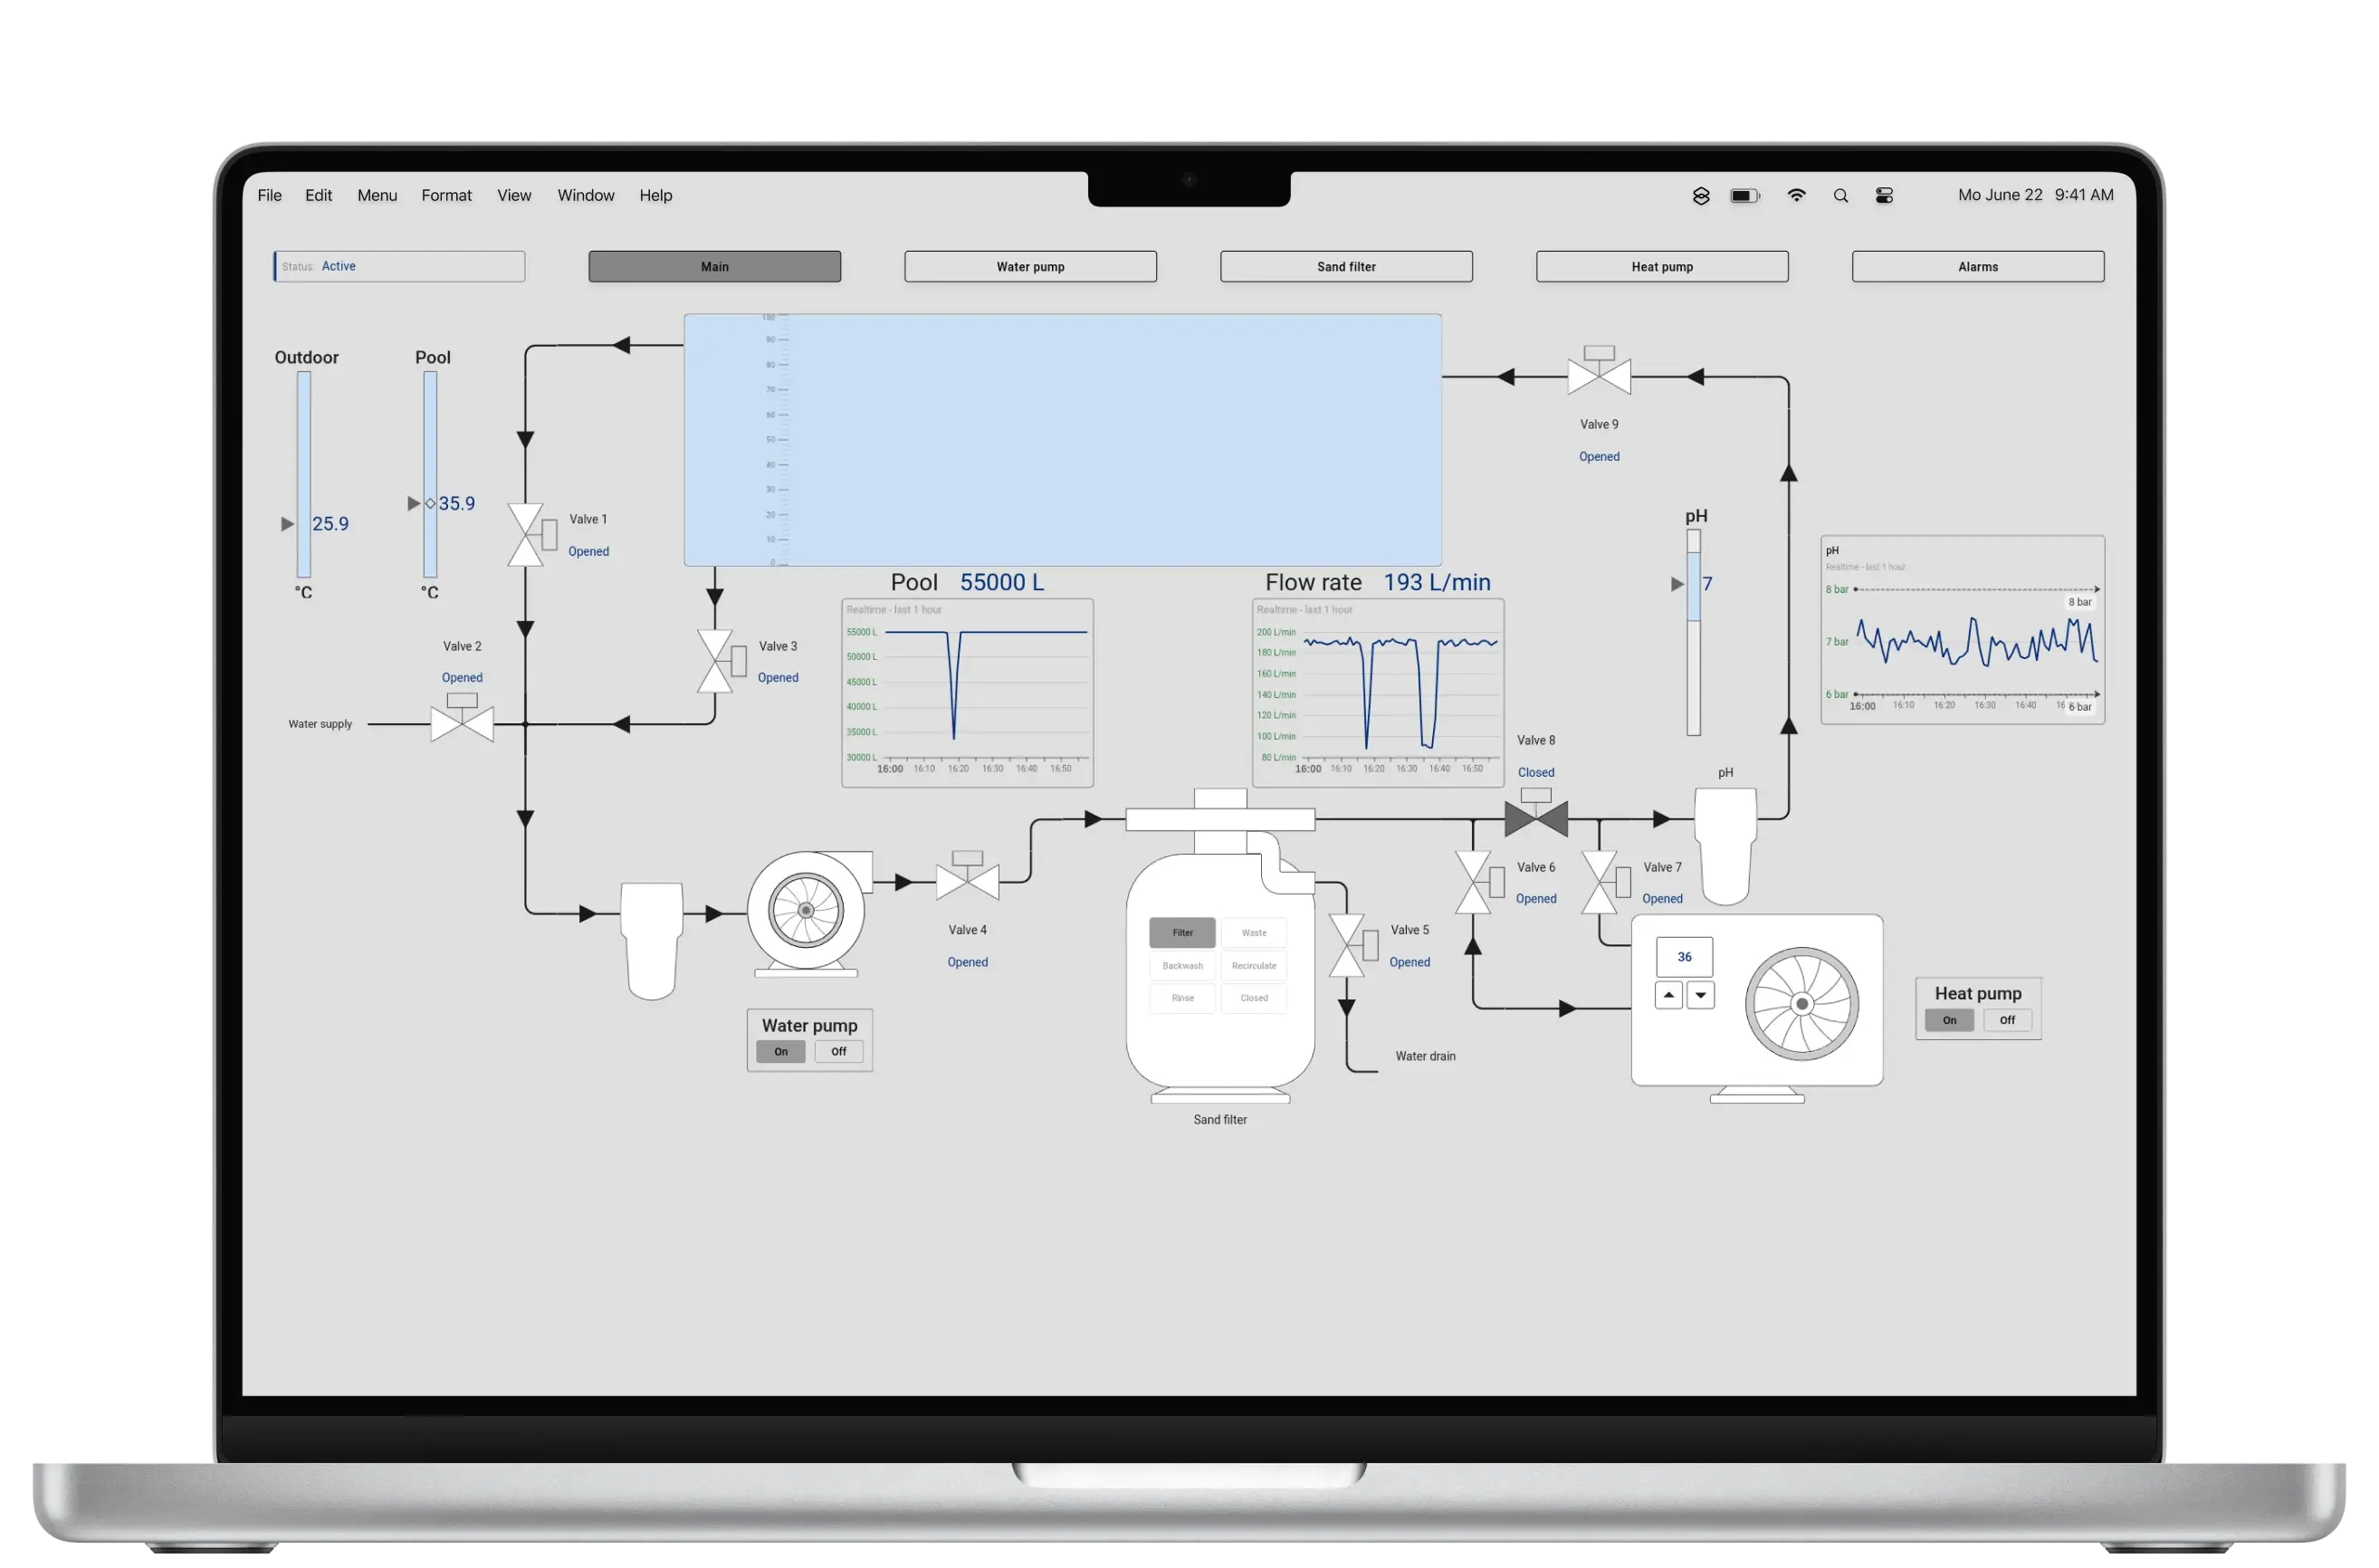
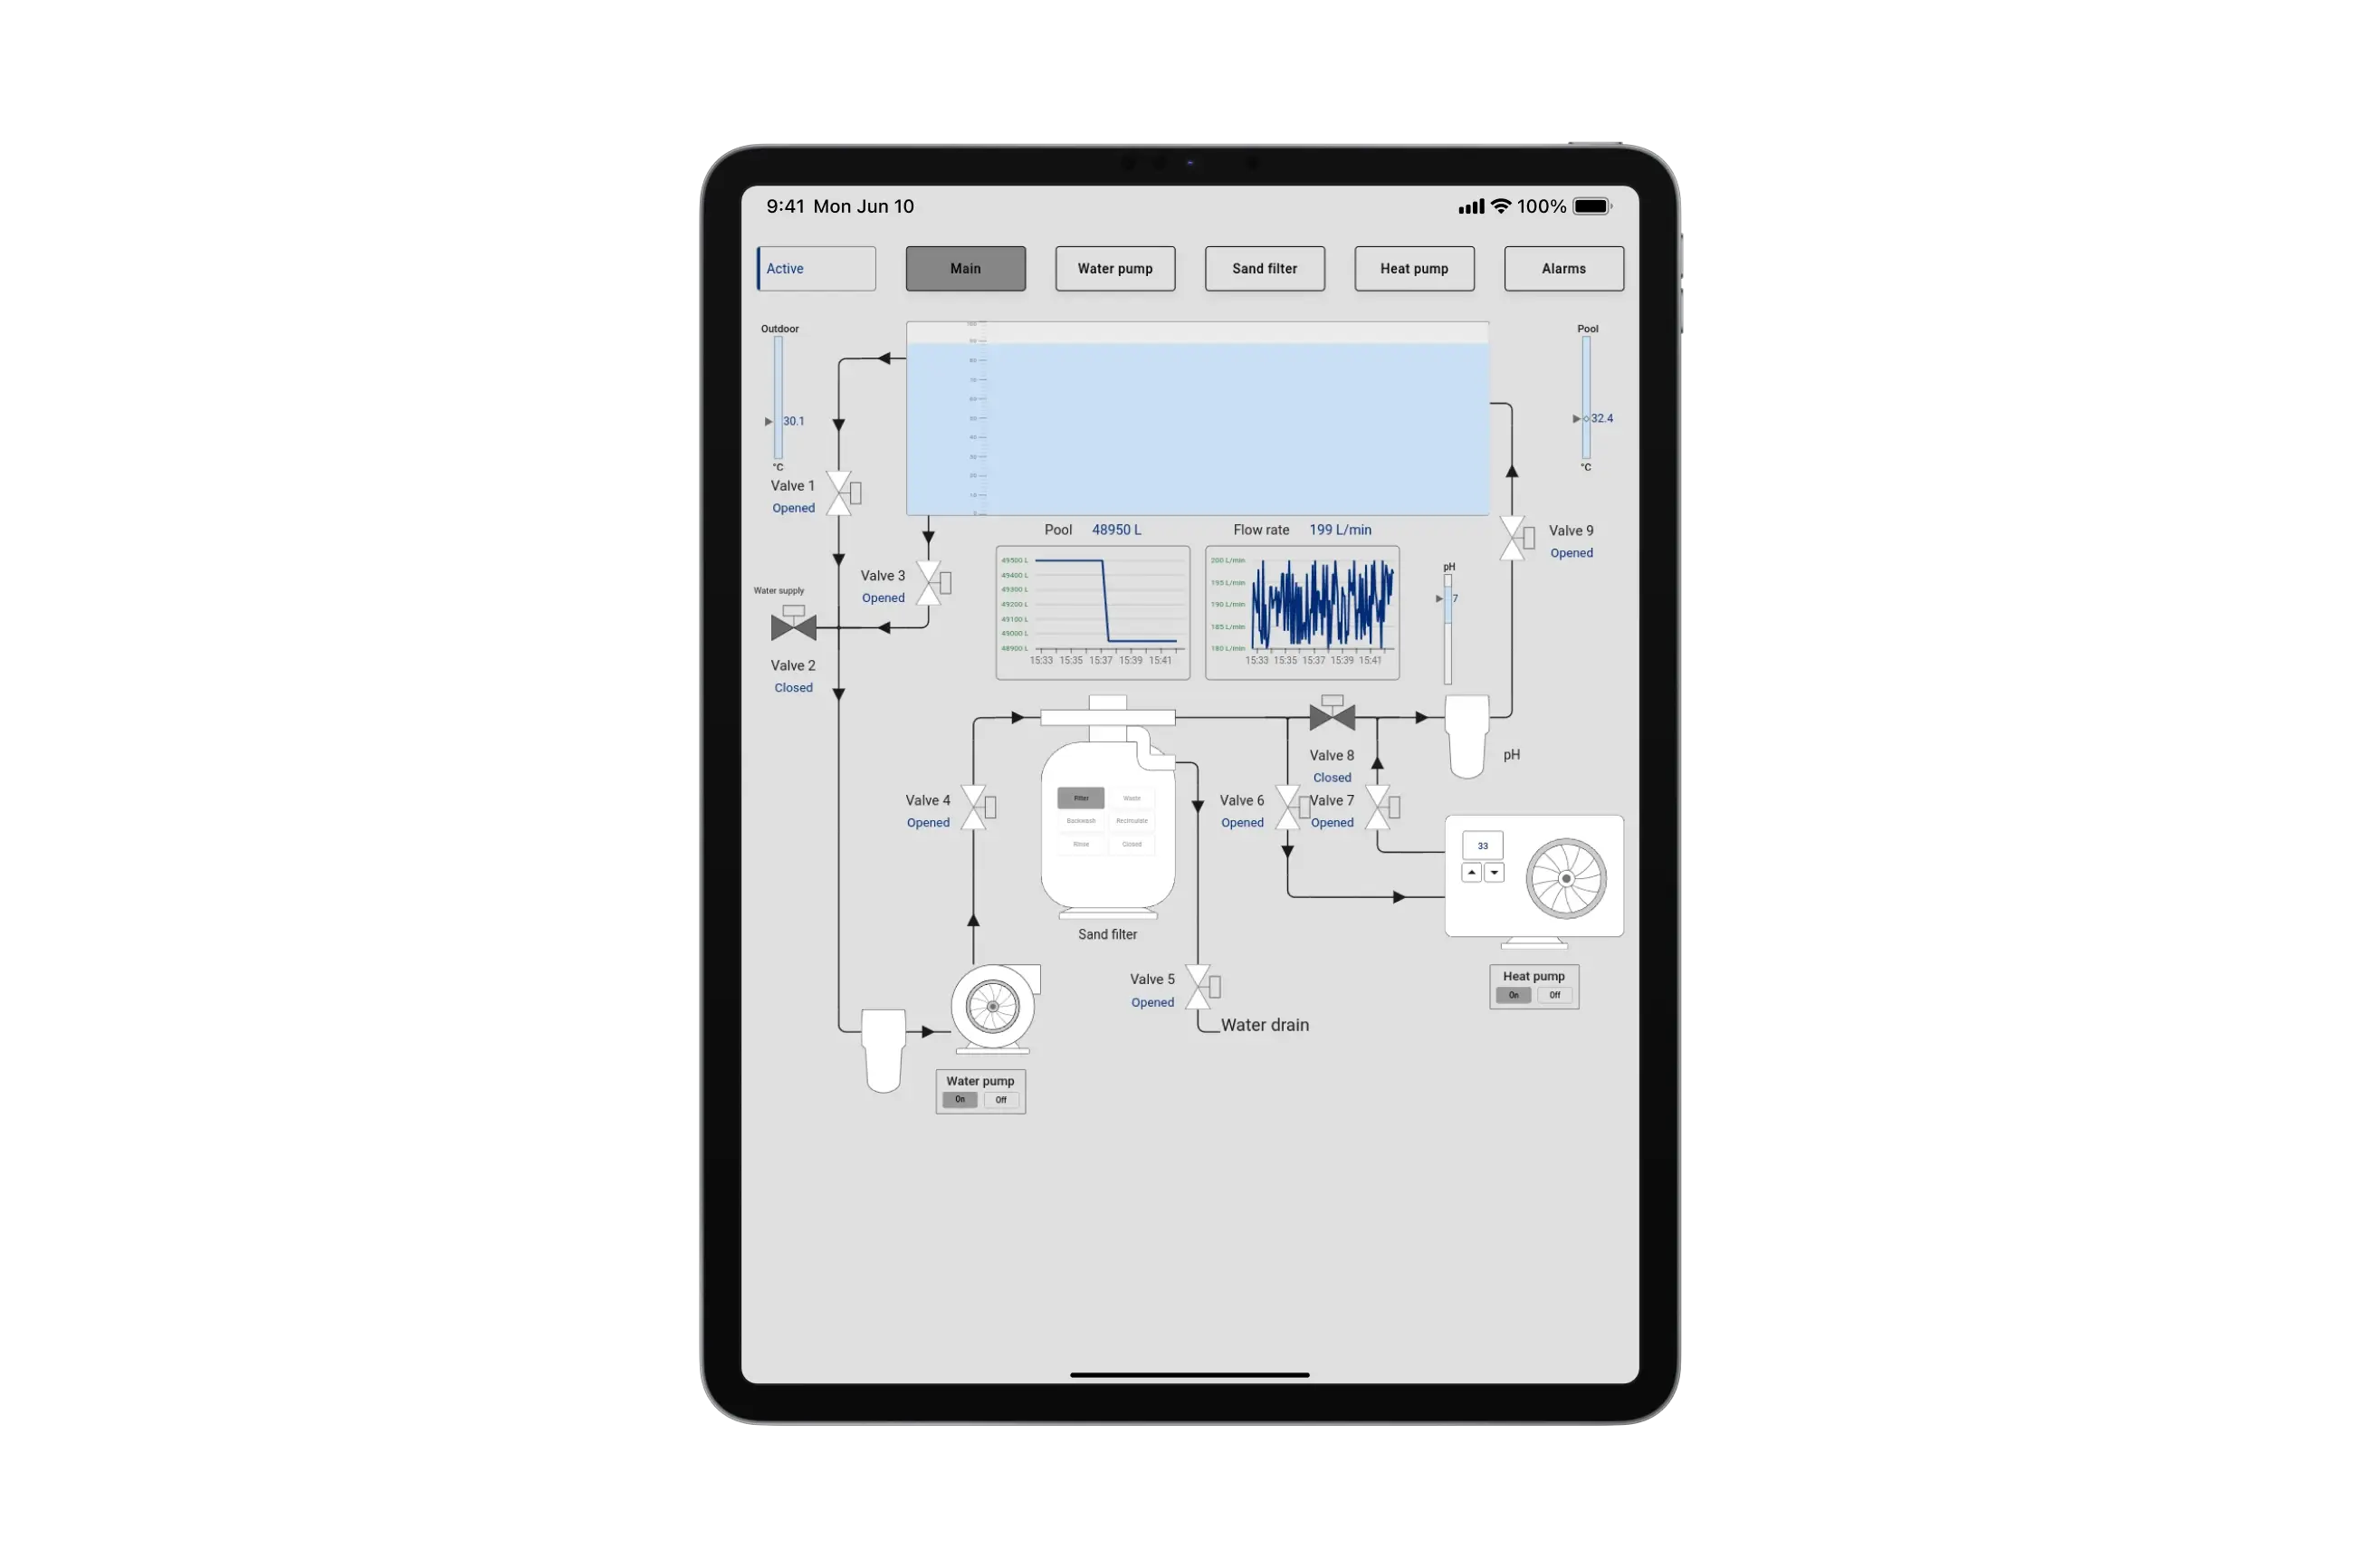
SCADA refers to an architecture used to monitor and control various machines and manufacturing processes. ThingsBoard provides comprehensive tools to collect, process, and visualize data from SCADA components, such as PLCs (Programmable Logic Controllers) and RCUs (Remote Control Units), enabling seamless integration with various industrial processes.

High-performance SCADA symbols simplified, minimalist approach, which focuses on basic monitoring and control.

Traditional SCADA symbols has dynamic, visually engaging and interactive design for emphasizing streamlined interfaces, faster decision-making, and enhanced operational efficiency.
ThingsBoard provides convenient IoT solution templates to reduce time-to-market for your IoT products. The template includes interactive dashboards, processing logic, sample devices, users and all other required entities. You can treat template as a complete PoC/MVP.

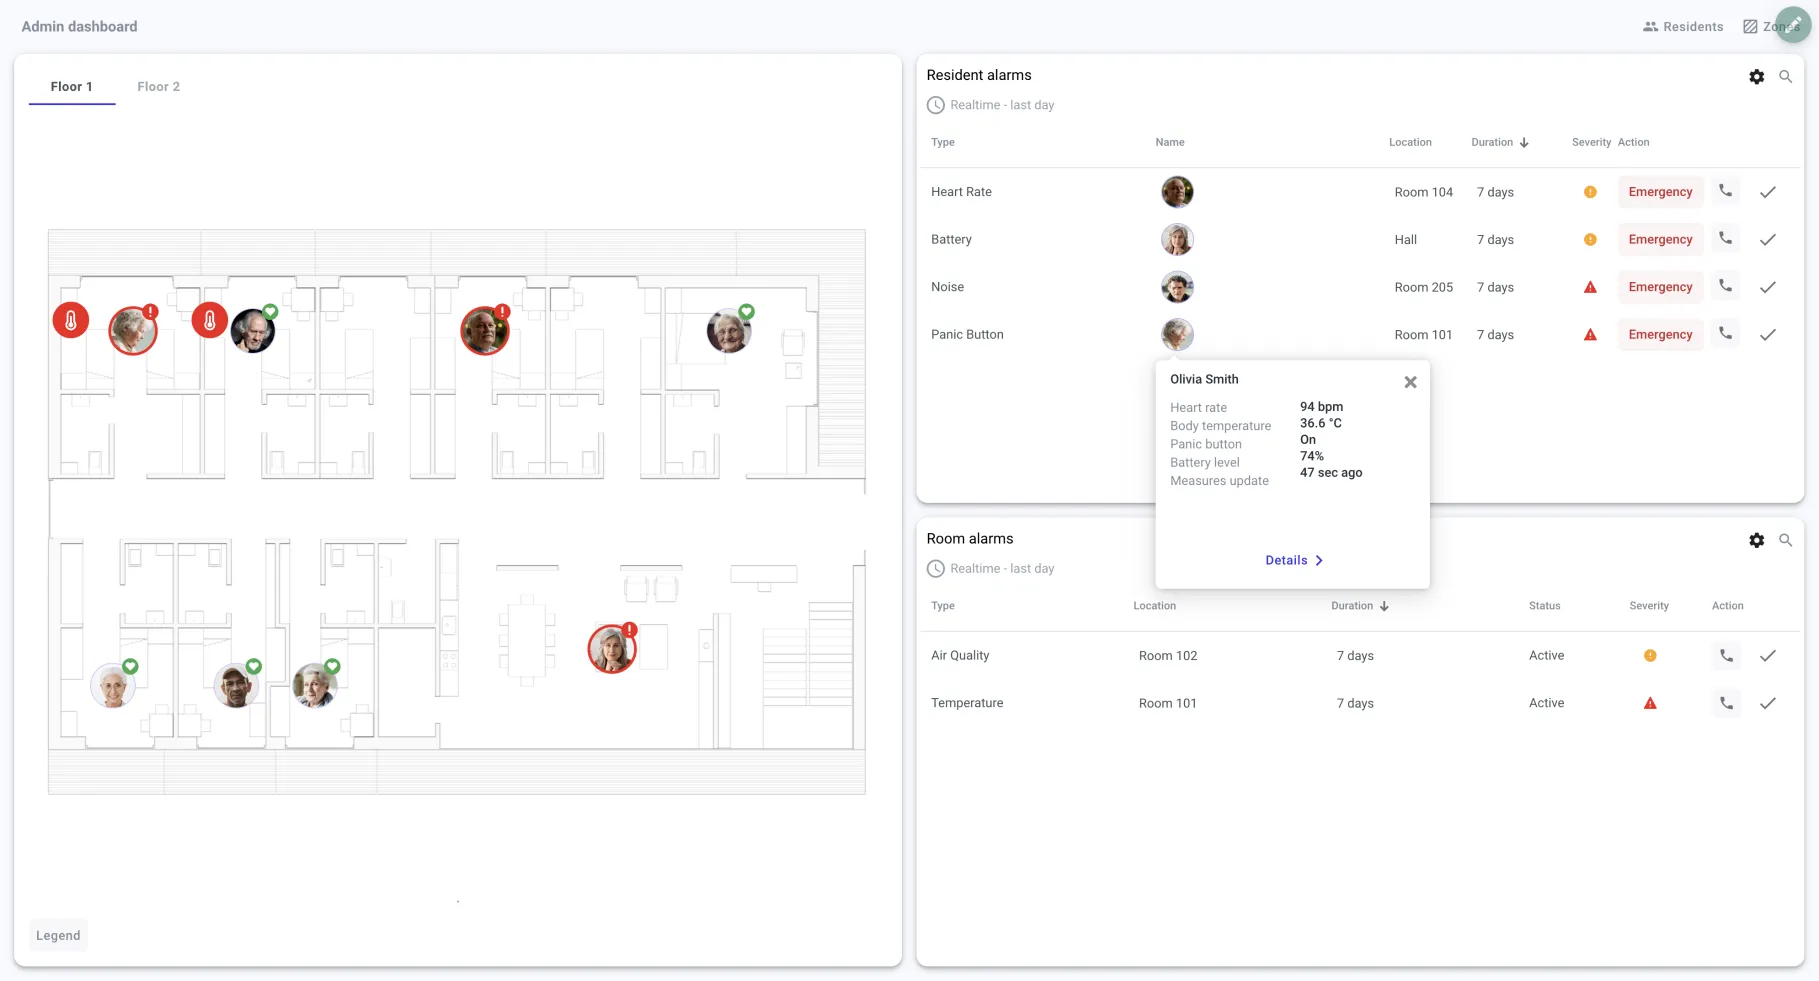
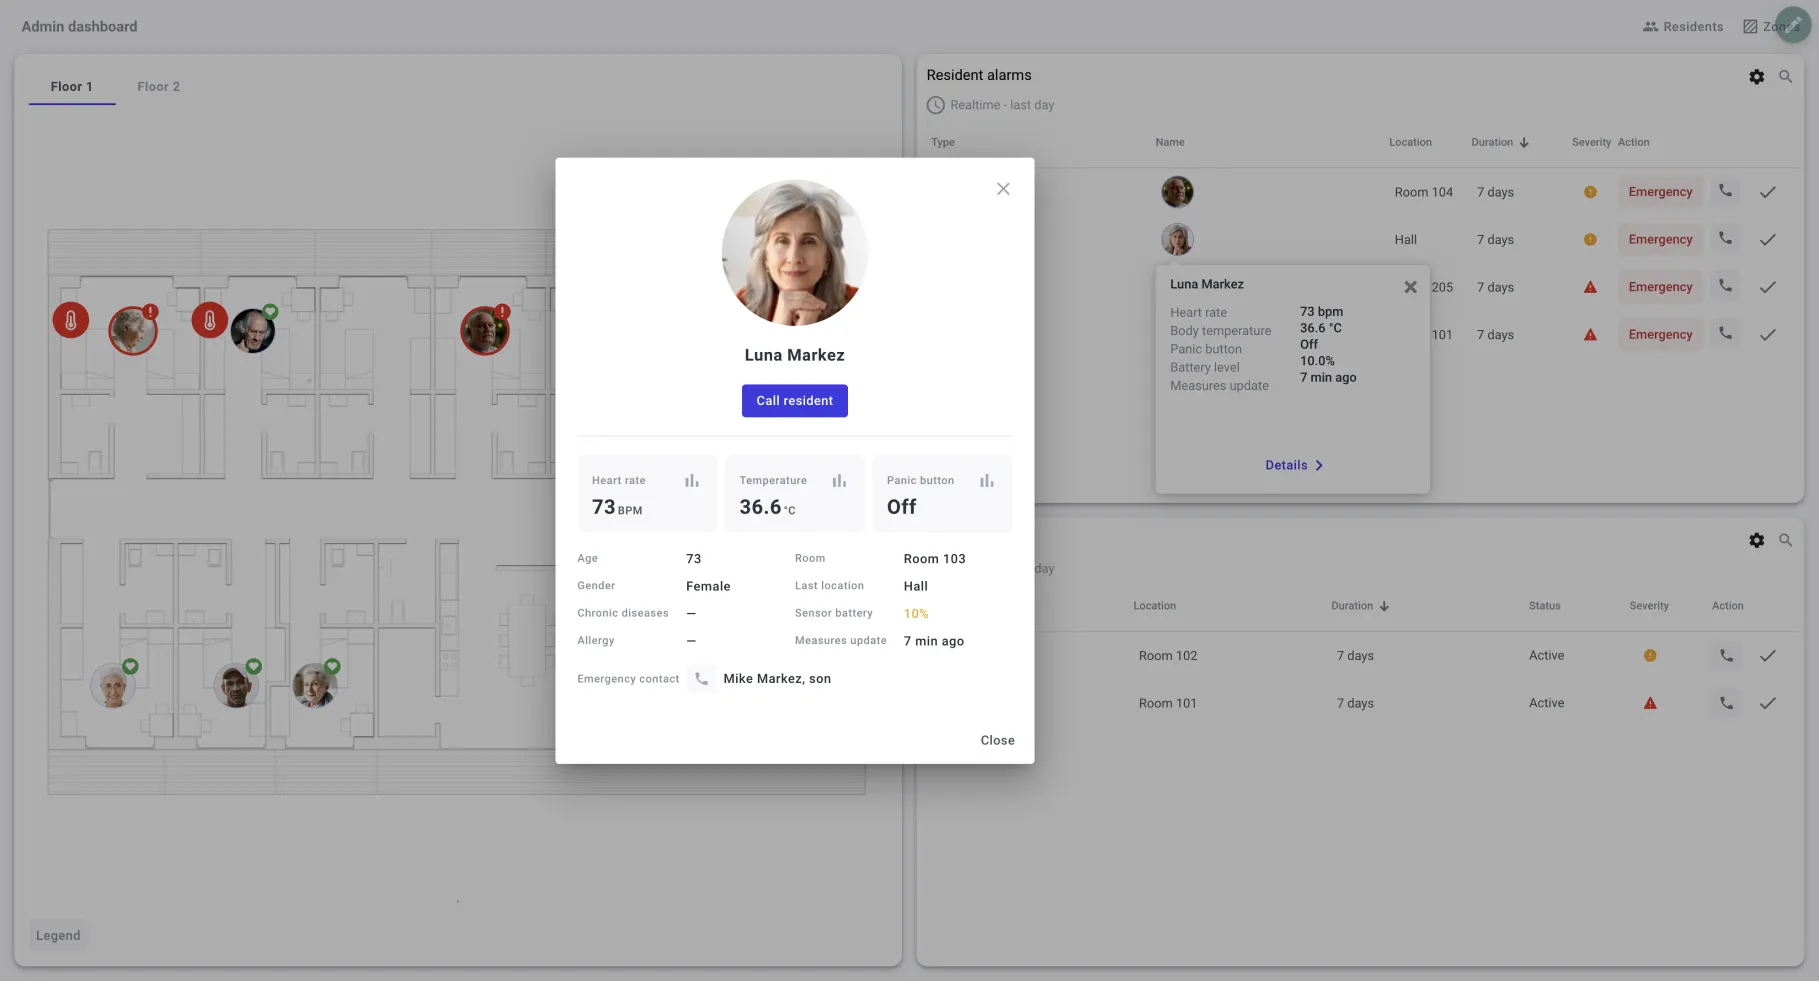
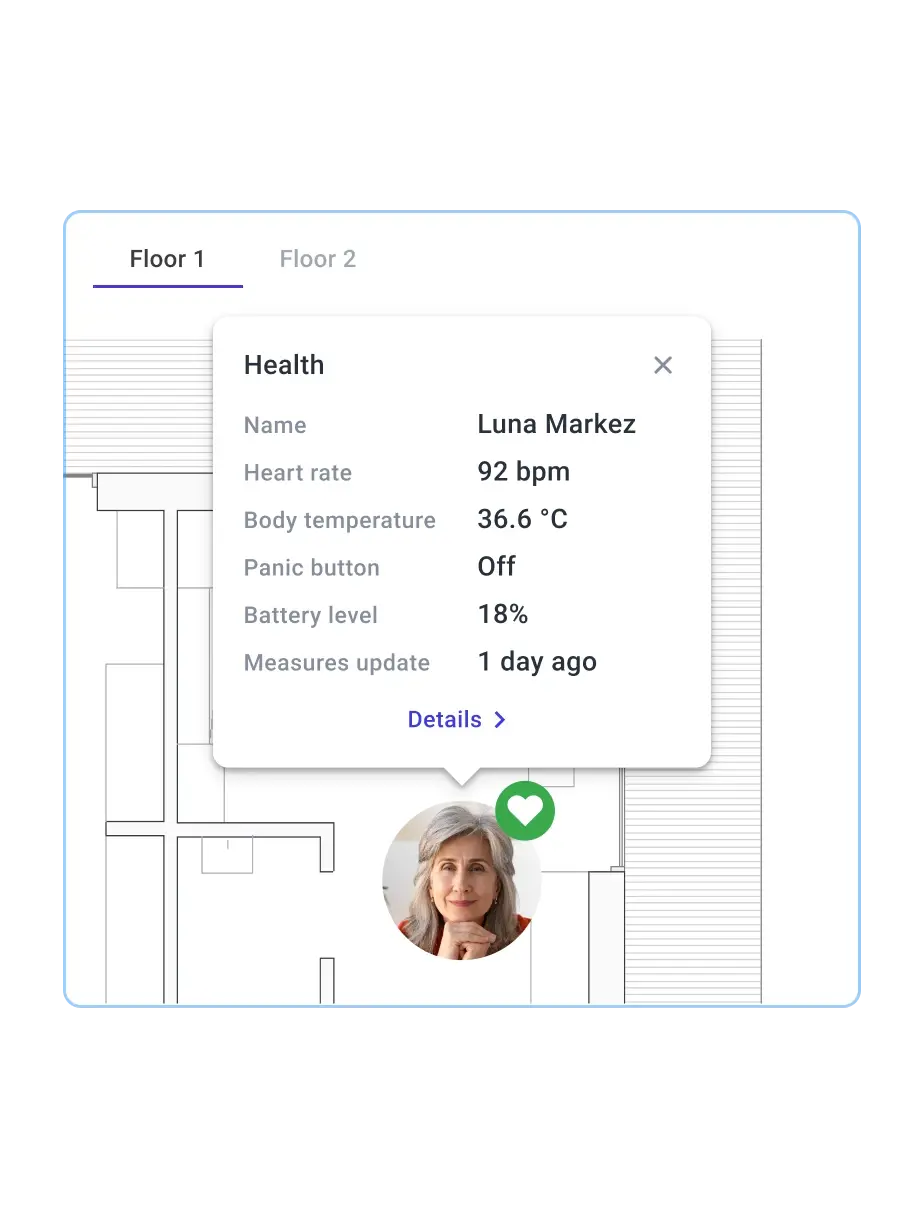
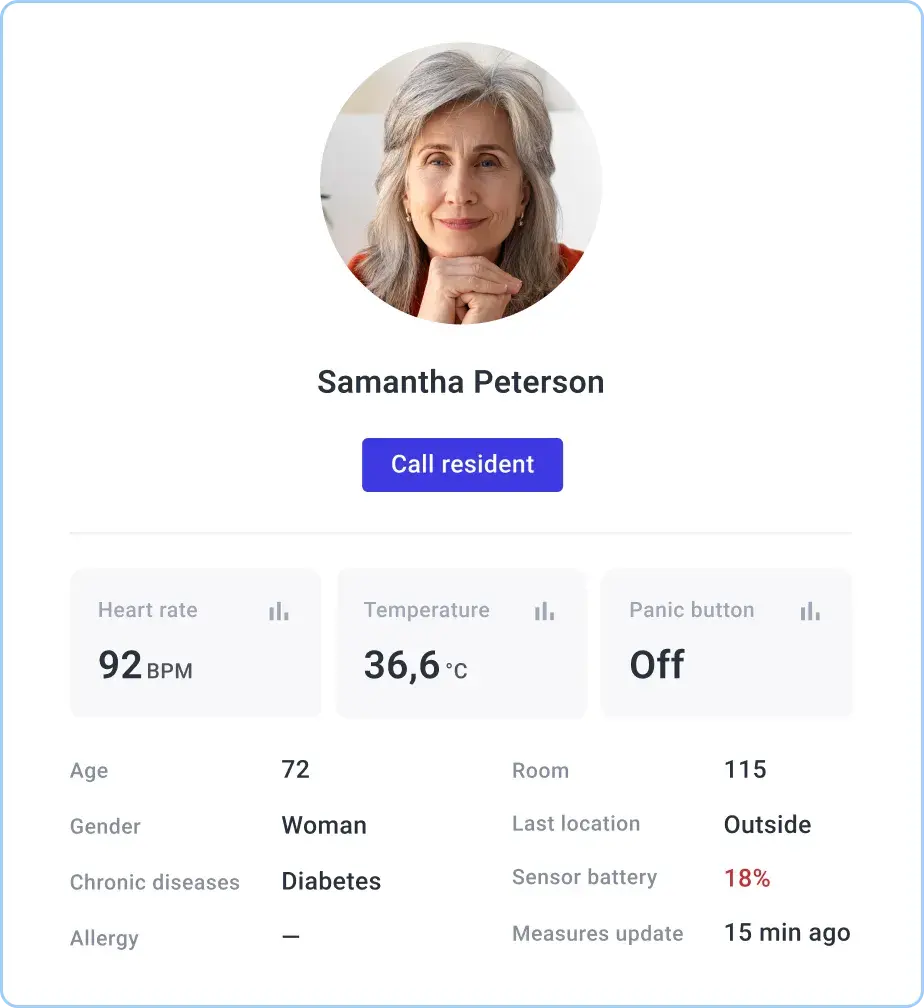
ThingsBoard is an IoT platform with all the tools needed to build a comprehensive healthcare monitoring and management solution with ease. ThingsBoard provides an extensive range of built-in features as well as flexible customization options.
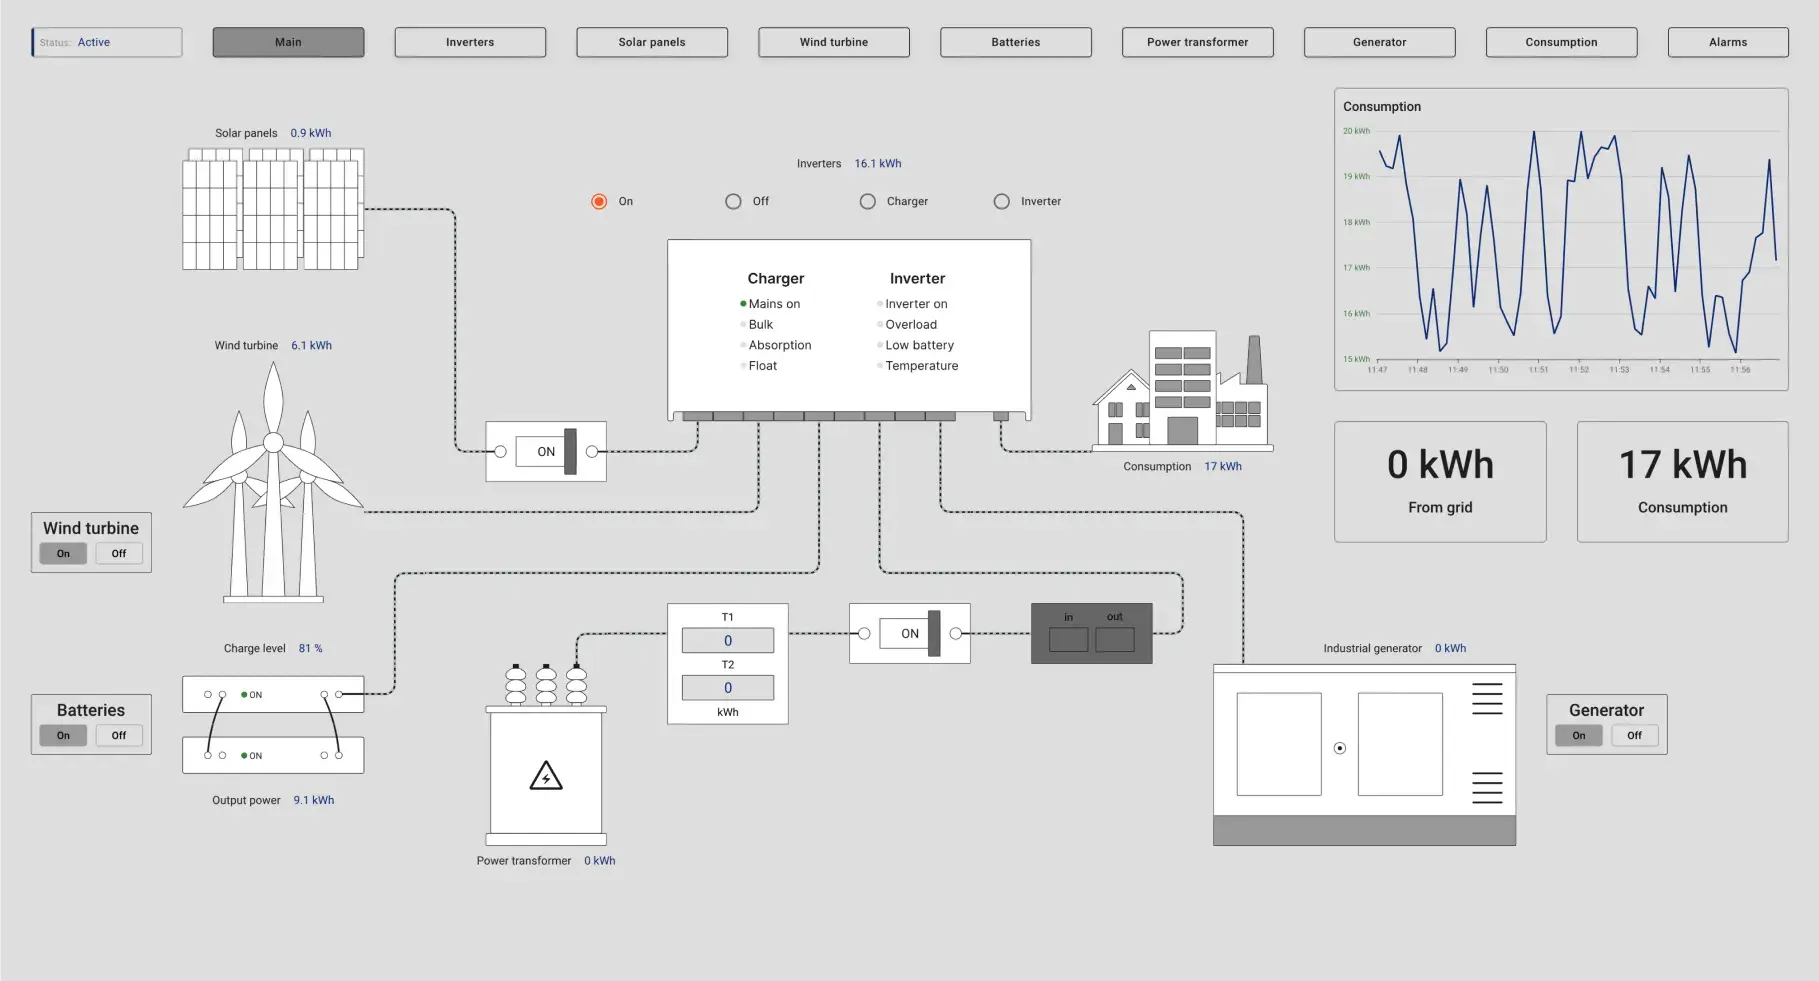
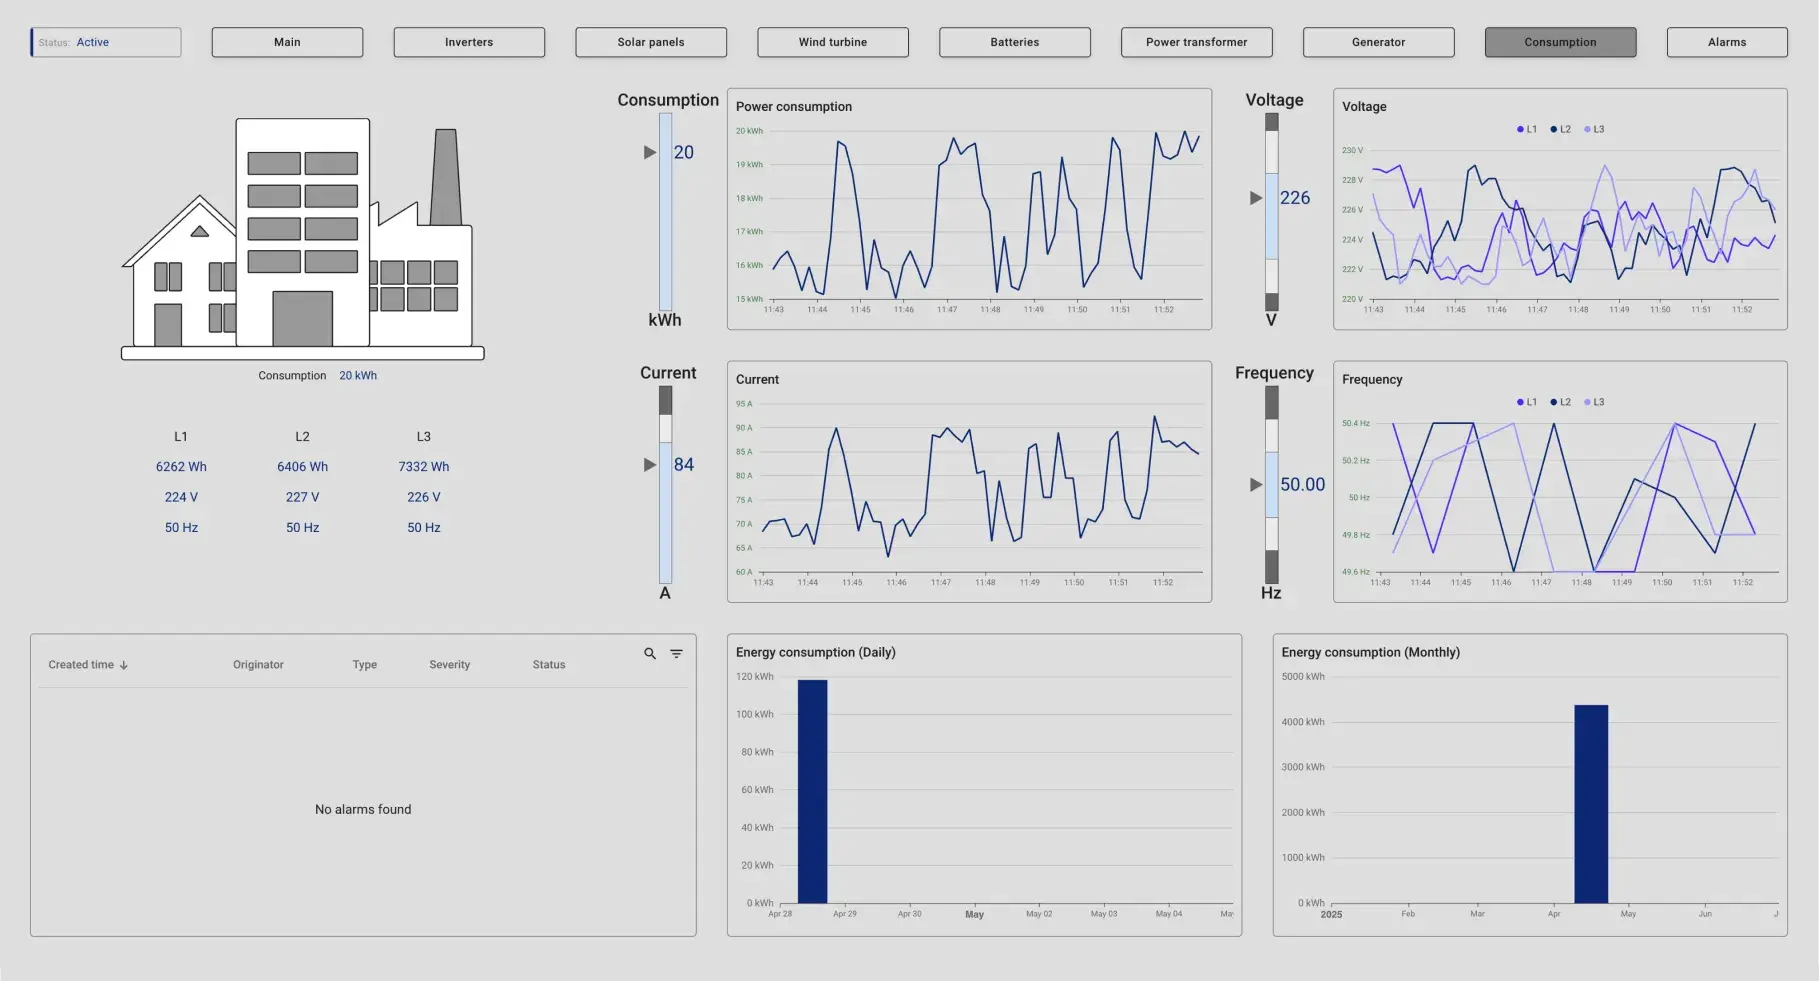
The use of SCADA systems enables businesses to monitor energy generation, distribution, and consumption in real time, optimize energy efficiency, reduce costs, and enhance system reliability with ThingsBoard IoT platform.
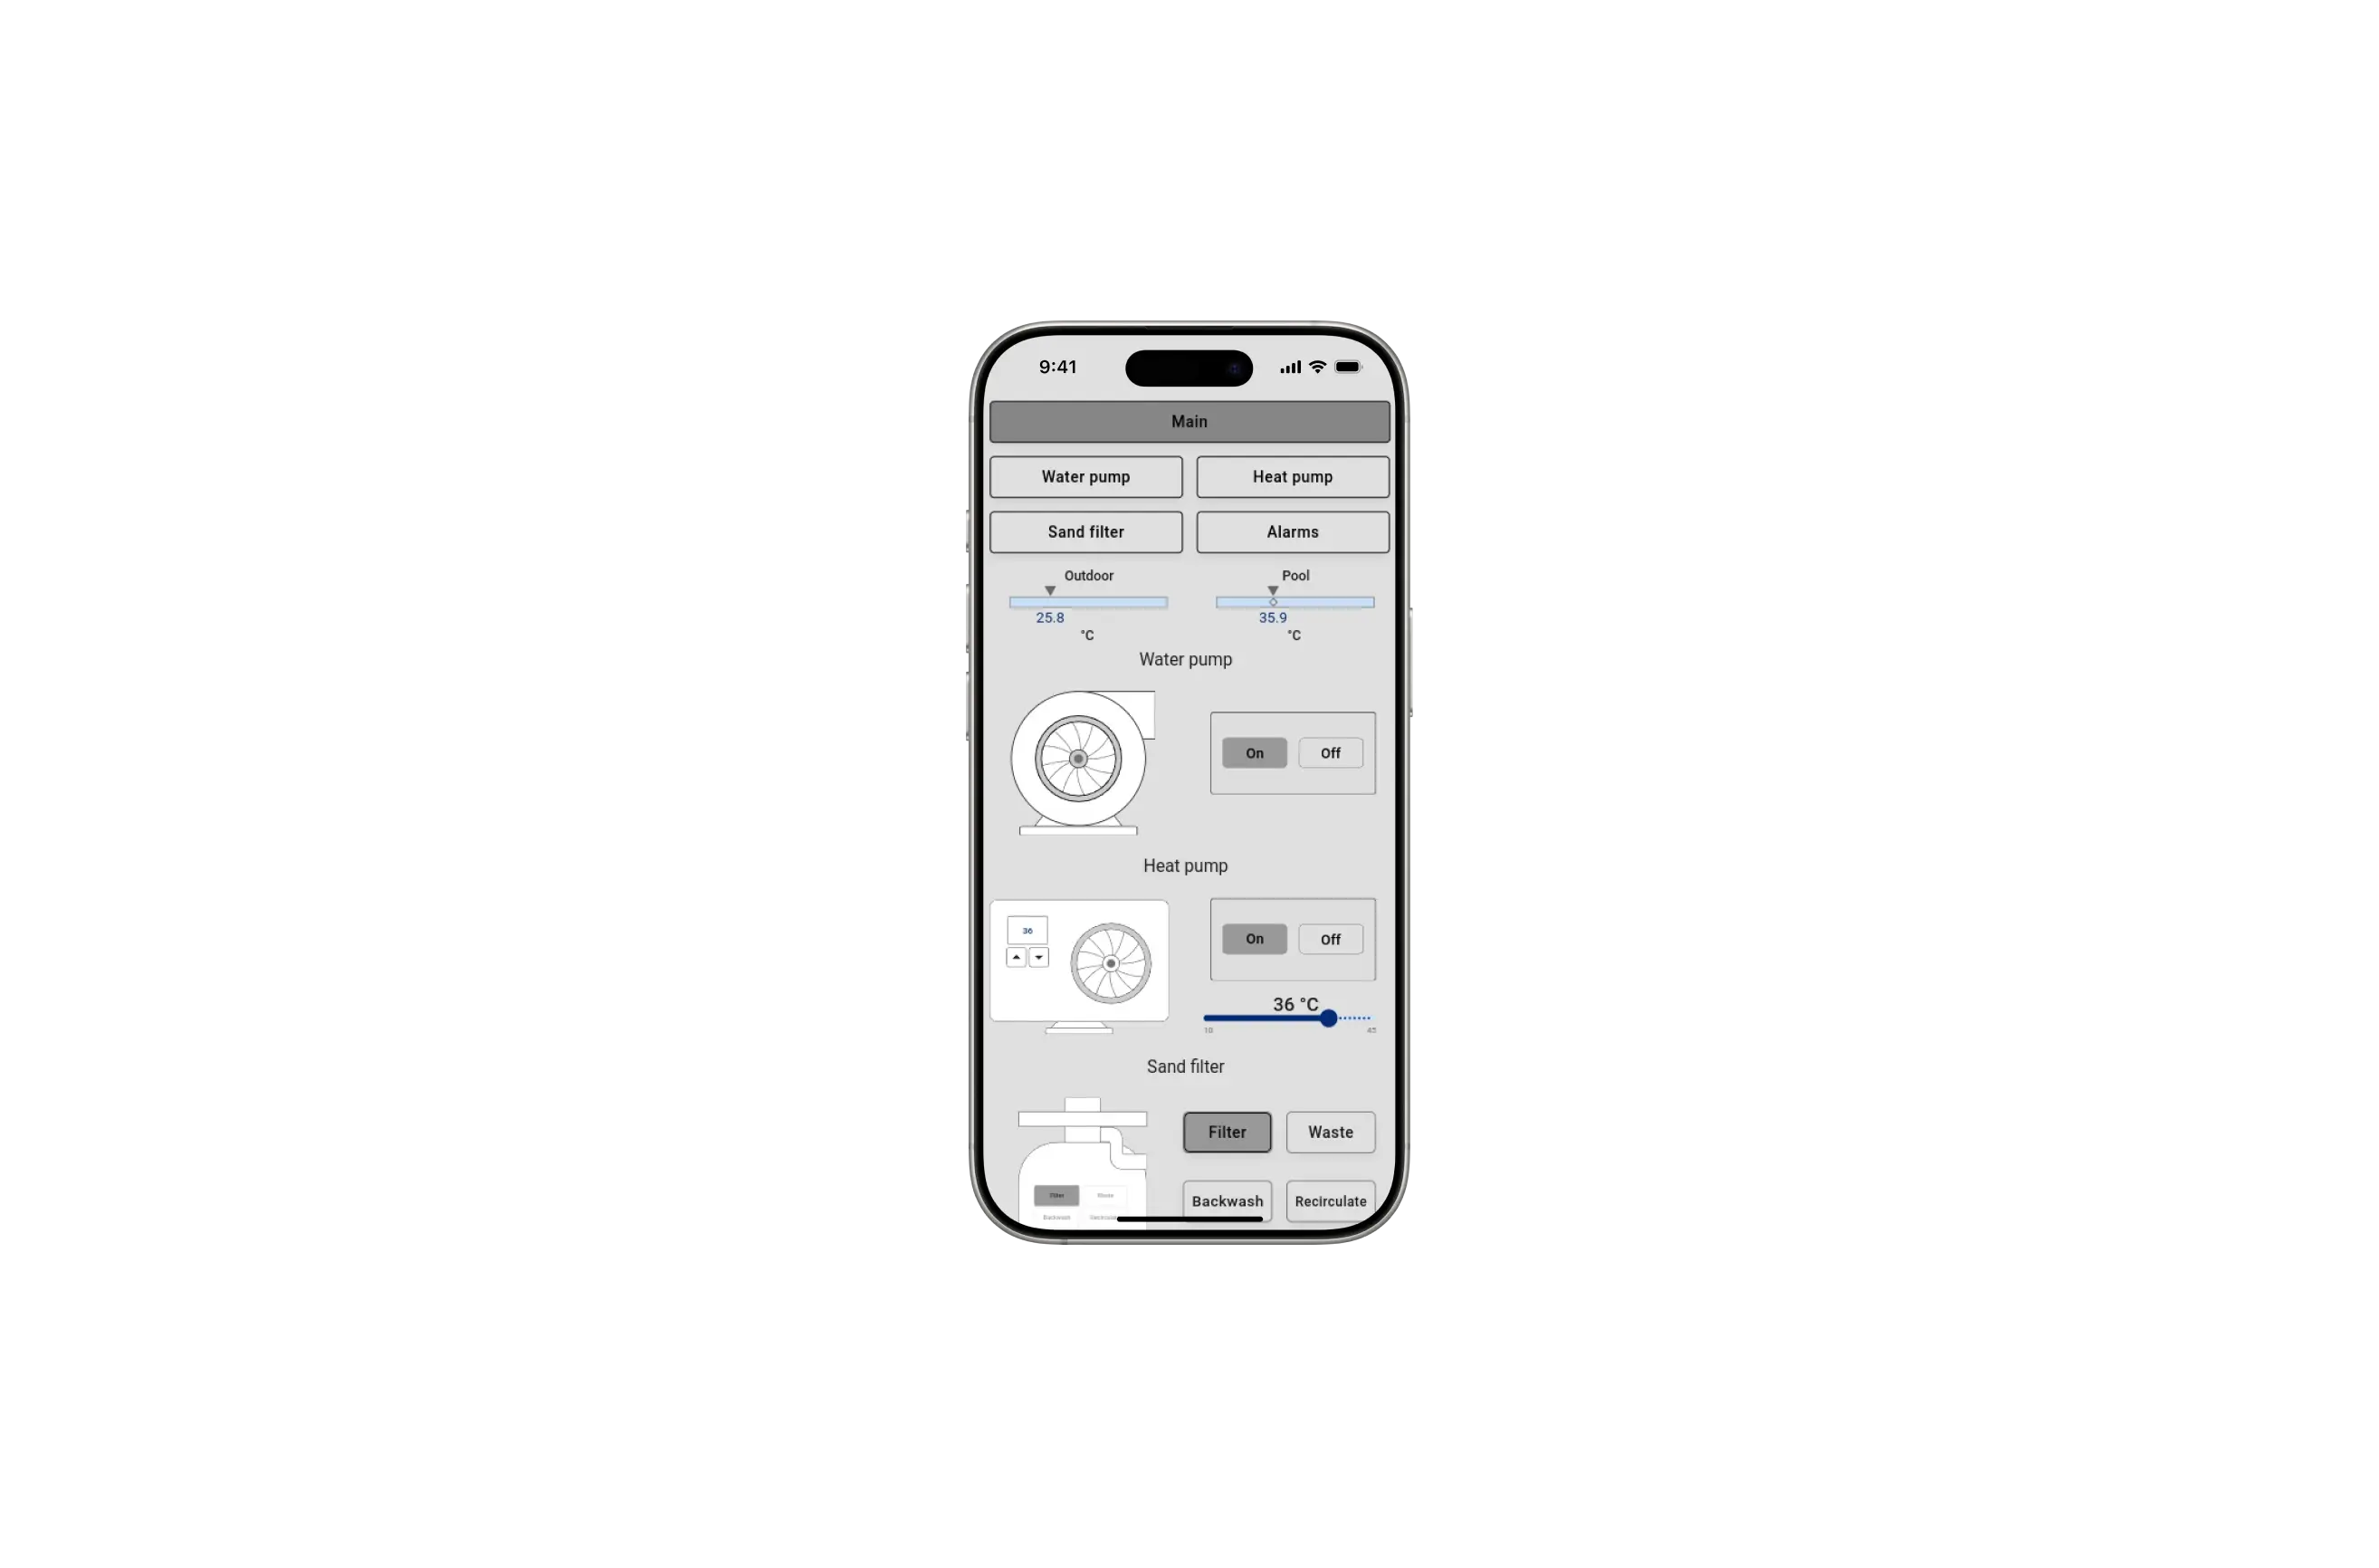
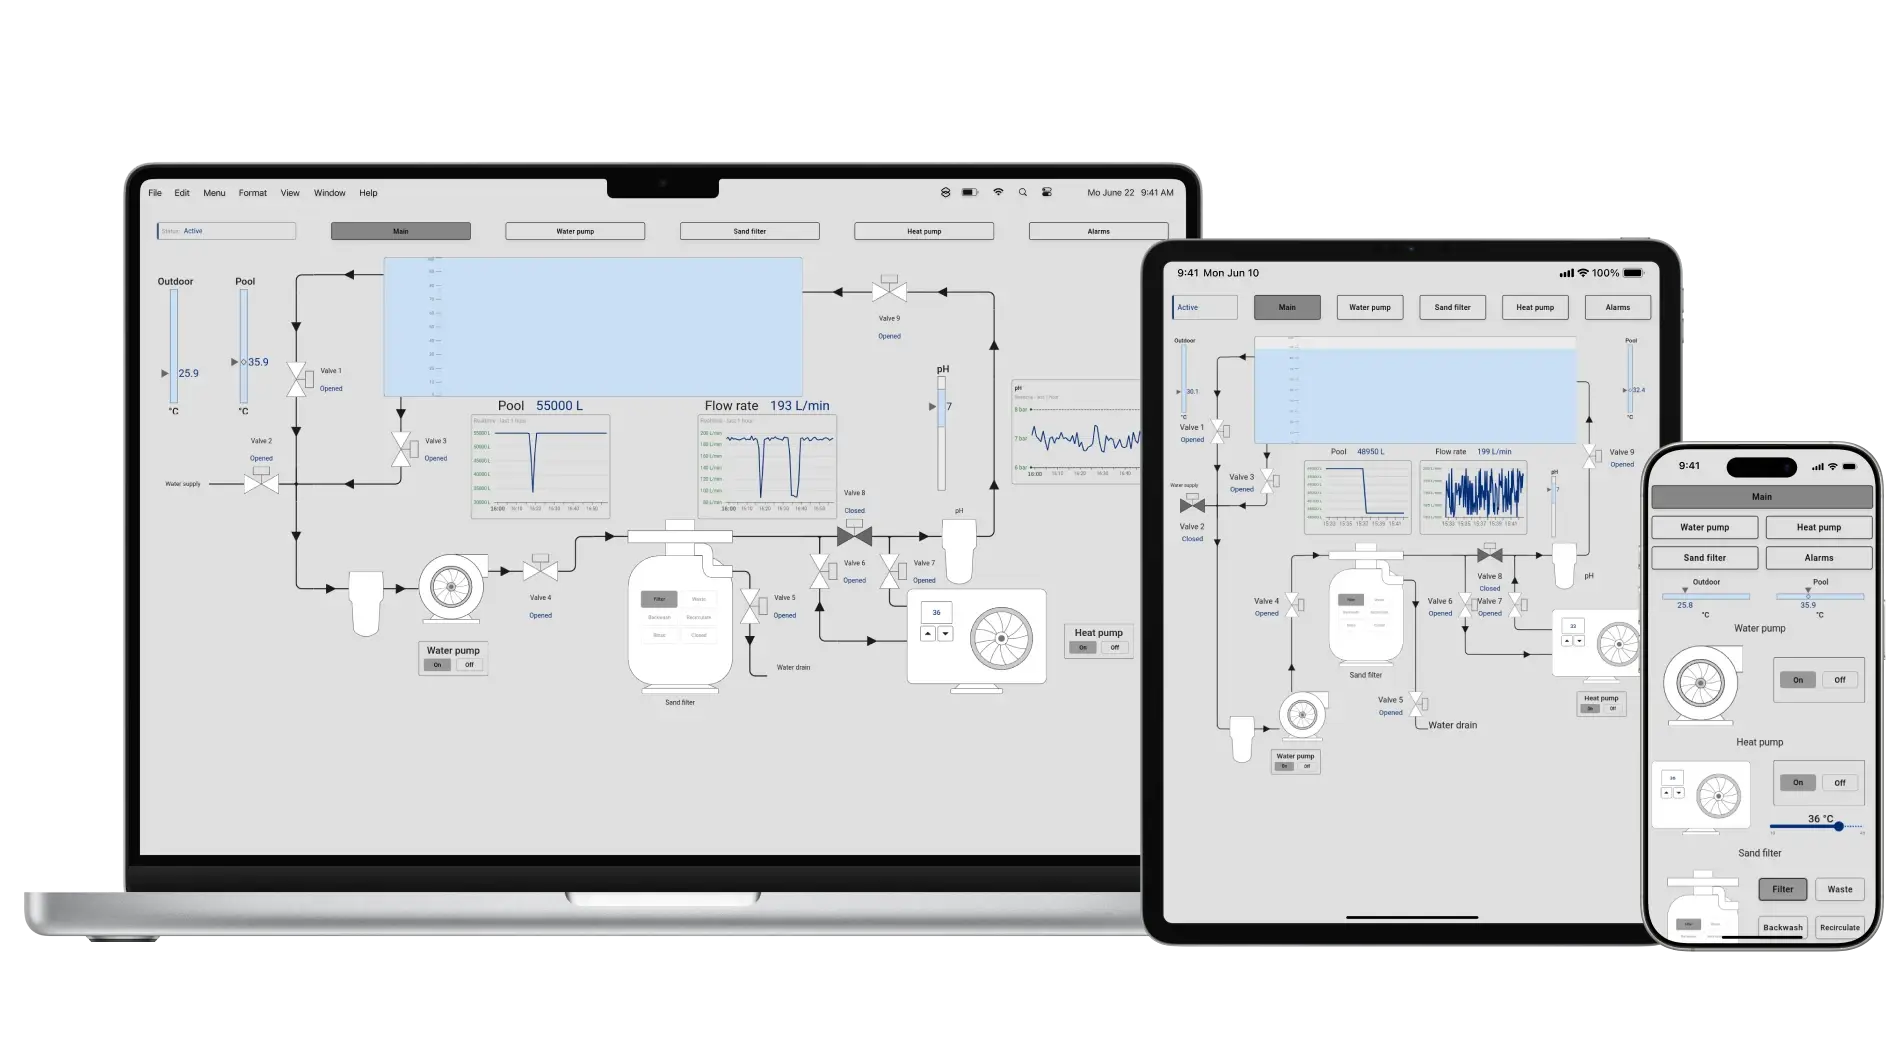
Allow you to organize dashboards into multiple views and arrange widgets efficiently for better user experience. States enable navigation between different dashboard screens, while layouts define responsive positioning and sizing of widgets across devices. Together, they help build structured, user-friendly, and adaptive interfaces.
States in ThingsBoard dashboards allow you to create multi-view dashboards where each state represents a separate screen or context, such as a detailed device view or a summary panel. You can define navigation rules and pass parameters between states to build dynamic, context-aware user flows.
Layouts define how widgets are arranged and displayed within each dashboard state, supporting responsive design for different screen sizes. ThingsBoard supports grid and fixed layouts, allowing you to control widget size, position, and behavior for desktop, tablet, and mobile views.
Dashboards in ThingsBoard are flexible visualization tools that allow users to monitor, control, and interact with IoT data in real time. They support assigning dashboards to specific customers or sharing them directly with individual users, enabling secure, role-based access and collaboration across different stakeholders. With dynamic data sources, SCADA-like controls, custom widgets, and responsive layouts, dashboards offer a customizable interface for building industrial-grade monitoring and control systems.
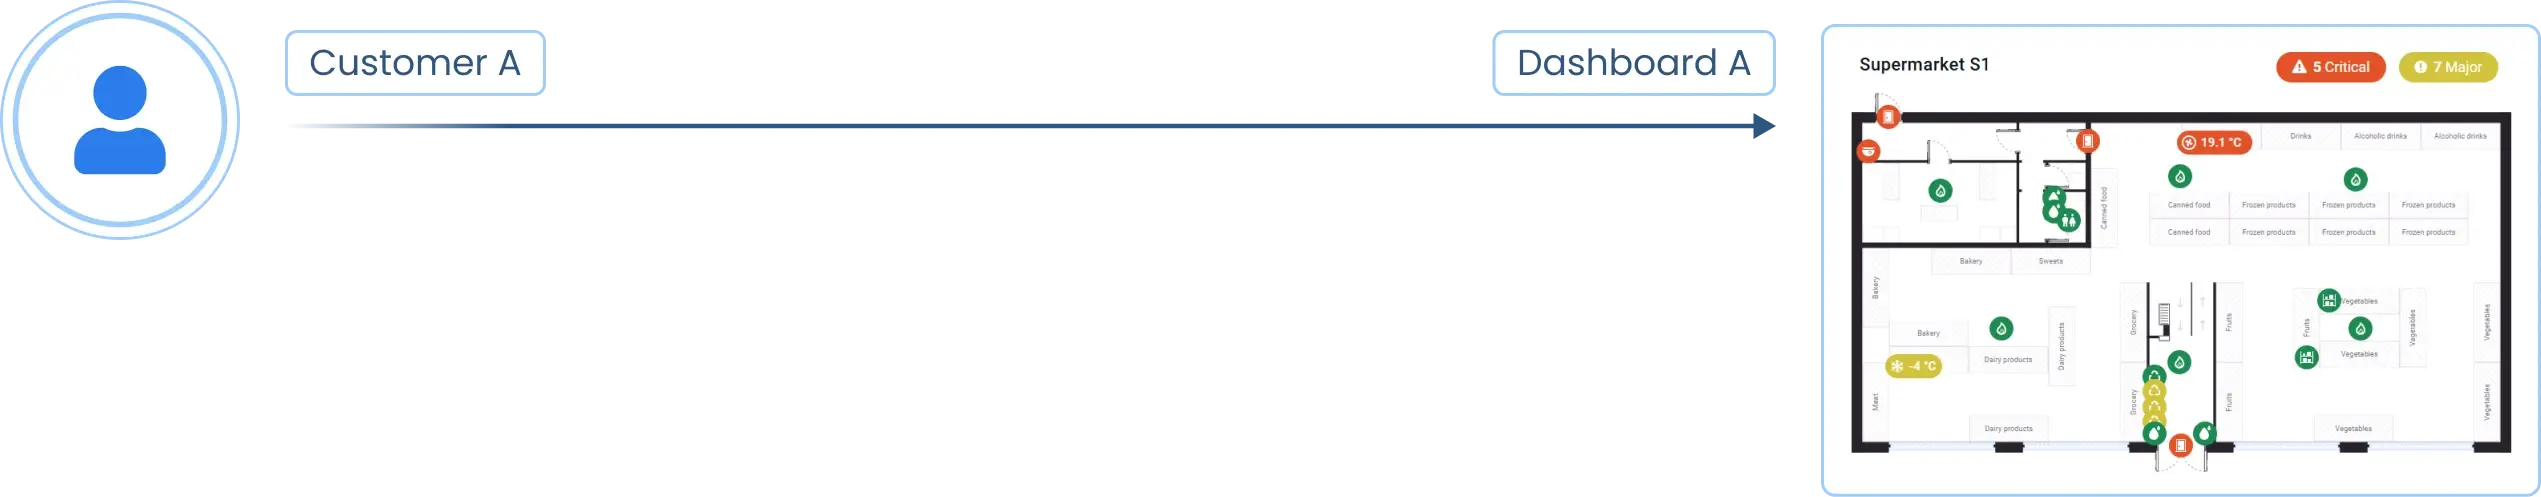
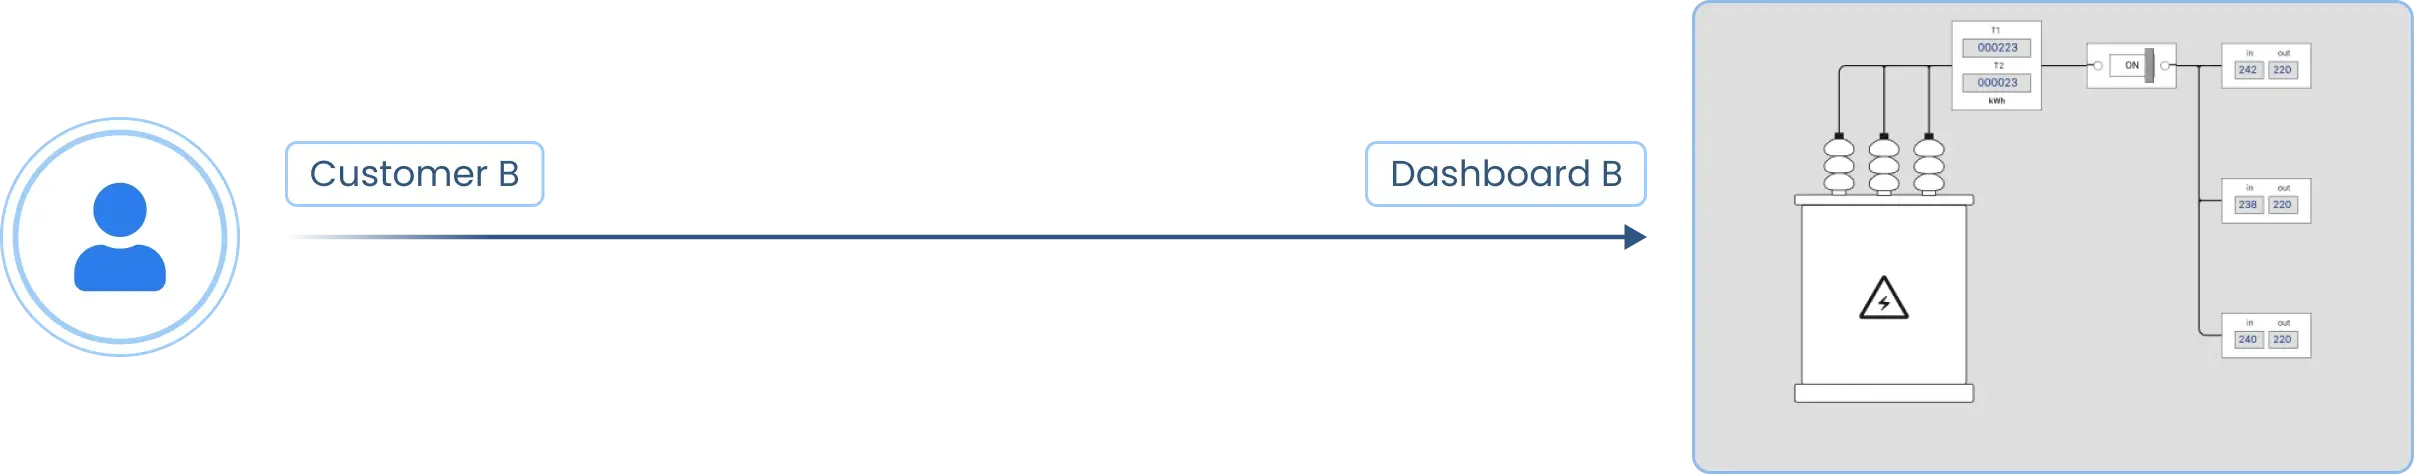
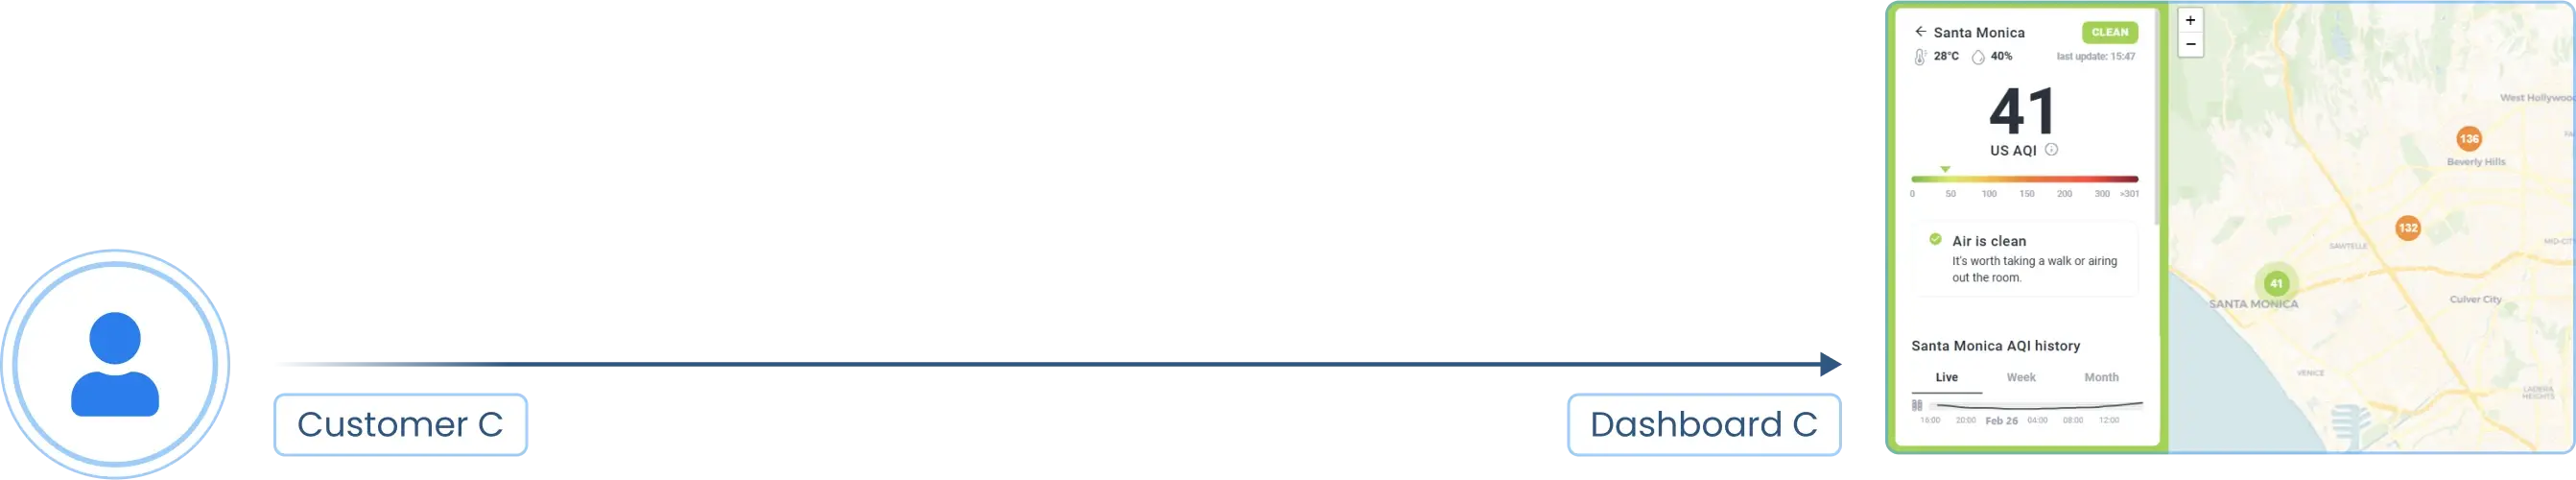
You assign dashboards to a customer, granting their users read-only access to the data that belongs to their devices and assets.
You can fully control access to dashboards with advanced RBAC and white labeling—enabling flexible, secure, and branded data visualization for your customers.
Custom widgets & actions enable you to extend visualization capabilities by creating your own widgets and configuring user actions. You can develop unique UI elements and define behaviors for clicks, hovers, and other events to ensure interactivity and tailor the interface to specific needs.
Custom widget development enables you to build and contribute your own widgets with custom logic, visuals, and configuration options. This gives full control over the look and functionality of dashboard elements.
Widget actions allow you to define interactive behaviors like navigation, RPC calls, and custom scripts triggered by user events. This empowers users to create responsive and dynamic dashboards tailored to real-time needs.