Analyze Building Energy Usage and Carbon Emissions
Energy consumption is one of the largest operating expenses for commercial buildings, yet most facilities lack accurate, real-time visibility into where energy is used and what it costs. This guide shows how to build an analytic dashboard that breaks down energy usage by source and by area, enables year-over-year comparisons, and tracks carbon emissions — all with interactive filtering.
Task definition: Create an analytic dashboard to analyze energy consumption sources in a building and identify areas for improvement.
Implementation plan
Section titled “Implementation plan”- Table: energy consumption broken down by source (HVAC, lighting, plug loads, elevators, etc.)
- Table: energy consumption broken down by area (offices, meeting rooms, kitchen, storage, etc.)
- Bar chart: compare energy usage across sources
- Bar chart: compare current and previous year with monthly breakdown
- Card: total CO₂ emissions with comparison to the previous period and a 6-month sparkline
- ThingsBoard dashboard combining all views with building-level filtering
Prerequisites
Section titled “Prerequisites”Energy meters are installed in the building and connected to ThingsBoard via MQTT. Each meter has two attributes:
sourceType— energy consumption source (HVAC, lighting, plug loads, elevators, etc.)area— installation area (office, meeting room, hall, kitchen, etc.)
Meters have relations to a Building asset, and buildings have relations to a Customer. This hierarchy enables aggregation at the device, area, building, or customer level.
Implementation
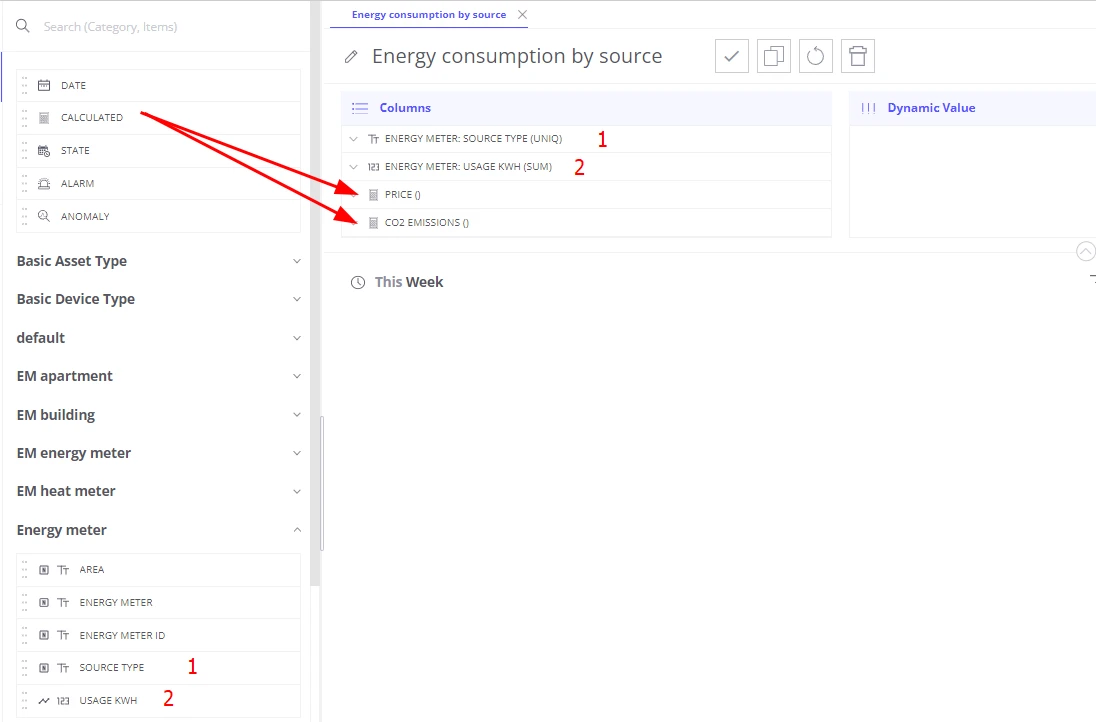
Section titled “Implementation”Step 1: Table — energy consumption by source
Section titled “Step 1: Table — energy consumption by source”-
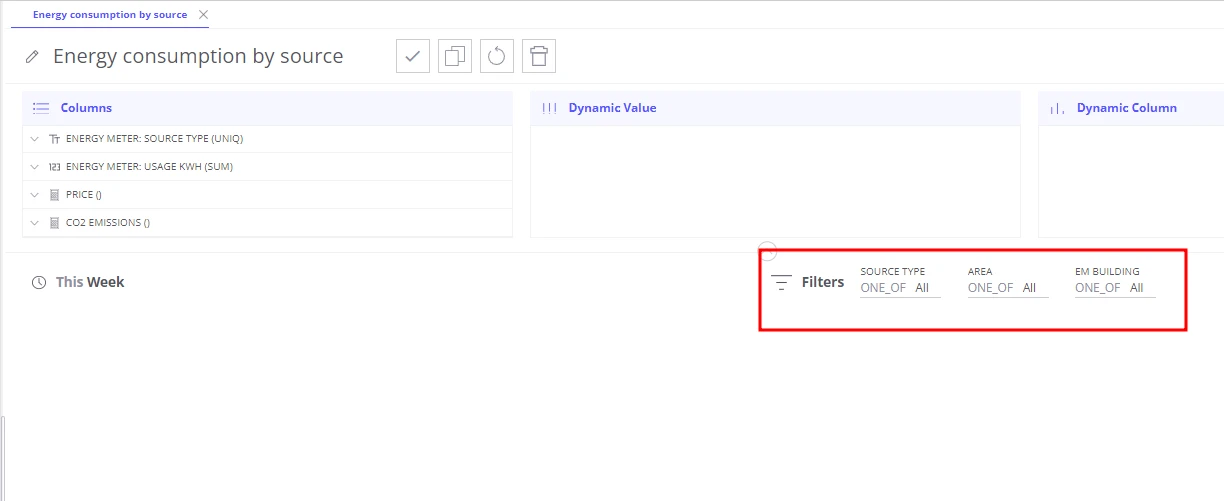
Create a Table view in Trendz.
-
Add
energyMeter.sourceTypeto the Columns section — this splits readings by source type. -
Add
energyMeter.usageKWHto the Columns section with aggregationSUM. -
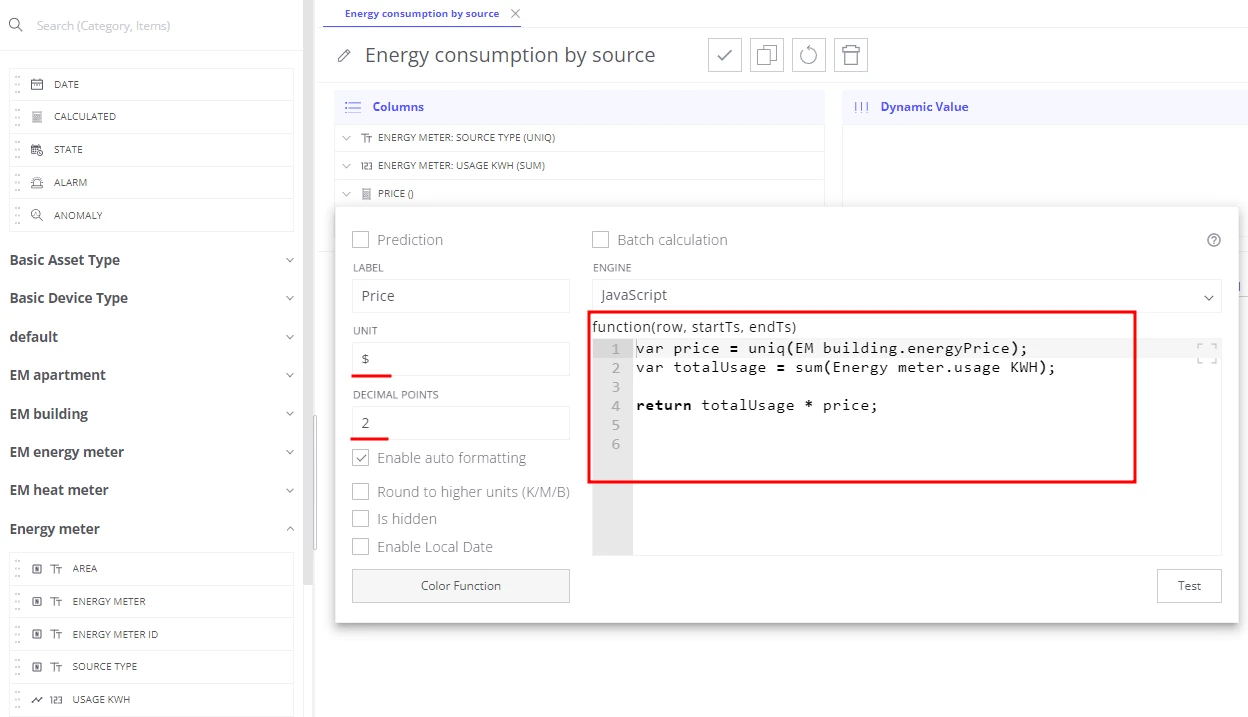
Add a calculated field with label Price, unit
$, decimals2:var price = uniq(building.energyPrice);var totalUsage = sum(energyMeter.usageKWH);return totalUsage * price; -
Add a calculated field with label CO2 emissions, unit
kg CO2e, decimals1:var emissionConversionFactor = 0.21233;var totalUsage = sum(energyMeter.usageKWH);return totalUsage * emissionConversionFactor; -
Add
energyMeter.sourceType,energyMeter.area, andbuildingto the Filters section. -
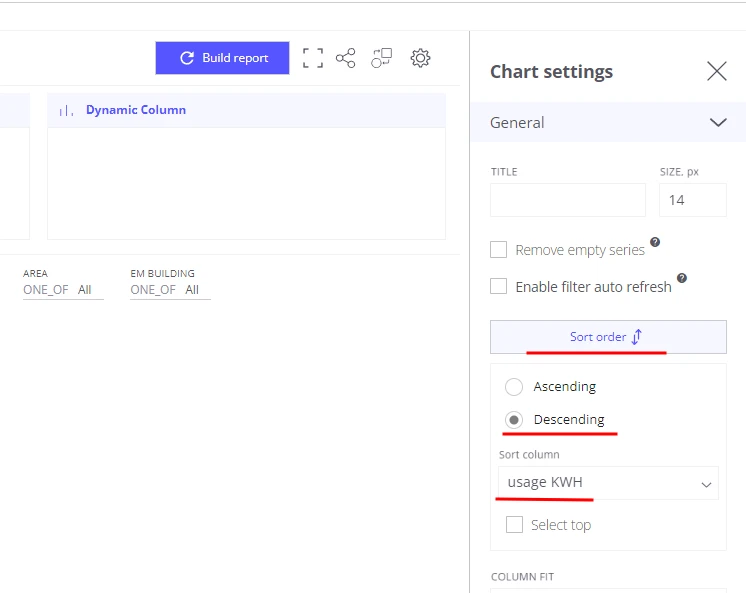
Open view settings → General → Sort order:
- Enable descending sorting
- Sort column:
usageKWH
-
Set the default time range to This month.
-
Save the view as Energy consumption by source.
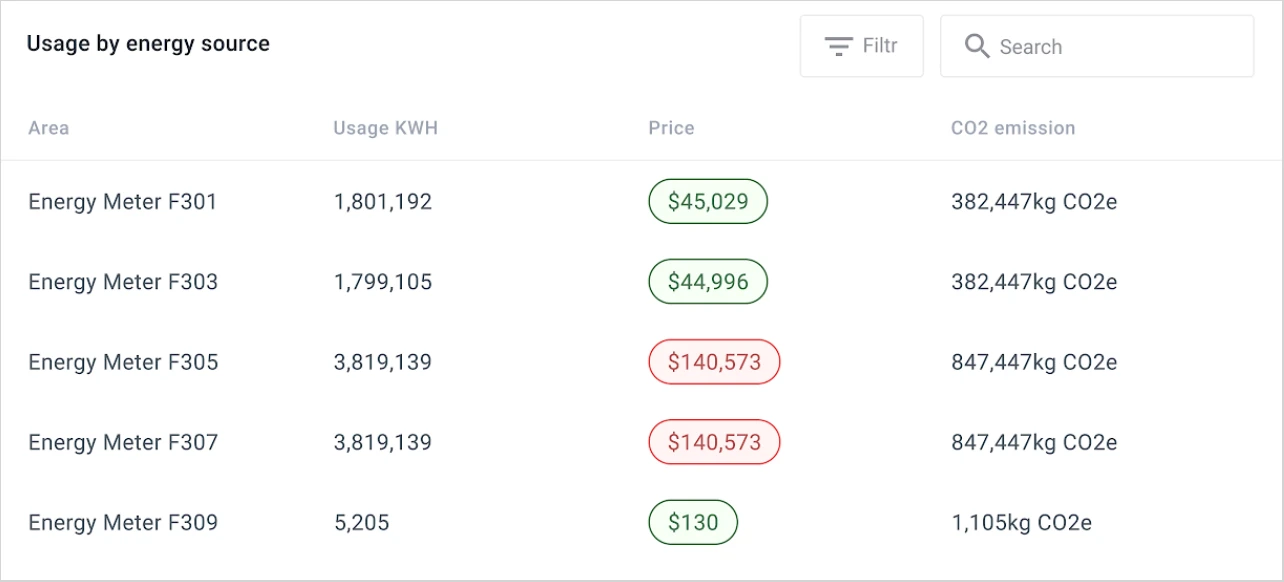
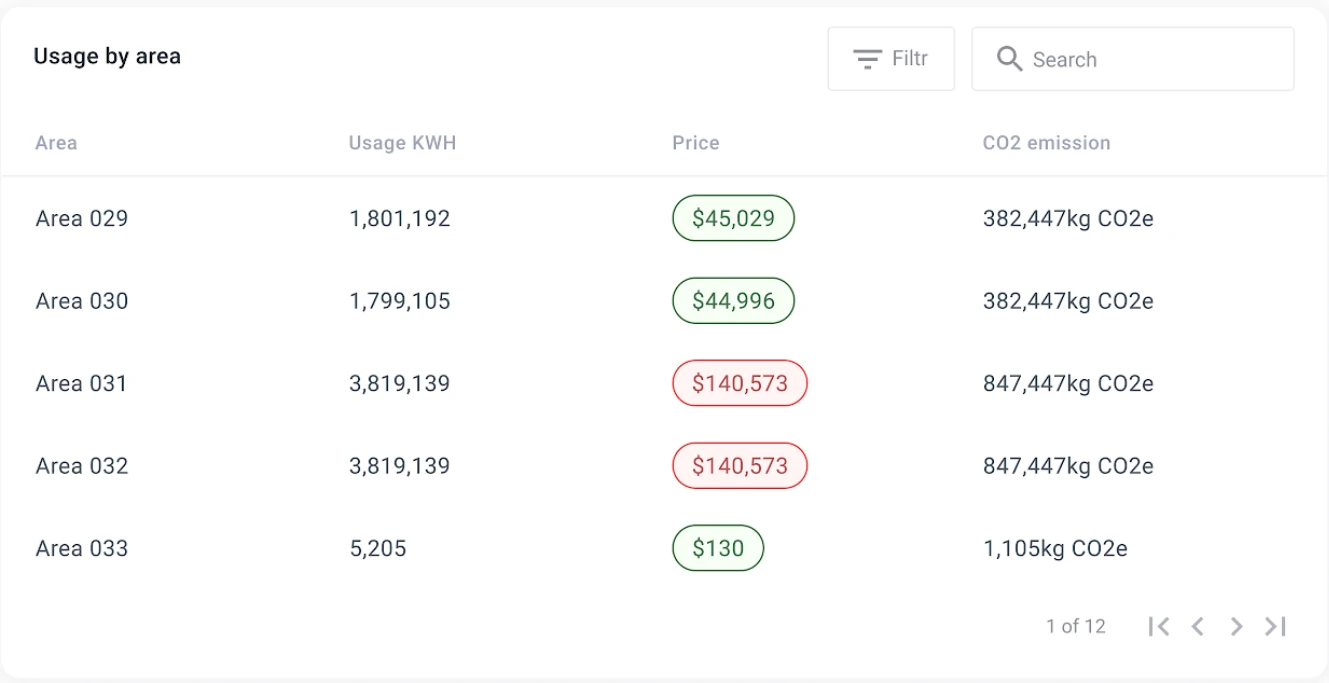
Step 2: Table — energy consumption by area
Section titled “Step 2: Table — energy consumption by area”Repeat Step 1, but replace energyMeter.sourceType with energyMeter.area in the Columns section.
Save the view as Energy consumption by area.
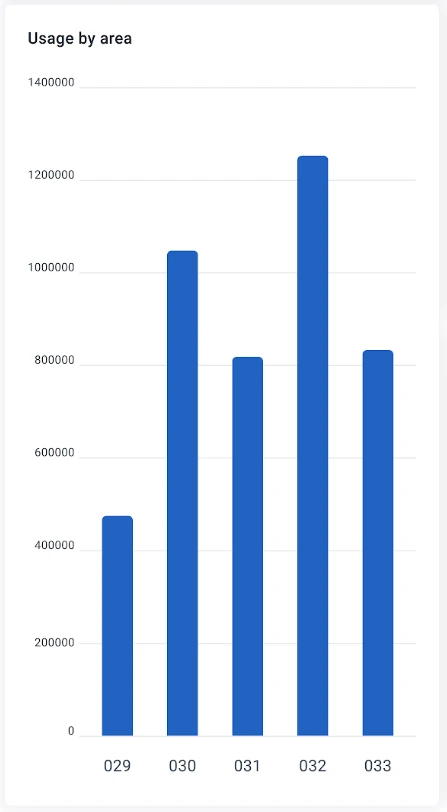
Step 3: Bar chart — compare usage by source type
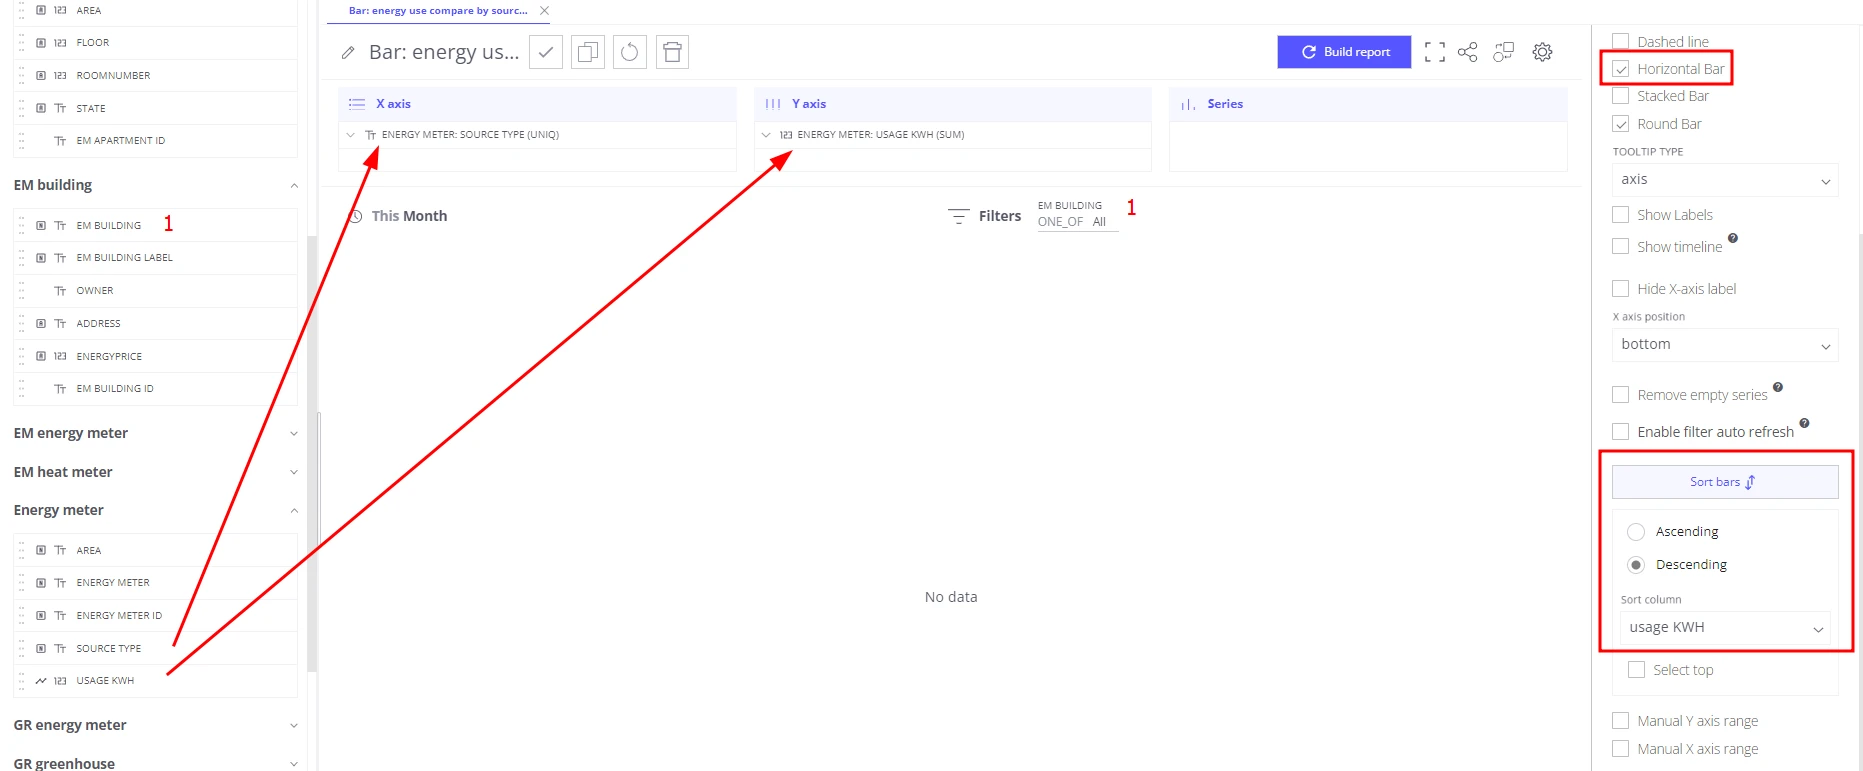
Section titled “Step 3: Bar chart — compare usage by source type”Tables give exact numbers; a horizontal bar chart makes it faster to spot the top consumers at a glance.
- Create a Bar chart in Trendz.
- Add
energyMeter.sourceTypeto the X-axis section. - Add
energyMeter.usageKWHto the Y-axis section. - Add
buildingto the Filters section. - Open view settings → General → enable Horizontal Bar.
- Configure default sorting: descending by
usageKWH. - Set the default time range to This month.
- Save the view as Bar: energy use compare by sources.
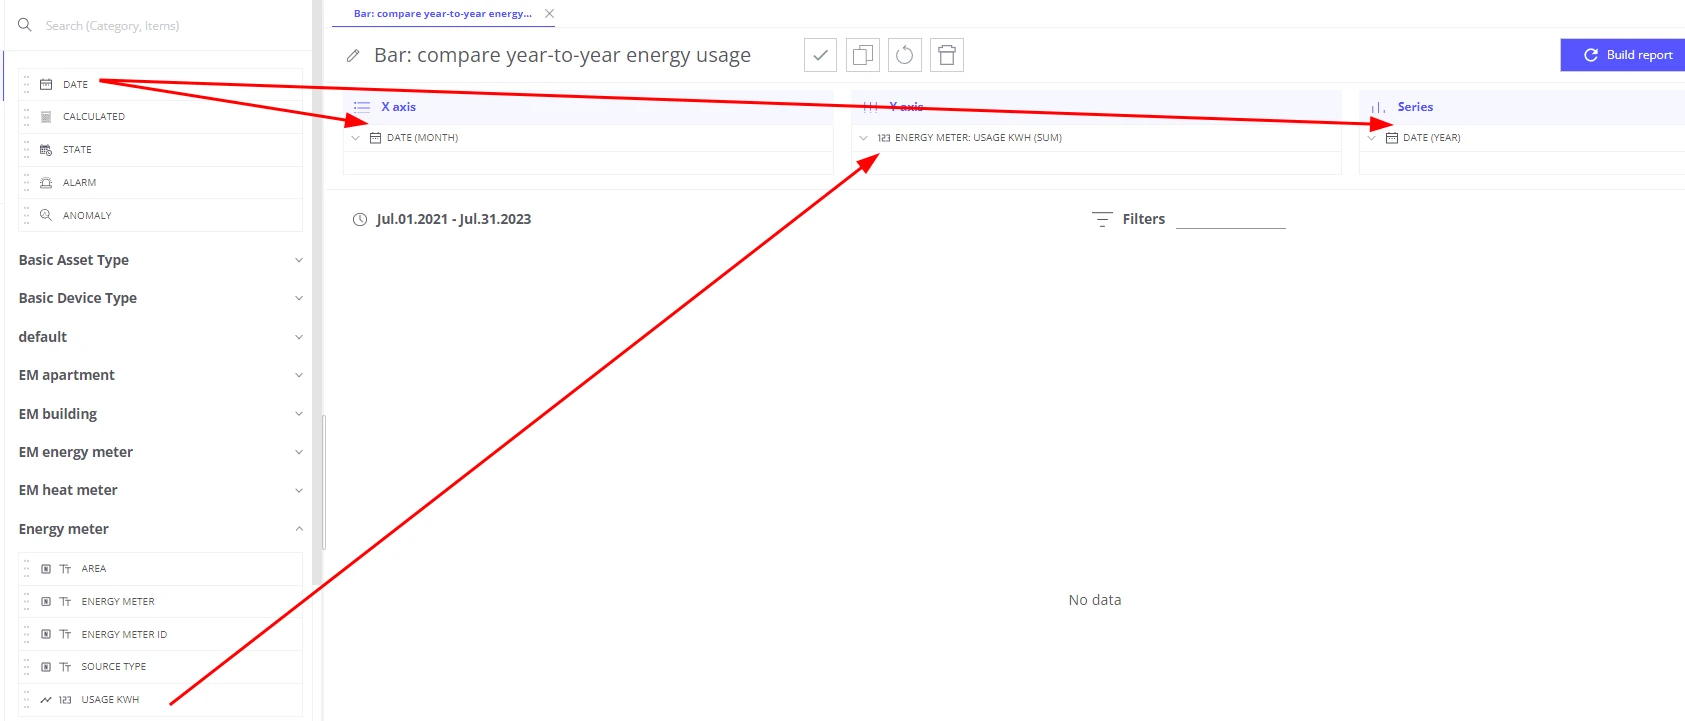
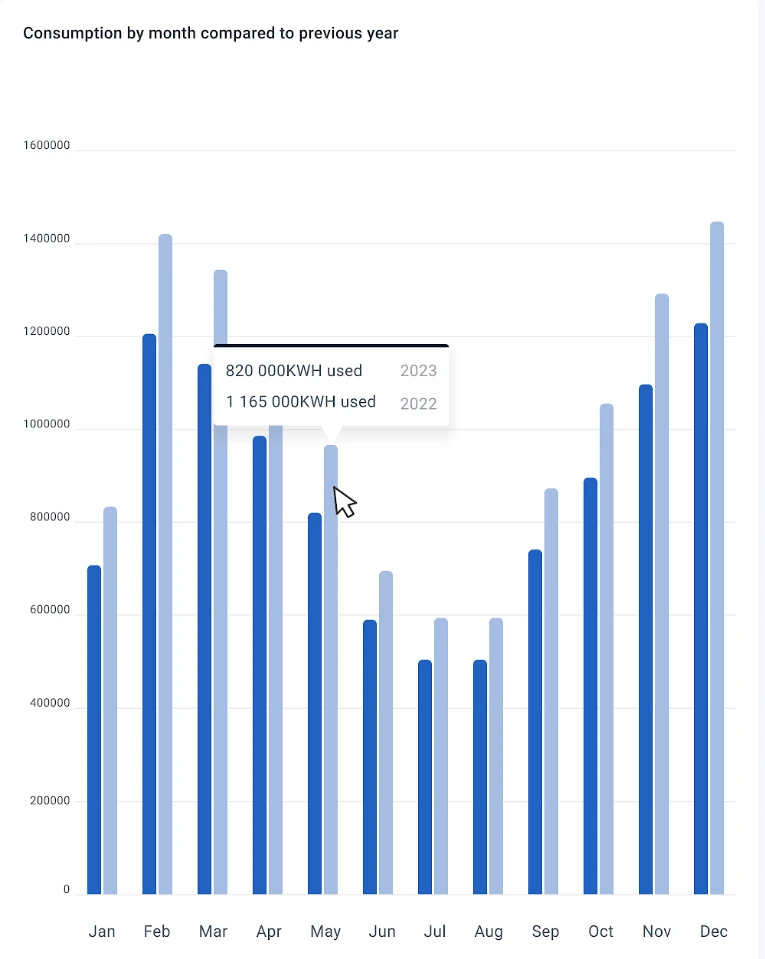
Step 4: Bar chart — year-over-year comparison with monthly breakdown
Section titled “Step 4: Bar chart — year-over-year comparison with monthly breakdown”- Create a Bar chart in Trendz.
- Add a Date field with type
MONTHto the X-axis section. - Add
energyMeter.usageKWHto the Y-axis section. - Add a Date field with type
YEARto the Series section — this splits bars by year. - Add
energyMeter.sourceType,energyMeter.area, andbuildingto the Filters section. - Set the default time range to Last 3 years.
- Save the view as Bar: compare year-to-year energy usage.

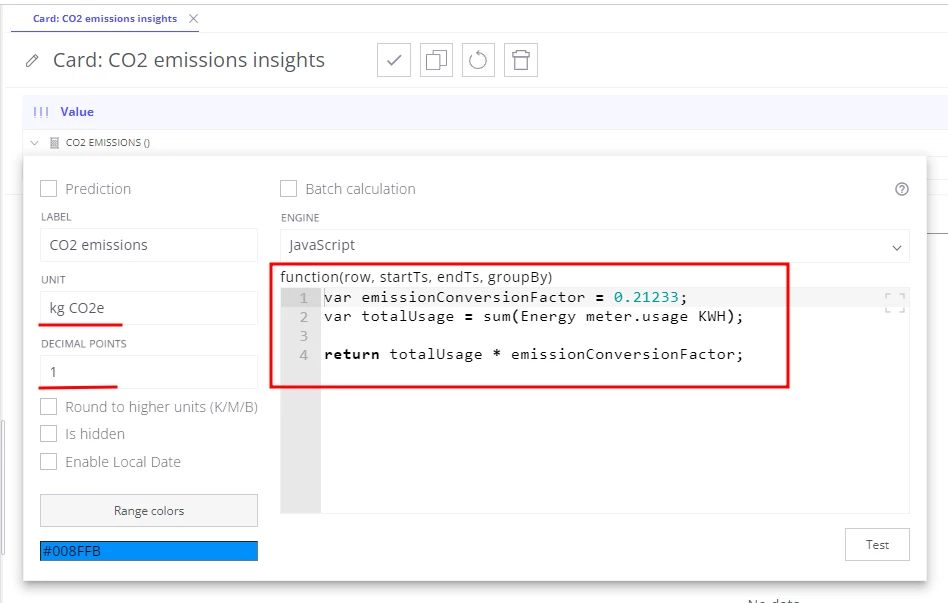
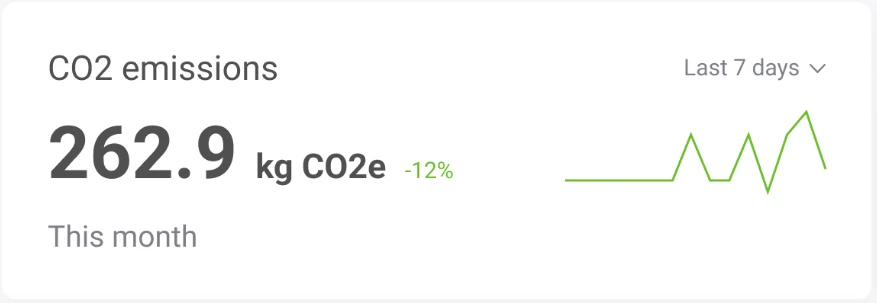
Step 5: Card — CO₂ emissions with trend
Section titled “Step 5: Card — CO₂ emissions with trend”-
Create a Card with line chart view in Trendz.
-
Add a calculated field with label CO2 emissions, unit
kg CO2e, decimals1:var emissionConversionFactor = 0.21233;var totalUsage = sum(energyMeter.usageKWH);return totalUsage * emissionConversionFactor; -
Set the default time range to This month.
-
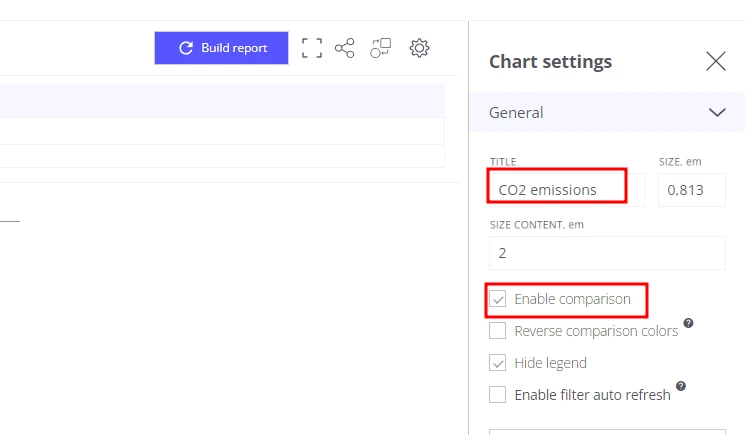
Open General settings → enable Enable comparison — adds a percentage delta vs. the previous period.
-
Enable Reverse comparison colors — green when emissions are lower, red when higher.
-
Set the card title to CO2 emissions.
-
Save the view as Card: CO2 emissions insights.
Step 6: Create the energy consumption dashboard in ThingsBoard
Section titled “Step 6: Create the energy consumption dashboard in ThingsBoard”Combine all Trendz views into one interactive dashboard that any customer can use to explore their buildings.
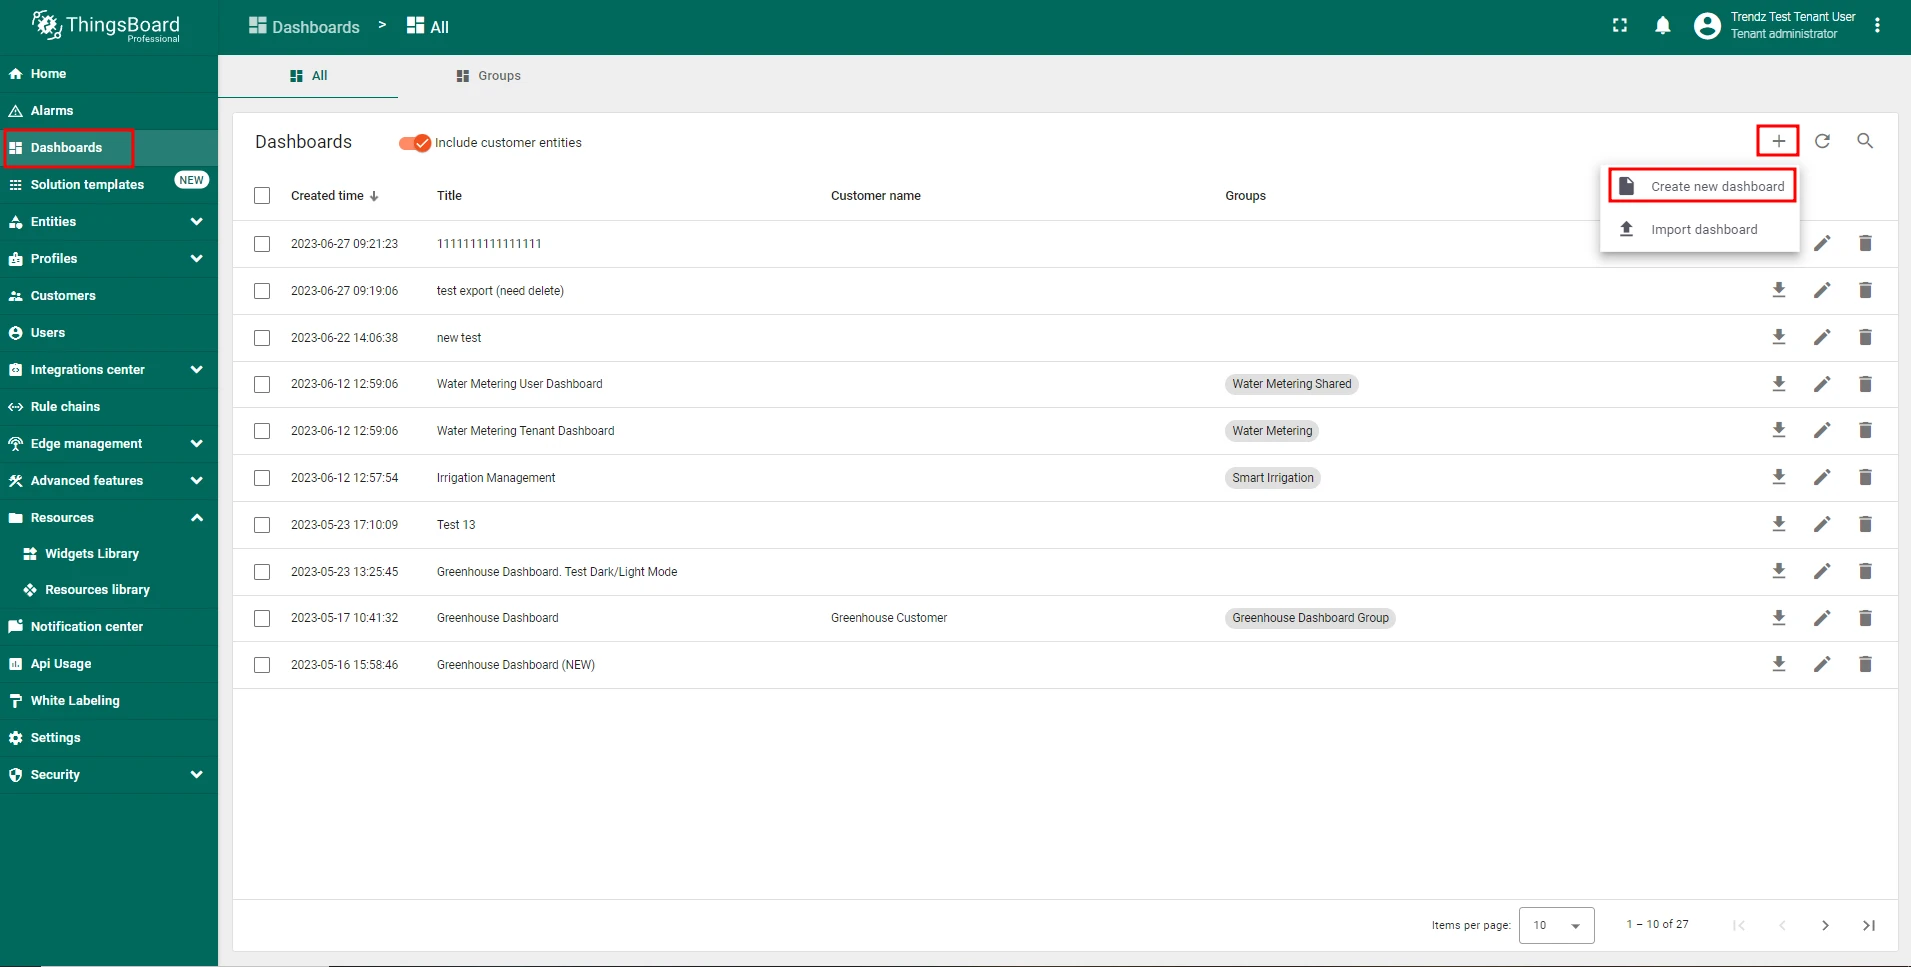
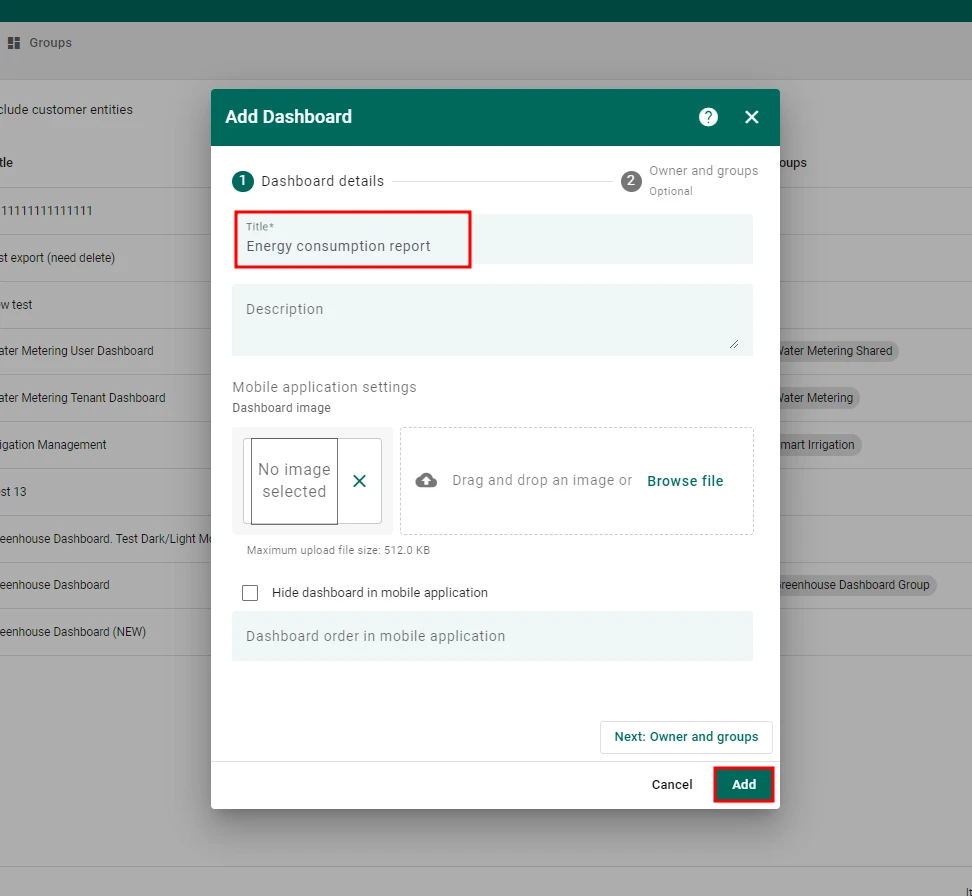
- In ThingsBoard, create a dashboard named Energy consumption report.
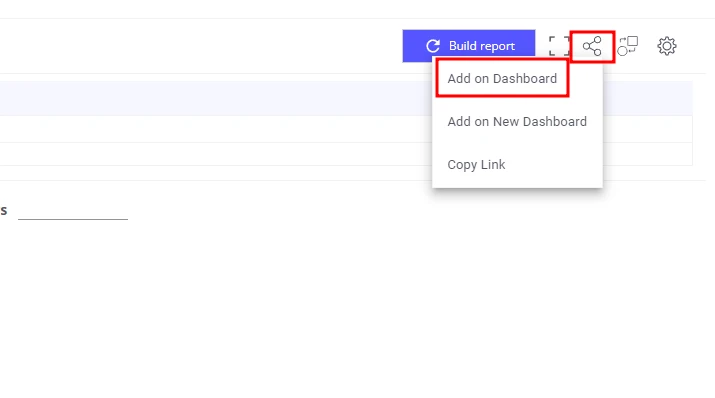
- In Trendz, for each view created in Steps 1–5:
- Click Share to ThingsBoard → copy Add on Dashboard.
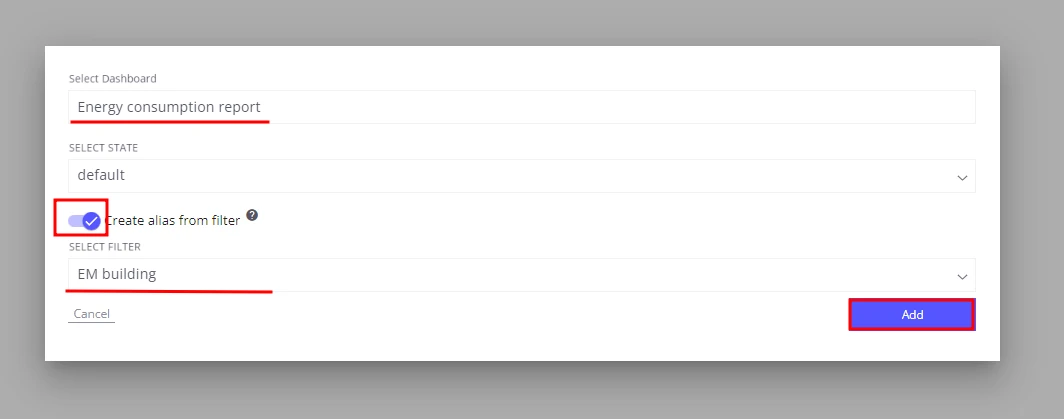
- Select the Energy consumption report dashboard.
- Enable Create alias and choose Building as the filter entity.
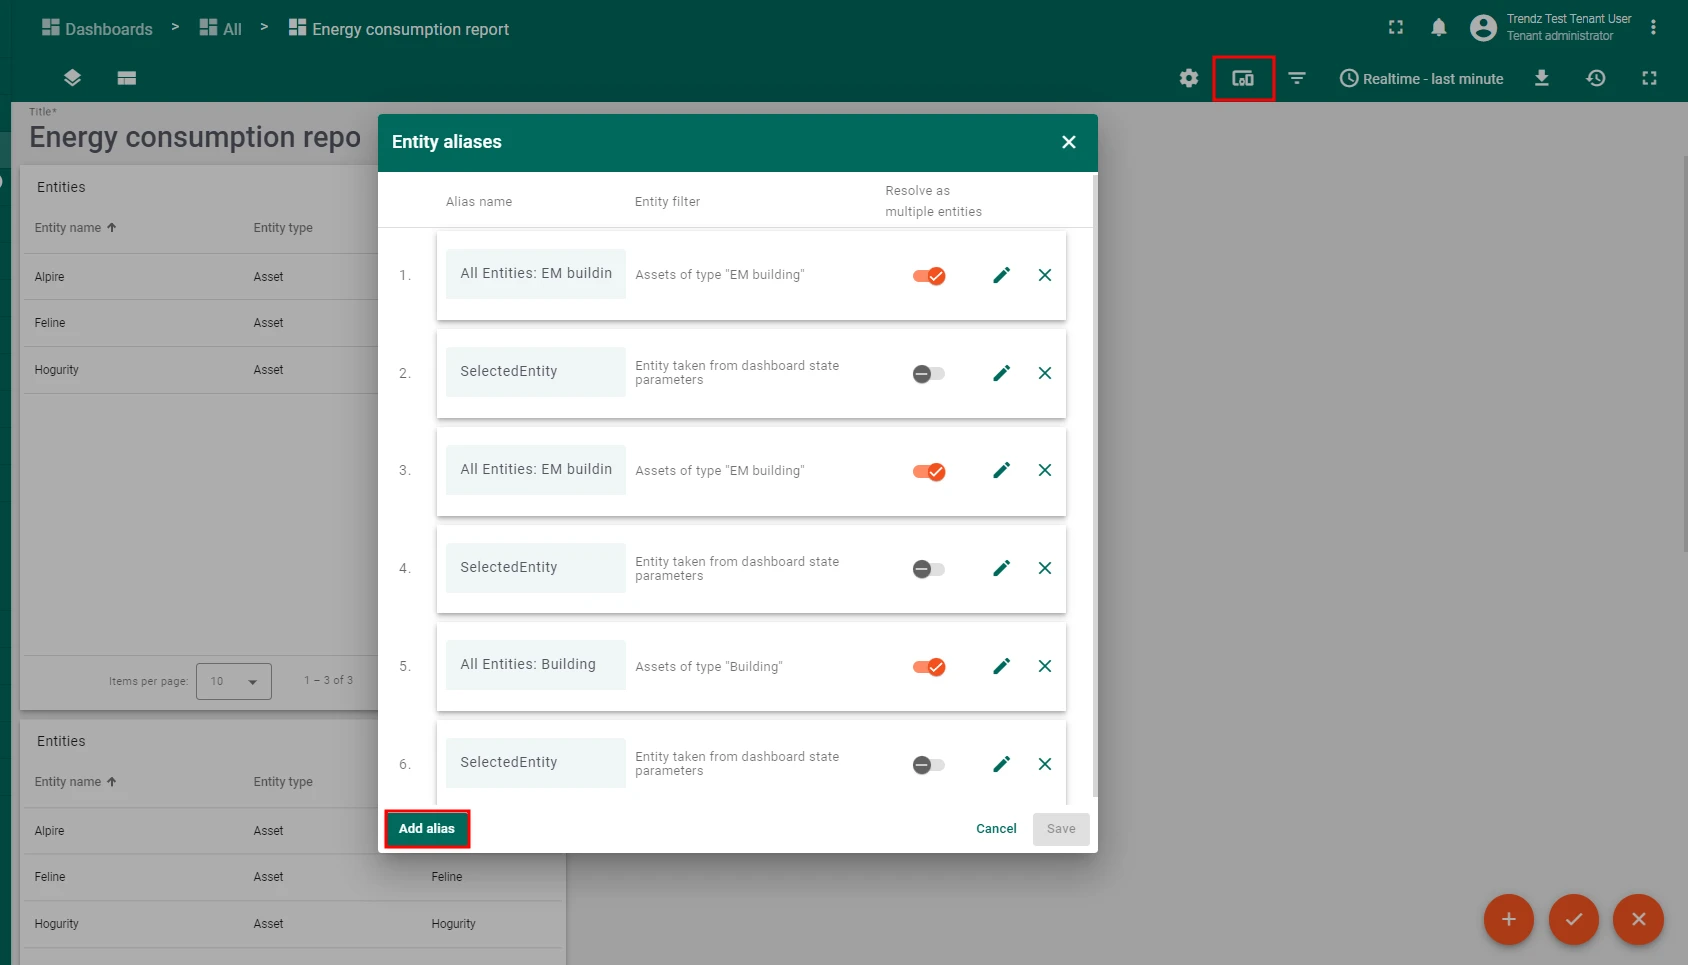
- Back in ThingsBoard, open the dashboard and tune the layout.
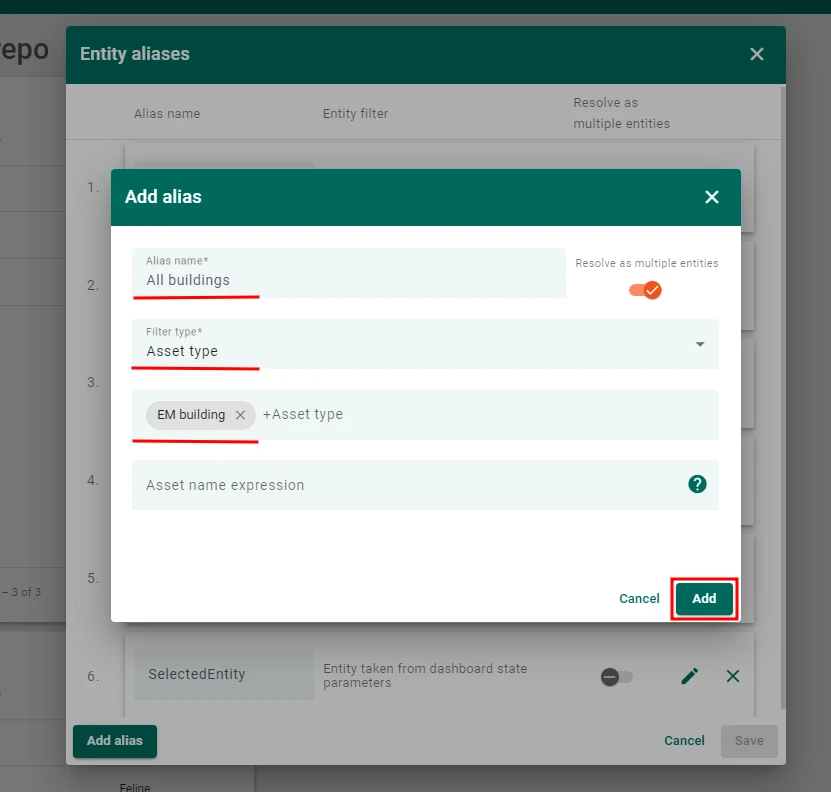
- Create the alias All buildings:
- Filter type: Asset type
- Asset type: Building
- Create the alias Selected entity:
- Filter type: Entity from dashboard state
- State entity parameter name:
selectedEntity
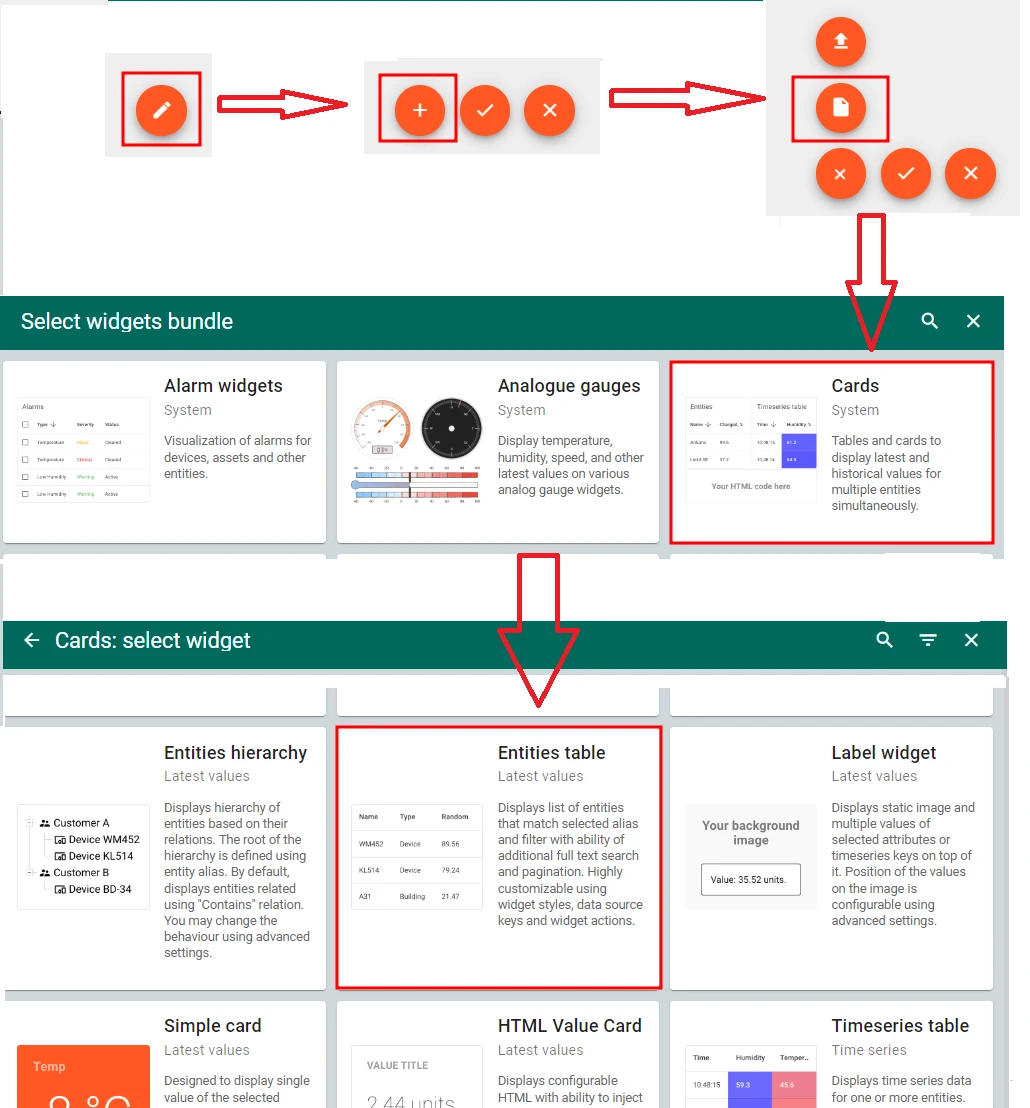
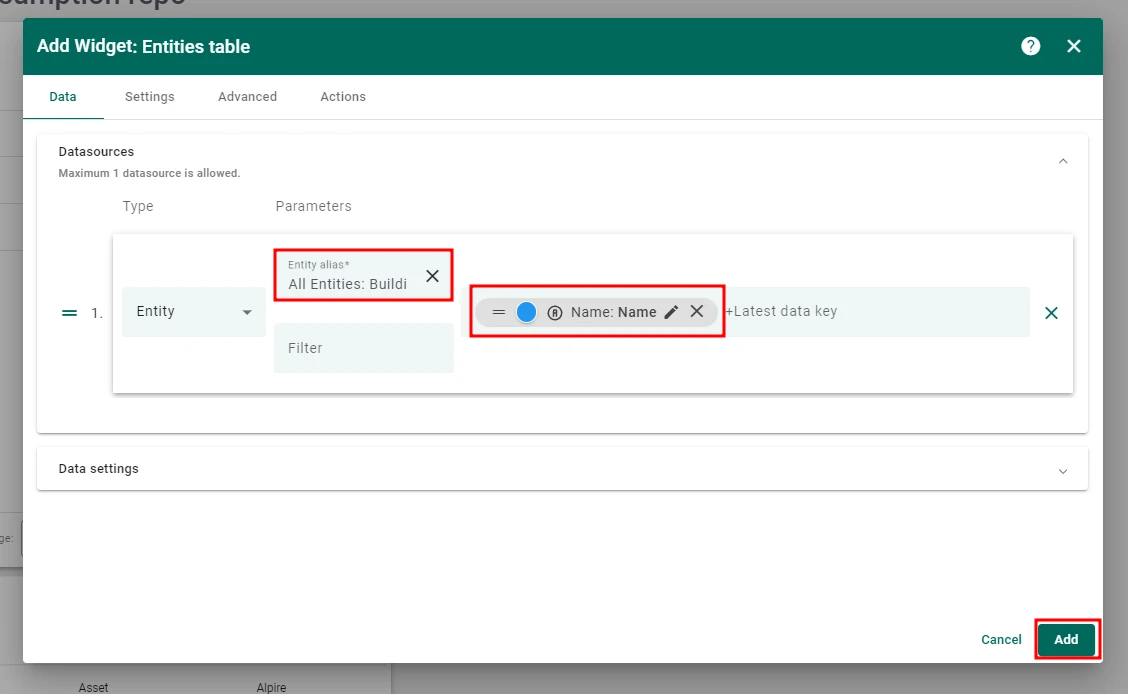
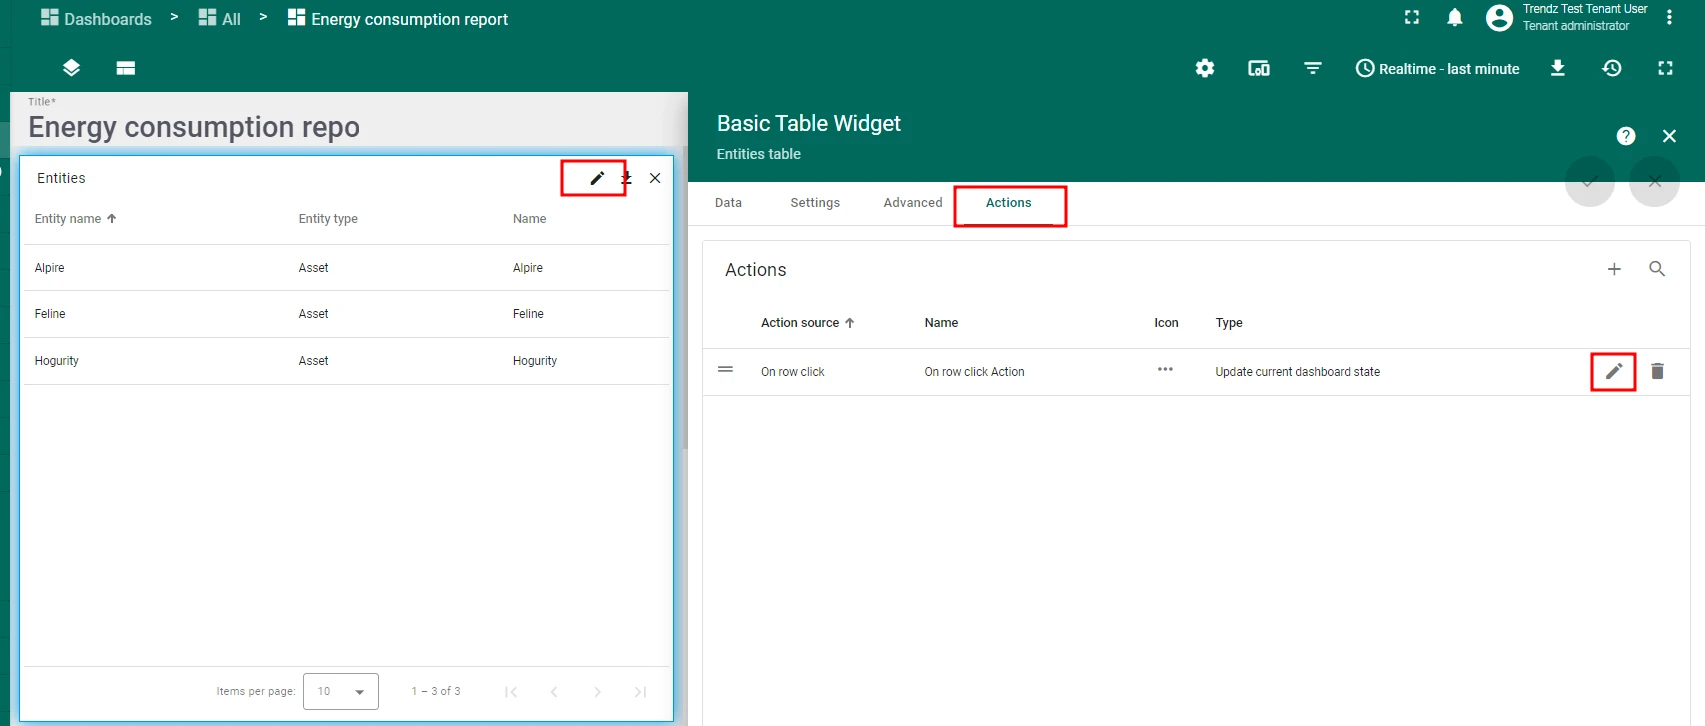
- Add a Cards → Entities table widget and set its datasource alias to All buildings. Add the Name key as a column.
- Add an On row click action to the entities table:
- Action type: Update current dashboard state
- State entity parameter name:
selectedEntity
- For all Trendz widgets, set the datasource alias to selectedEntity.
- Save the dashboard.

Summary
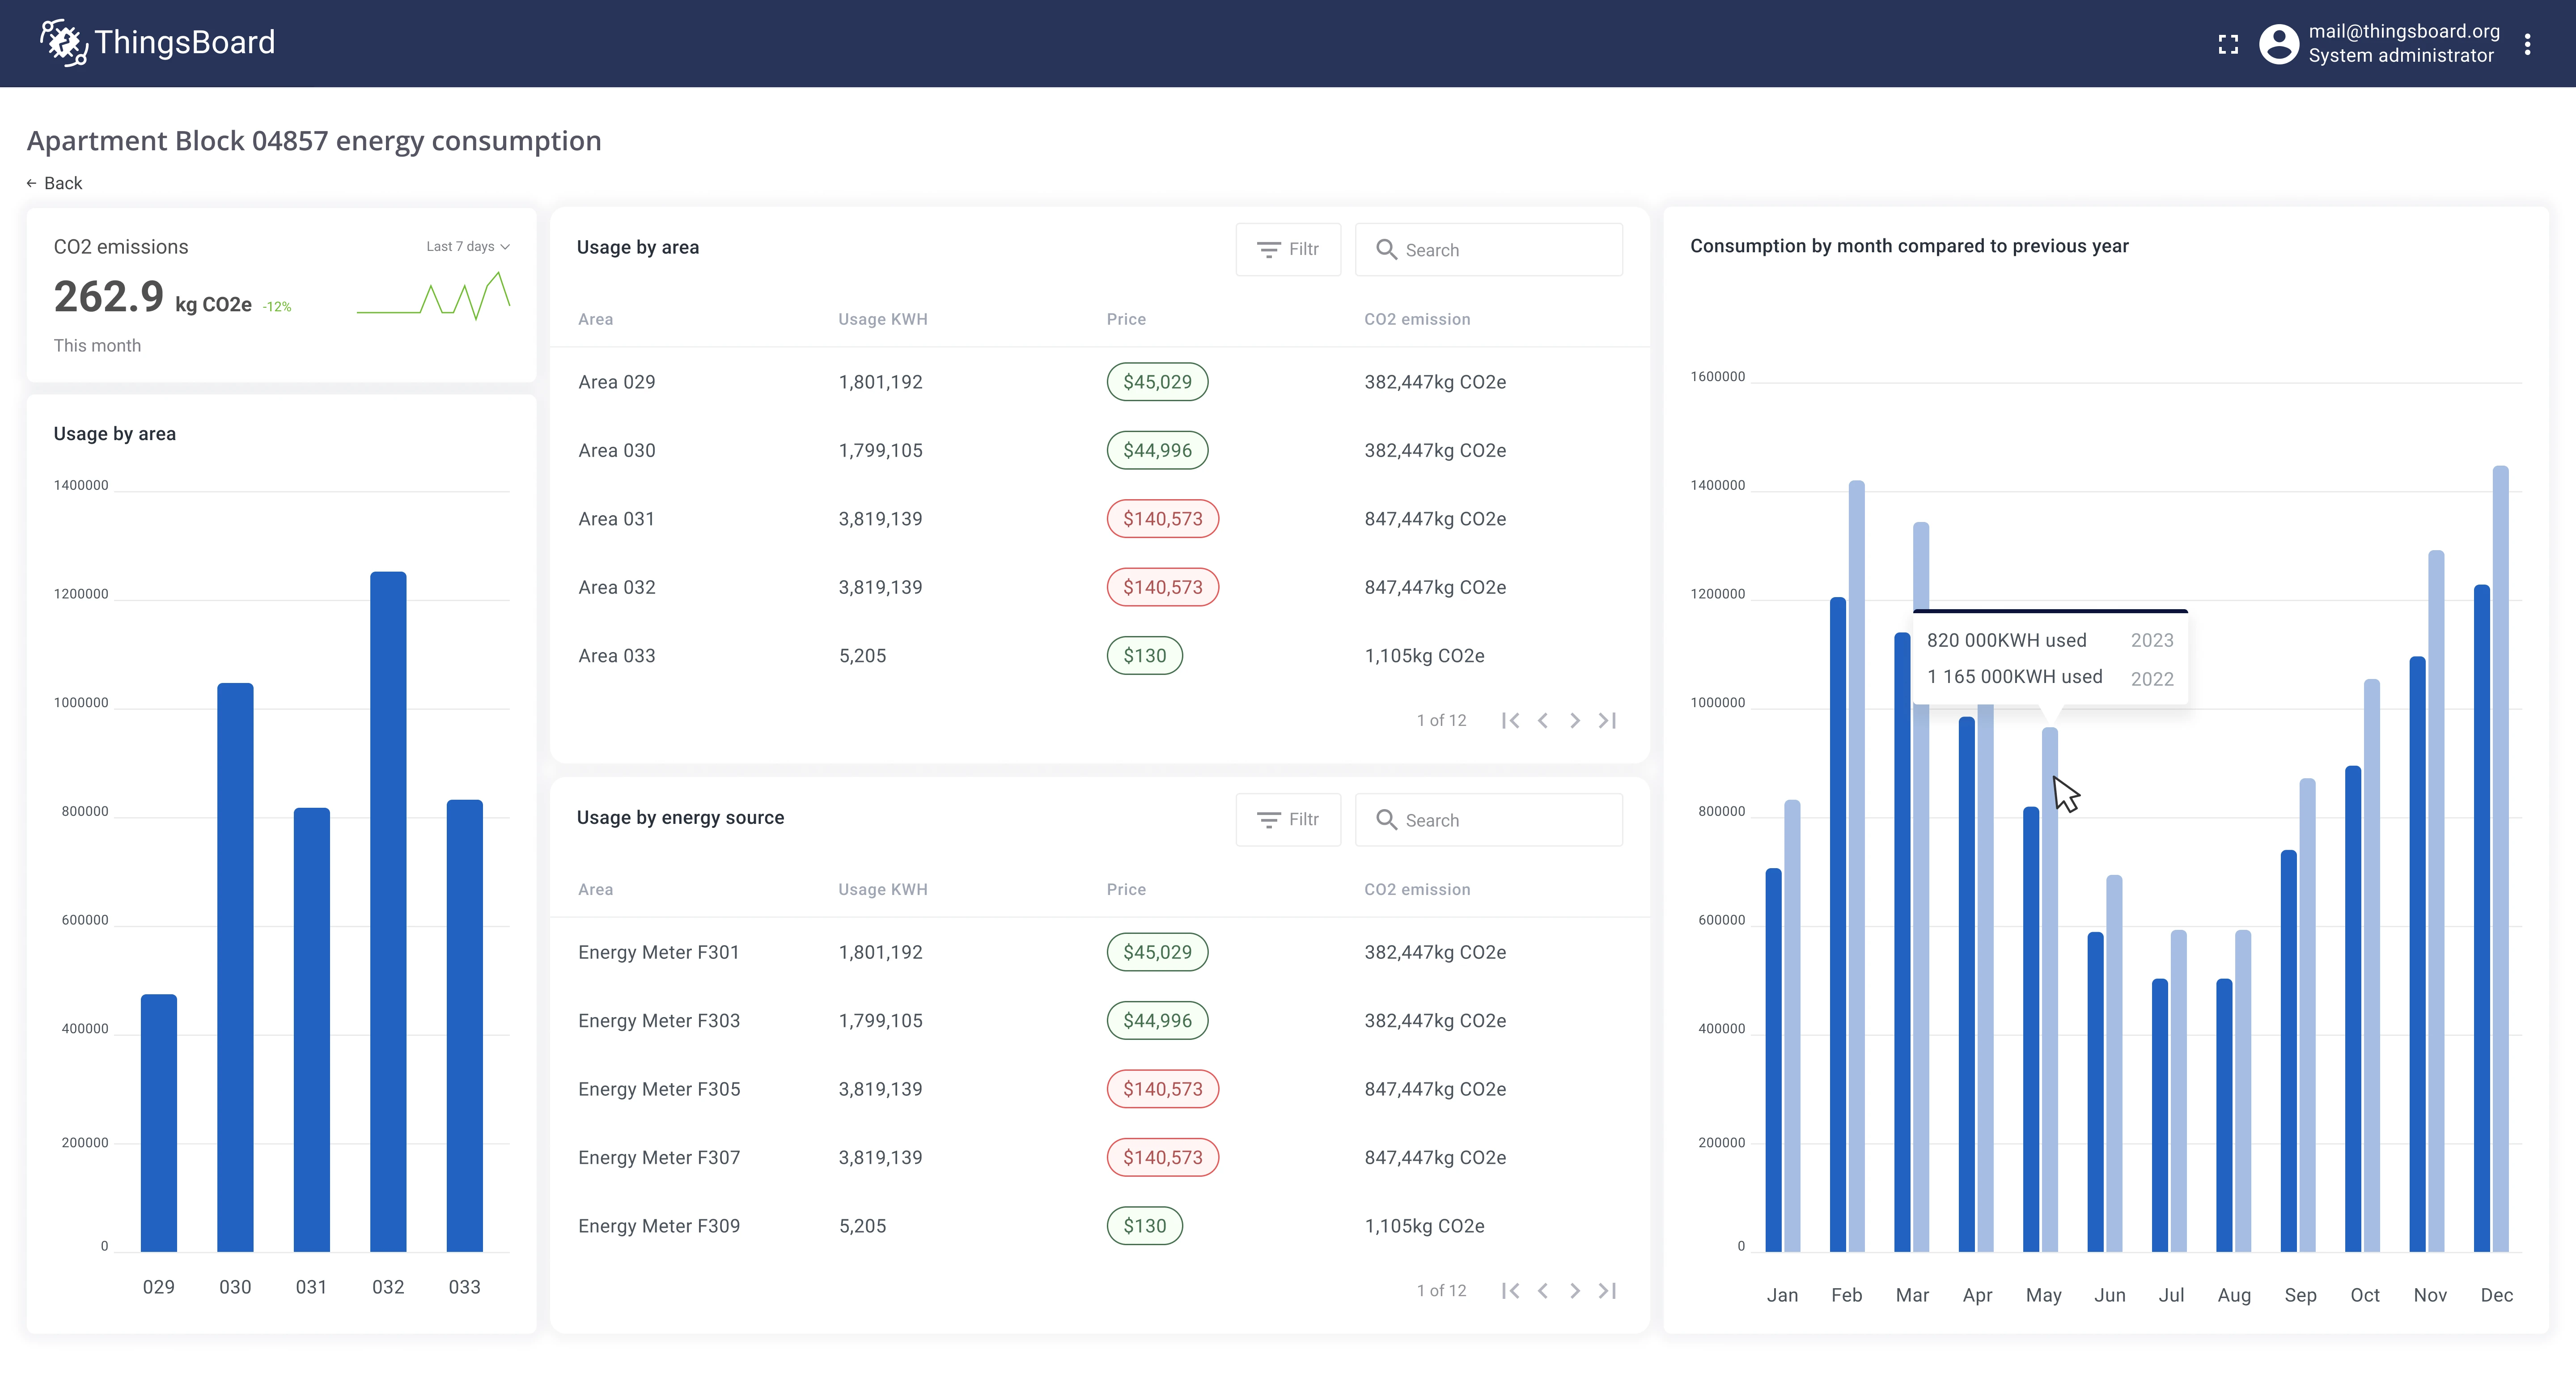
Section titled “Summary”The dashboard created in this guide gives facility managers a complete view of energy usage: which sources consume the most, which areas are the biggest contributors, how this year compares to last year by month, and what the building’s carbon footprint looks like. Interactive building filters make it easy to drill down from a portfolio view into a single site.
Was this helpful?