Time series data aggregation is a calculated field that computes aggregated metrics over historical telemetry of the current entity (hour/day/week/month, etc.) and stores the results as new telemetry keys.
Unlike “latest-value” aggregation across related entities, this type operates on historical time series data — ideal for analytics, reporting, and long-term KPIs.
When to use
- Analytics & KPIs
- Generate hourly/daily/weekly aggregates (e.g., hourly average temperature)
- Build KPIs from historical data (daily runtime, peak load, total consumption)
- Create reporting-ready statistics for exports, audits, or automation
- Performance & reliability
- Reduce dashboard/API load by storing pre-aggregated metrics
- Handle delayed telemetry and automatically correct historical aggregates
- Track near-real-time aggregates using intermediate results (e.g., “current hour average so far”)
Configuration
Open the create calculated field dialog and specify:
- the calculated field title,
- the entity or entity profile to which the calculated field will be applied,
- Select “Time series data aggregation” as a calculated field type.
Arguments
Arguments define which telemetry values are used for aggregation. This calculated field type reads historical telemetry only from the current entity.
Click Add argument and fill in the required fields:
- Time series key — the telemetry key whose data will be aggregated (for example, temperature, power, voltage)
- Argument name — the variable name referenced by metrics
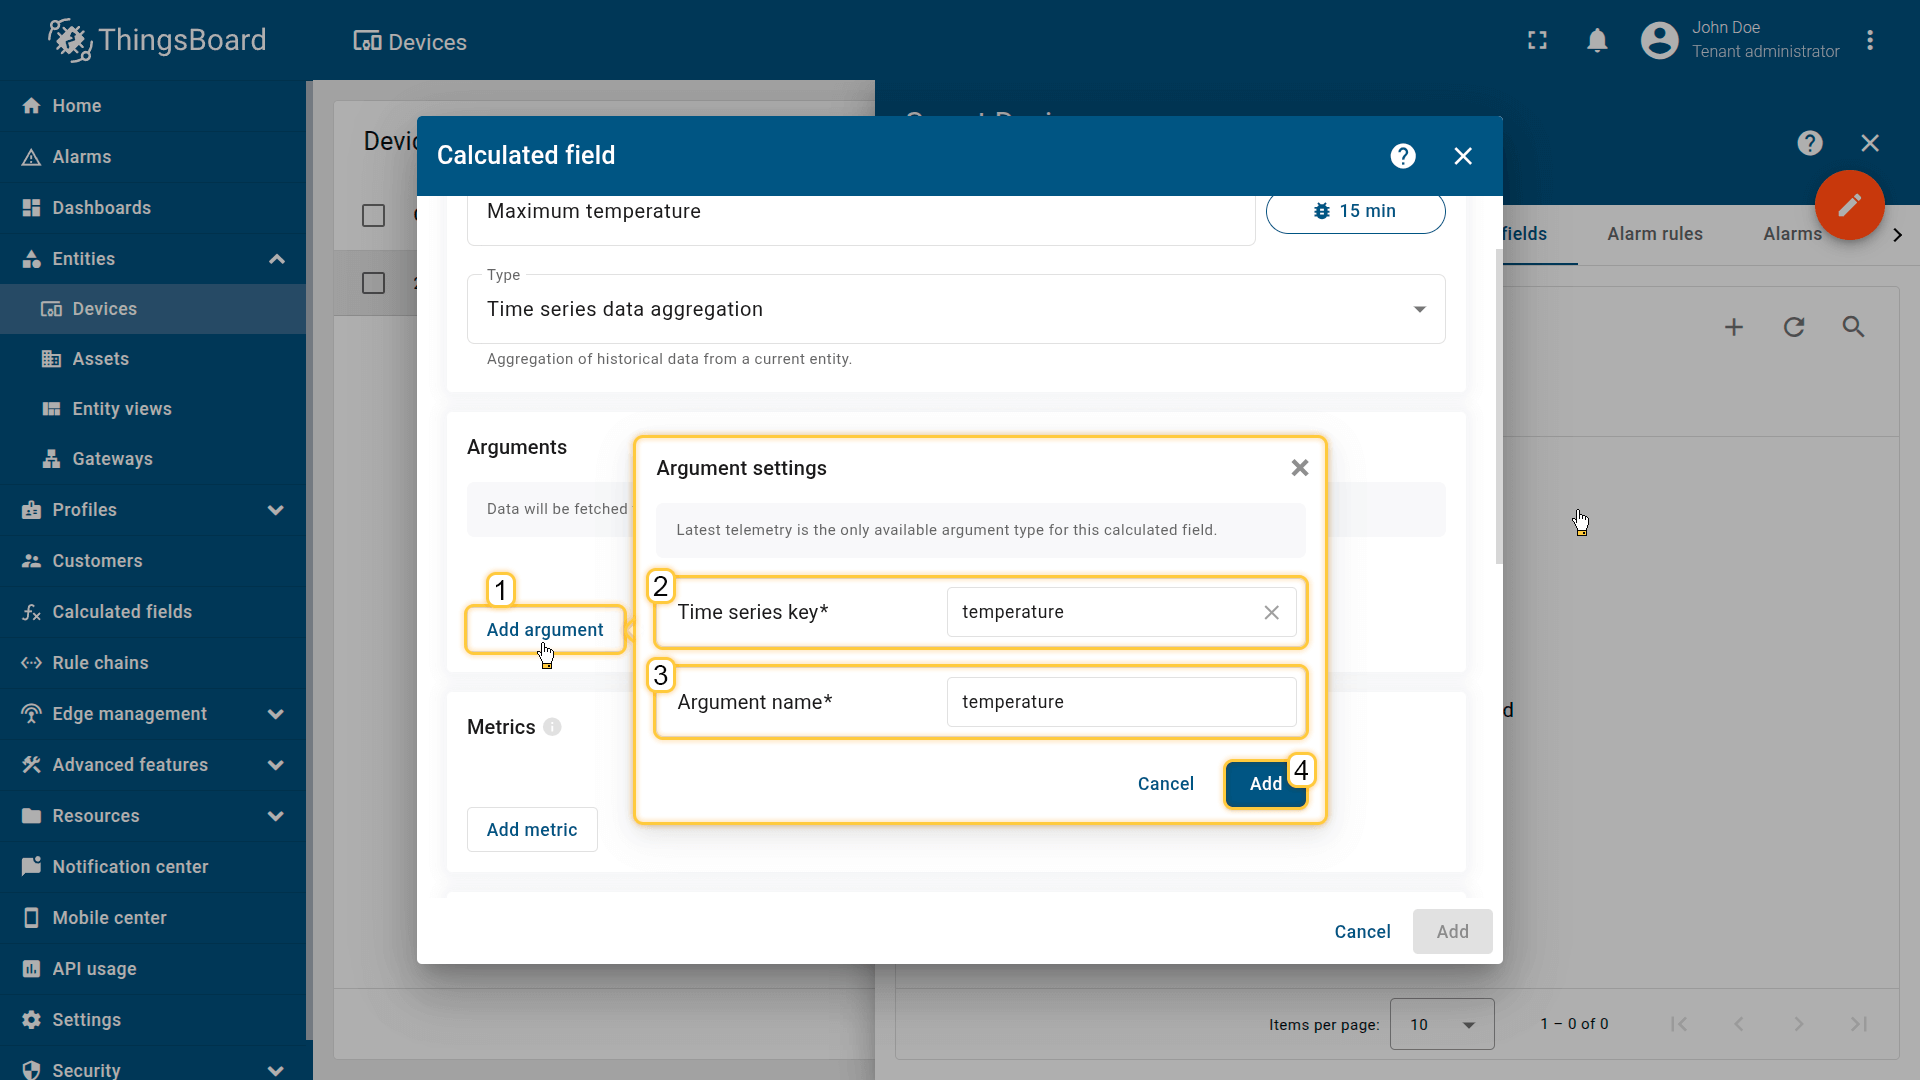
Click Add argument (1) and fill in the required fields:
- Time series key (2) — the telemetry key whose data will be aggregated (for example, temperature, power, voltage)
- Argument name (3) — the variable name referenced by metrics.
Then click Add (4).
Metrics
Each metric produces one output telemetry key (Metric name) by applying one aggregation function to one argument.
Click the Add metric button and fill in the required fields:
- Metric name: output telemetry key name (e.g., tempAvg, tempMax)
- Aggregation: Average / Min / Max / Sum / Count
- Argument name: the argument whose value is being aggregated.
- Default value: used if the interval contains no data
You can create multiple metrics from the same argument (e.g., tempAvg, tempMin, tempMax).
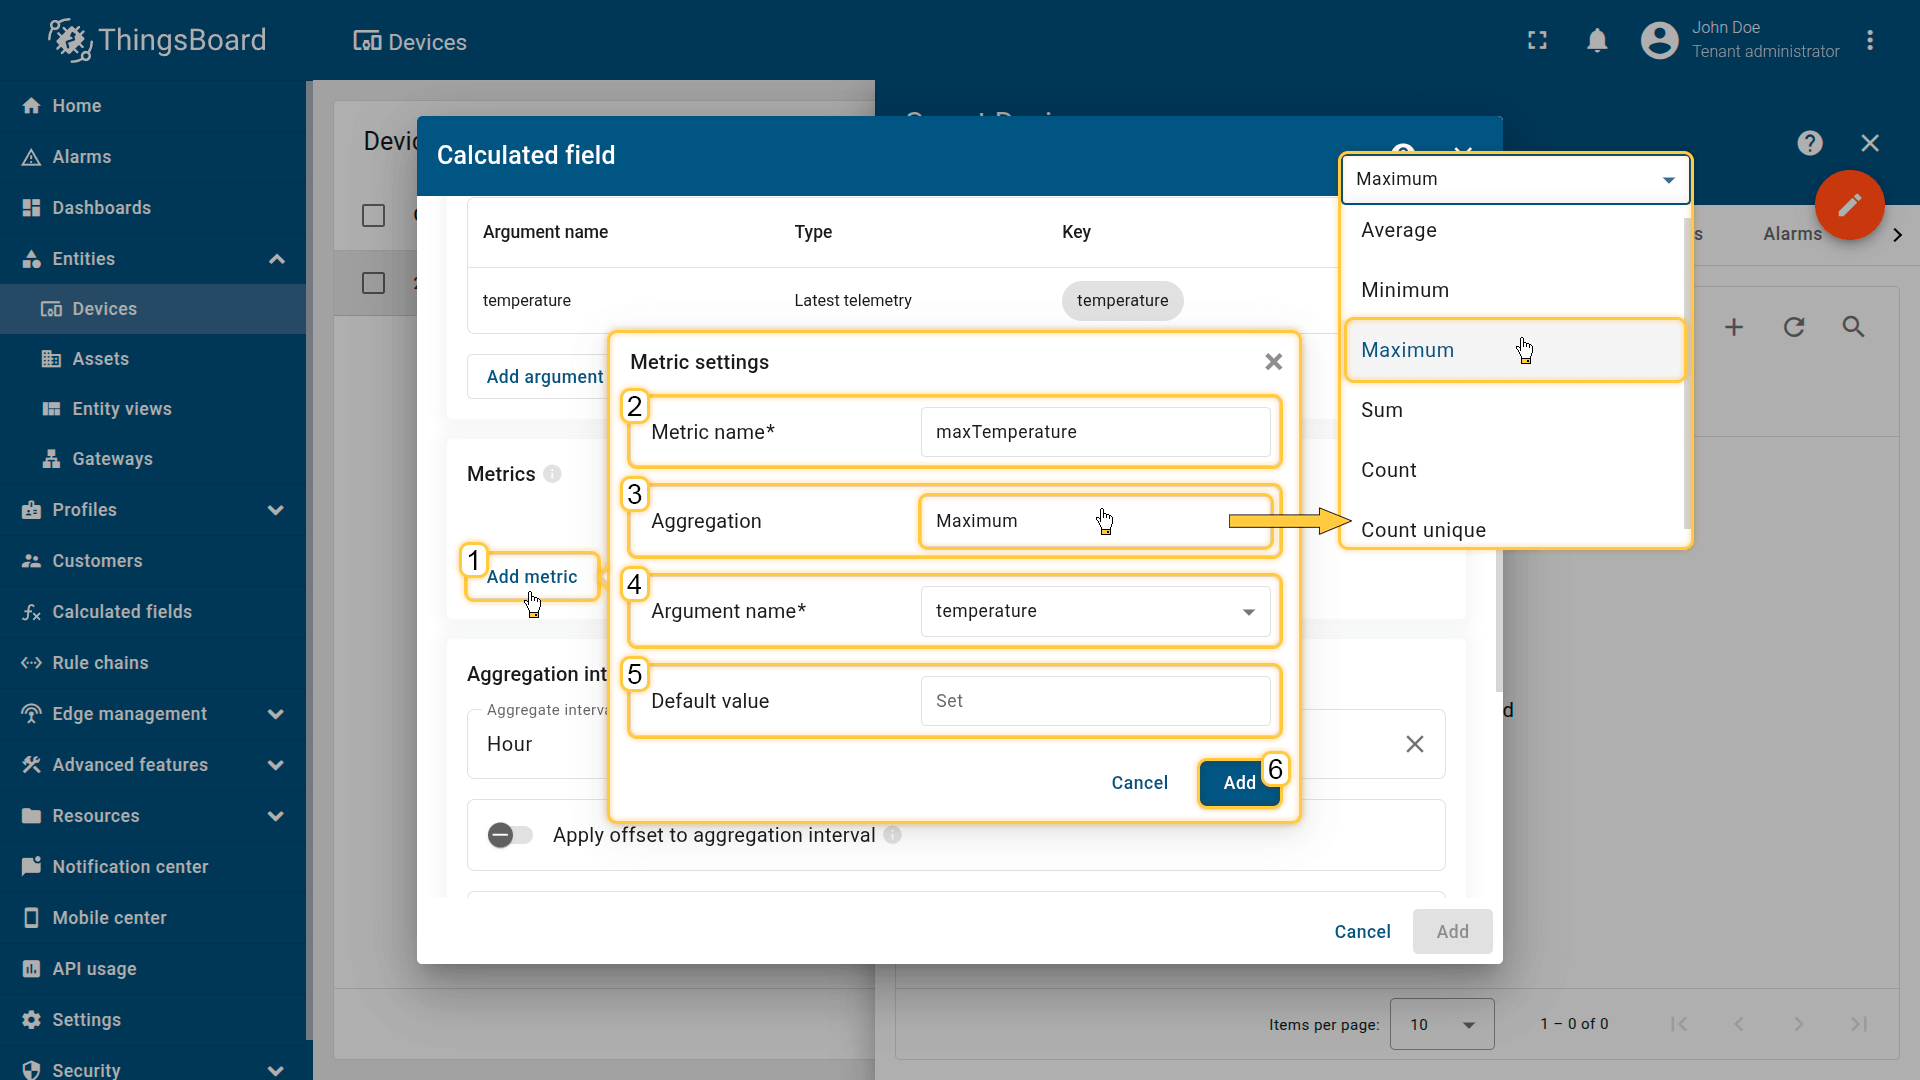
Click the Add metric button (1) and fill in the required fields:
- Metric name (2): output telemetry key name (e.g., tempAvg, tempMax)
- Aggregation (3): Average / Min / Max / Sum / Count
- Argument name (4): the argument whose value is being aggregated.
- Default value (5): used if the interval contains no data
Then click Add (6).
Aggregation interval
Defines how often aggregation runs and how time boundaries are aligned. Example: every 1 hour produces results at 00:00, 01:00, 02:00, etc.
- Aggregate interval type: Hour / Day / Week (Mon–Sun) / Week (Sun–Sat) / Month / Quarter / Year / Custom
- Time zone: aligns interval boundaries for daily/weekly reports and region-specific KPIs
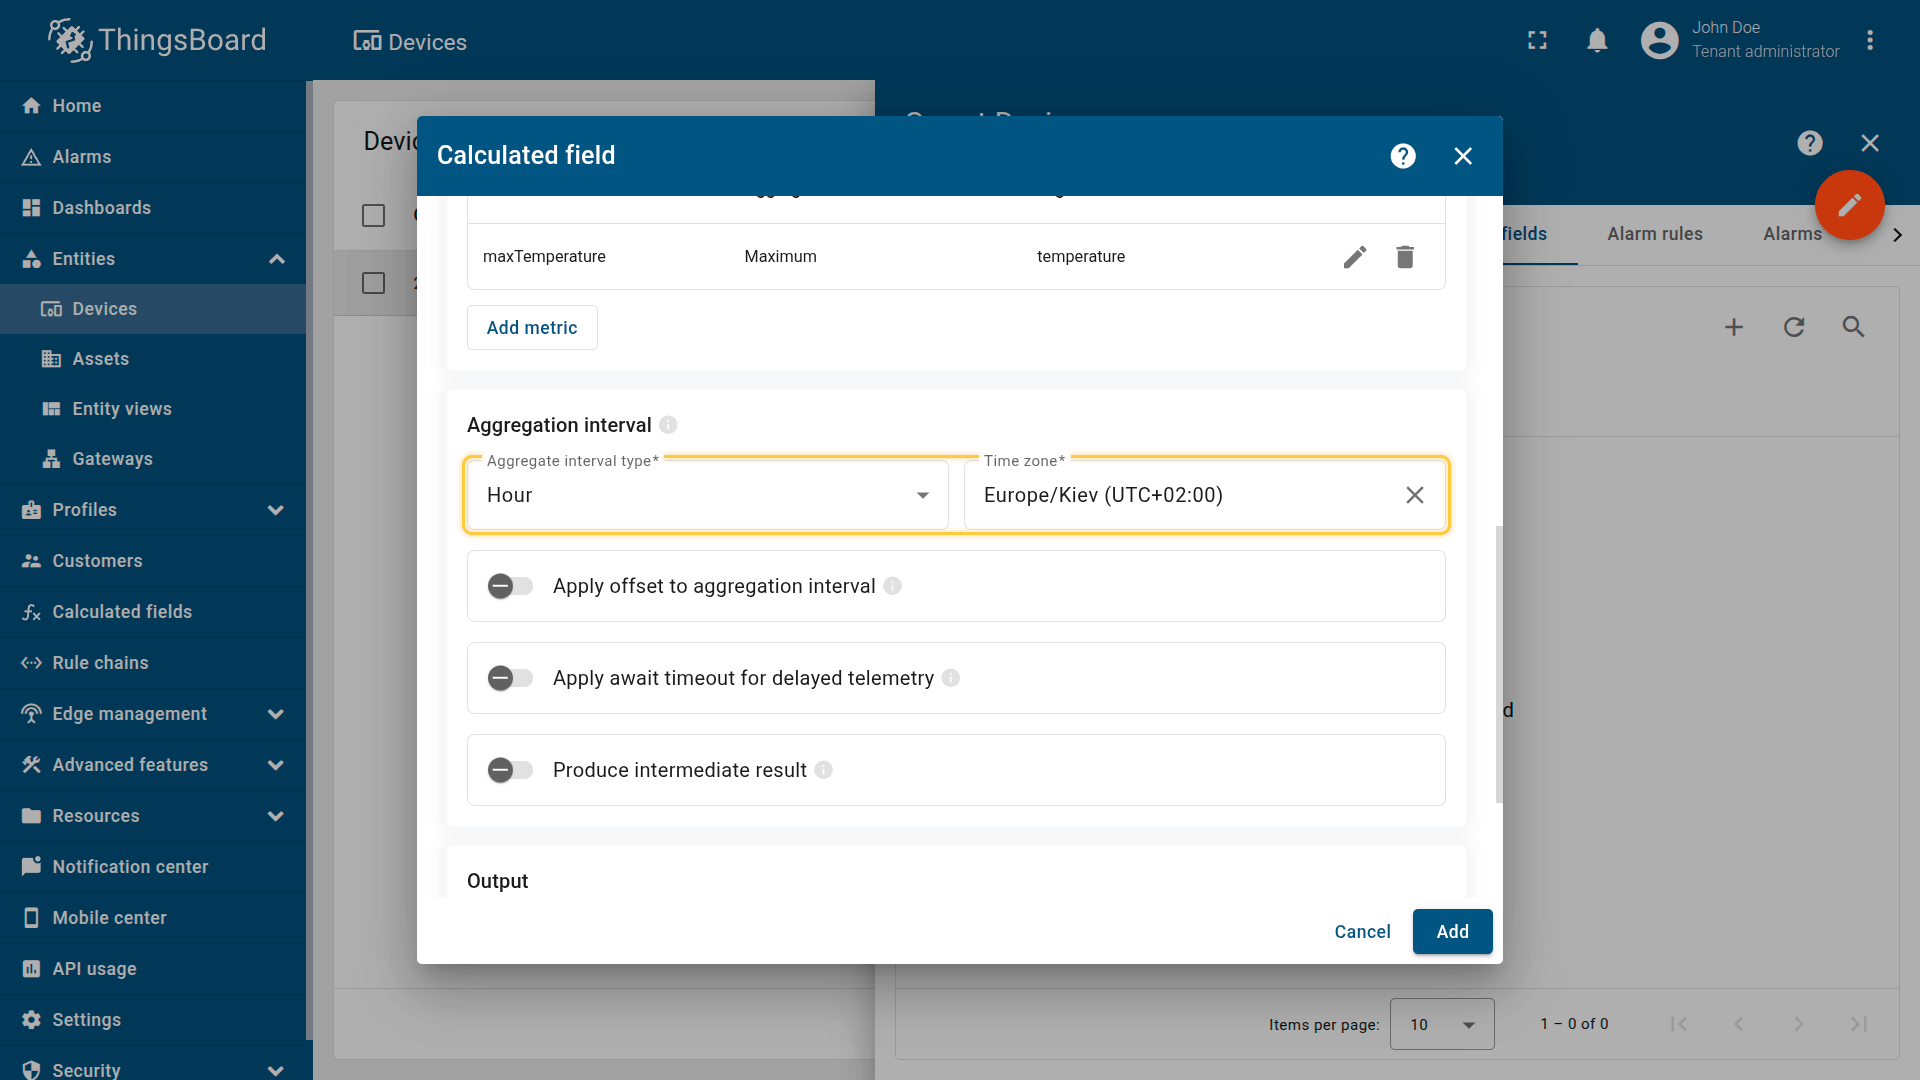
Defines how often aggregation runs and how time boundaries are aligned.
Advanced interval options
Apply offset to aggregation interval
Shifts the start of each interval by a fixed offset (e.g., +10 minutes → 00:10, 01:10…).
Useful when telemetry arrives slightly after boundaries or when aligning with external systems.
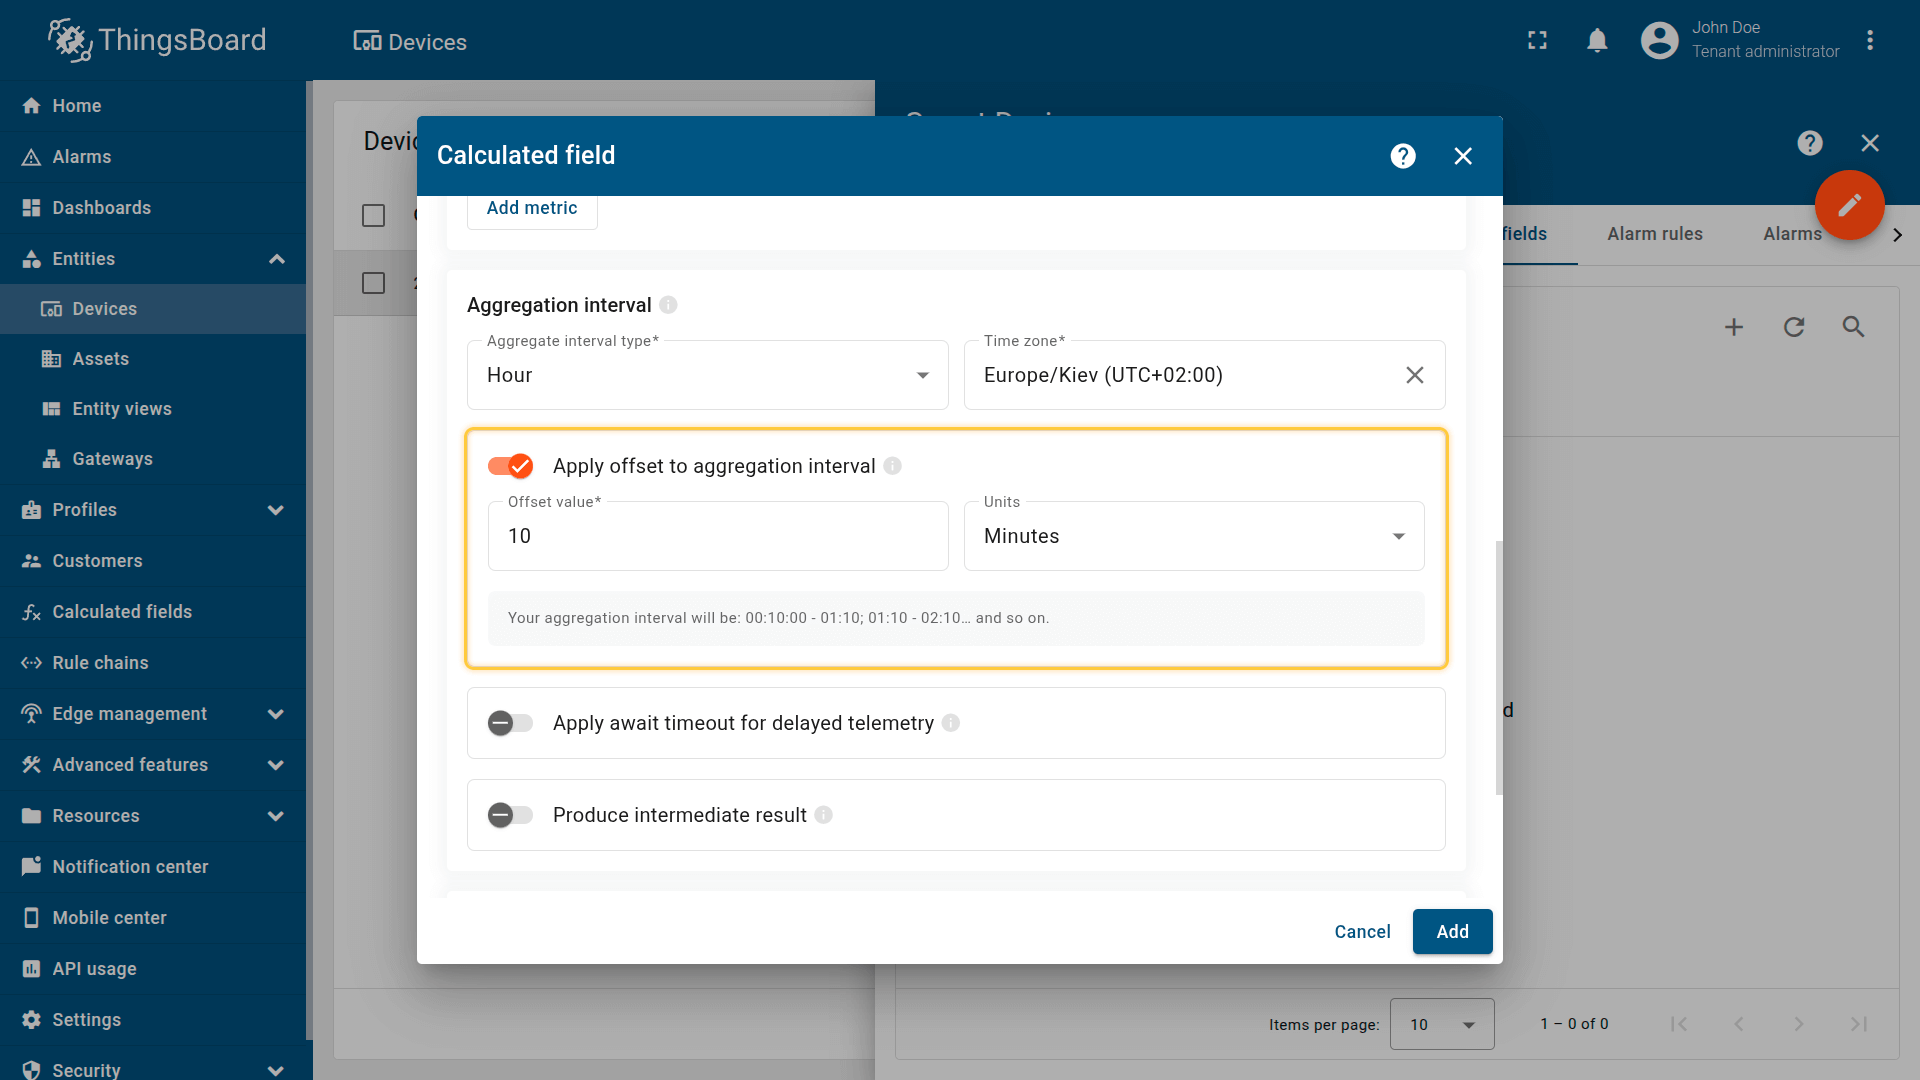
Shifts the start of each interval by a fixed offset (e.g., +10 minutes → 00:10, 01:10…).
Apply await timeout for delayed telemetry
Defines how long the system waits for late telemetry after an interval ends.
If late telemetry belongs to that interval, the system recalculates the result to improve accuracy.
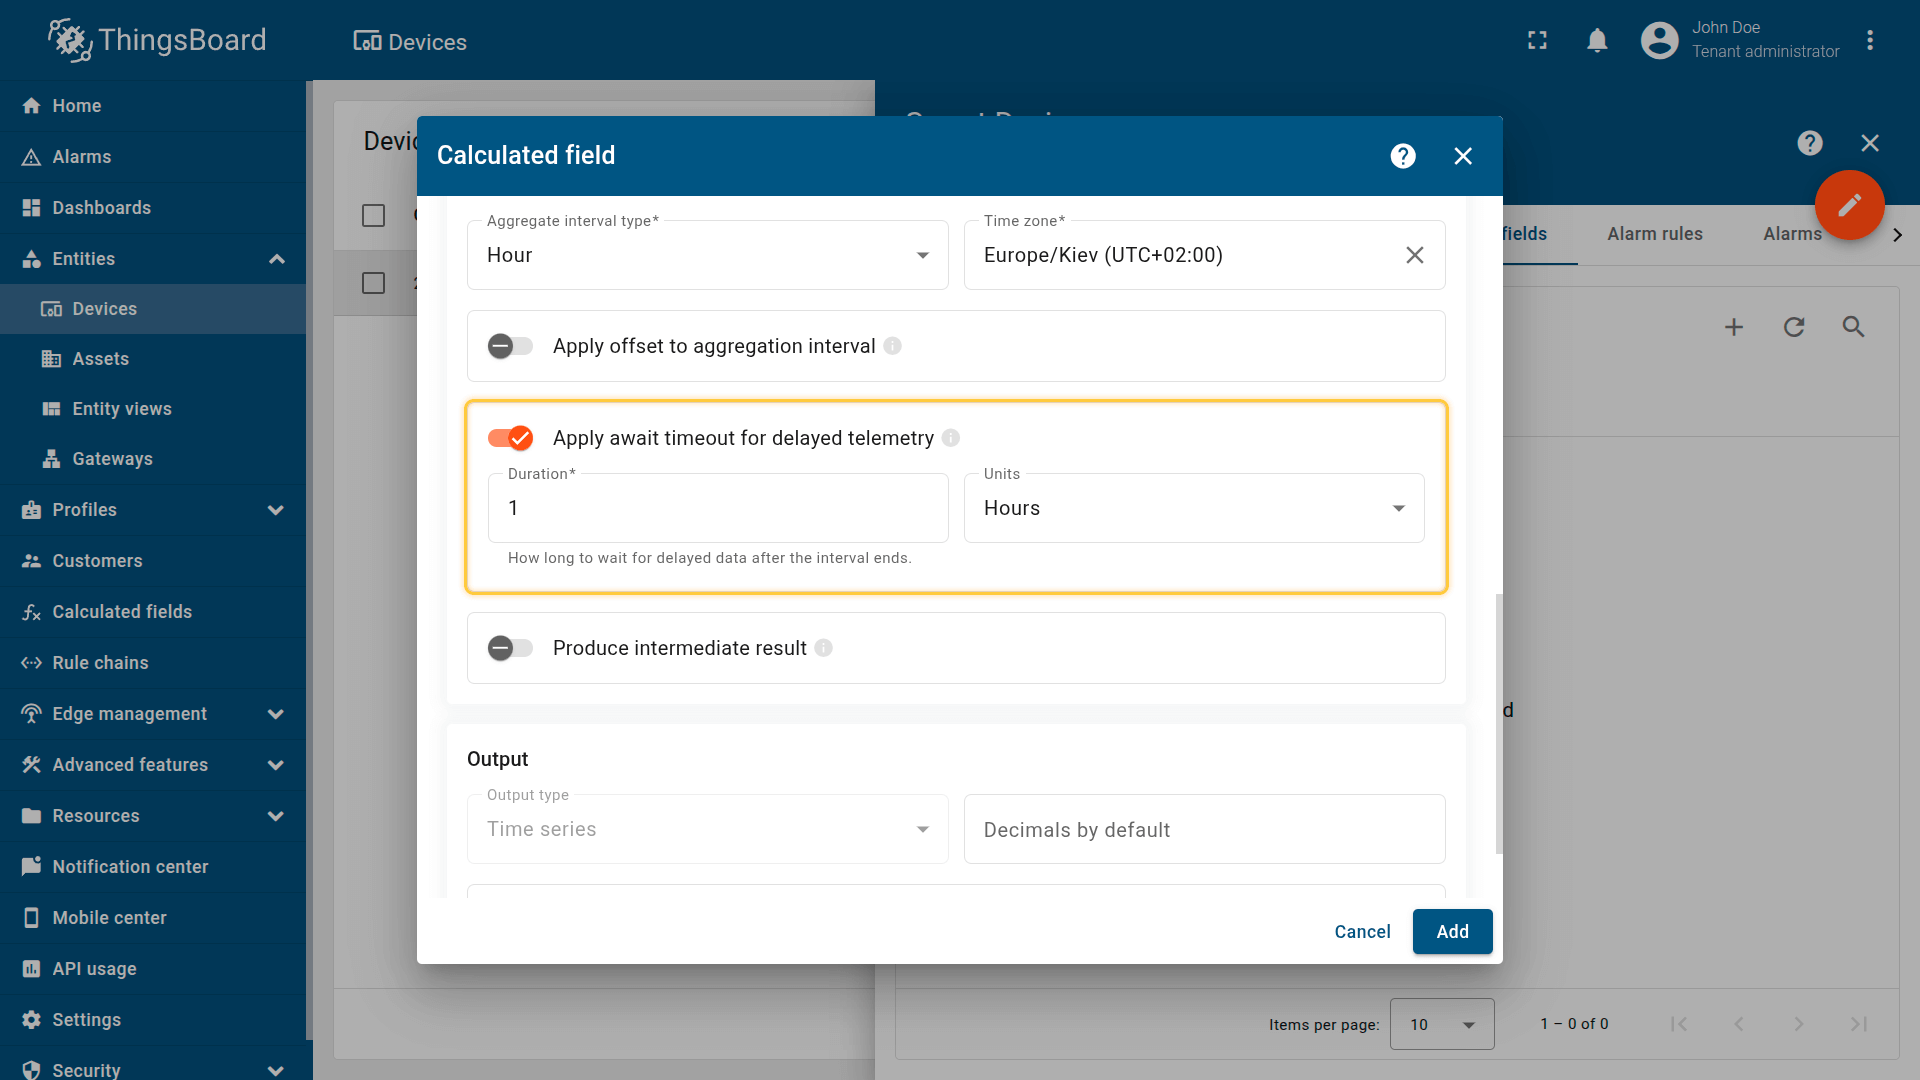
Defines how long the system waits for late telemetry after an interval ends.
Produce intermediate result
Calculates aggregates during the current (not yet finished) interval and stores intermediate values:
- updates occur no more often than once every 5 minutes
- useful for dashboards that need “current interval” values (e.g., “current hourly average so far”)
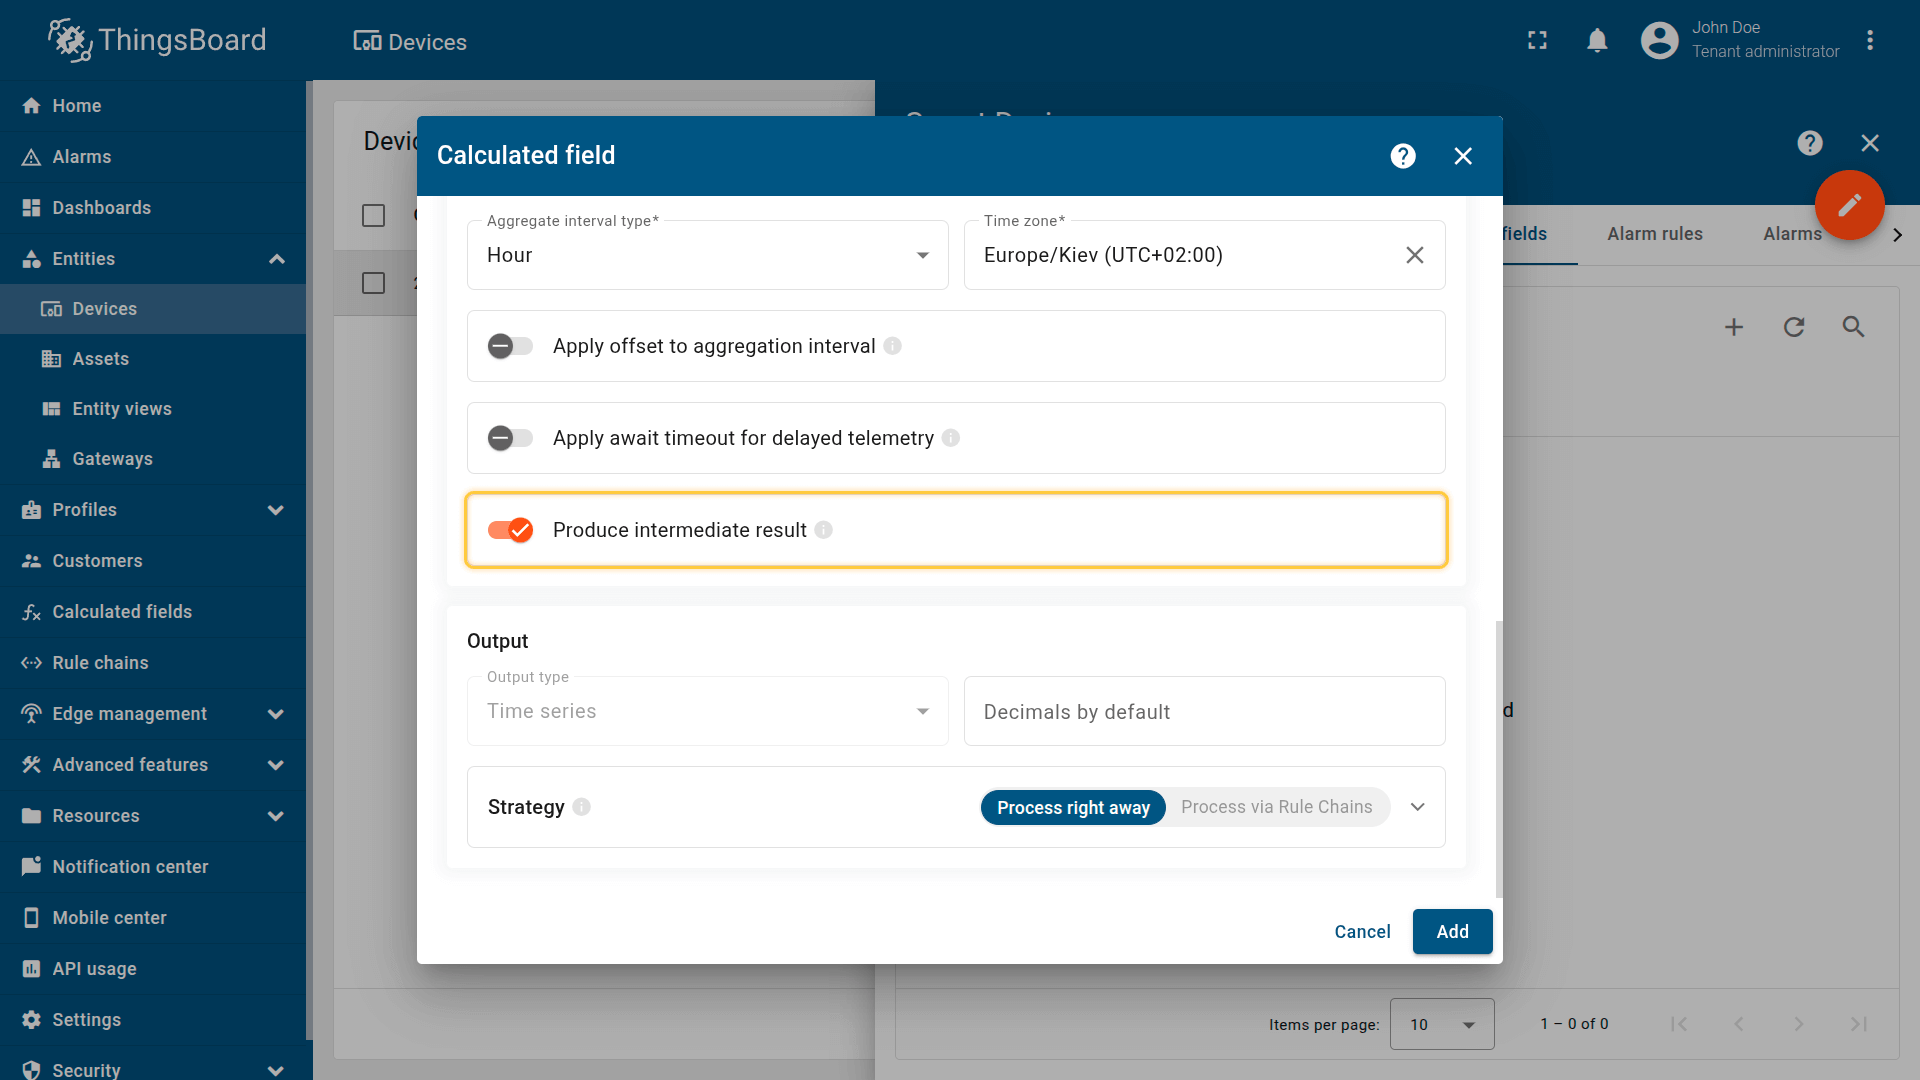
Calculates aggregates during the current (not yet finished) interval and stores intermediate values.
Output
Aggregated values are stored as telemetry on the current entity under the configured Metric names (output keys).
This calculated field stores results only as time series.
For more details about output processing strategies, see the Output section.
Example: Hourly energy KPIs
Scenario
An Energy Meter device installed in Building A continuously publishes historical telemetry values such as:
- power (kW) — current power usage
- energy (kWh) — total consumption counter
Goal
Compute hourly aggregates from historical telemetry and store them as new time series keys on the Energy Meter device:
- energyHourlySum — total energy consumption per hour (sum)
- powerHourlyAvg — average power per hour (avg)
- powerHourlyMax — maximum power per hour (max)
This produces reporting-ready KPIs and reduces dashboard/API load by storing pre-aggregated metrics instead of computing them on the fly.
Calculated field configuration
Download the “Time series data aggregation” calculated field configuration file (JSON).
Configuration steps
1. Import demo devices
Import a device that publishes power and energy telemetry.
- Download the CSV file: energy-meter-with-telemetry.csv
- Go to the Devices and import the CSV file.
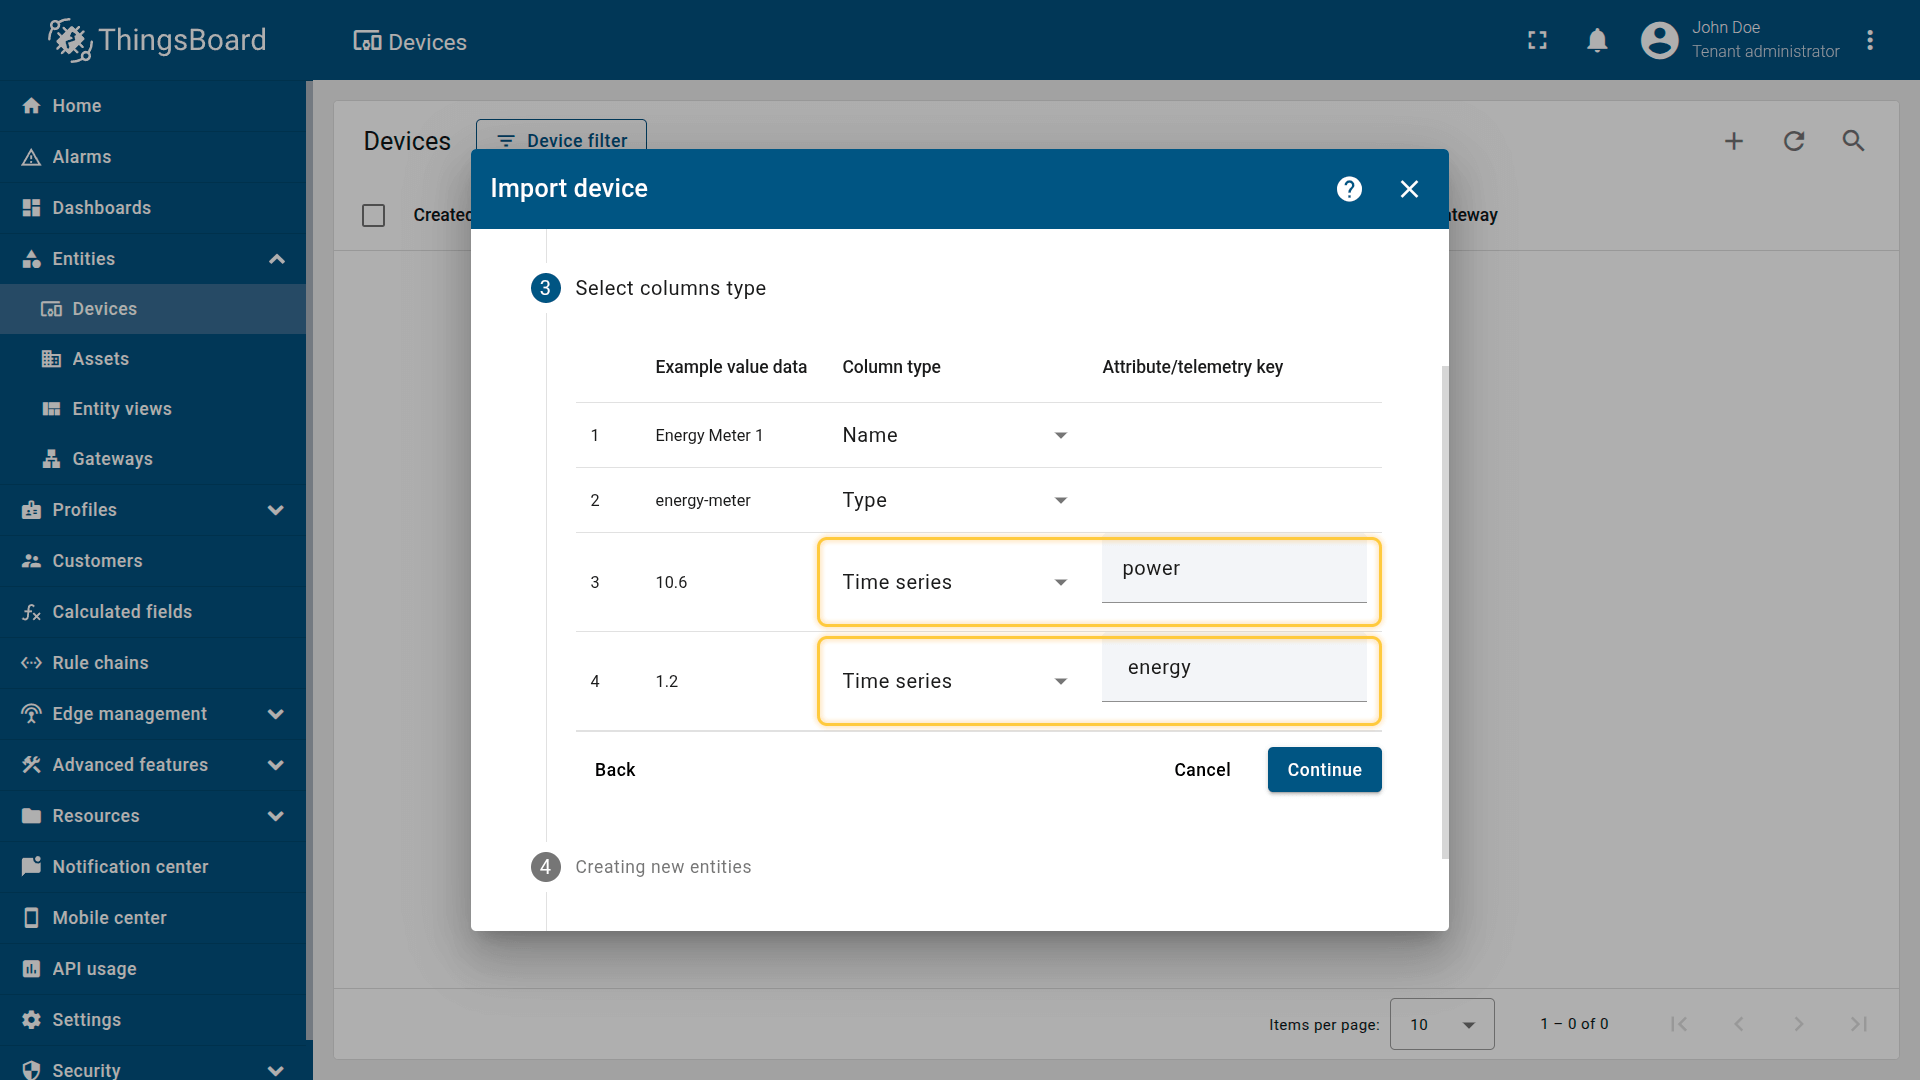
CSV includes:
- Name: Energy Meter 1
- Type: energy-meter
- Time series: power, energy
Important note about the CSV: the column type for the power and energy keys must be set to “Time series”.
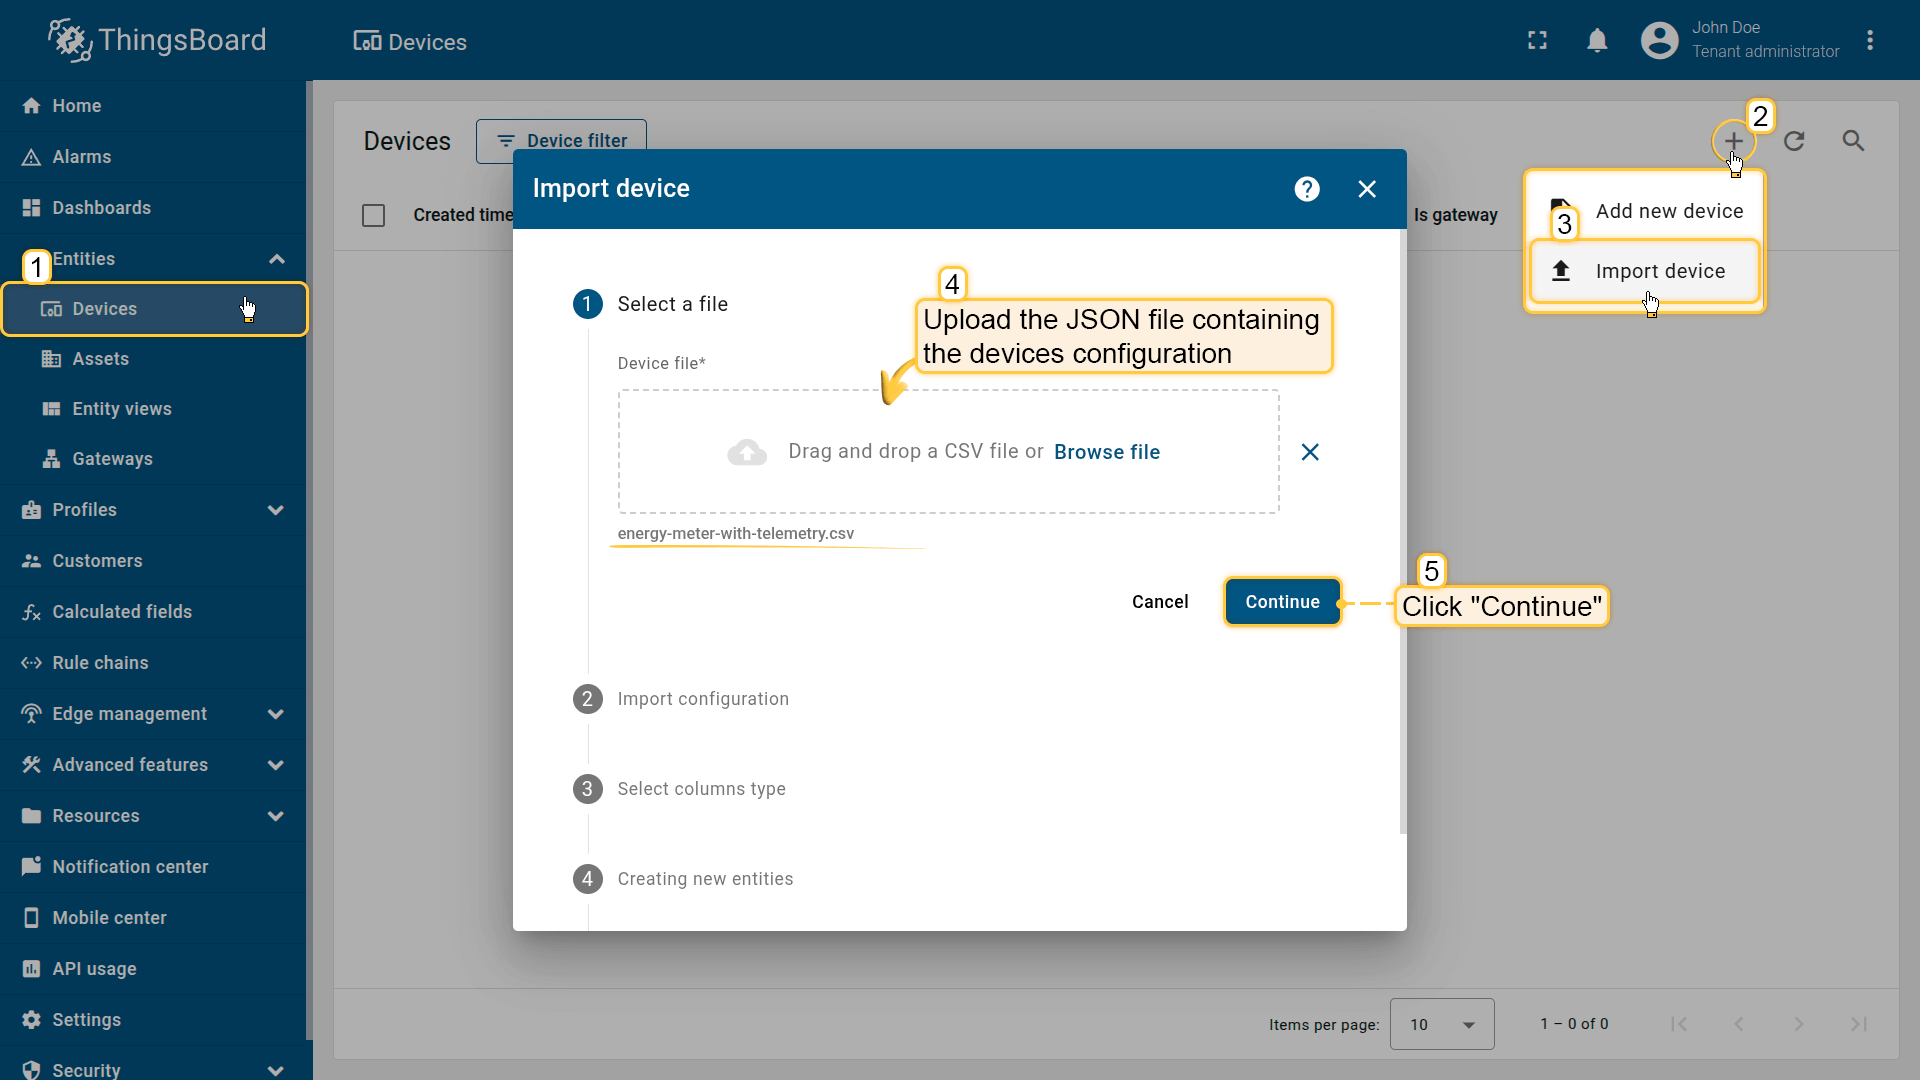
Go to the Devices and import device configurations from a CSV file.
Name: Energy Meter 1
Type: energy-meter
Time series: power, energy
The imported device that publishes power and energy telemetry.
Note: make sure the device already has historical telemetry for at least 1–2 hours, otherwise the first aggregation interval may use default values.
2. Apply the calculated field to the device
Apply the Time series data aggregation calculated field to the Energy Meter 1 device.
- Download the calculated field configuration file.
- Go to the Calculated fields tab and import the configuration.
Ensure the calculated field is configured as:
- Type: Time series data aggregation
- Arguments (Current entity only):
- power → argument name power
- energy → argument name energy
- Metrics:
- powerHourlyAvg → Average of power
- powerHourlyMax → Max of power
- energyHourlySum → Sum of energy
- Aggregation interval: Hour
- Time zone: your reporting time zone (recommended: local time zone)
(Optional) Enable Debug mode and review execution events using the Events icon.
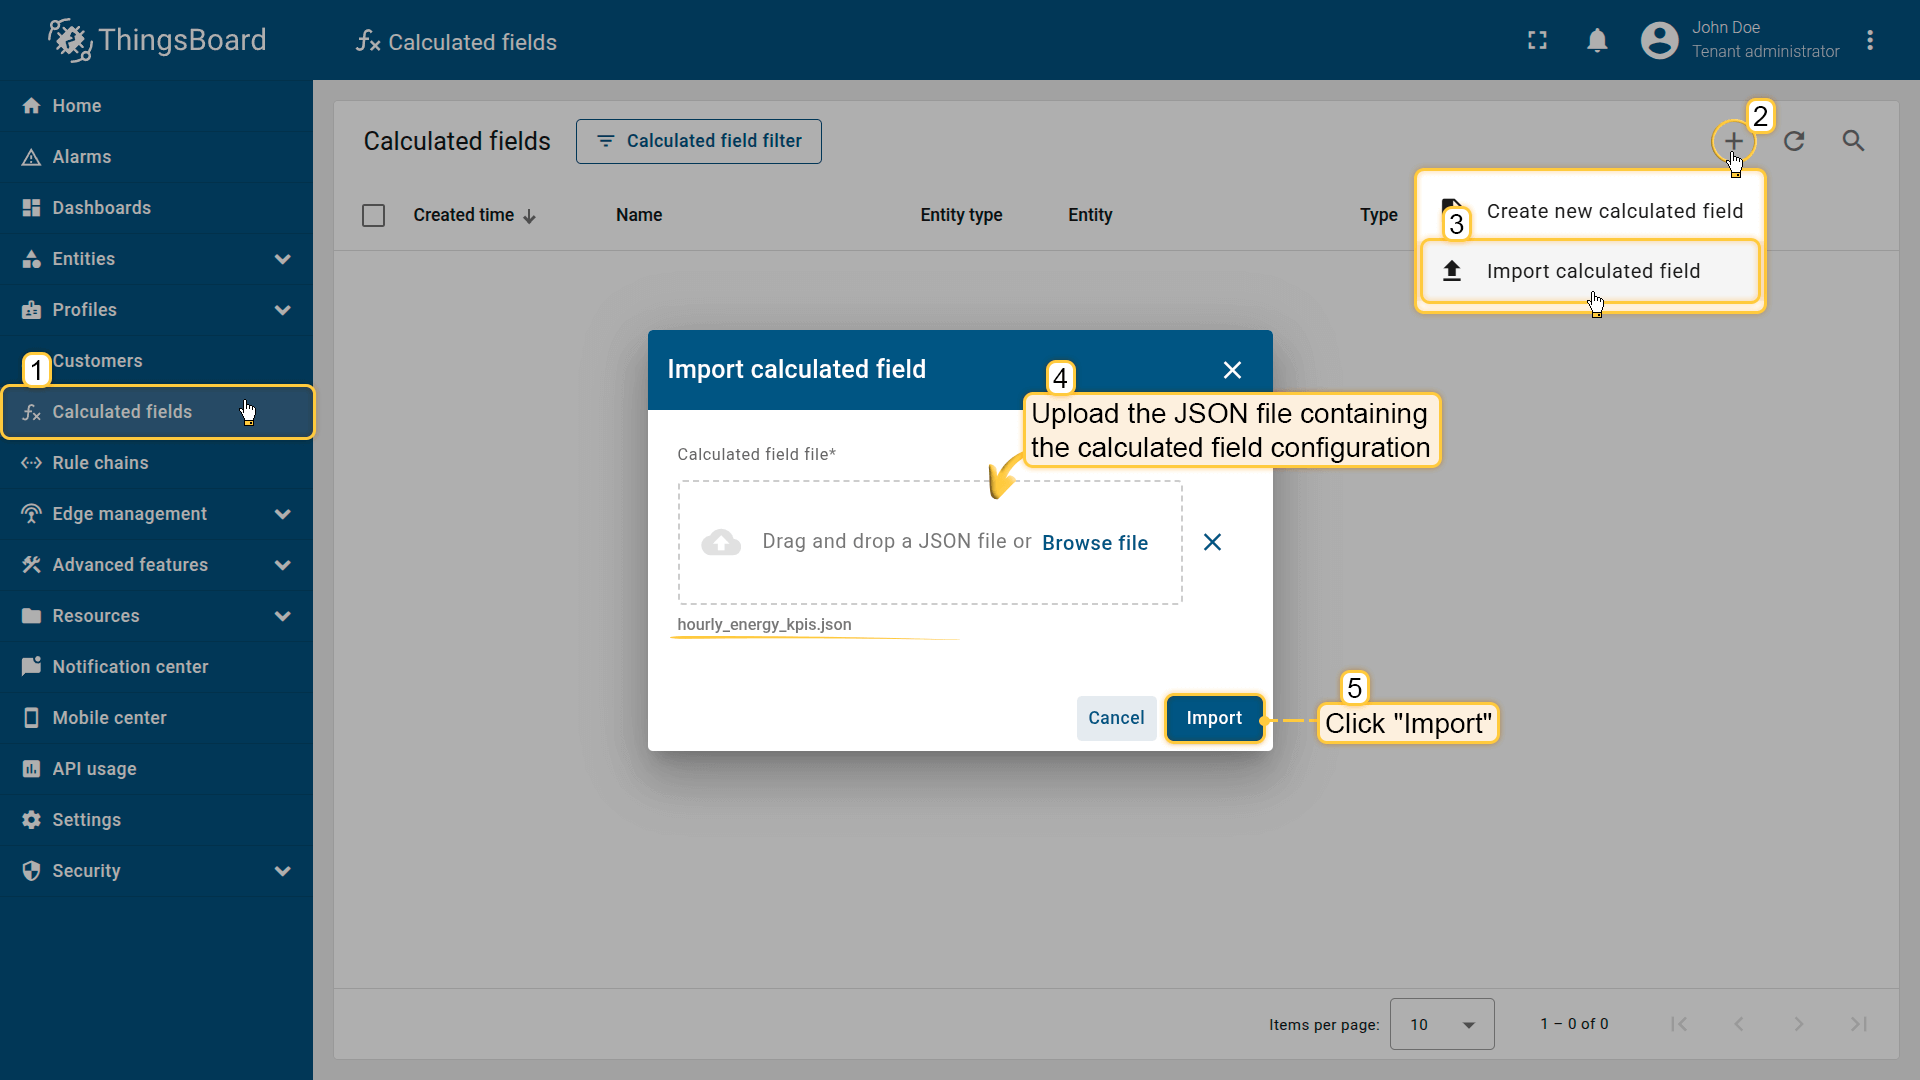
Go to the Calculated fields tab and import the calculated field configuration.
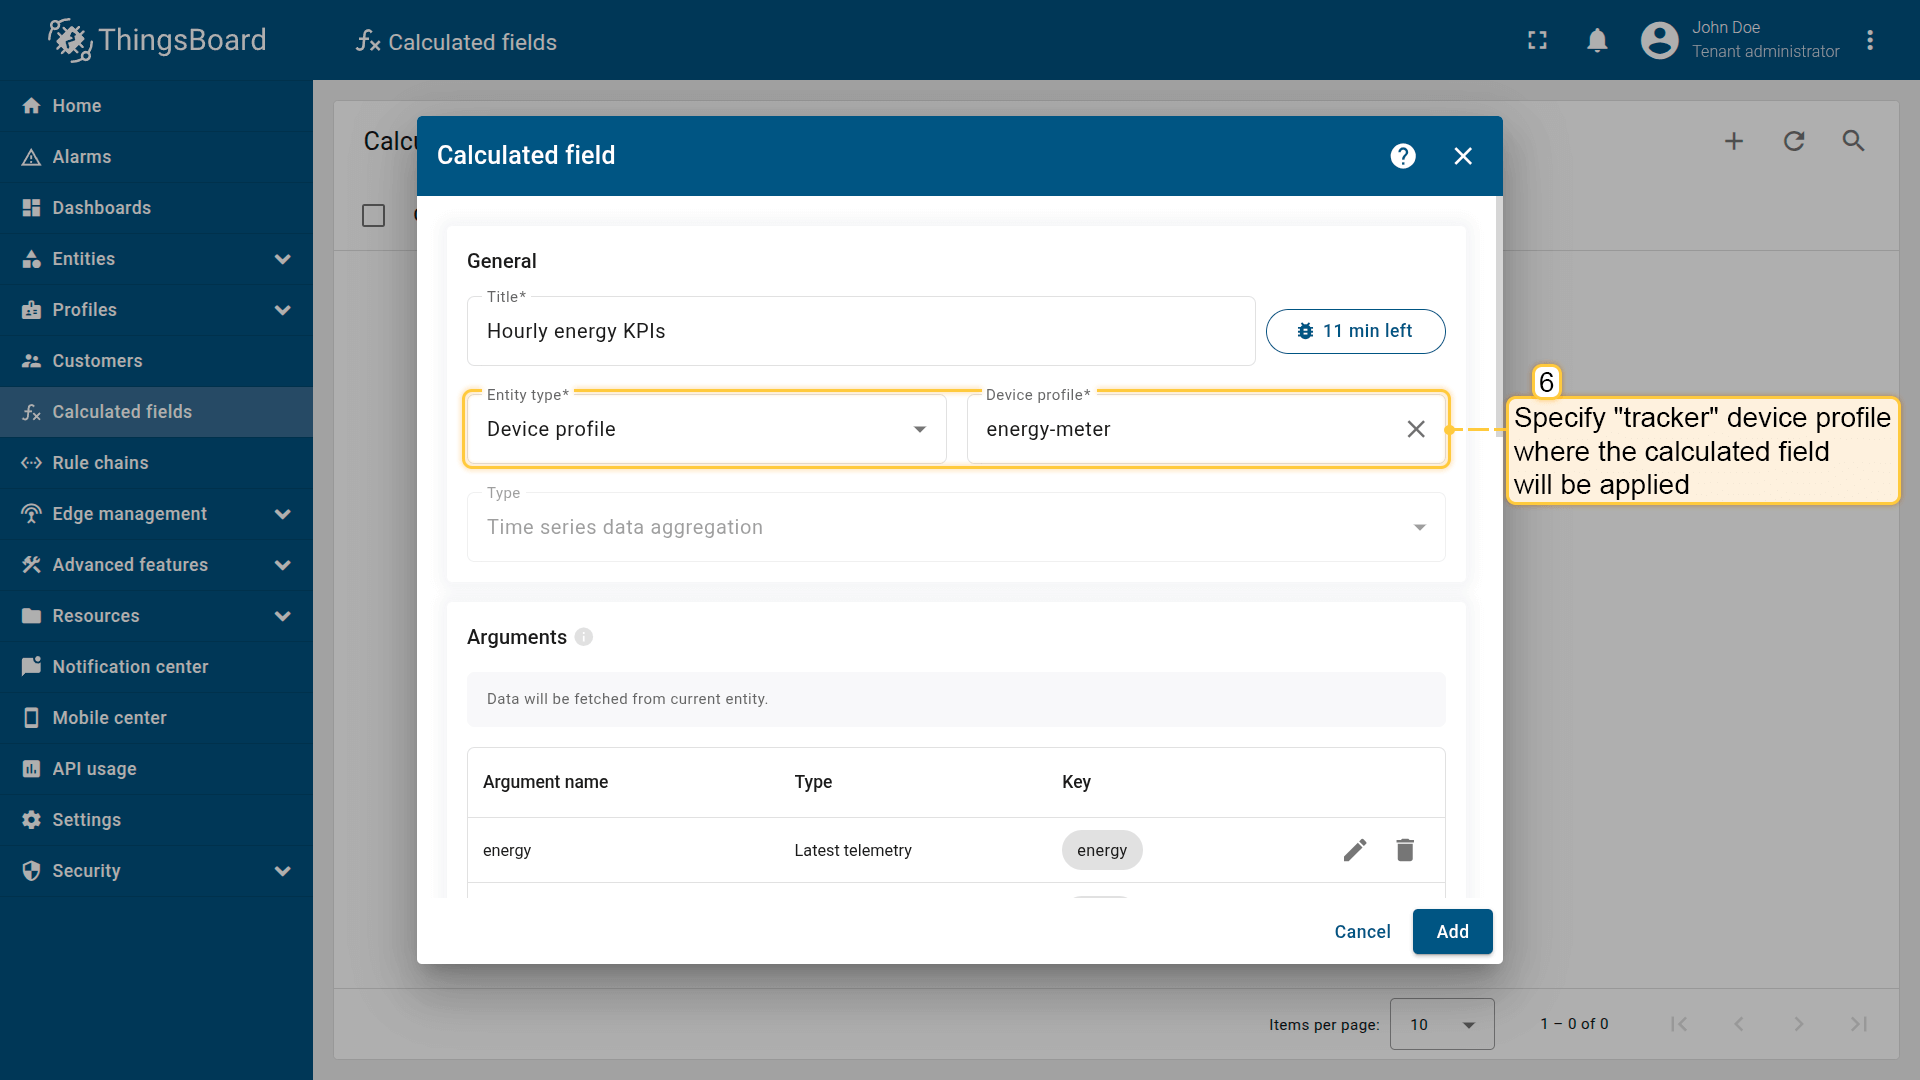
Apply the calculated field to the energy-meter device profile.

First argument settings:
- Time series key: energy
- Argument name: energy.
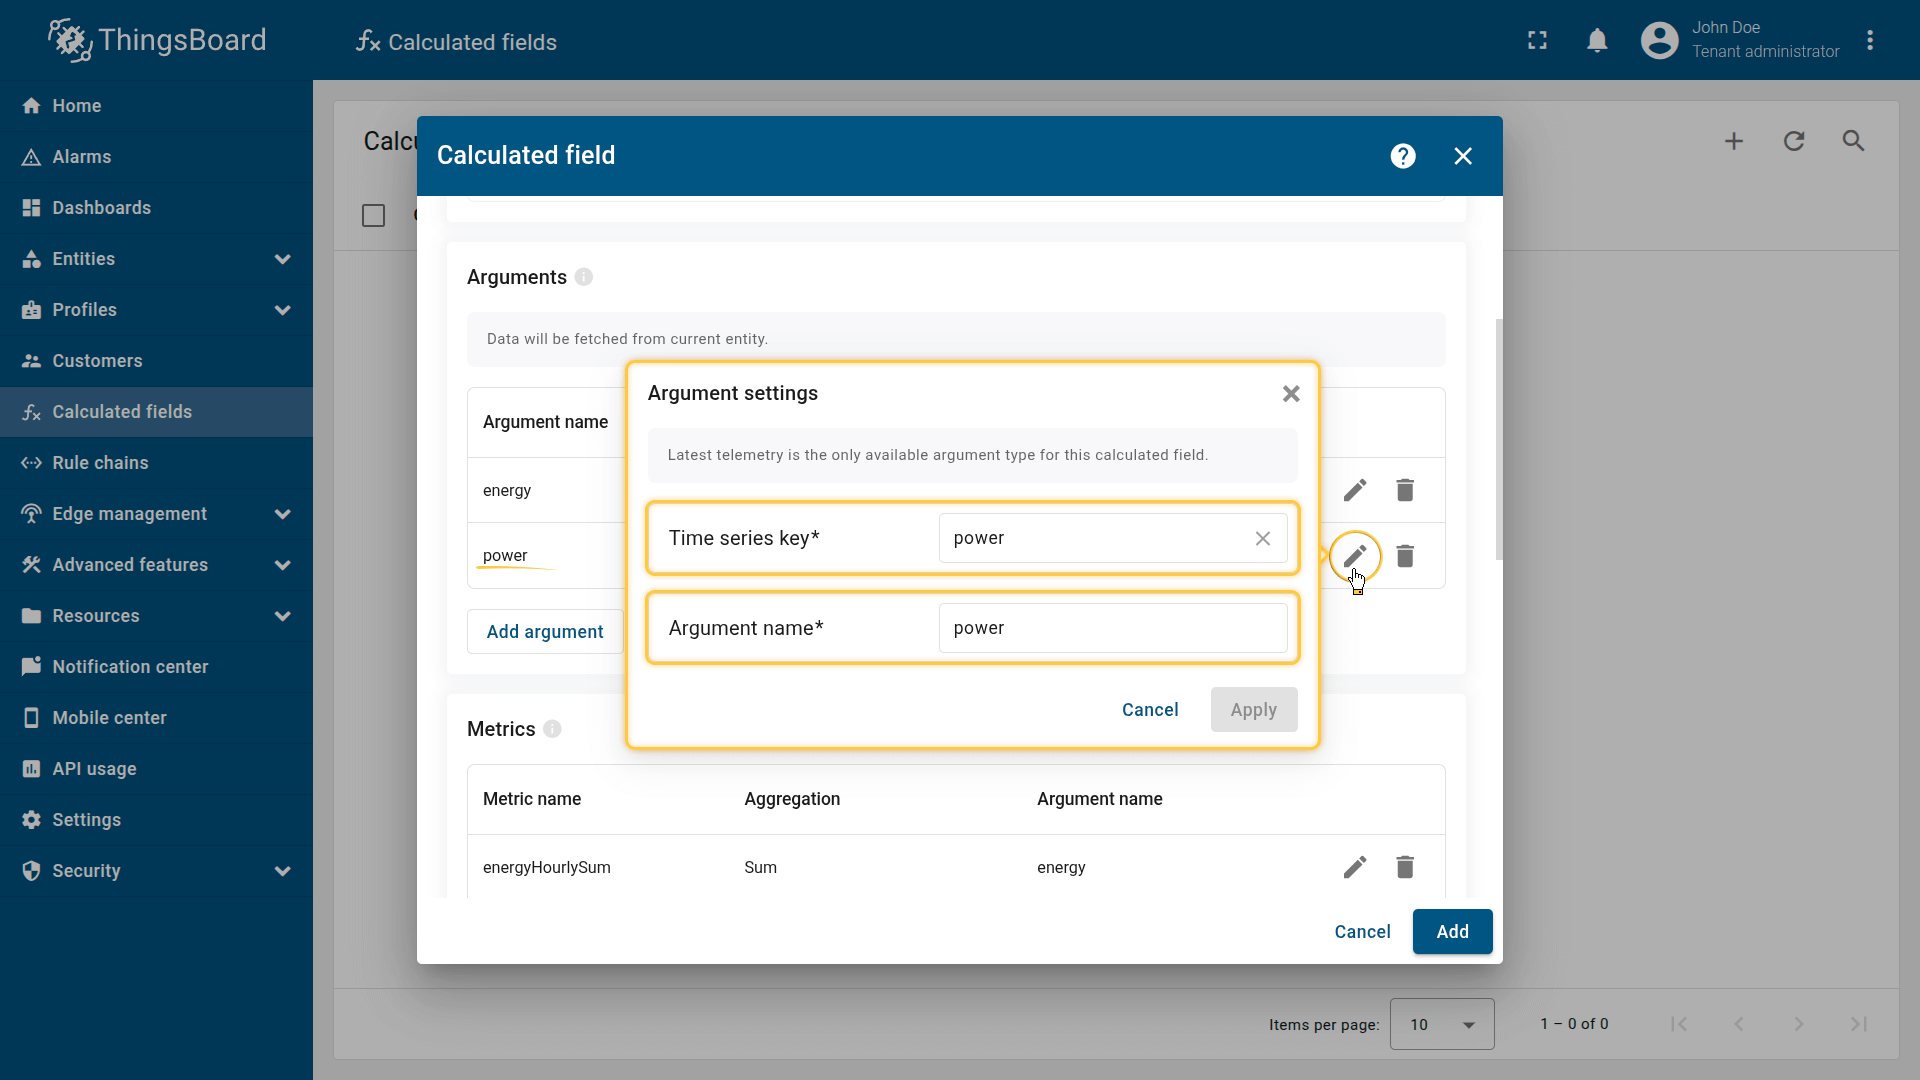
Second argument settings:
- Time series key: power
- Argument name: power.

First metric settings:
- Metric name: energyHourlySum
- Aggregation: Sum
- Argument name: energy.
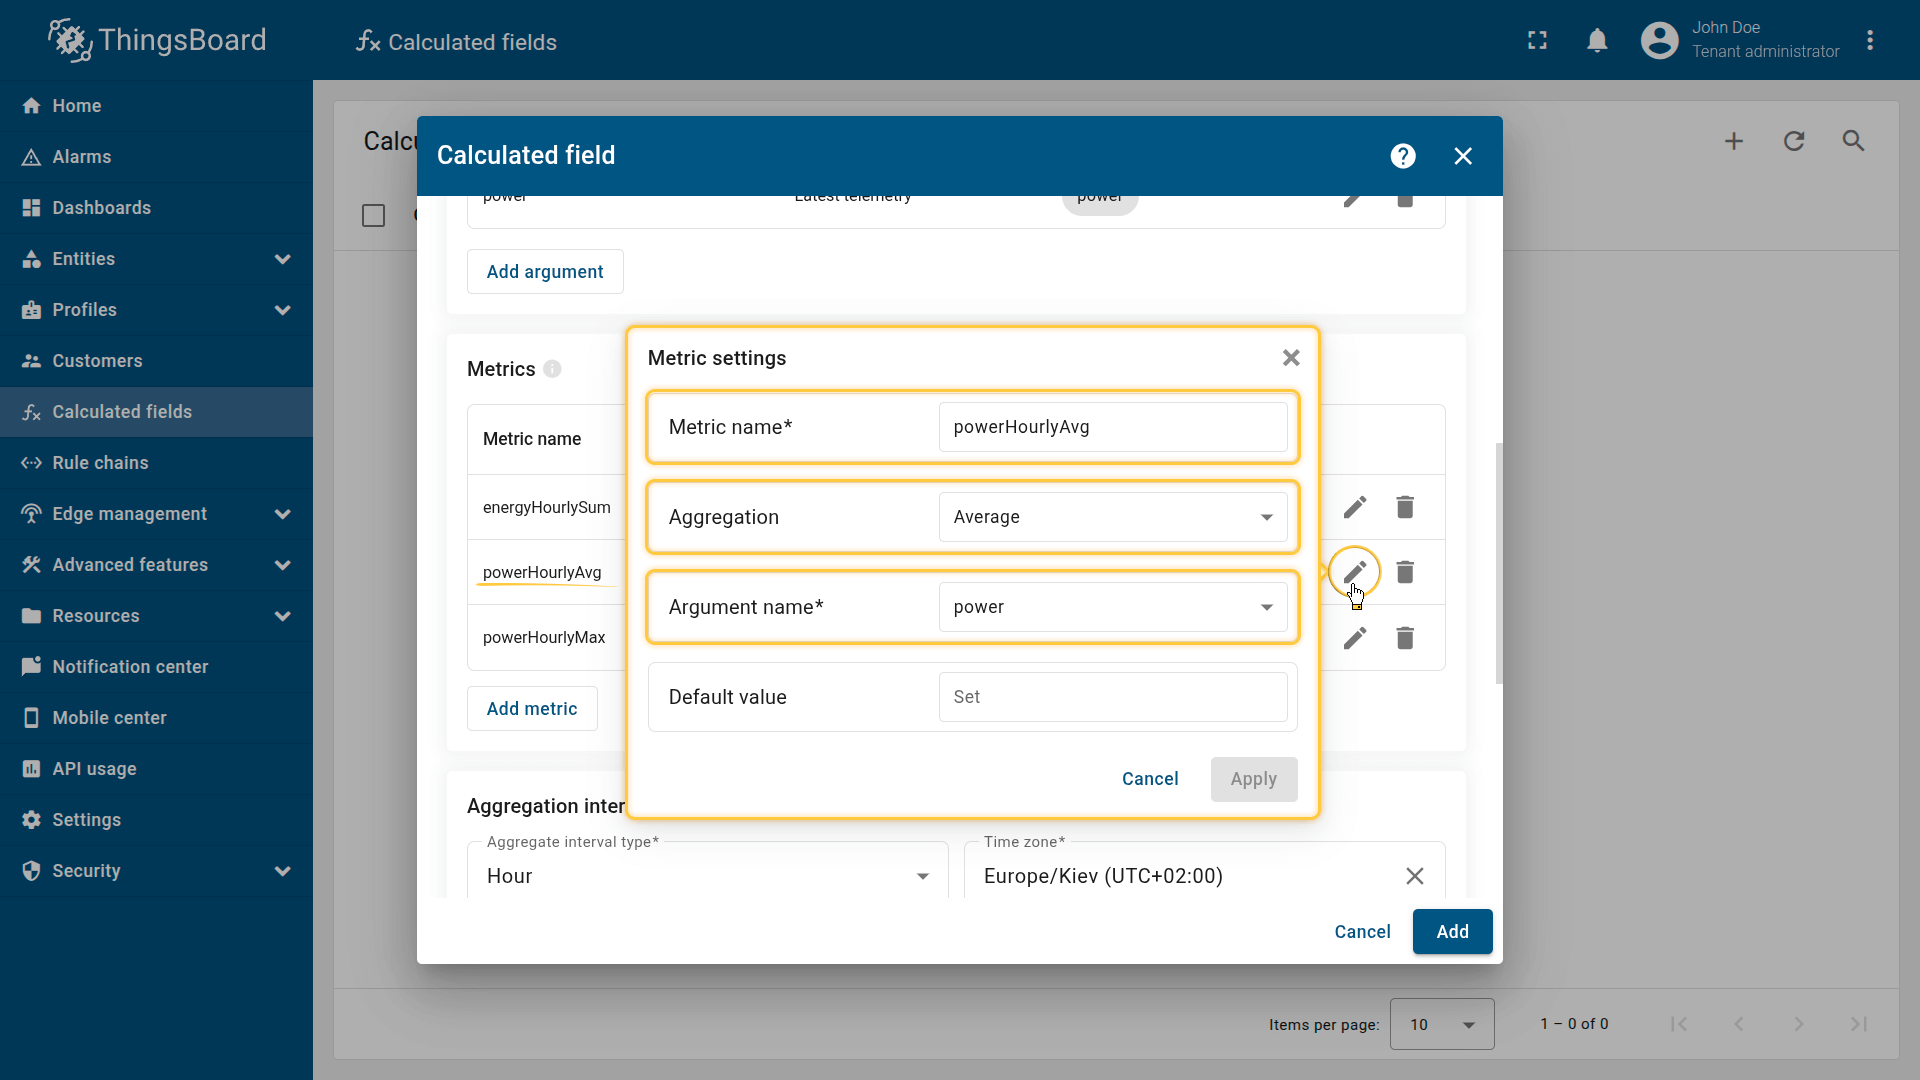
Second metric settings:
- Metric name: powerHourlyAvg
- Aggregation: Average
- Argument name: power.
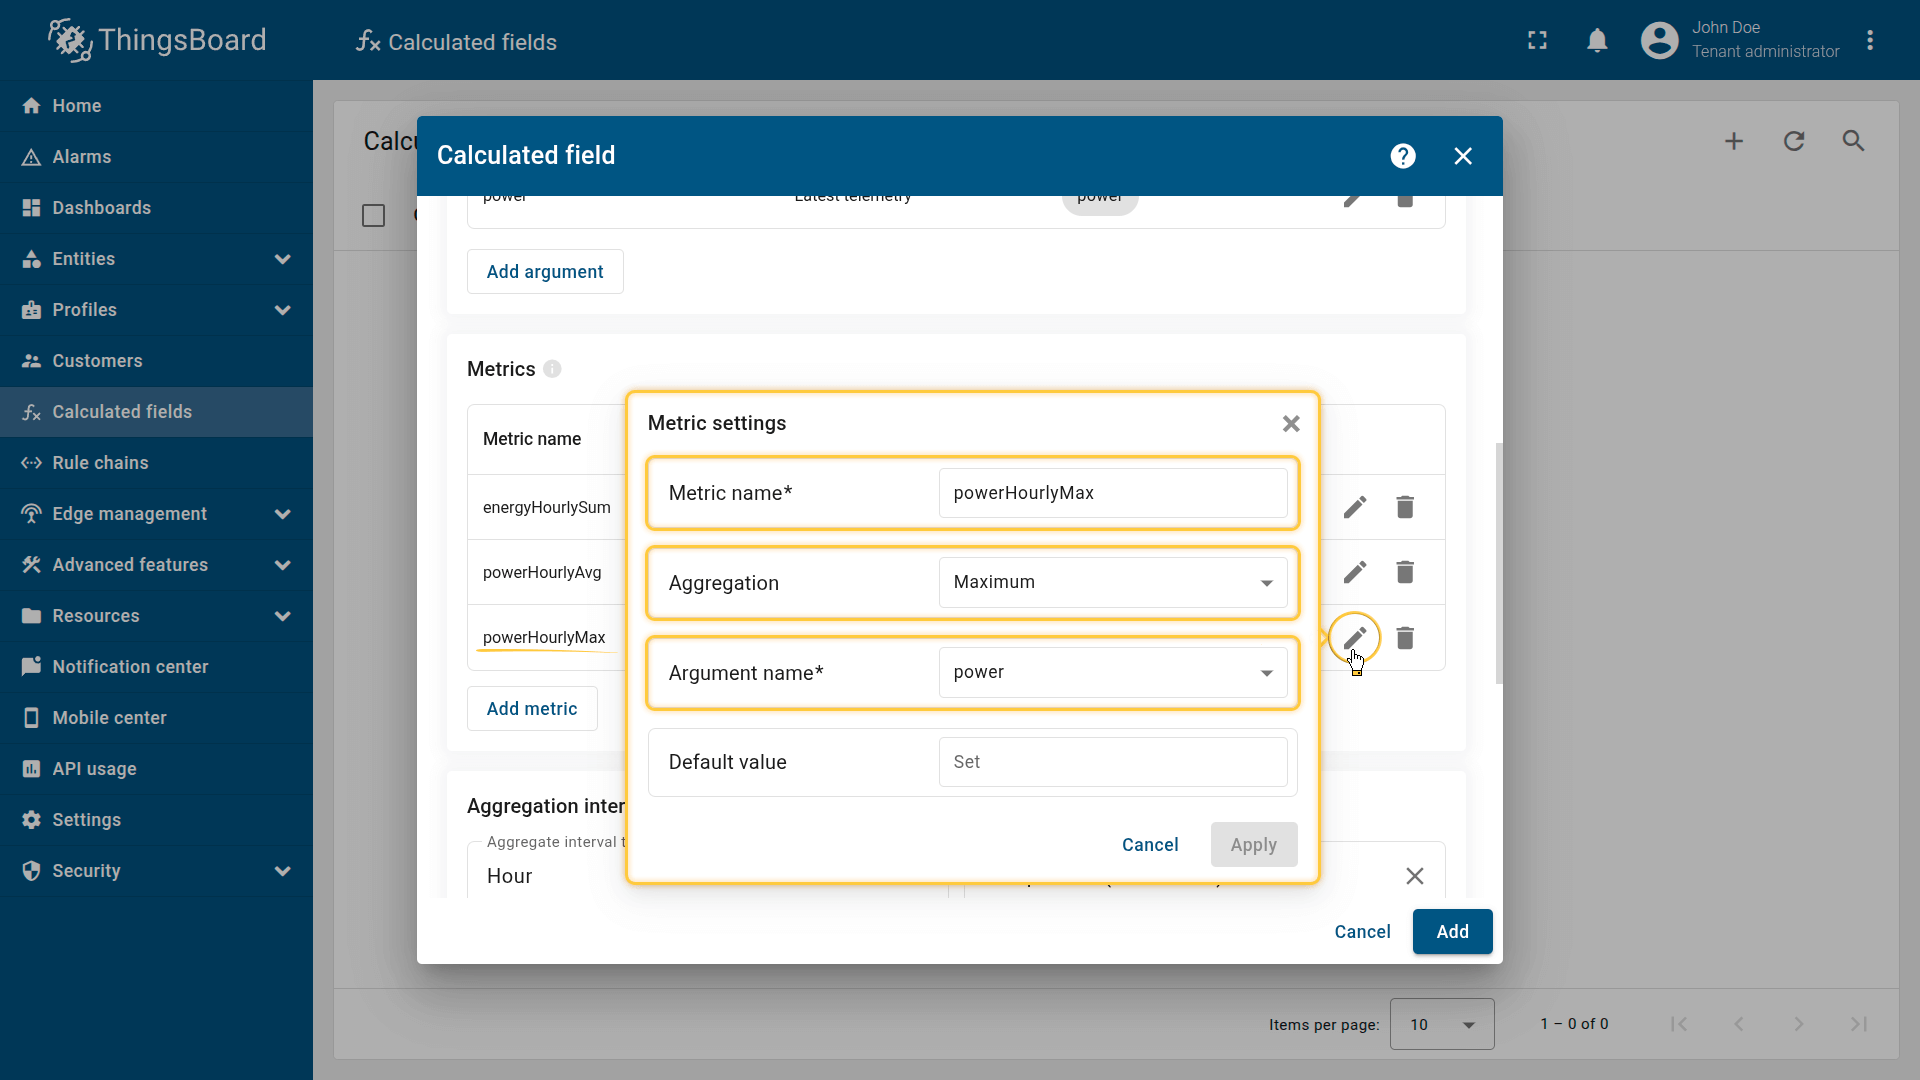
Third metric settings:
- Metric name: powerHourlyMax
- Aggregation: Maximum
- Argument name: power.
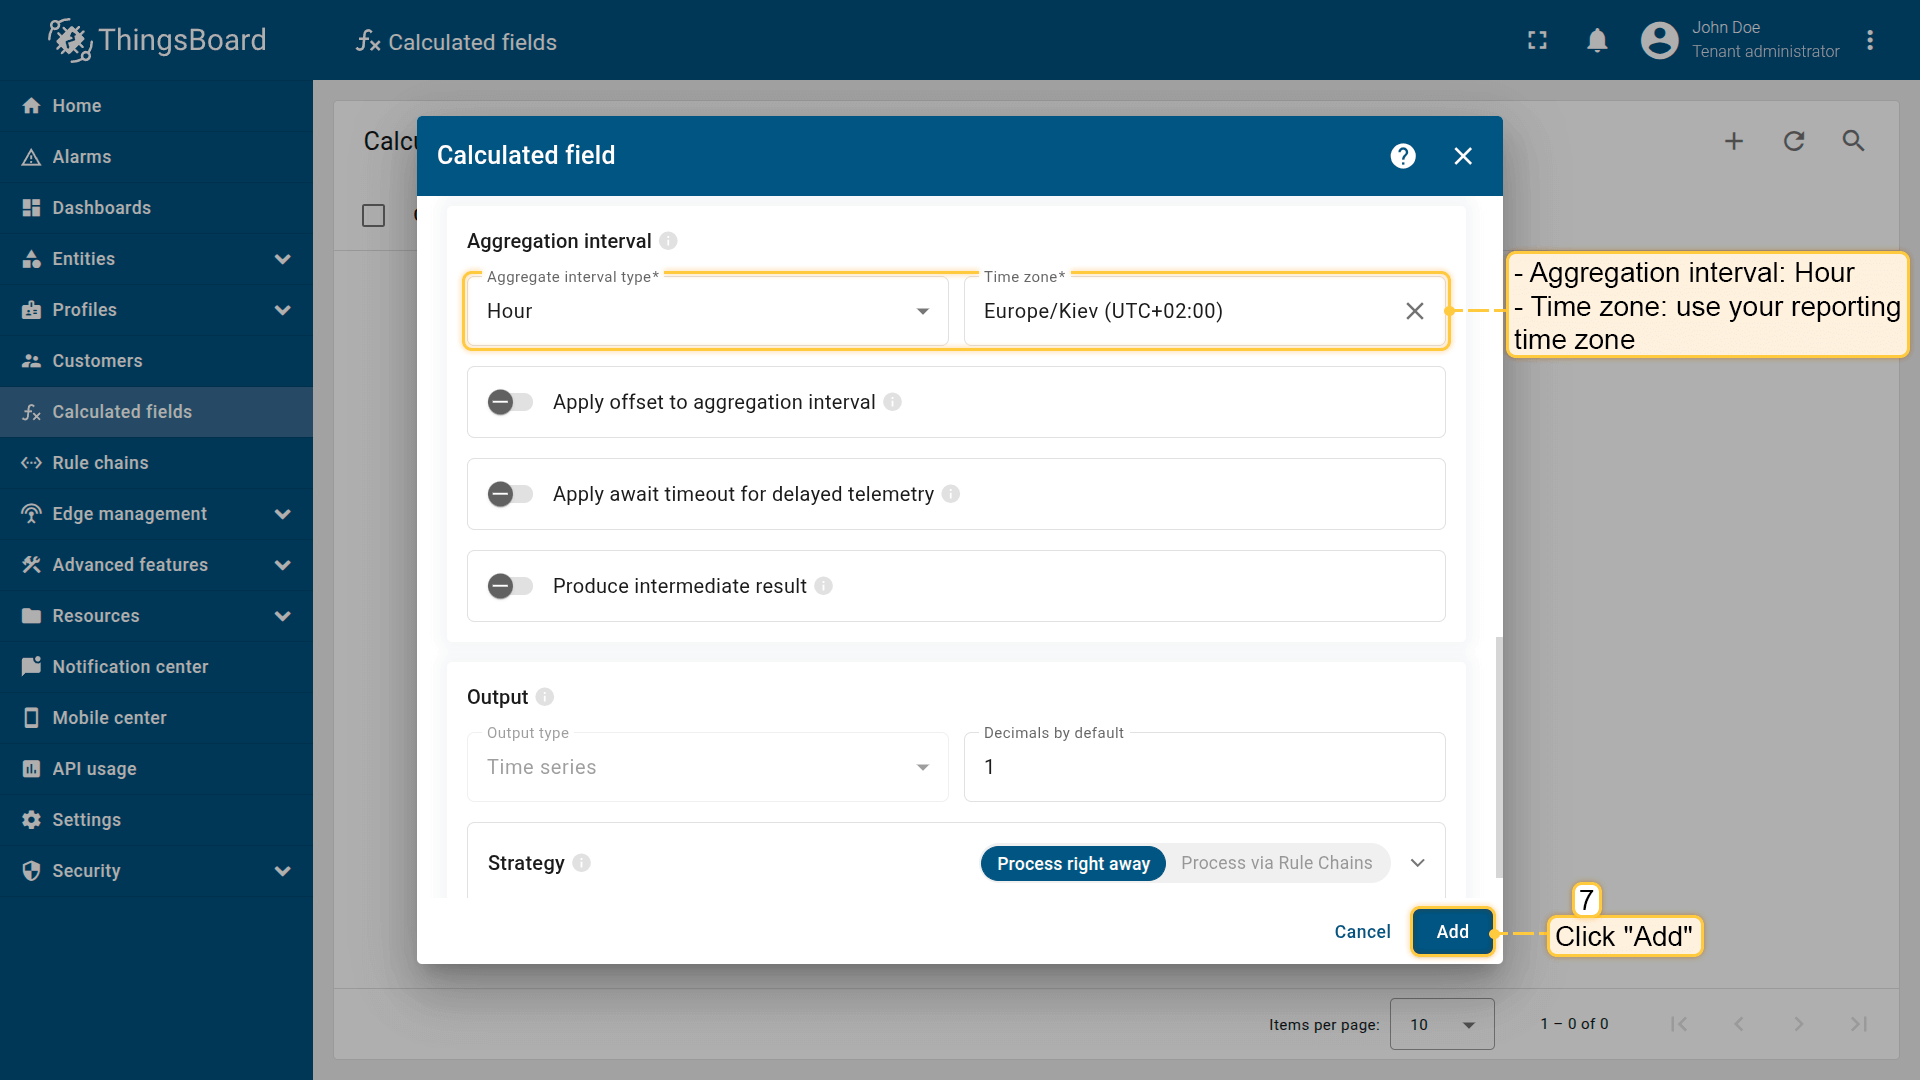
Aggregation interval: Hour; Time zone: use your reporting time zone.
The computed values are stored as telemetry (time series) keys.
Click Add to save the calculation field.
Result
New values will be calculated at the beginning of the next hour (in my case, at 13:00).
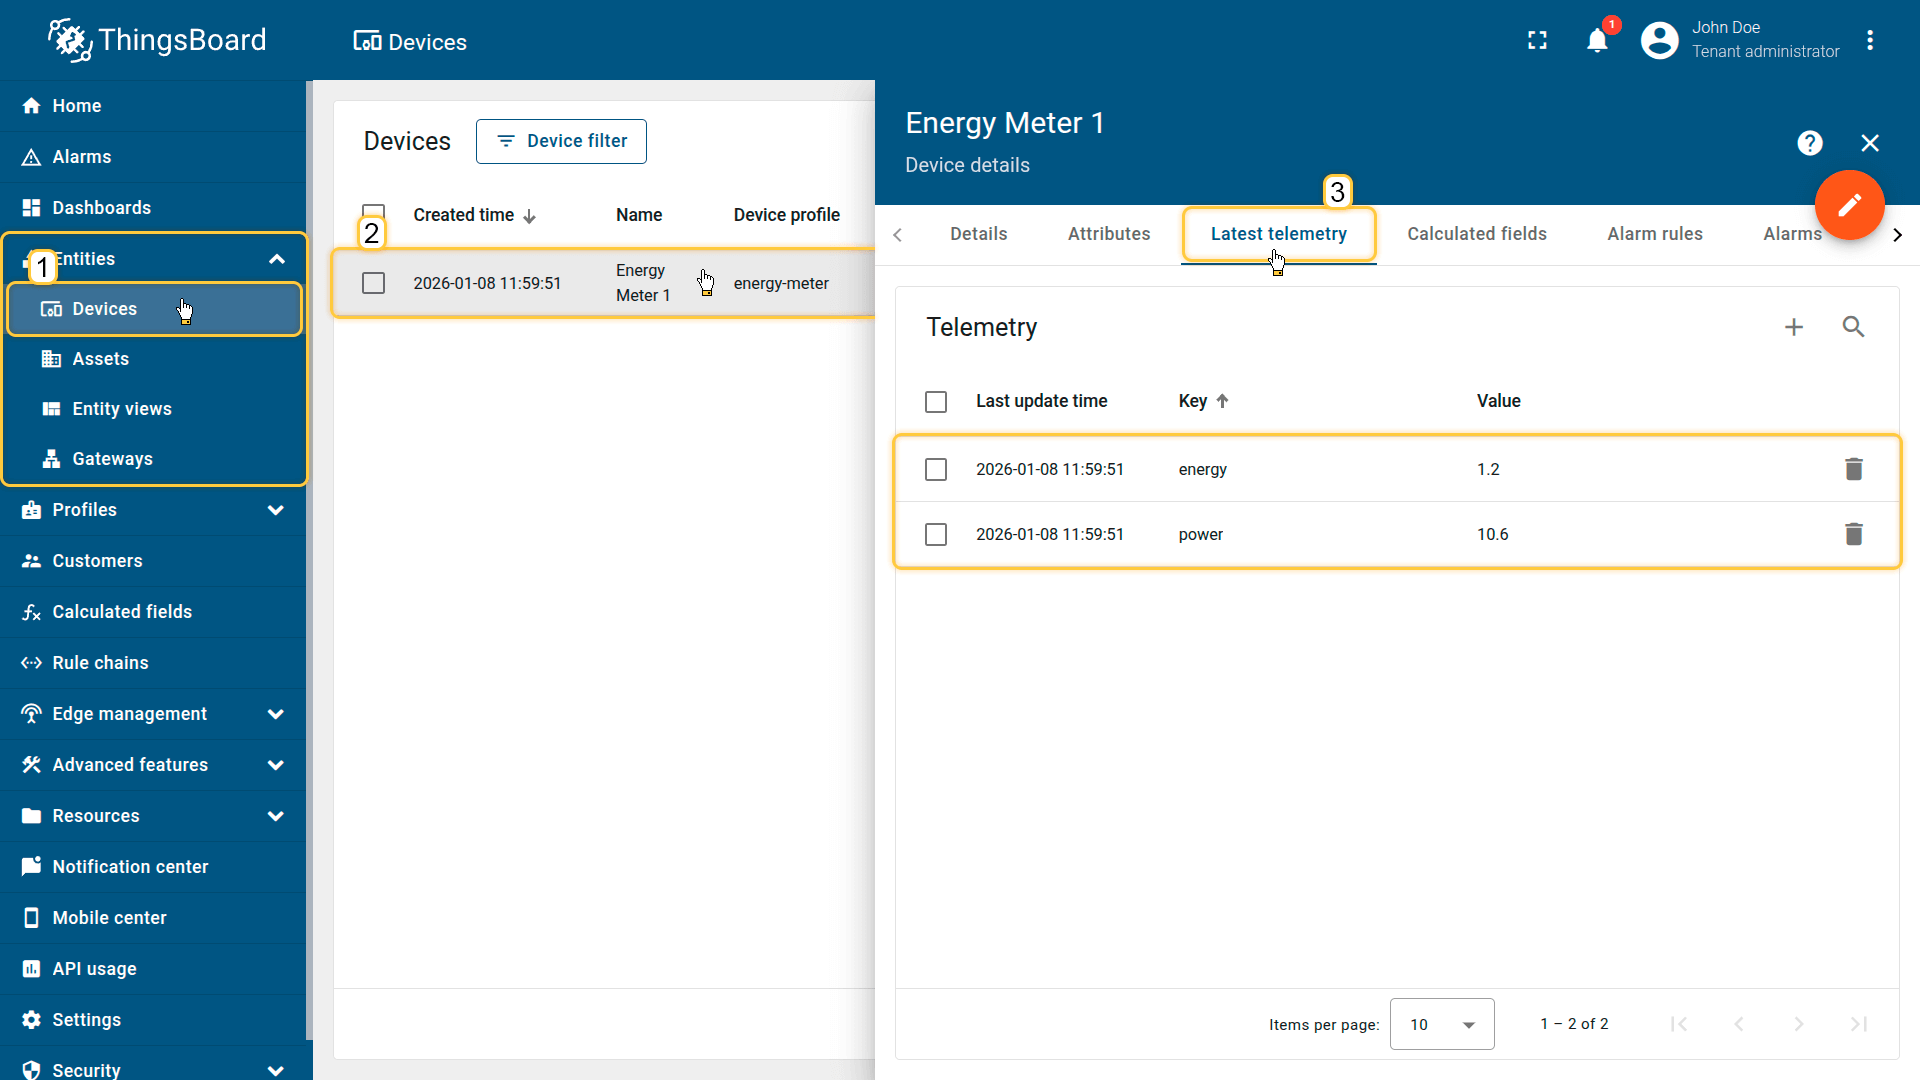
On the Energy Meter 1 device, the aggregated values are stored as telemetry (time series) keys:
- powerHourlyAvg — hourly average power usage
- powerHourlyMax — hourly peak power usage
- energyHourlySum — hourly energy consumption
Example output for one interval:
1
2
3
4
5
{
  "powerHourlyAvg": 12.4,
  "powerHourlyMax": 18.9,
  "energyHourlySum": 6.7
}
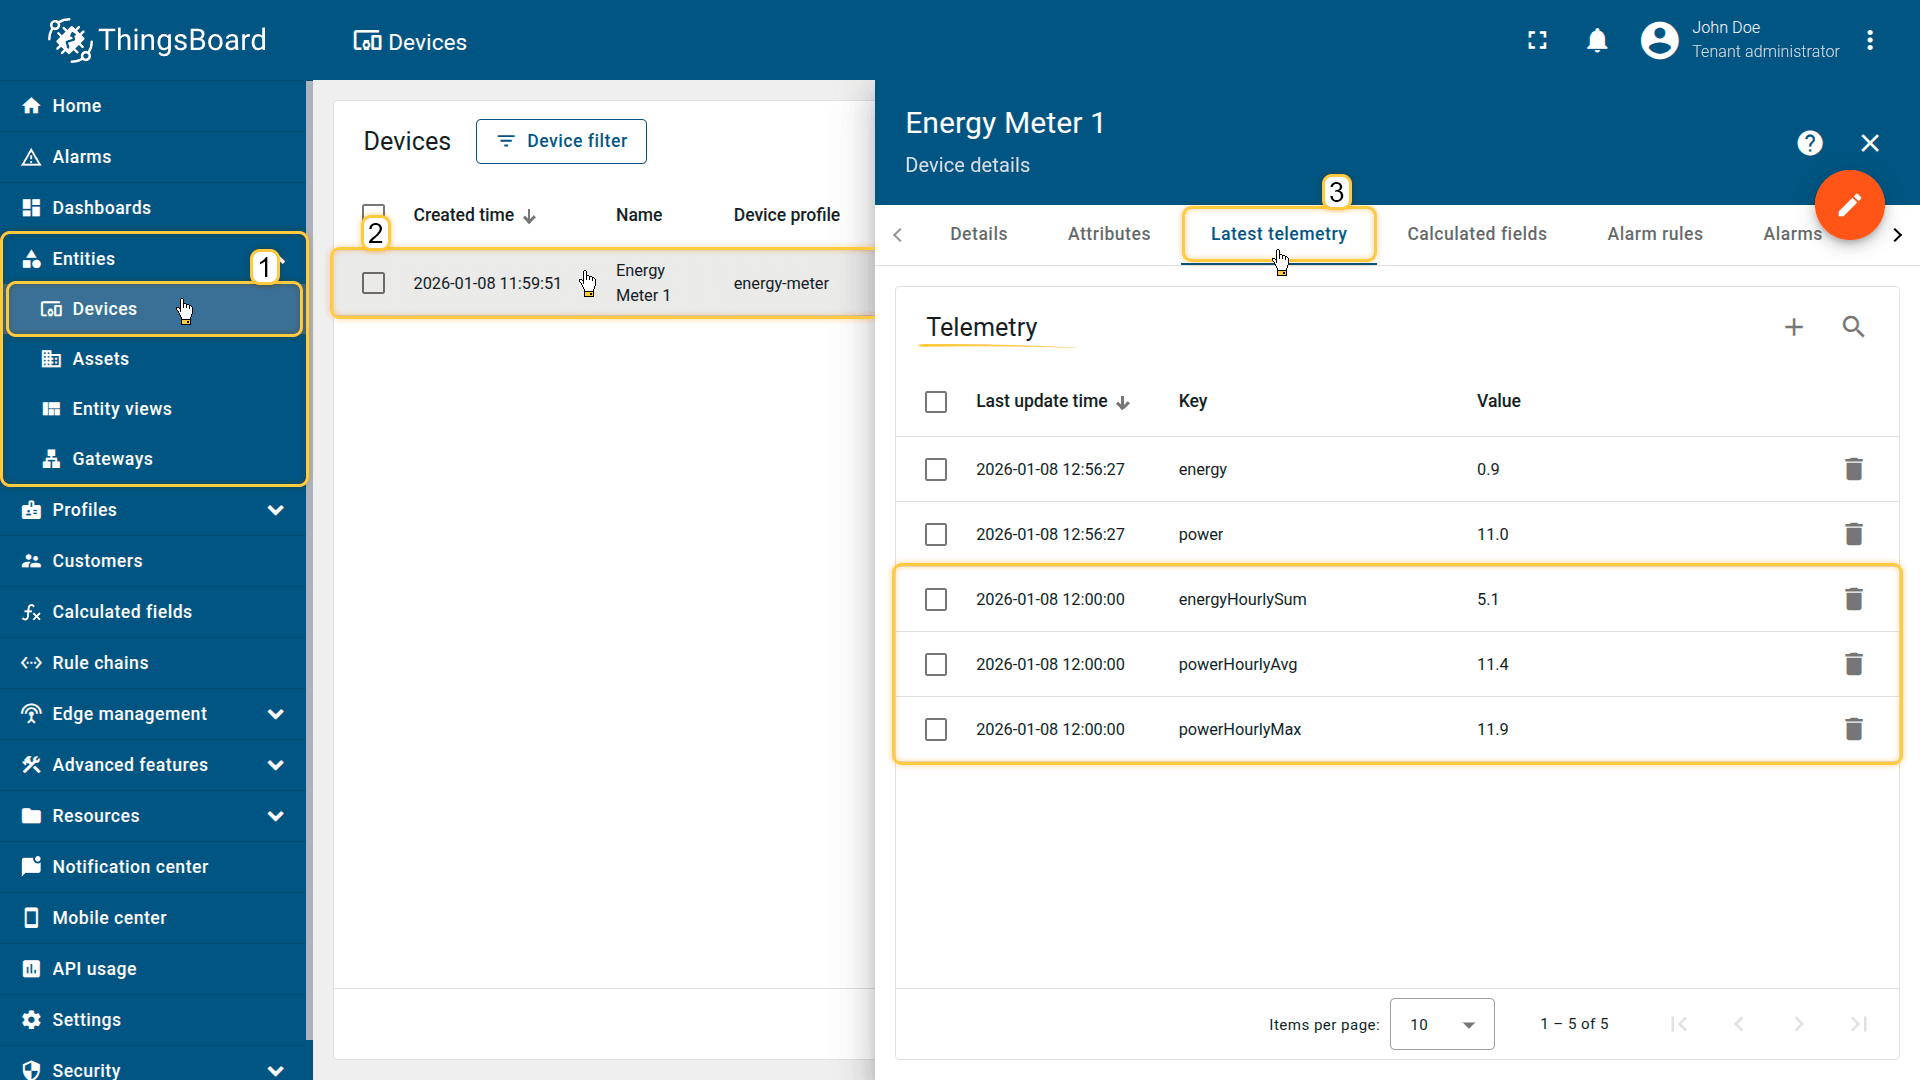
On the Energy Meter 1 device, the aggregated values are stored as telemetry (time series) keys:
- powerHourlyAvg— hourly average power usage
- powerHourlyMax —hourly peak power usage
- energyHourlySum — hourly energy consumption
Your feedback
Don't hesitate to star ThingsBoard on github to help us spread the word. If you have any questions about this sample, please contact us.