Average Temperature Across Related Devices
Use a Related Entities Aggregation calculated field to collect temperature readings from multiple sensors and store the average on a parent asset.
Use case
Section titled “Use case”Warehouse A contains two thermometer sensors. Each reports a temperature telemetry key.
ThingsBoard:
- finds all devices related to Warehouse A via Contains relations
- averages the latest
temperaturereading from each sensor - stores the result as
avgTemperatureon Warehouse A
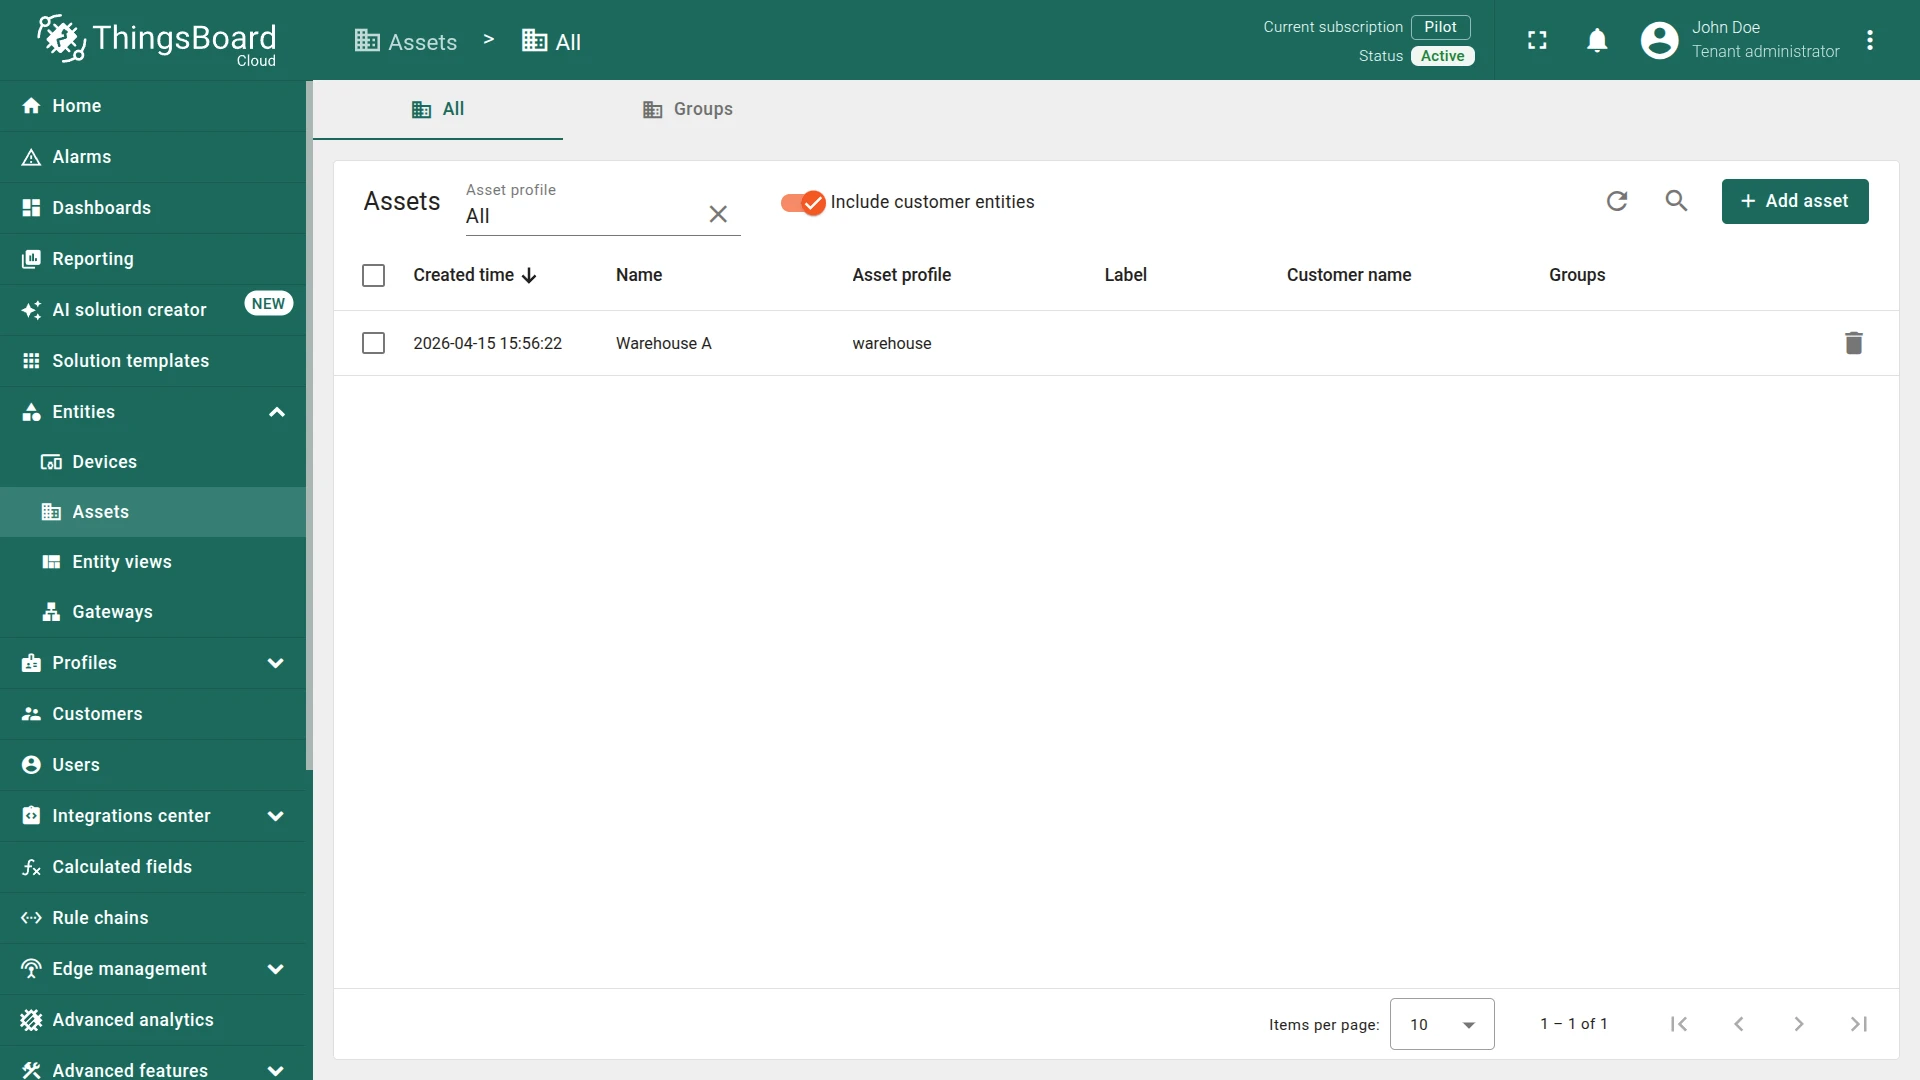
Step 1. Create devices and asset
Section titled “Step 1. Create devices and asset”Create an asset to represent the warehouse:
- Name:
Warehouse A - Asset profile:
warehouse
Create two devices with the thermometer device profile:
- Name:
Sensor A1 - Name:
Sensor A2

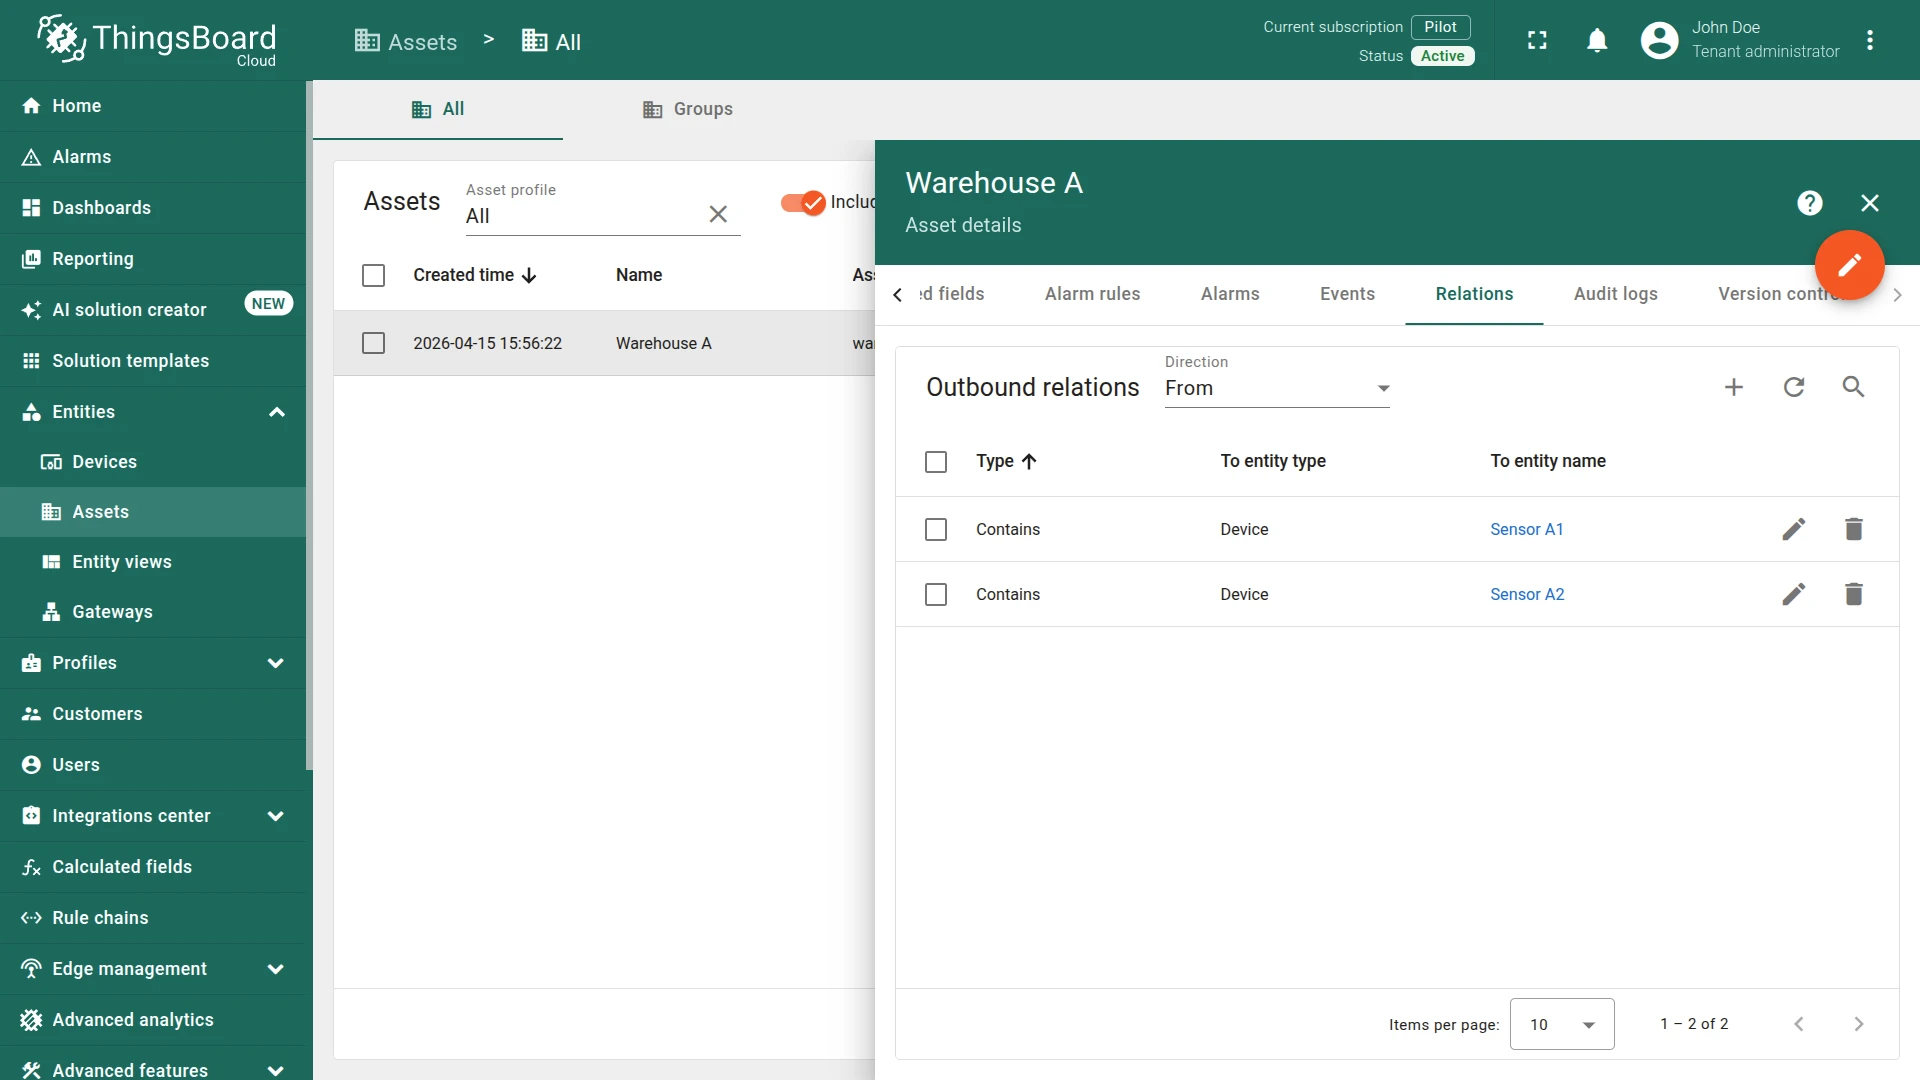
Step 2. Create relations
Section titled “Step 2. Create relations”Link both sensors to the warehouse using outbound Contains relations:
- Open Warehouse A details.
- Go to the Relations tab.
- Add an outbound Contains relation to Sensor A1.
- Add an outbound Contains relation to Sensor A2.
Step 3. Create calculated field
Section titled “Step 3. Create calculated field”You can import a ready-made calculated field or build it manually.
Option 1. Import calculated field
- Download the Warehouse Average Temperature calculated field as JSON file and import it into your instance.
Option 2. Create manually
- Navigate to Calculated fields and click + Add calculated field.
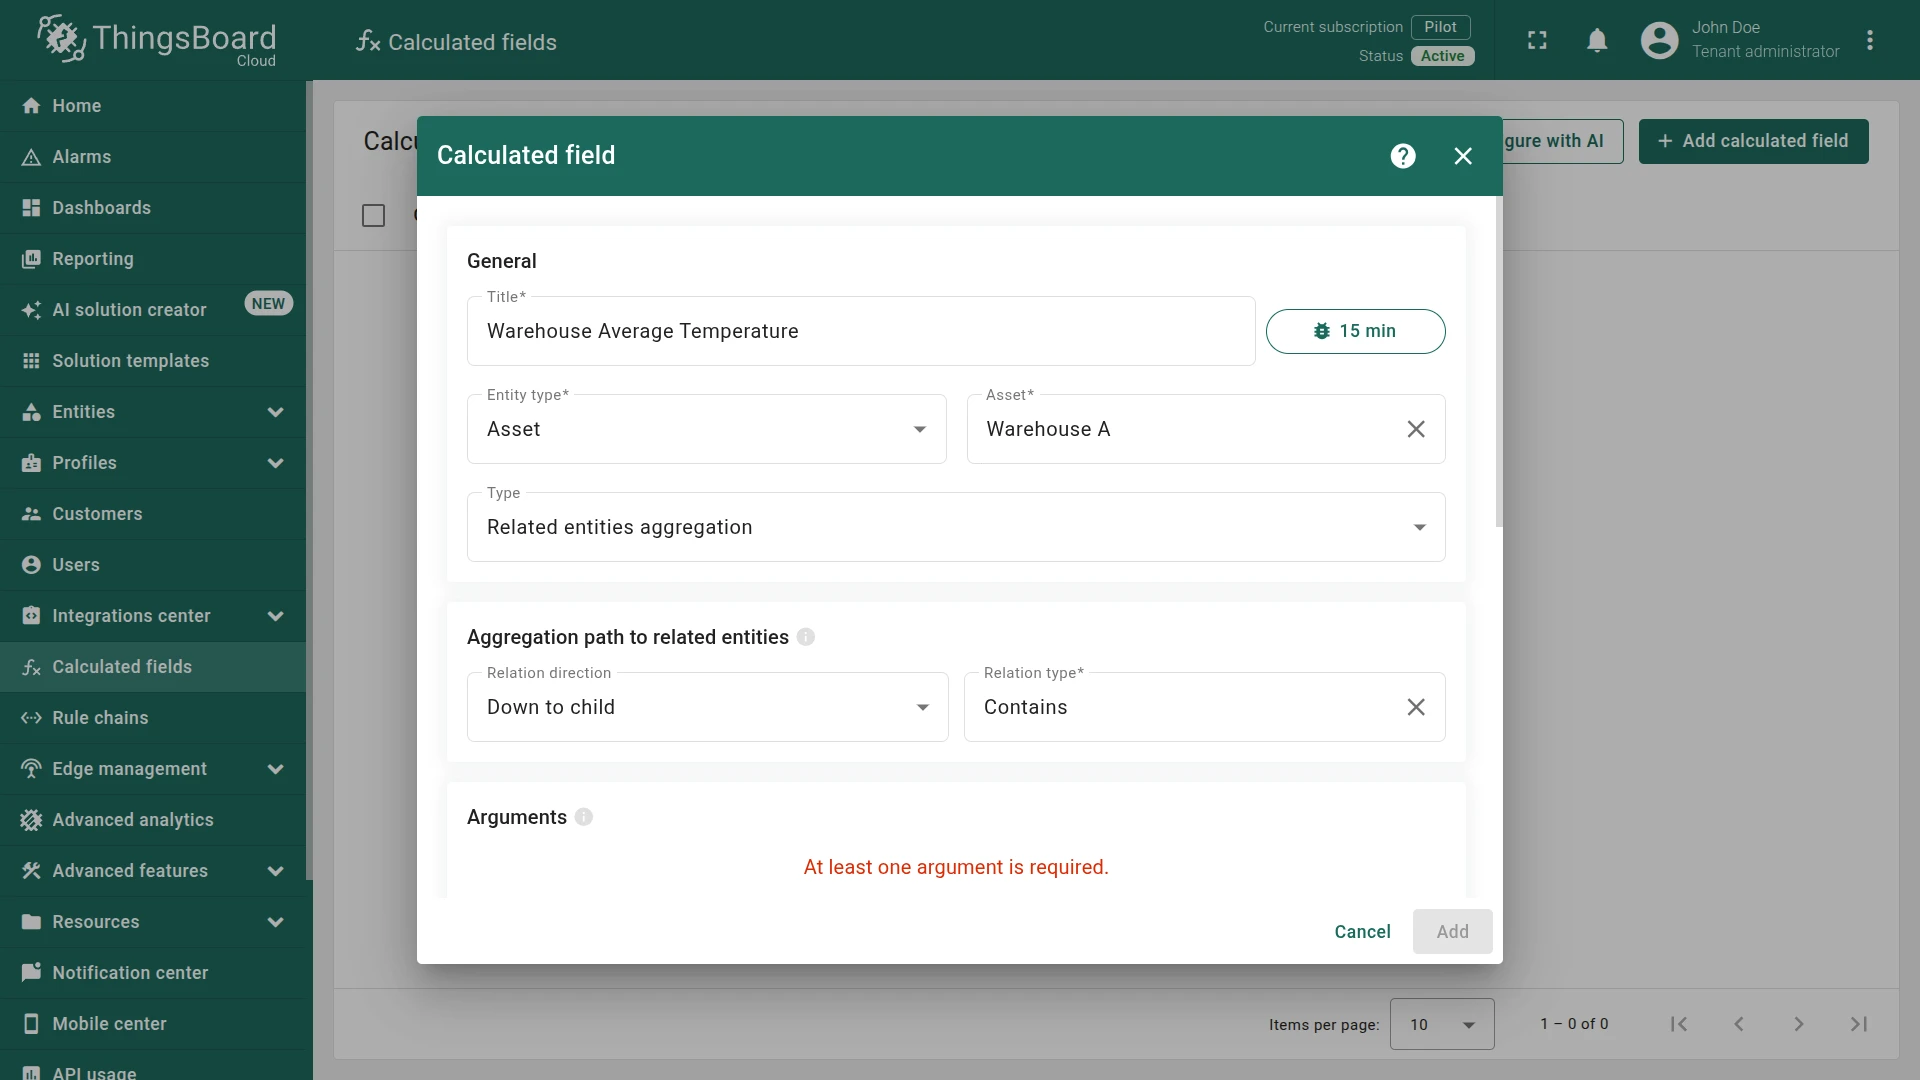
General settings
Section titled “General settings”- Title:
Warehouse Average Temperature - Entity type:
Asset - Entity:
Warehouse A - Type:
Related entities aggregation - Aggregation path:
- Relation direction:
Down to child - Relation type:
Contains
- Relation direction:
Argument
Section titled “Argument”Click Add argument and configure it to read temperature from each related device:
- Argument type:
Latest telemetry - Time series key:
temperature - Argument name:
temperature - Default value:
0

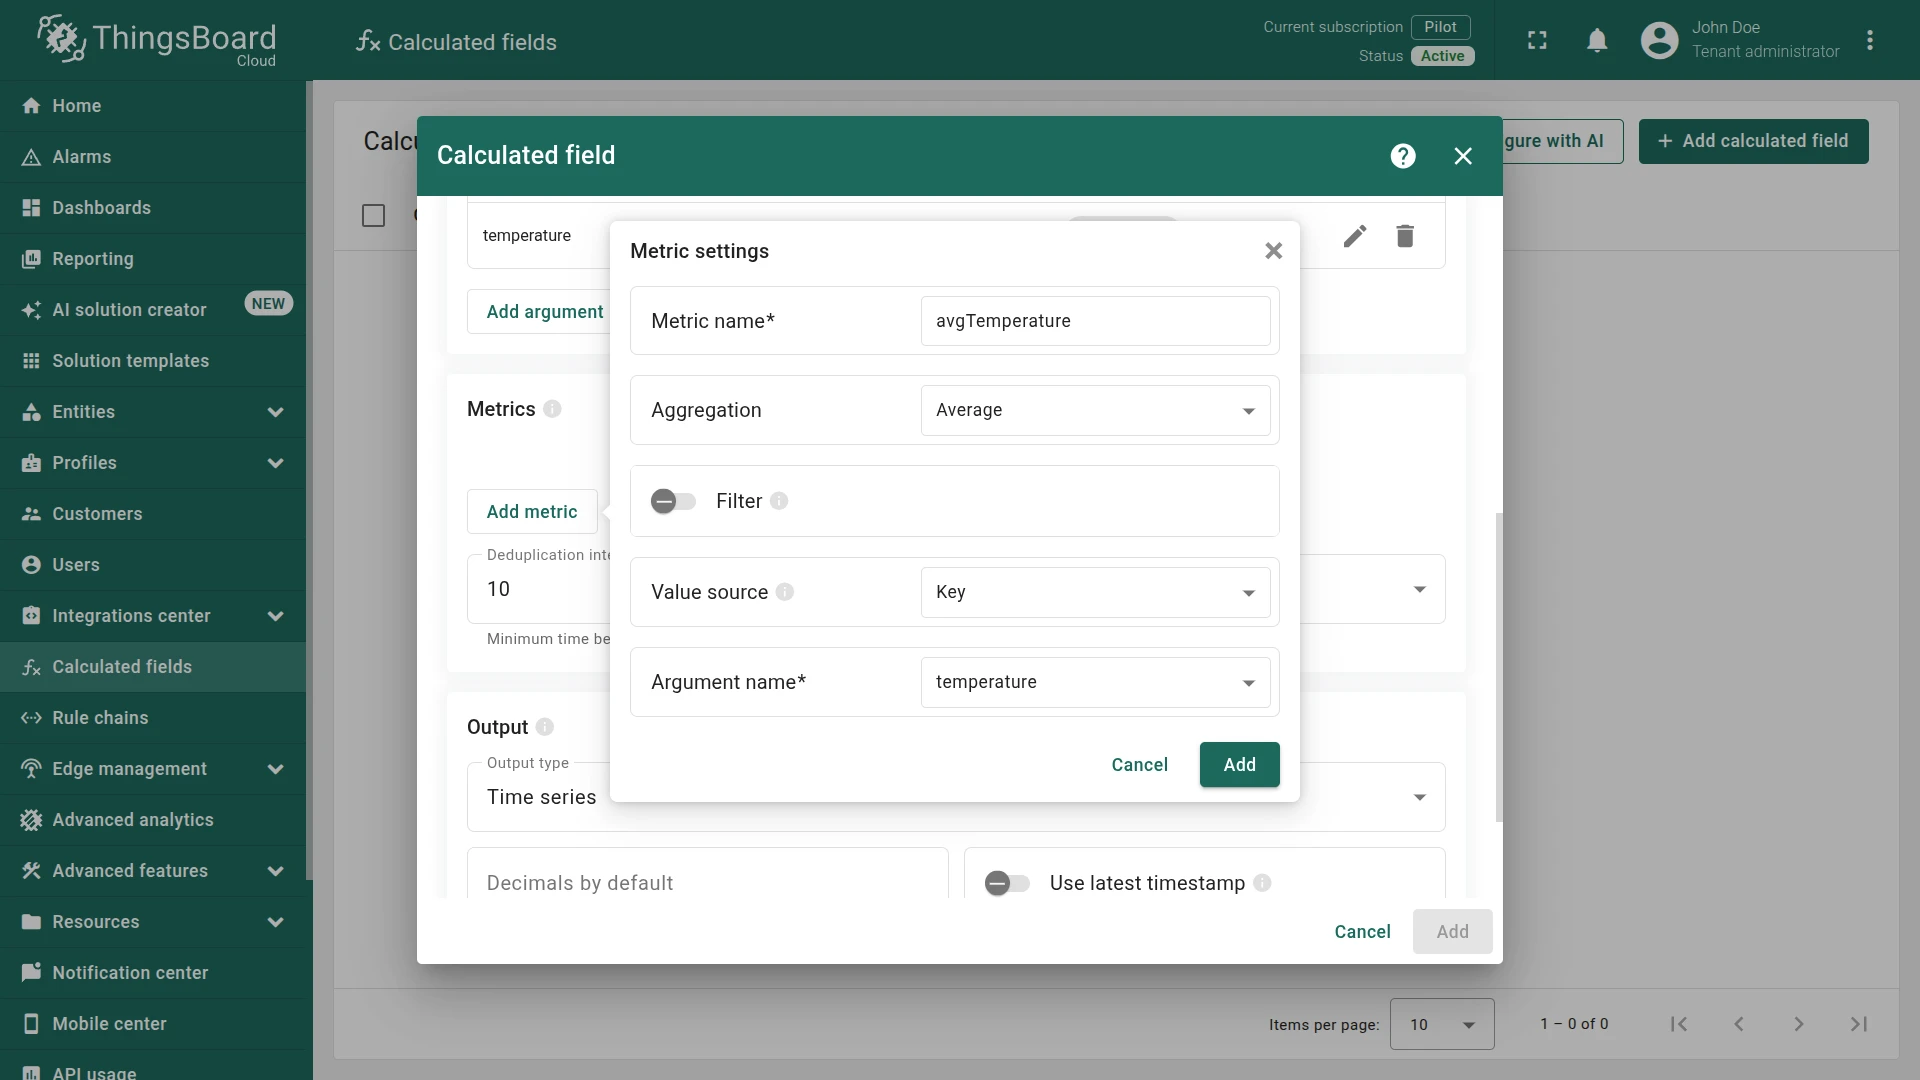
Metric
Section titled “Metric”Click Add metric and configure the aggregation:
- Metric name:
avgTemperature - Aggregation:
Average - Value source:
Key - Argument name:
temperature
Output
Section titled “Output”- Output type:
Time series - Decimals:
1 - Strategy:
Process right away
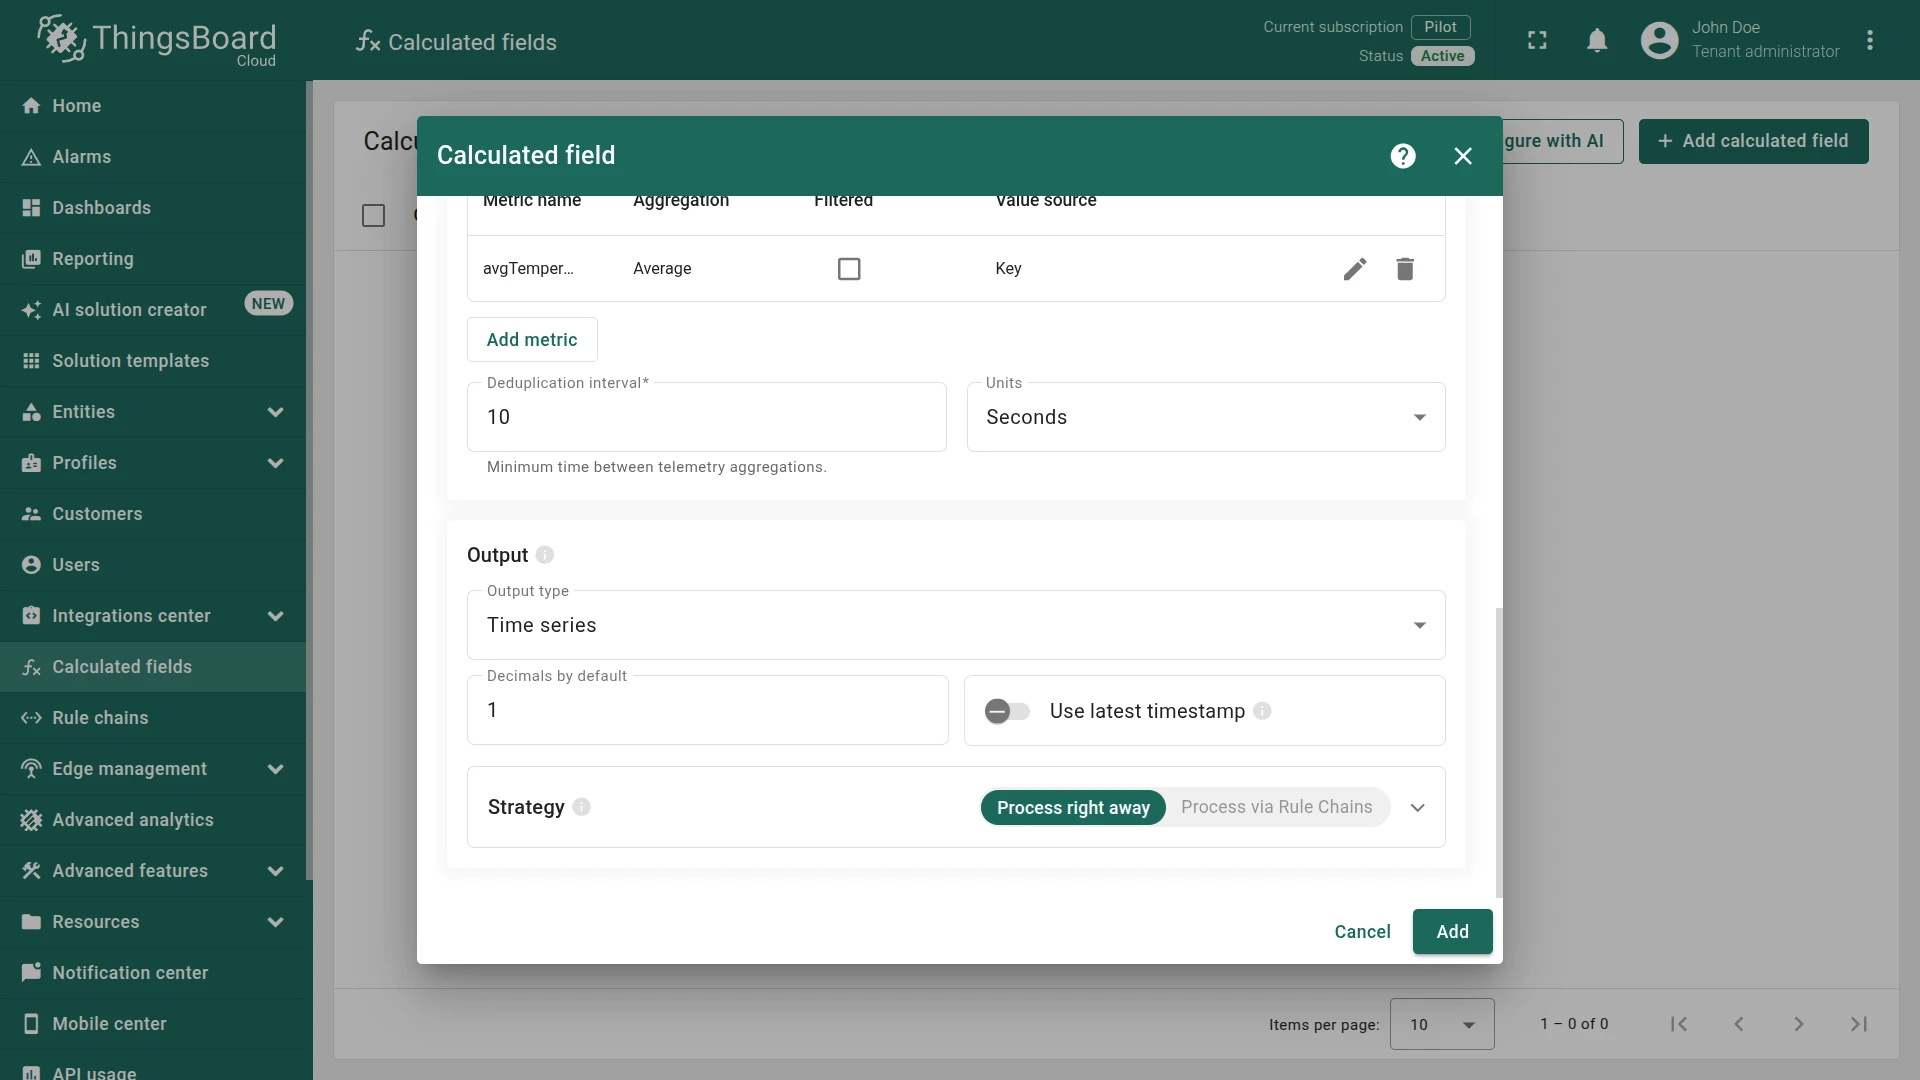
Click Add to save.
Step 4. Verify the result
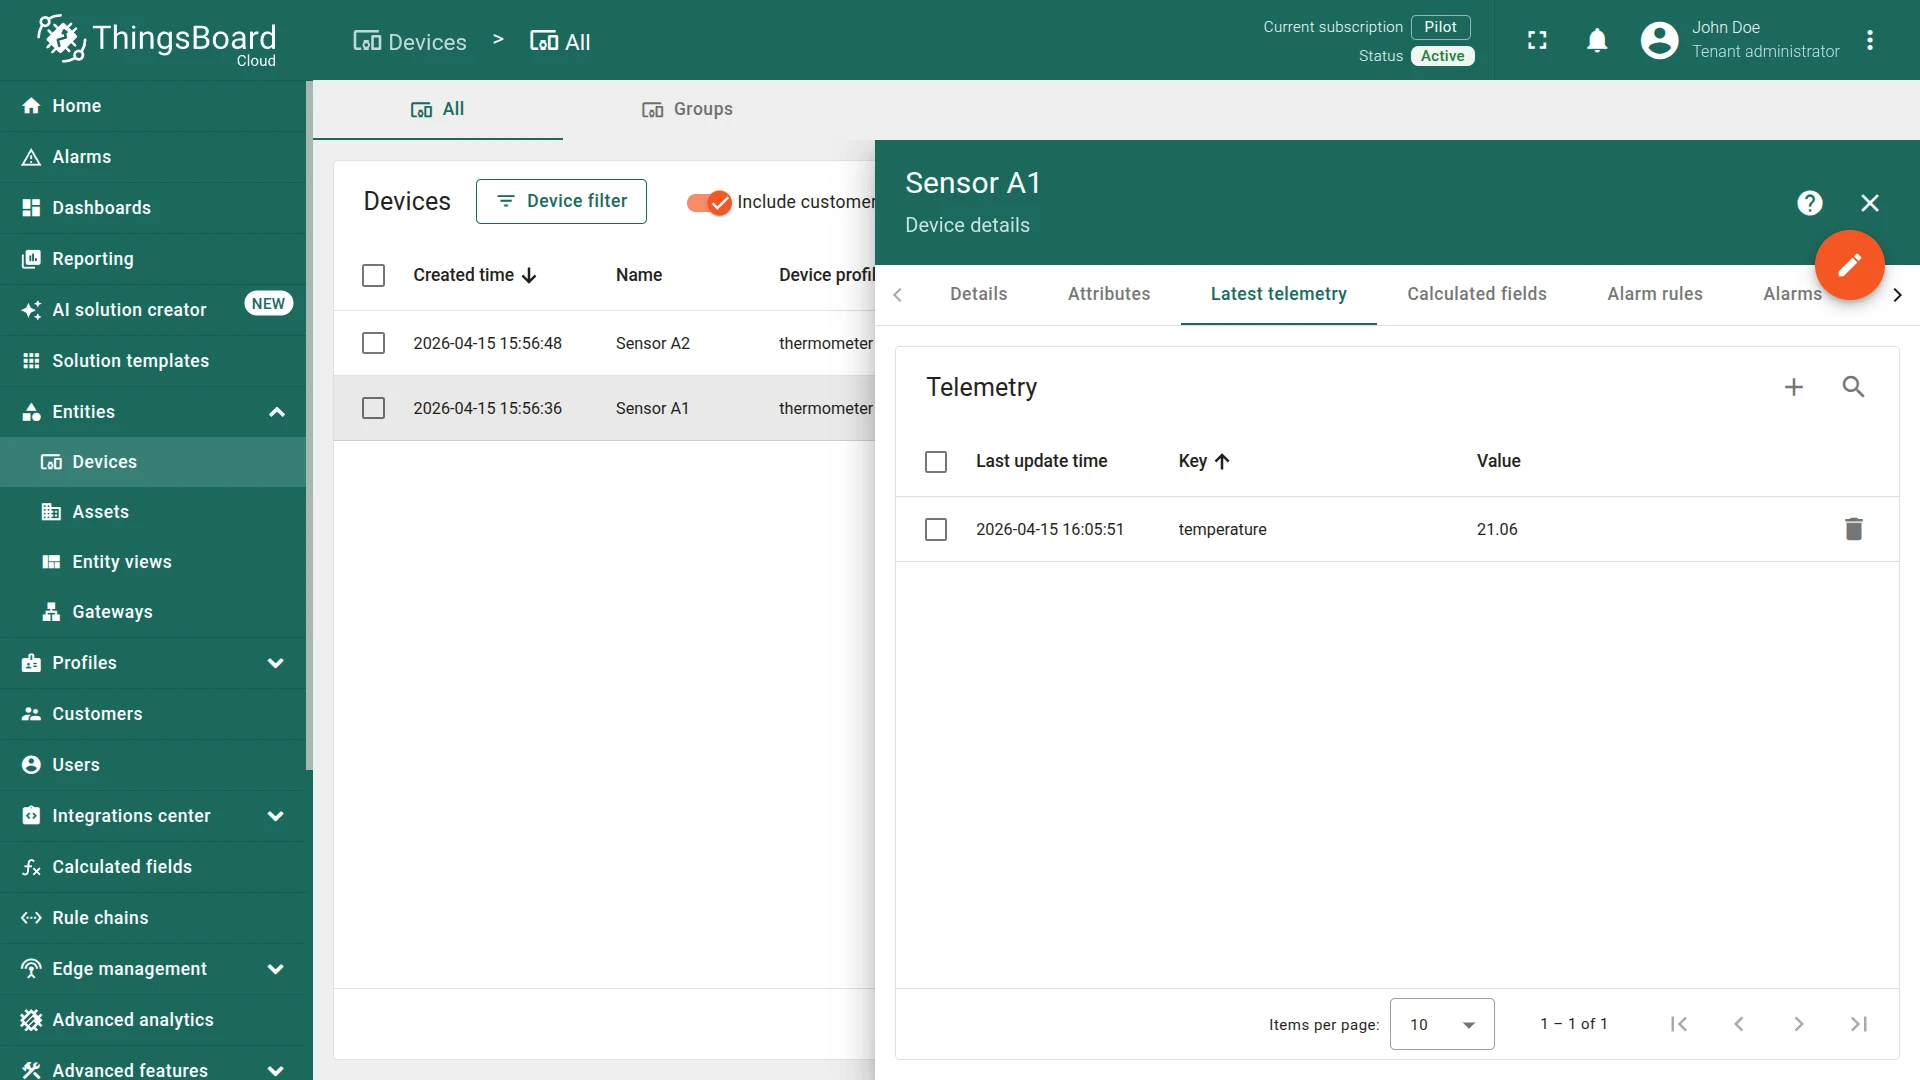
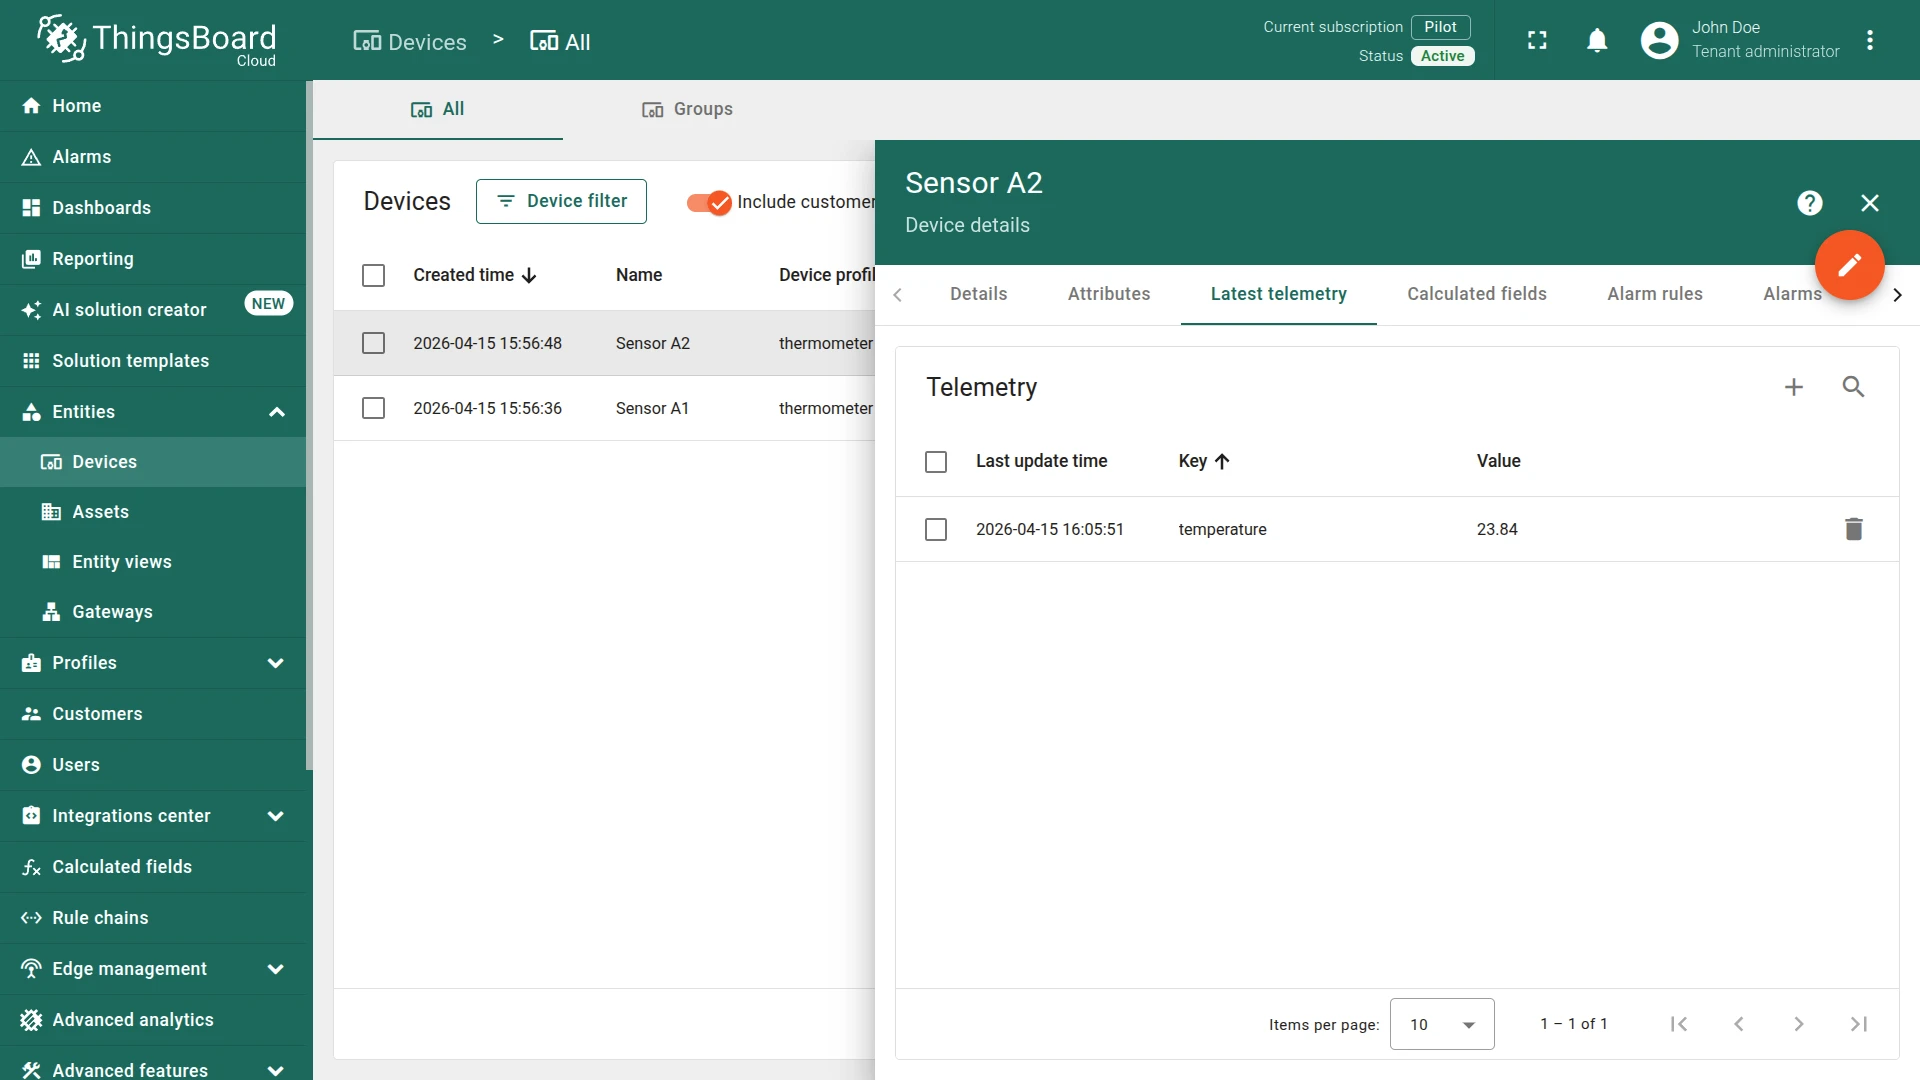
Section titled “Step 4. Verify the result”Post temperature telemetry to each device. Replace $ACCESS_TOKEN with the device access token.
Sensor A1:
curl -v -X POST -d '{"temperature": 21.06}' https://$THINGSBOARD_HOST/api/v1/$ACCESS_TOKEN/telemetry --header "Content-Type:application/json"Sensor A2:
curl -v -X POST -d '{"temperature": 23.84}' https://$THINGSBOARD_HOST/api/v1/$ACCESS_TOKEN/telemetry --header "Content-Type:application/json"The computed field reads the latest value from each related device, calculates the average, and stores it as the totalWaterConsumption time-series key for Warehouse A.
Expected result: Open Warehouse A ⇾ Latest telemetry tab.
The avgTemperature value is 22.5 (average of 21.06 and 23.84, rounded to 1 decimal), updated automatically whenever new data arrives from either sensor.

See also
Section titled “See also”- Related entities aggregation — full feature reference
- Calculated fields — overview of all calculated field types
- Relations — how entity relations work in ThingsBoard
- Aggregate Telemetry from Related Devices — similar recipe using Sum aggregation
Was this helpful?