How to Scale PostgreSQL Horizontally with Citus for Millions of IoT Devices

On this page
A customer came to us with almost 700,000 devices in production and a plan to reach five million within a few months. Their teams needed to find, filter and sort the whole fleet by each device’s current readings.
ThingsBoard keeps two kinds of device data. The full history goes to Cassandra, which grows by adding servers. The latest value of each key goes to PostgreSQL, so dashboards can filter and sort by it. Every new message overwrites that value, and with one PostgreSQL server, every overwrite for every device lands on the same machine.
At millions of devices, that one server becomes the limit. Large deployments worked around it by keeping latest values for only part of the fleet. This customer could not. So from ThingsBoard 4.4, PostgreSQL can run as a Citus cluster and grow by adding servers, like the rest of the platform.
In our benchmark with five million devices, a single PostgreSQL server fell behind at 29,000–64,000 row updates a second. A larger server would not help: this one used only 3–6 of its 16 cores, because the writes waited for each other. A four-worker Citus cluster kept up with 134,000, with no backlog.
TL;DR
- New in ThingsBoard 4.4: PostgreSQL can run as a Citus cluster, so the relational database grows by adding servers, like the rest of the platform. What is Citus →
- Result: with 5 million devices, one PostgreSQL server fell behind at 29,000–64,000 row updates a second. Four Citus workers kept up with 134,000, with no backlog. Benchmark →
- How: smart routing sends each device’s attributes and latest values straight to the worker that holds the device. How it works →
- Nothing changes for users: dashboards, rule chains and integrations work as before.
- When you need it: a well-tuned single PostgreSQL is still the simplest setup. A cluster uses more CPU in total and has more nodes to operate, so move to it when the write load outgrows one server. What to plan for →
- Managed option: ThingsBoard Private Cloud can size, deploy and run the cluster for you. Private Cloud →
What puts the most load on PostgreSQL in ThingsBoard?
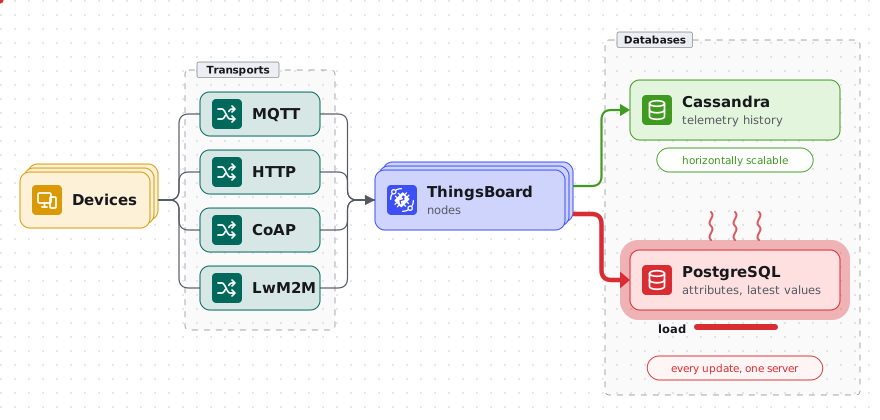
The load on PostgreSQL comes from a much smaller set of data than telemetry history: each device’s attributes and its latest telemetry value for every key. Unlike history, these are never appended. ThingsBoard holds a single value per device and key in the PostgreSQL ts_kv_latest and attribute_kv tables (battery level, temperature, location), and each new message the device sends overwrites the value already there. With five million devices, these tables don’t get very big, but they get very busy.
This is what decides whether a table can be spread across servers. Every telemetry message adds a new record to history, so no two writes ever target the same one: Cassandra places them by partition key across the cluster, and none of them waits on another. Latest values work the other way round. Each write targets a record that already exists, so it has to reach the server holding that record. With a single PostgreSQL instance, that’s the same server for all five million devices.
The volume grows faster than the message count suggests. A smart meter sending three telemetry keys in one message produces three row updates rather than one, and an industrial controller reporting ten keys produces ten. Every one of those updates has to be applied, because dashboards, alarm rules, calculated fields and entity data queries all read the latest values and depend on them being current.
Why does ThingsBoard keep latest values in PostgreSQL, not Cassandra?
ThingsBoard splits the work between two databases. Cassandra stores the large volume of historical telemetry, and PostgreSQL keeps the current values, so dashboards, filters and the API can query them fast.
Moving the latest values to Cassandra as well wouldn’t help, because of how they’re used. Cassandra is built to absorb immense volumes of writes, but it reads quickly only when it knows exactly where to look, such as one device’s history over a period of time. Latest values feed the dashboards, reports and API calls people rely on every day, where they search, filter and sort across the whole fleet in ways nobody plans in advance. That kind of reading is what PostgreSQL is built for. So the latest values stay in PostgreSQL, and the task became spreading PostgreSQL itself across servers.
Why scale PostgreSQL horizontally instead of vertically?
Before distributing anything, we worked through the standard ways of making a single PostgreSQL instance carry more load.
- Partitioning splits a table into smaller segments on the same machine. Queries scan less, and the server still performs every write itself.
- Data retention removes old records. The latest-value table keeps exactly one row per device and key, so there is nothing in it to expire.
- Replication keeps a standby copy of the database on another server, which protects you against losing the primary one.
A larger instance gives one server more cores, memory and storage throughput. That helps only while the hardware is the limit, and in our benchmark it was not: the single instance used 3 to 6 of its 16 cores while its writes waited on each other. Horizontal scaling splits those updates across several servers instead. The difference shows up as more devices are provisioned. Doubling the device count doubles the updates arriving every second, and only spreading the writes lets you keep up by adding hardware rather than replacing it.
Which resource you need more of first depends on the deployment. In write-heavy installations it’s often storage: every change has to be recorded durably before the platform confirms it, and a cloud storage volume has a limit on read and write operations per second (IOPS). It can also be CPU. Either way, buying more for one machine is different from spreading the writes over several, and only the second keeps pace with a growing fleet.
What is Citus, and why did we choose it?
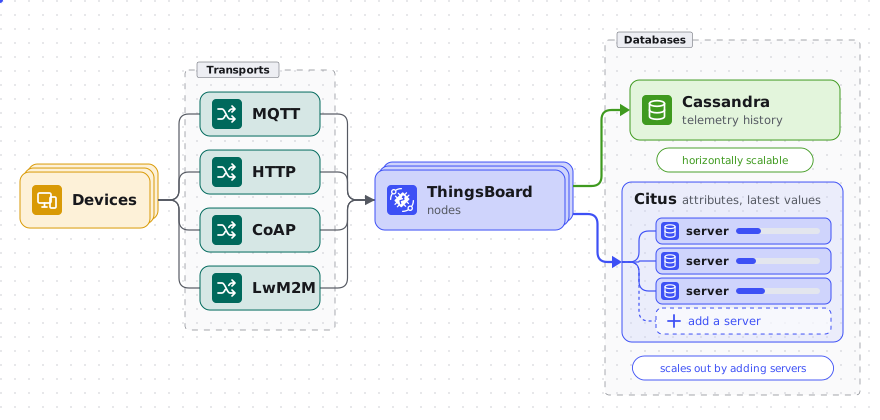
The requirement was a relational database that absorbs more writes when you add servers, without giving up SQL or transactional correctness, and one that installations already in production could move to without being rebuilt around it. That second condition mattered most. Changing the database engine means reworking the schema, the application layer, the backup procedure and the monitoring, then repeating that work in every self-hosted deployment. What we needed was a way to spread the writes that stayed inside PostgreSQL itself.
Citus is an open-source extension that turns a group of PostgreSQL servers into one distributed database. It’s not a fork of PostgreSQL or a separate engine: you install it into a standard PostgreSQL instance like any other extension. The project started at Citus Data in 2010, was open-sourced in 2016, and was acquired by Microsoft in 2019. The same technology powers Microsoft’s own distributed PostgreSQL service, Azure Cosmos DB for PostgreSQL. Since 2022 every part of Citus has been open source, including the shard rebalancer that moves data onto a newly added server. Before that, the free version could only rebalance by pausing writes to the tables being moved.
A Citus cluster has one coordinator node and any number of worker nodes, and every table belongs to one of three categories.
- Distributed tables are split into shards by hashing a chosen column, and those shards are spread across the workers.
- Reference tables are copied in full to every worker, so a lookup against one is answered locally.
- Local tables stay on the coordinator.
Choosing a category for each table was the largest part of the integration work, though not the whole of it. Existing queries kept working, because a Citus cluster speaks the same protocol as a standard PostgreSQL server and works with the same drivers and the same SQL, so the application layer did not have to be rebuilt around a new database. Underneath, some keys and constraints in the schema were reworked around the column that decides which worker a row lives on. ThingsBoard now groups writes so that each batch goes to a single worker, and it holds a pool of connections to every worker rather than one pool to a single server.
Running the database is different work once it’s a cluster. The coordinator and every worker are backed up together and have to be restored together, and monitoring has to cover all of those machines instead of one. The platform itself works exactly as it did before, and that is what settled the choice.
One device, one worker
Which category a table falls into comes down to how closely it belongs to a device.
The tables that grow as devices are provisioned are spread across the workers. Those are a device’s own record, its attributes, its latest value for every telemetry key it reports, and any alarms raised on it. Assets are placed the same way, so each one lands on a single worker together with its data.
The tables that almost every query reads and that rarely change are copied to every worker instead. A deployment with five million devices has no more device profiles than one with a thousand, so a full copy on each worker costs very little.
The remaining tables stay on the coordinator, exactly where they were before.
How does ThingsBoard connect to a Citus cluster?
ThingsBoard can work with a Citus cluster in one of two modes. The difference is who decides which worker each write goes to.
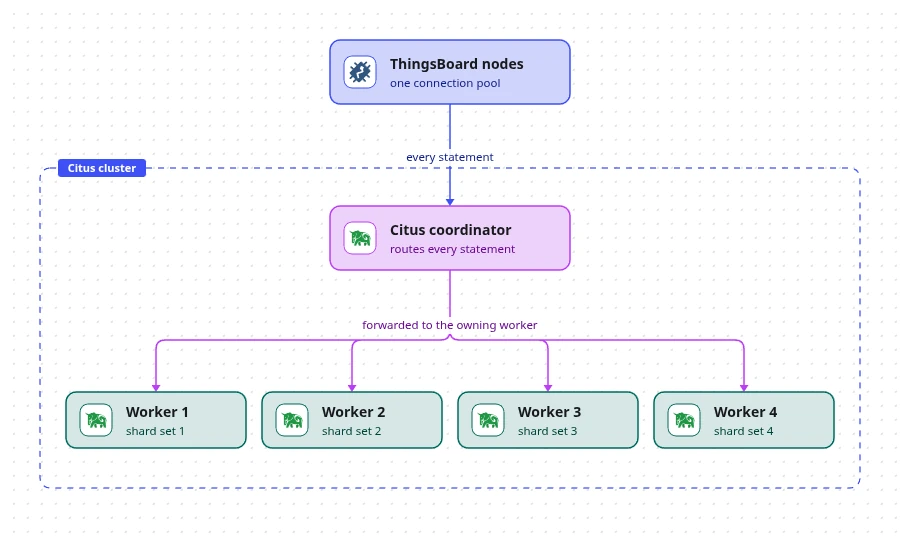
In coordinator mode every statement is sent to the coordinator, which looks up the worker that owns the row and passes the statement on. Nothing in the application has to know that a cluster is there, which makes this the simplest way to run, and it already spreads the write load across all of the worker disks. Every connection and every query plan still passes through the coordinator, so at very high throughput it becomes the busiest node in the cluster.
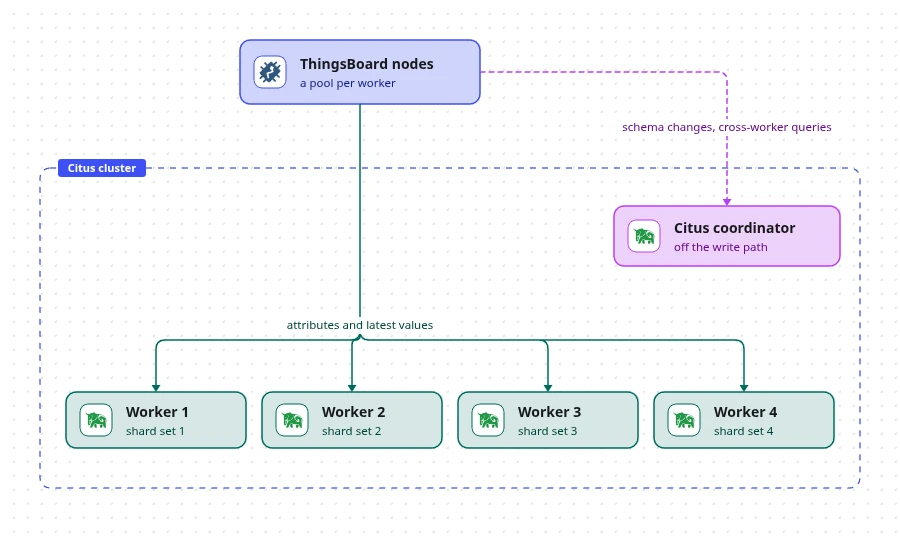
The other mode is smart routing, where ThingsBoard keeps the routing decision to itself. A device’s attributes and latest telemetry values live on one Citus worker, so that is where ThingsBoard sends them, with nothing in between. The coordinator is still there for schema changes, for the tables that stayed on it, and for the occasional query that has to reach across workers, and the stream of latest-value updates arriving every second no longer passes through it.
Smart routing is on by default whenever Citus is enabled, since it is the mode that takes the most writes per second.
The benchmark setup
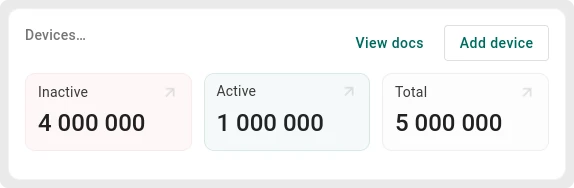
We ran the benchmark to see what changes when several servers share the relational write load instead of one, so we sent more traffic than a single instance handles comfortably. The fleet is the size the customer is heading for, five million provisioned devices, with a million of them reporting telemetry throughout the run.
Test configuration:
- 4 Citus worker nodes, 1 coordinator and 6 ThingsBoard nodes, each on its own virtual machine
- 32 shards spread across the 4 workers, 8 on each
- 5,000,000 provisioned devices, of which 1,000,000 published over MQTT for the whole run
- Three device profiles: 340,000 smart meters, 340,000 smart trackers and 320,000 industrial controllers
- 60 load generators, each raising one alarm a second alongside the telemetry
The devices were split across three profiles rather than one, because the number of telemetry keys in a message decides how many rows that message updates, and a real fleet is never uniform:
| Device profile | Active devices | Telemetry keys per message | Publish interval per device | Messages/s | ts_kv_latest rows/s |
|---|---|---|---|---|---|
| Smart meter | 340,000 | 3 | 20 s | 17,000 | 51,000 |
| Smart tracker | 340,000 | 5 | 40 s | 8,500 | 42,500 |
| Industrial controller | 320,000 | 10 | 80 s | 4,000 | 40,000 |
| Total | 1,000,000 | — | — | 29,500 | 133,500 |
We provisioned all five million devices even though only a million of them ever published. The million publishing devices set the write load, and the four million idle ones kept the tables at production size, because every write has to find its row in a much bigger index and a run against a million rows would have told us nothing about what the customer was going to live with.
The message rate understates the work. About 29,500 messages a second arrive, and they carry about 134,000 telemetry keys between them. Each key overwrites a value of its own, so the database has to keep up with that many row updates a second. Both the single instance and the four-worker cluster were given the same load.
Single PostgreSQL instance vs. Citus cluster
To see what distribution changes on its own, we ran the same load twice, once against a single PostgreSQL instance and once against the four-worker cluster. Every database node had a virtual machine to itself, an AWS c6a.4xlarge with 16 vCPUs and 32 GB of memory, whether it was the single instance, the coordinator or one of the four workers. Both runs started from the same 200 GB of data and indexes, with all five million devices provisioned, and used the same database tuning and the same ThingsBoard configuration apart from the Citus settings.
Key results:
| Metric | Single PostgreSQL instance | Citus cluster, 4 workers |
|---|---|---|
| Rows written per second, all tables | 29,092 to 64,116 | More than 134,000 |
| Connections waiting on locks | More than 75% for 77 of 119 seconds | Under 25% for the whole run |
| ThingsBoard write queue per buffer | 130,000 to 195,000 updates | Zero |
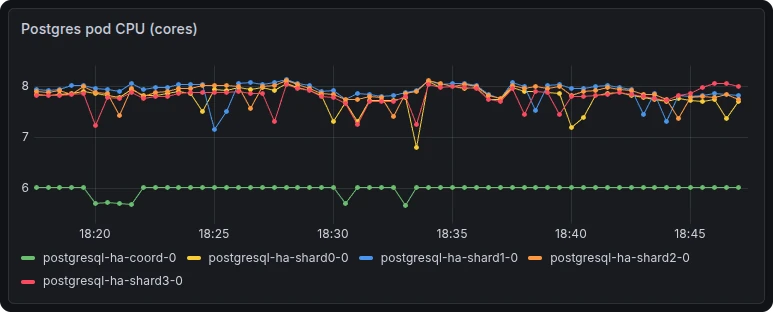
| CPU used | 3 to 6 of 16 cores | About 8 of 16 per worker, about 6 on the coordinator |
We wrote a small script that samples the database 120 times, a second apart, and records how much it wrote between one sample and the next. At any moment some of its connections are writing while others wait their turn, so the script grouped those seconds by how many were waiting. While fewer than half were waiting, the database wrote between 63,269 and 64,116 rows a second, and it spent 31 of the sampled seconds in that state. The rate fell to 56,386 once more than half were waiting, and to 29,092 once more than three quarters were, which is where it stayed for 77 of the 119 seconds.
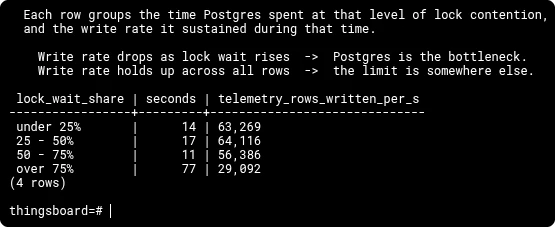
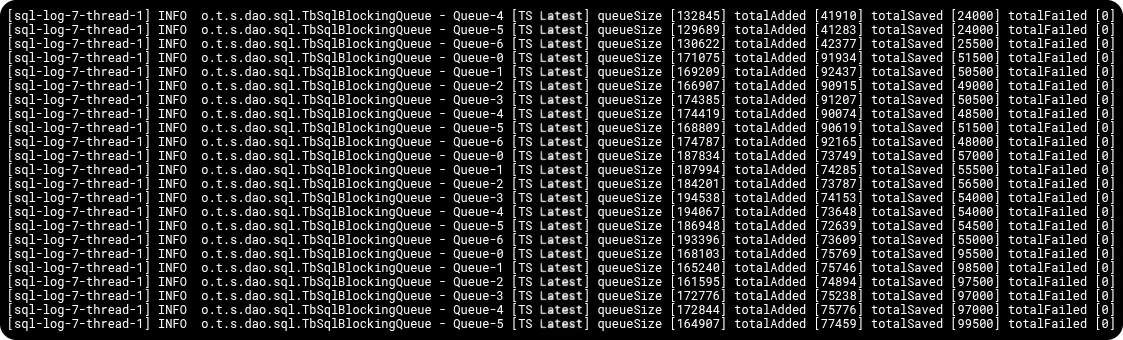
The single instance used 3 to 6 of its 16 cores for the whole run, and its memory and its IOPS stayed below their limits too. No resource on the machine was saturated, so what held the write rate down was inside PostgreSQL rather than in the hardware underneath it.
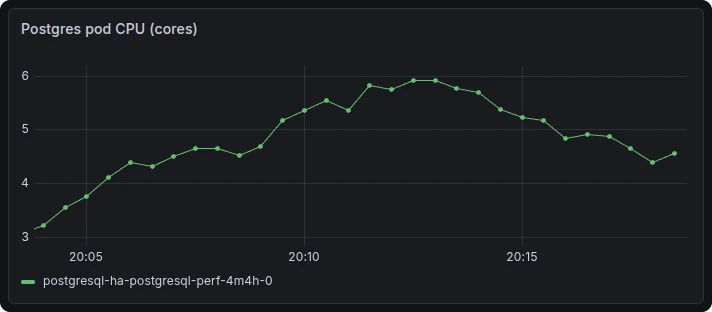
The four-worker cluster took the same 134,000 latest-value updates a second and kept up with them. Each worker wrote between 30,000 and 35,000 rows a second, more than 134,000 between them. That figure counts every row the workers wrote, the values being overwritten and the rows being written for the first time, so it covers the whole relational write load rather than the latest values alone. The coordinator wrote almost nothing, because ThingsBoard sends every latest-value update straight to the worker that holds the device.
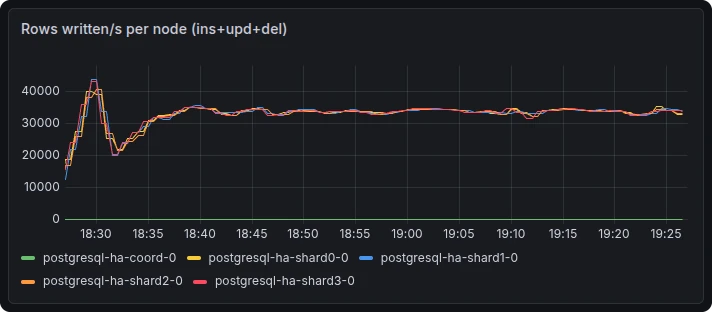
The same script run against the cluster explains why. Fewer than a quarter of its connections were waiting at any point across the 146 seconds it covered, so it never reached the state the single instance spent most of its time in. That run spans more seconds than the single-instance run because every sample has to reach all four workers before the next one starts. Each worker owns an even share of the devices and takes the same share of the updates, which with four workers is about a quarter each. Connections that would have queued behind one another on one server are now spread across four machines that never wait on each other.
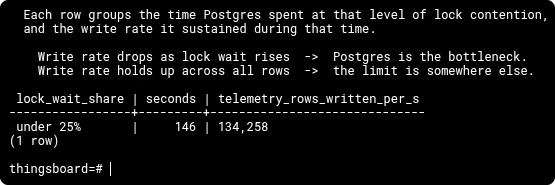
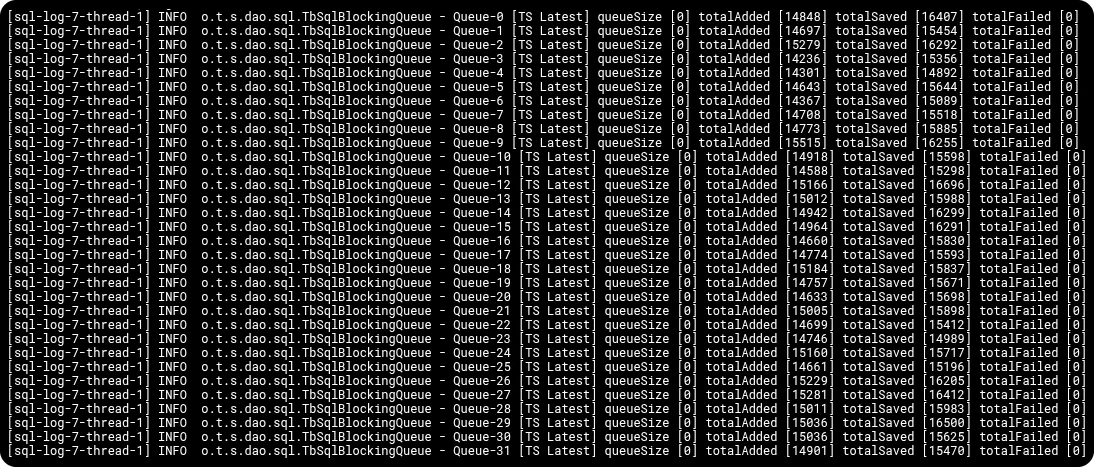
ThingsBoard showed the same. Every buffer on the ThingsBoard nodes stayed at zero and saved updates as fast as they arrived, with no failures.
Each worker used about 8 of its 16 cores and the coordinator about 6. The cluster took everything the load offered, with fewer than a quarter of its connections waiting where the single instance had more than three quarters.
What does a Citus cluster give you?
Running PostgreSQL as a cluster changes what a ThingsBoard deployment can grow into. Write capacity stops being a property of a single machine and becomes something you extend by adding servers, and the relational database turns into a group of machines that are sized and operated as one system. That’s where its benefits come from, and it also shapes how you plan.
Benefits
- Cheaper storage. Writes are divided between the workers, so each machine needs a disk sized for the share of the data it holds rather than for the whole deployment. The fast, expensive volume that a single server depends on stops being a requirement.
- Capacity you add instead of buy. Write throughput grows with the number of workers rather than with the price of one machine. You add a worker, move part of the data onto it, and repeat that step the next time the fleet grows.
- Fault isolation. Each worker holds only the data assigned to it, so losing one leaves everything on the other workers readable and writable. A worker is an ordinary PostgreSQL server, so it can run with a standby of its own and be promoted in place.
- Parallel backups. Every node saves its own share at the same time as the others, so the largest tables are never written out or reloaded by a single server.
What to plan for
- CPU across the cluster. A cluster uses more processor time in total than one server would, because every node runs a database of its own and work spanning several nodes is planned and combined across them. Part of what you save on storage goes to compute.
- Operations across several nodes. Patching, backups, monitoring and capacity planning cover every node rather than one. ThingsBoard Private Cloud can take this on for you.
- Fleet-wide queries. A lookup for a single device is answered by the worker holding it, while a query across many devices runs on several workers in parallel and the coordinator combines their results.
- Shard count. The number of shards is set when the tables are distributed, so size it for the largest number of workers you expect to run. Plan the cluster around the fleet it will reach, not the one it starts with.
Conclusion
ThingsBoard can now spread its relational database across several servers instead of keeping it on one. Each device’s writes go to one of those servers instead of all of them arriving at the same one. Nothing changes for the people using the system, because dashboards, rule chains and integrations work exactly as before.
Large deployments can now scale and filter dashboards by current readings across the whole fleet: the relational database grows by adding machines, the same way the rest of the platform does.
A well-tuned single database with room to spare is still the simplest setup. A cluster is the next step when the write load grows beyond it.
Citus support is available from ThingsBoard 4.4. The documentation covers the configuration in full.
Let us run it for you on ThingsBoard Private Cloud
Most of the work with a cluster starts after it’s switched on. Shards have to be sized for the fleet you’ll reach, the coordinator and workers have to be backed up and restored together, every node needs monitoring, and new workers have to be added and rebalanced as devices arrive. ThingsBoard Private Cloud takes that work off your hands. It’s a fully managed, isolated ThingsBoard cluster with an uptime SLA, and our team can set up and operate a Citus-backed cluster for you:
- Sizing up front. We work out how many workers you need, set the shard count for your target fleet rather than today’s, and choose instance and storage types to match your write profile.
- Deployment. We deploy Citus with smart routing next to your ThingsBoard cluster, configured and tested against your device profiles.
- Moving from a single PostgreSQL. We migrate an existing deployment onto the cluster.
- Day-to-day operation. We take coordinated backups and restores across all nodes, monitor every worker and the coordinator, keep standbys ready and handle upgrades.
- Growth. As your fleet expands, we add workers and rebalance shards onto them.
If you’re planning a deployment at this scale, contact us early about ThingsBoard Private Cloud. It’s much easier to size a cluster for your target fleet from the start.
Run your cluster on ThingsBoard Private Cloud