This guide describes how to prepare your dataset for visualization
- How Trendz resolve fields from different Business Entities
- Grouping by time
- Define Groups for analysis
- Aggregate telemetry and groups
- Work with pulse output telemetry
- Next Steps
During Data Analysis it is a common task to define how a big dataset should be aggregated. This task can be split into 2 phases - define groups that will be used during analysis and define aggregation function for groups.
Before we continue we need to discuss important topic to understand how data resolved by Trendz:
How Trendz resolve fields from different Business Entities
Let’s assume that we have a Smart Building solution. Our topology contains Buildings, Apartments and different Meters that are connected with each other using relations. Here is how our topology will look like:
In fact, Trendz operates with this topology as with the flat table that has columns for all attributes/telemetry from all Devices/Assets in this topology. The Relation between entities used to join fields from different Business Entities.
What it gives us: when we are using only 2 fields from this topology:
building namethat belongs to the Building Assetenergytelemetry, that belongs to the Energy Meter Device- aggregation type
SUM - time range - last month
Trendz will find all available buildings in the ThingsBoard, then all Apartments for each Building and finally all Energy Meters that belong to the apartment. After that, for all Energy Meters for each building, Trendz will load all energy telemetry for the last month and sum it. As a result we can see how much energy was consumed by each building.
It is not an exact algorithm description and there are a lot of optimizations performed in the background. But it allows to understand how much complexity handled inside Trendz, so you can focus on analytics but not on data fetching.
Grouping by time
In most cases data is grouped by time interval - by hour, day, week, month, etc. You should use Date field from left panel and drag and drop it the X-axis section.
Default function for Date aggregation is RAW - it means that user can control what is an aggregation interval using Group By combobox near Time Range picker. System will take full range from Time Range picker and devide it into smaller intervals depending on selected value. Latter, selected aggregation function applied for each interval. Allowed values for Group By field are:
- Month
- Week
- Day
- Hour
- Minute

You can have more control on date intervals by selecting other available Date aggregation options:
- RAW,
- MINUTE
- HOUR
- FULL_HOUR - ‘2020-03-01 23’
- DAY - day of the week
- DATE - day of the month
- FULL_DATE - ‘2020-03-01’
- START_OF_WEEK - 2020-03-01
- WEEK_OF_YEAR - numeric week of the year
- WEEK_OF_MONTH - numeric week of the month
- MONTH
- QUARTER
- YEAR
- YEARMONTH - ‘2020-Feb’
Define Groups for analysis
In this step, we want to define on what logical level we want to see our data. In the Energy Metering scenario, we can make analysis on different levels such as city, region, building, apartment or concrete energy meter. The good news is that Trendz provides this grouping automatically in real-time. You don’t need to explicitly define aggregation rules and pre-compute value for different levels before analysis.
In this example we just add 2 fields - Building name and Energy Consumption. We do not have any aggregation rules in the Rule Engine. Trendz knows what Energy Meters are registered in each building, so energy meters divided into a separate groups for each building.
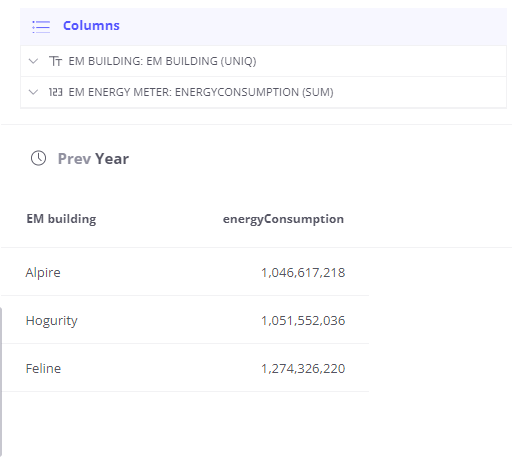
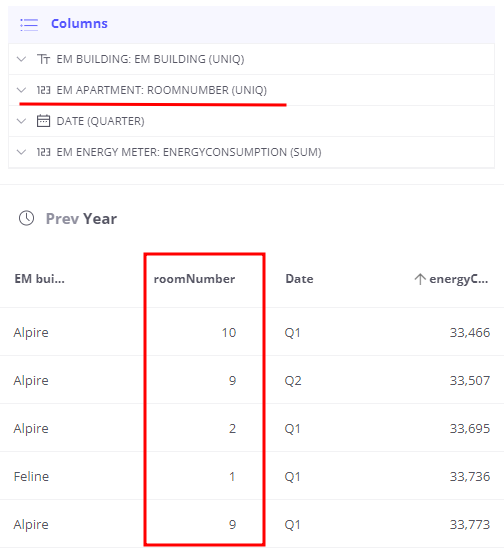
We see total consumption for the last year. Now let’s group data by quarters - add Date field with quarter type:

Finally lets deep dive and see total consumption separated by room number - add Room Number attribute from Apartment Business Entity:
Aggregate telemetry and groups
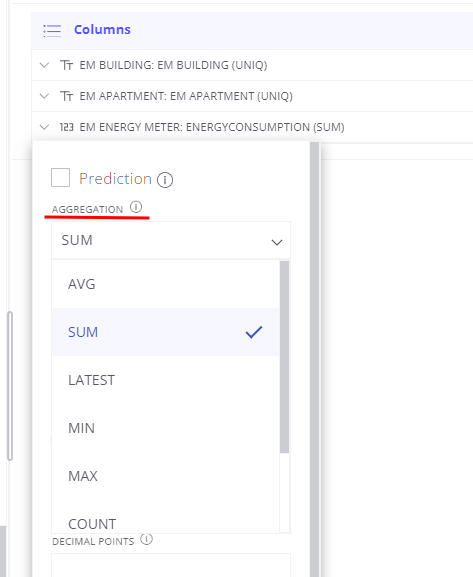
The Next important step is to define how data should be aggregated. Here are supported aggregation types:
- AVG
- SUM
- MIN
- MAX
- LATEST
- COUNT
- UNIQ
- DELTA - special case described later in this guide
For changing aggregation type - just click on the field and select required value.
Work with pulse output telemetry
Water meter is a good example of a device with pulse output - telemetry value always growing and during analysis, we want to convert it into delta values. Here is an example chart for such telemetry:
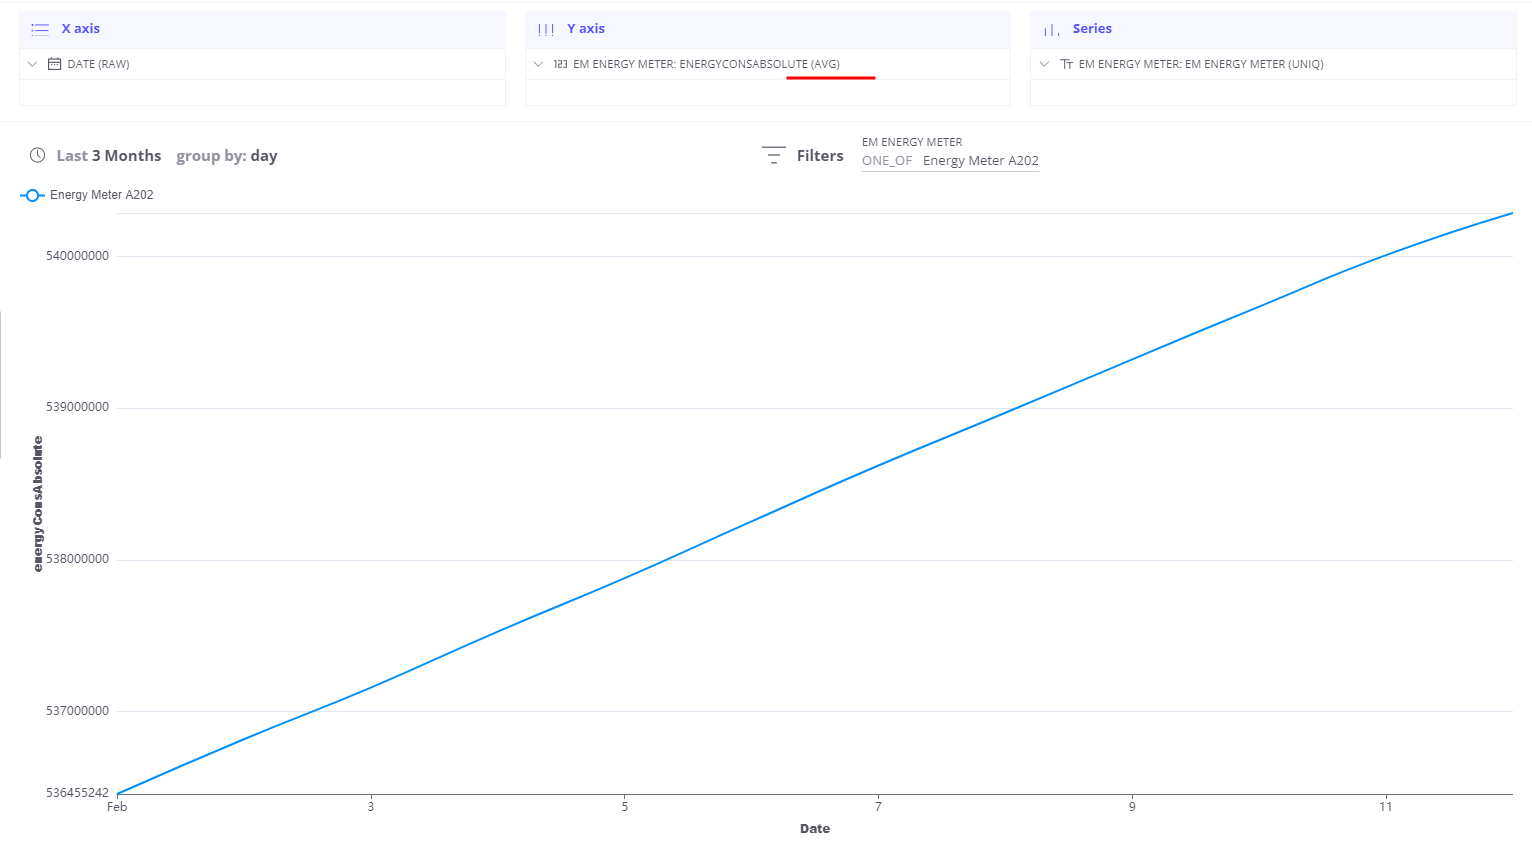
Let’s apply DELTA aggregation for this field and see how our data will look like:
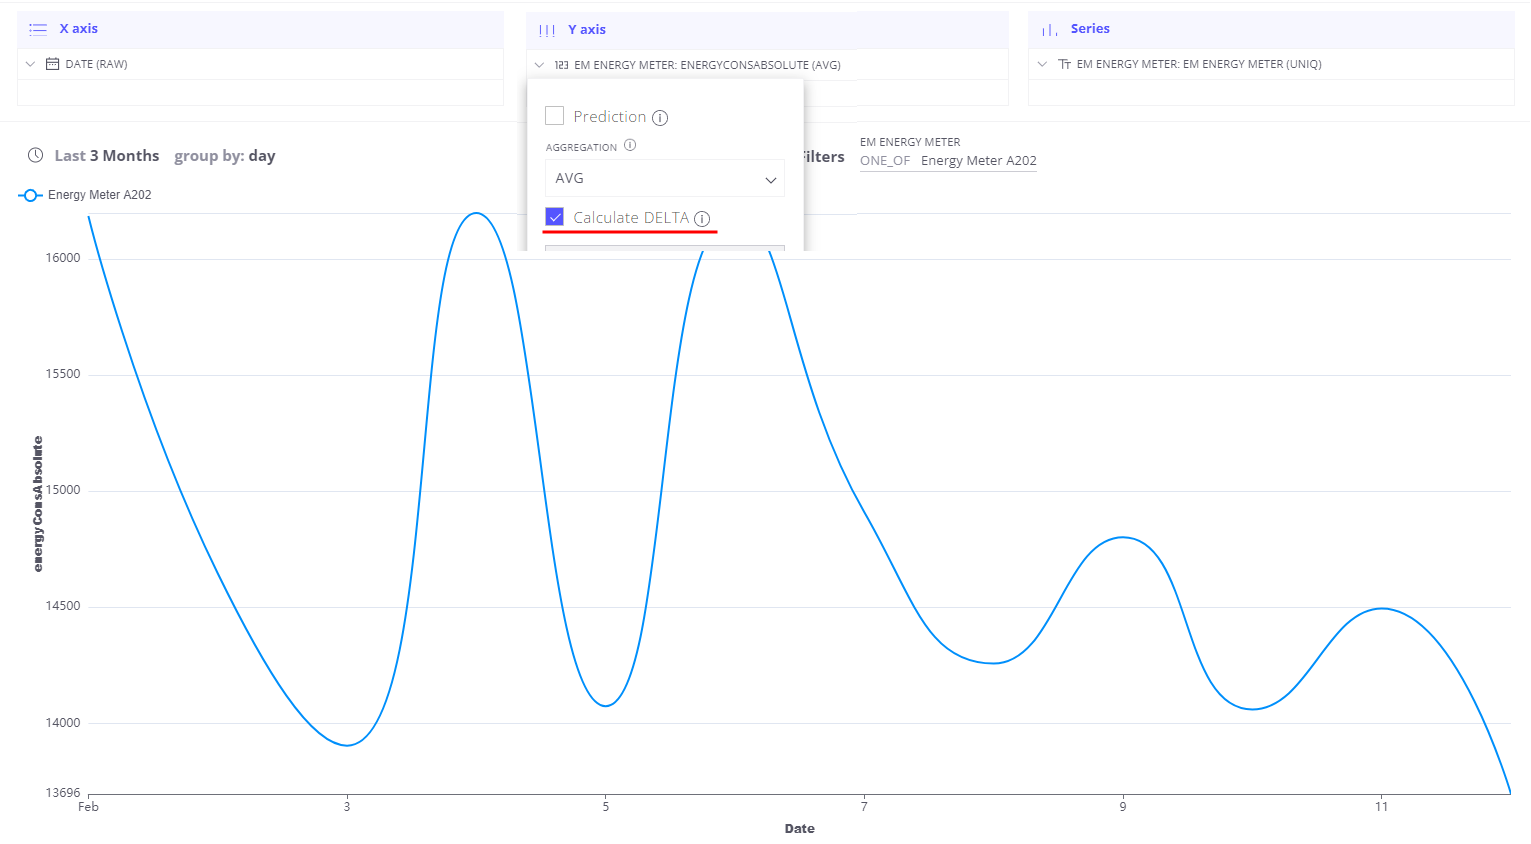
Trendz automatically computes delta for this field for defined time ranges with required granularity. In case when DELTA aggregation applied for multiple devices - Trendz will apply SUM aggregation to the aggregate group - as the result, we can see total consumption on different levels (city, building, etc.)
Next Steps
-
Getting started guide - These guide provide quick overview of main Trendz features.
-
Installation guides - Learn how to setup ThingsBoard on various available operating systems.
-
Metric Explorer - Learn how to explore and create new metrics with Trendz Metric Explorer.
-
Anomaly Detection - Learn how to identify anomalies in the data.
-
Calculated Fields - Learn about Calculated fields and how to use them.
-
States - Learn how to define and analyse states for assets based on raw telemetry.
-
Prediction - Learn how to make forecasts and predict telemetry behavior.
-
Filters - Learn how filter dataset during analysis.
-
Available Visualizations - Learn about visualization widgets available in Trendz and how to configure them.
-
Share and embed Visualizations - Learn how to add Trendz visualizations on ThingsBoard dashboard or 3rd party web pages.
-
AI Assistant - Learn how to utilize Trendz AI capabilities.
