Anomaly Detection Theory
Anomaly detection is the process of identifying unexpected behavior in telemetry data - patterns that differ significantly from what is considered normal. These anomalies can indicate system malfunctions, equipment degradation, security breaches, or operational inefficiencies.
In modern monitoring and analytics, anomaly detection is essential for:
- Predictive maintenance
- Early fault detection
- Operational efficiency
Trendz provides a powerful, out-of-the-box solution for anomaly detection, capable of automatically finding abnormal patterns in time-series data without requiring manual thresholding or expert labeling. For advanced users, Trendz also offers full control over the model configuration process - including input preparation, feature extraction, distance function tuning, and scoring logic - all within a convenient and intuitive interface.
You can find details how to use Trendz Analytics to create anomaly detection models here:
Key Concepts in Trendz Anomaly Detection
In Trendz, anomaly detection is based on two core metrics:
-
Anomaly Score
A numeric value representing how far a data segment deviates from expected (normal) behavior. Think of it as measuring the intensity of the anomaly. -
Anomaly Score Index
A composite metric that combines anomaly score with the duration of the anomaly. It helps prioritize anomalies that may have a greater impact over time.
Real-World Example: Pump Vibration Analysis
Let’s explore a real-world example showing pump vibrations right after startup:
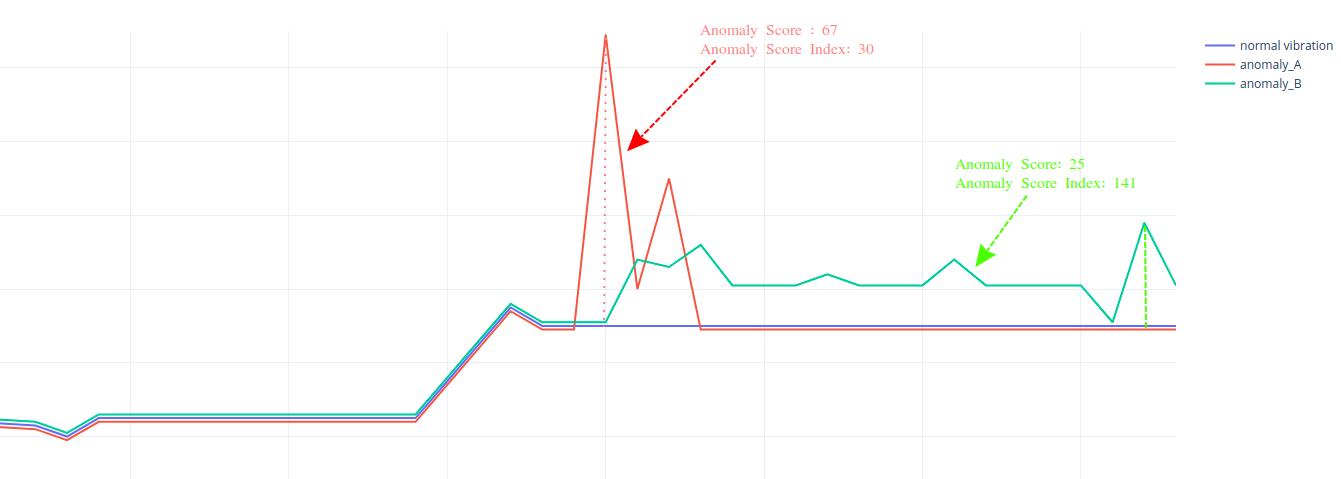
- Anomaly A
- Characterized by a sharp vibration spike lasting ~5 seconds.
- Results in a high anomaly score due to the sudden deviation.
- Since it’s short-lived, its score index remains low.
- Anomaly B
- Shows a longer-lasting deviation without large spikes.
- The anomaly score is lower, but the score index is higher due to extended duration.
- This suggests a greater long-term impact on pump health.
While Anomaly A may appear more critical at first glance due to its spike, Anomaly B is likely more important to investigate due to its prolonged effect - this is exactly what the Anomaly Score Index helps reveal.
- Use Anomaly Score to detect sharp, short-term deviations.
- Use Anomaly Score Index to surface sustained anomalies that may cause greater damage over time.
Supervised vs Unsupervised Anomaly Detection
-
Supervised Anomaly Detection:
Requires labeled datasets where normal and anomalous segments are identified in advance.
Models learn to classify data points based on these labels. Common algorithms include KNN, SVM, Logistic Regression, Decision Trees, and LSTM.
Limitations: Needs extensive labeled data, struggles to detect new anomaly types not present in training. -
Unsupervised Anomaly Detection:
Does not require labeled data. Models learn normal behavior patterns by grouping similar data segments into clusters and detect anomalies as points that deviate significantly from these clusters.
Common algorithms include K-Means, DBSCAN, Gaussian Mixture Models, and Hierarchical Clustering.
Advantages: Automatically detects unknown anomaly types, suitable for real-world scenarios with limited labeled data.
Trendz currently supports only unsupervised machine learning algorithms for anomaly detection, leveraging clustering-based methods to detect anomalies in time-series data.
How Unsupervised Anomaly Detection Works in Trendz
- Collect and segment telemetry data.
- Normalize and preprocess data.
- Extract features describing each segment.
- Cluster segments into groups representing normal behavior.
- Compute anomaly scores based on distance from cluster centroids.
- Apply model in real-time for continuous anomaly detection.
Tabs Overview
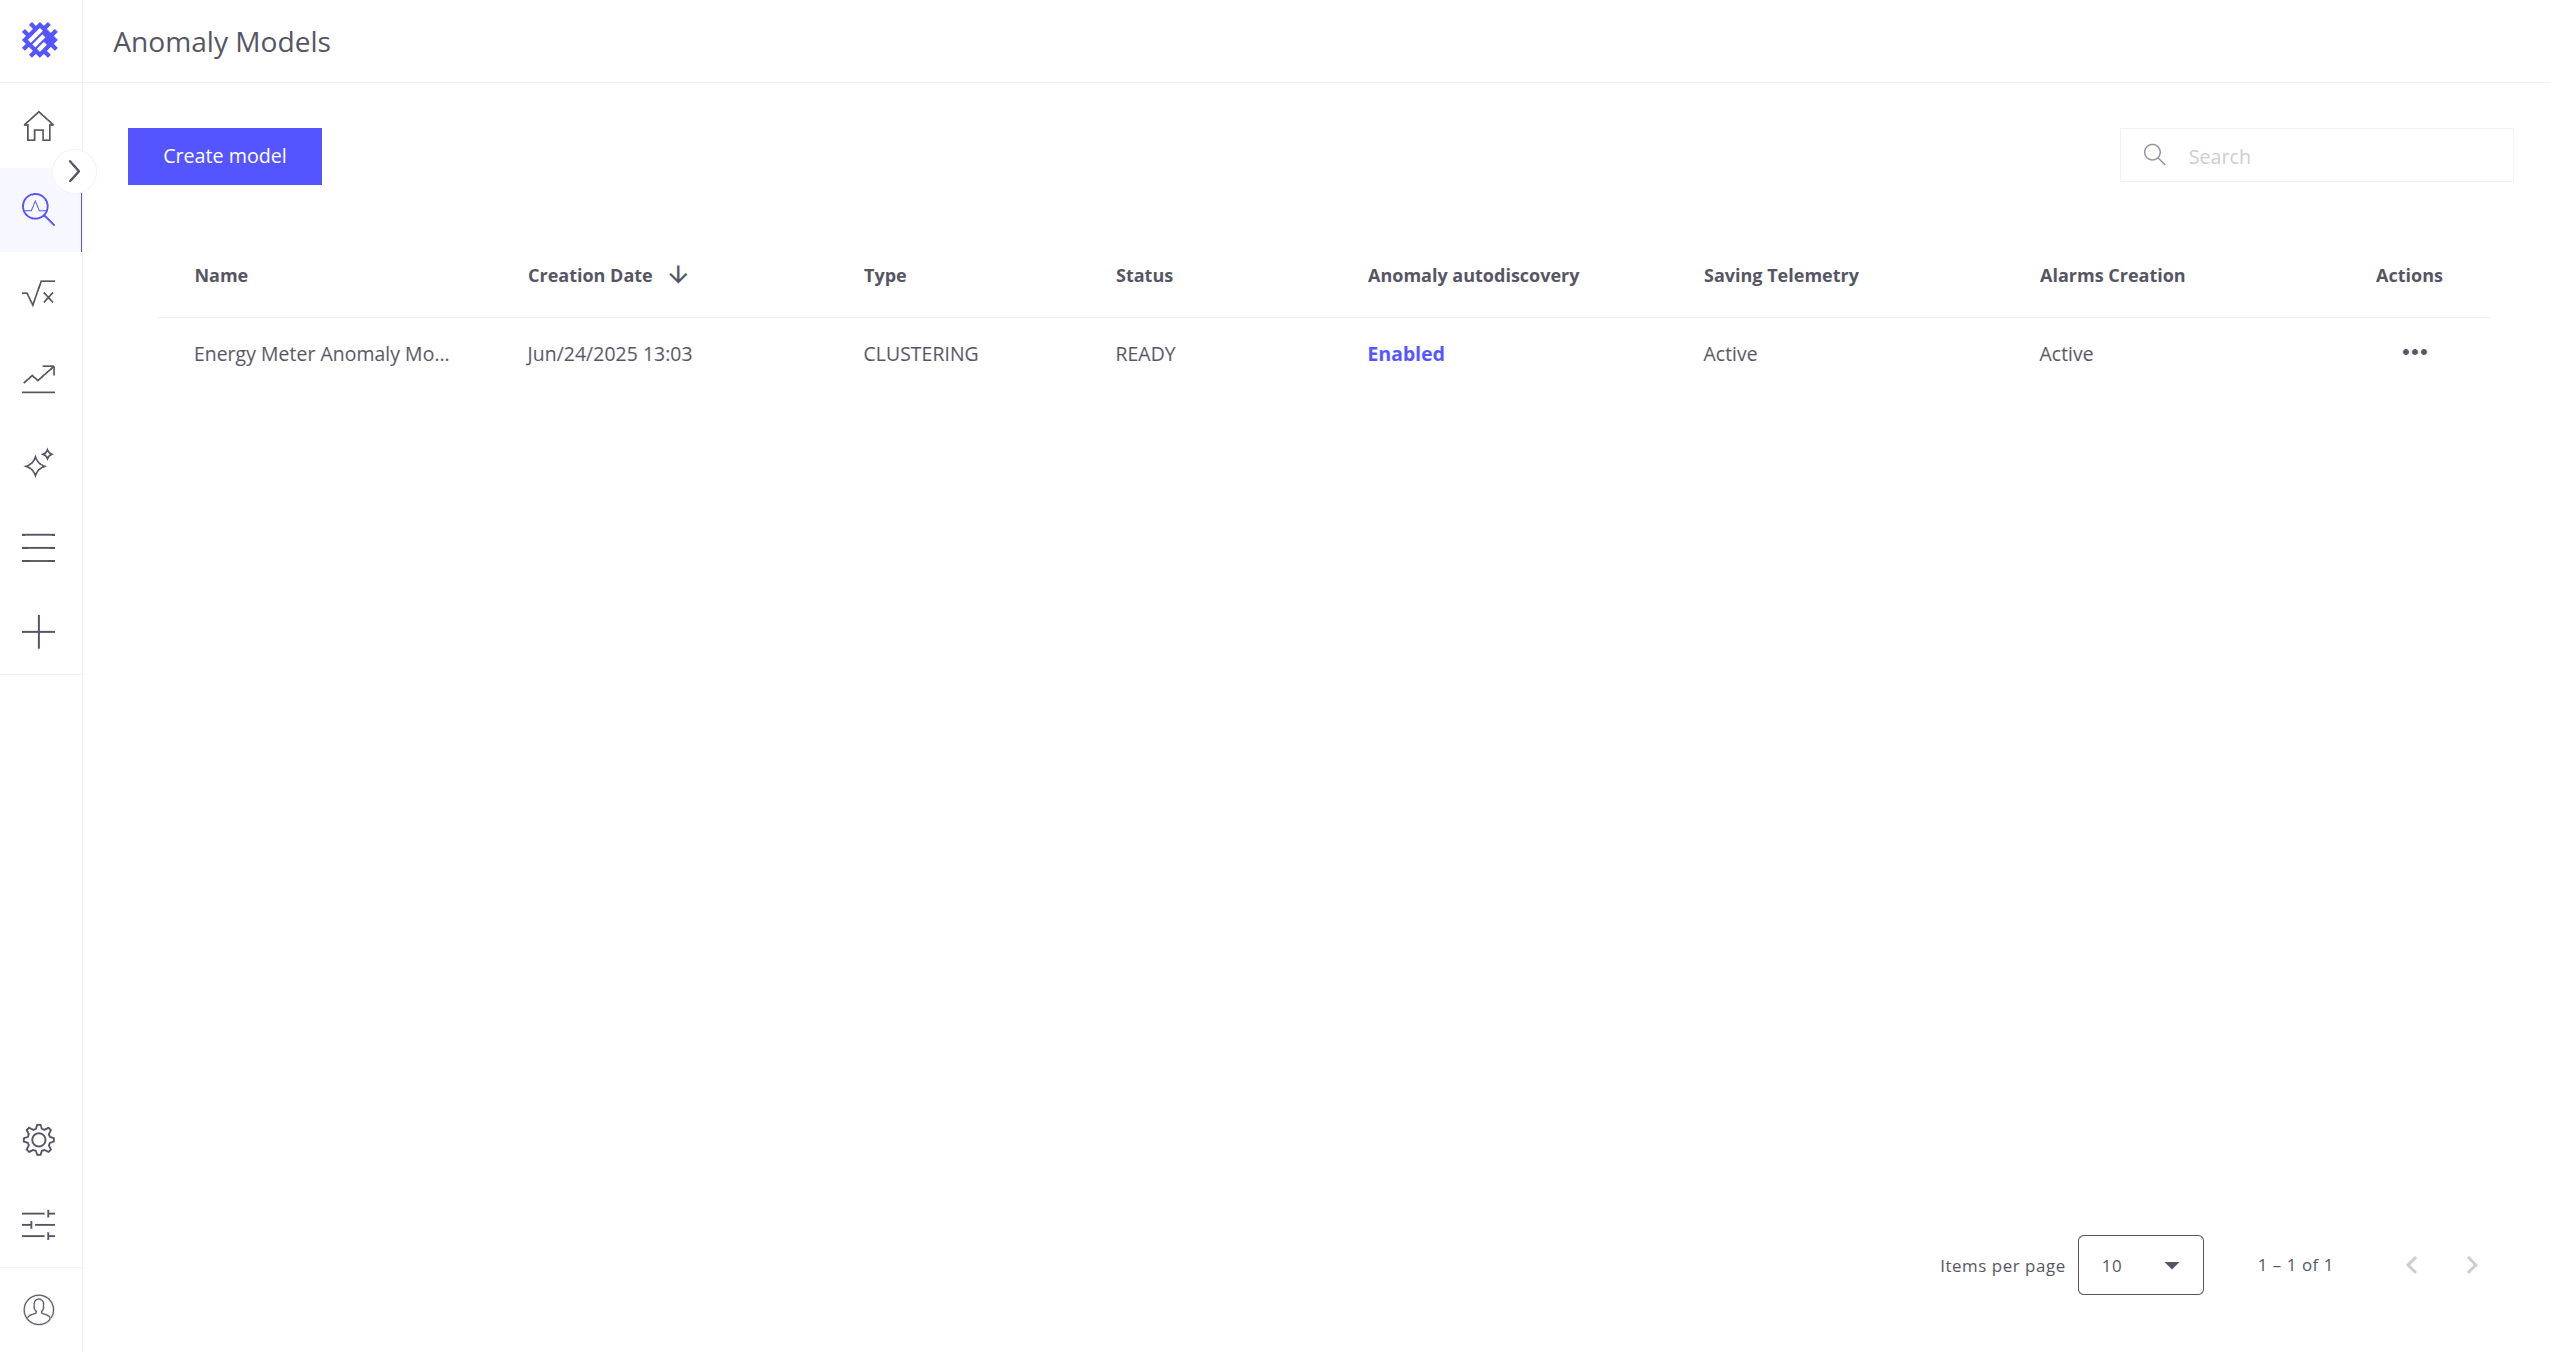
Anomaly Models Tab
To access the Anomaly Models page, click on the icon labeled Anomaly Models located on the left side of the workspace.
This page displays key characteristics of each model:
- Creation Date
- Name
- Type – Currently, only CLUSTERING is supported
- Status:
- READY – The model is ready for anomaly detection
- QUEUED – Waiting for the training job to start
- IN PROGRESS – Currently being trained
- CANCELLED – Training was canceled; needs rebuilding
- FAILED – Training failed; needs rebuilding
- Anomaly autodiscovery – Read more here
- Saving telemetry – Read more here
- Alarm auto creation – Read more here
Available Actions:
- Create Model
- Click the Create model button in the top-right corner of the screen to create a new anomaly model.
- You will be navigated to the Input tab to configure the model.
- Read more about the Input tab here
- Check Model
- Click on any model row to open and inspect it.
- This will redirect you to the Input tab.
- Read more about the Input tab here
- Delete Model
- Click the three-dot menu in the Actions column and select Delete.
- Confirm the deletion in the confirmation dialog.
- Rename Model
- Click the three-dot menu in the Actions column and select Rename.
- A text field will appear in the Name column.
- Type the new name and press Enter to save changes.
Input Tab
The Input tab allows you to manage and configure core aspects of your anomaly model. You can:
- Rename the Model
- Click the pencil icon next to the model name, enter a new name, and press Enter.
- To apply the new name, click Save Model. A rebuild is not required for this change.
- Revert Model
- Click the Revert button in the upper-right corner of the screen to discard unsaved changes and restore the last saved state of the model.
- Configure Jobs
- Job configuration is available only for models in the READY state.
- Click the Jobs button in the upper section of the screen to open the Jobs configuration popup.
- Here, you can configure the refresh job (read more about refresh jobs here).
- Change Properties
- You can update various anomaly model properties in the Input tab (read more about model properties here).
- To apply changes, click Save Model. A rebuild is not required unless you change:
- Anomaly Model Name
- Telemetry key
- Telemetry storage frequency
- Alarm Configuration
- Save Model
- Use the Save Model button to save changes or initiate a rebuild.
- If a rebuild is necessary, a confirmation popup will appear.
- Caution: Rebuilding the model will delete all existing anomalies and disable the refresh job.

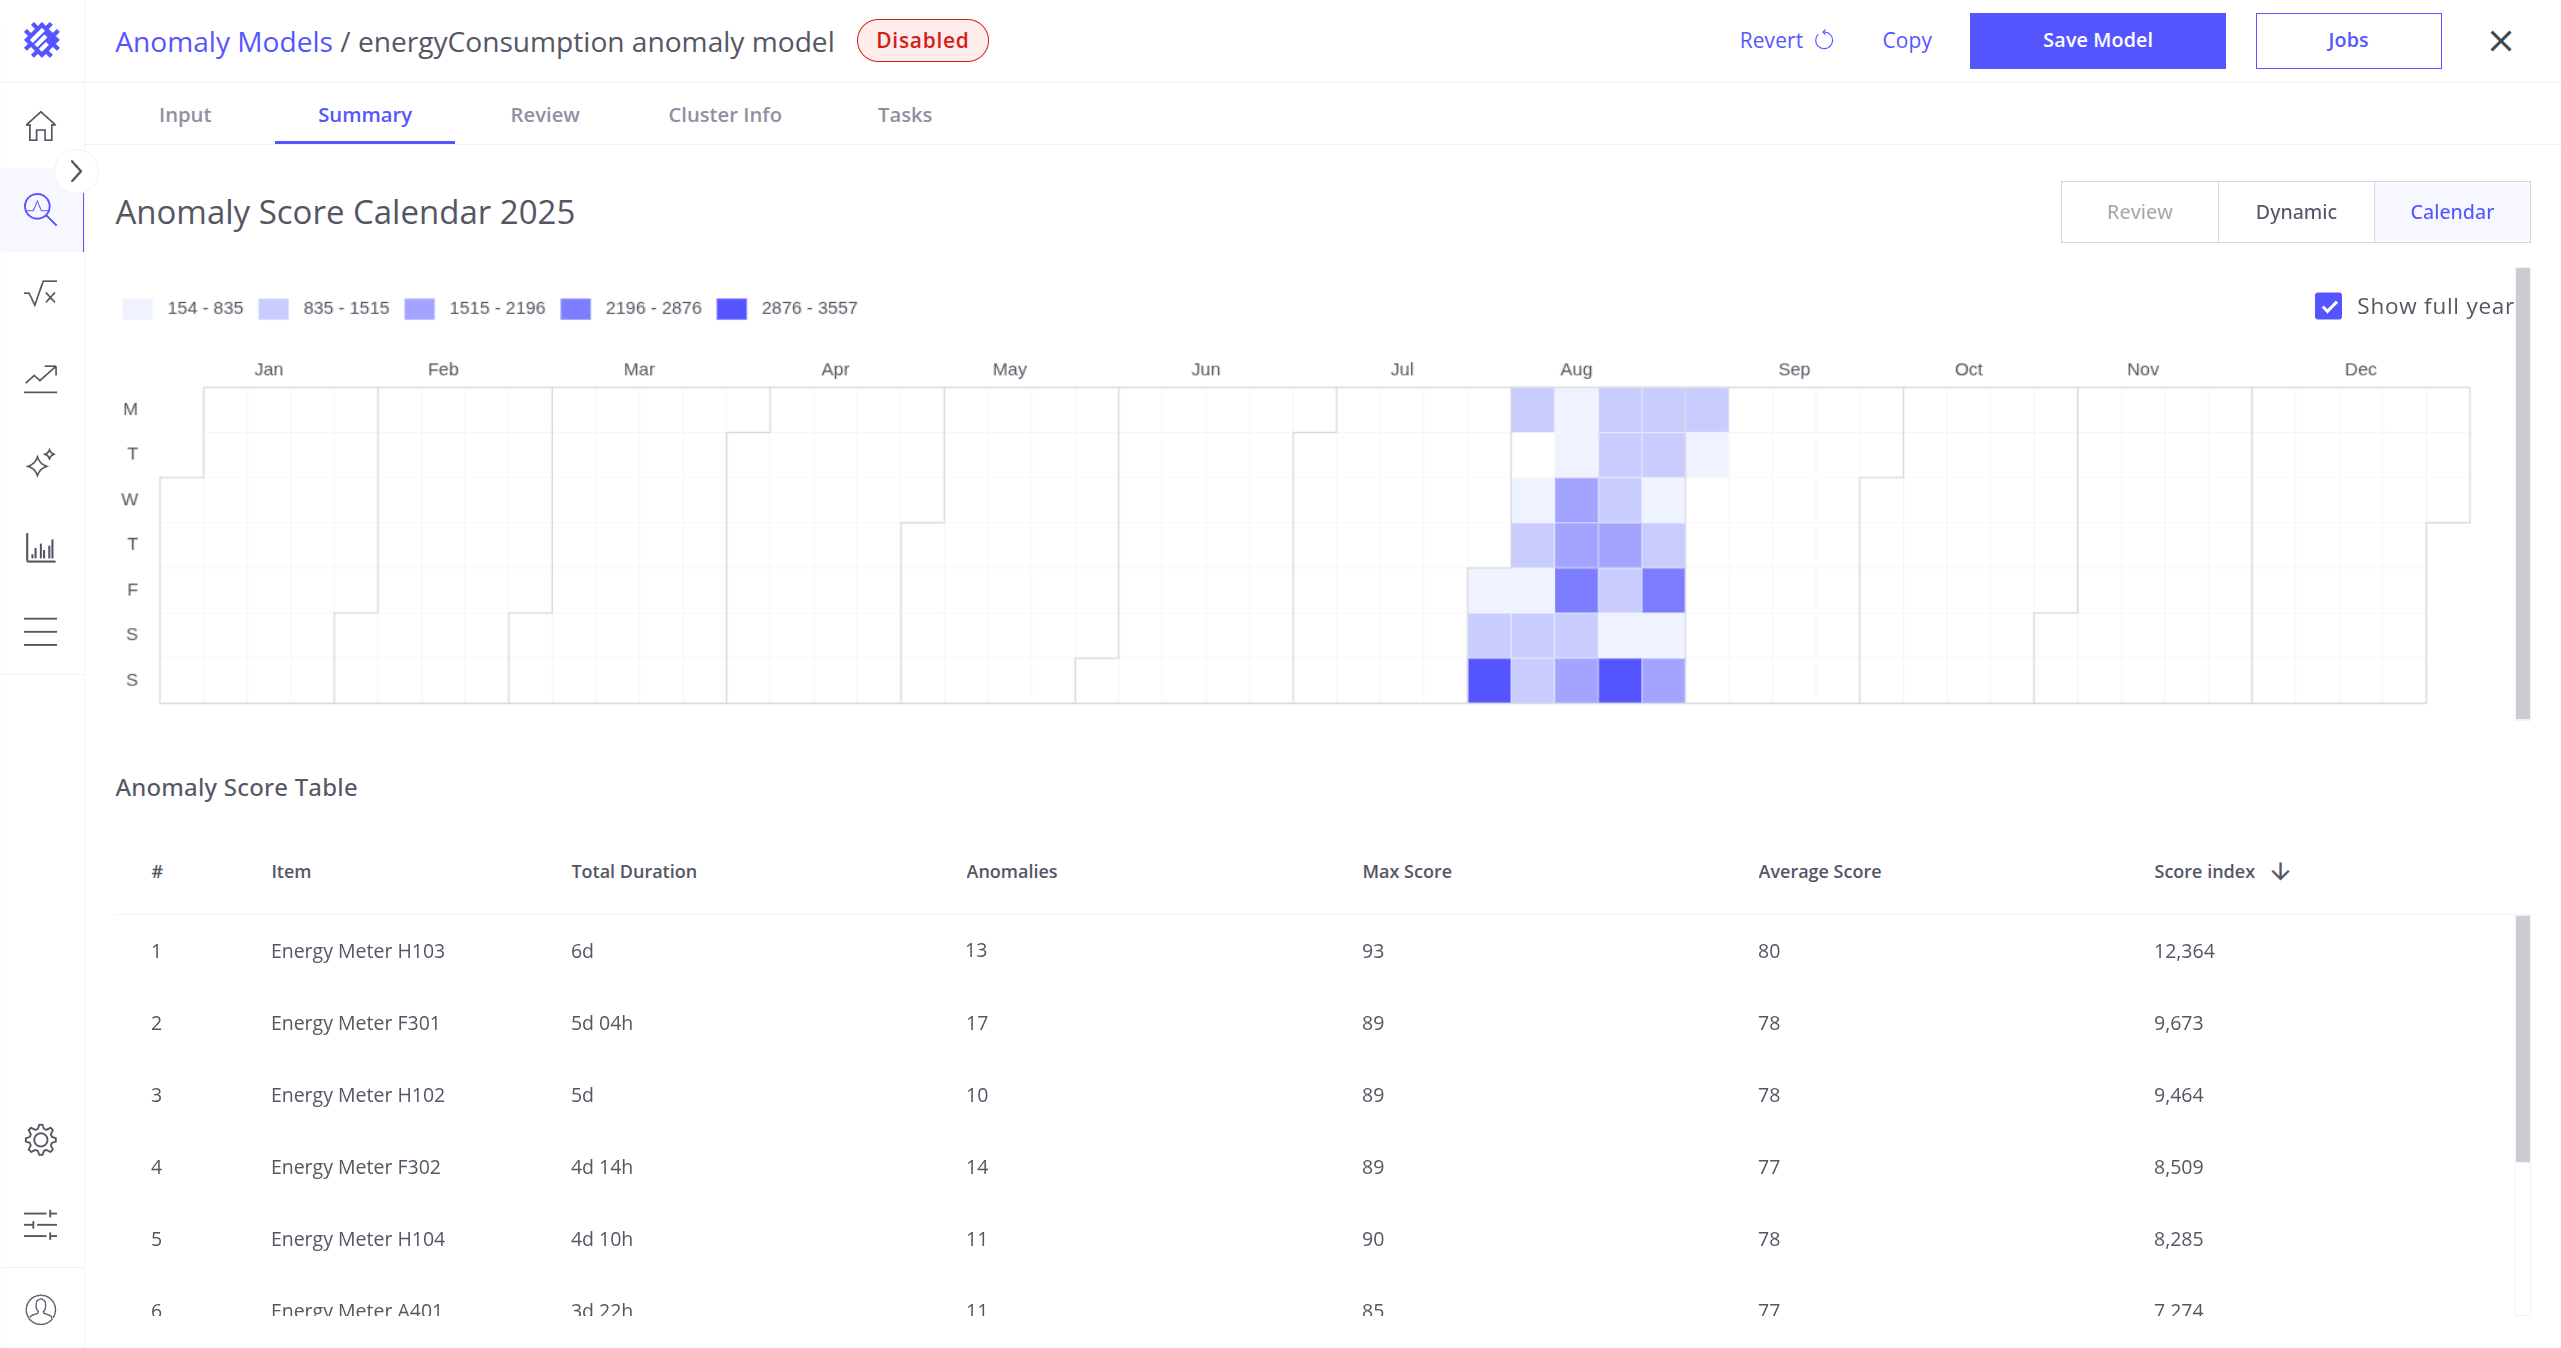
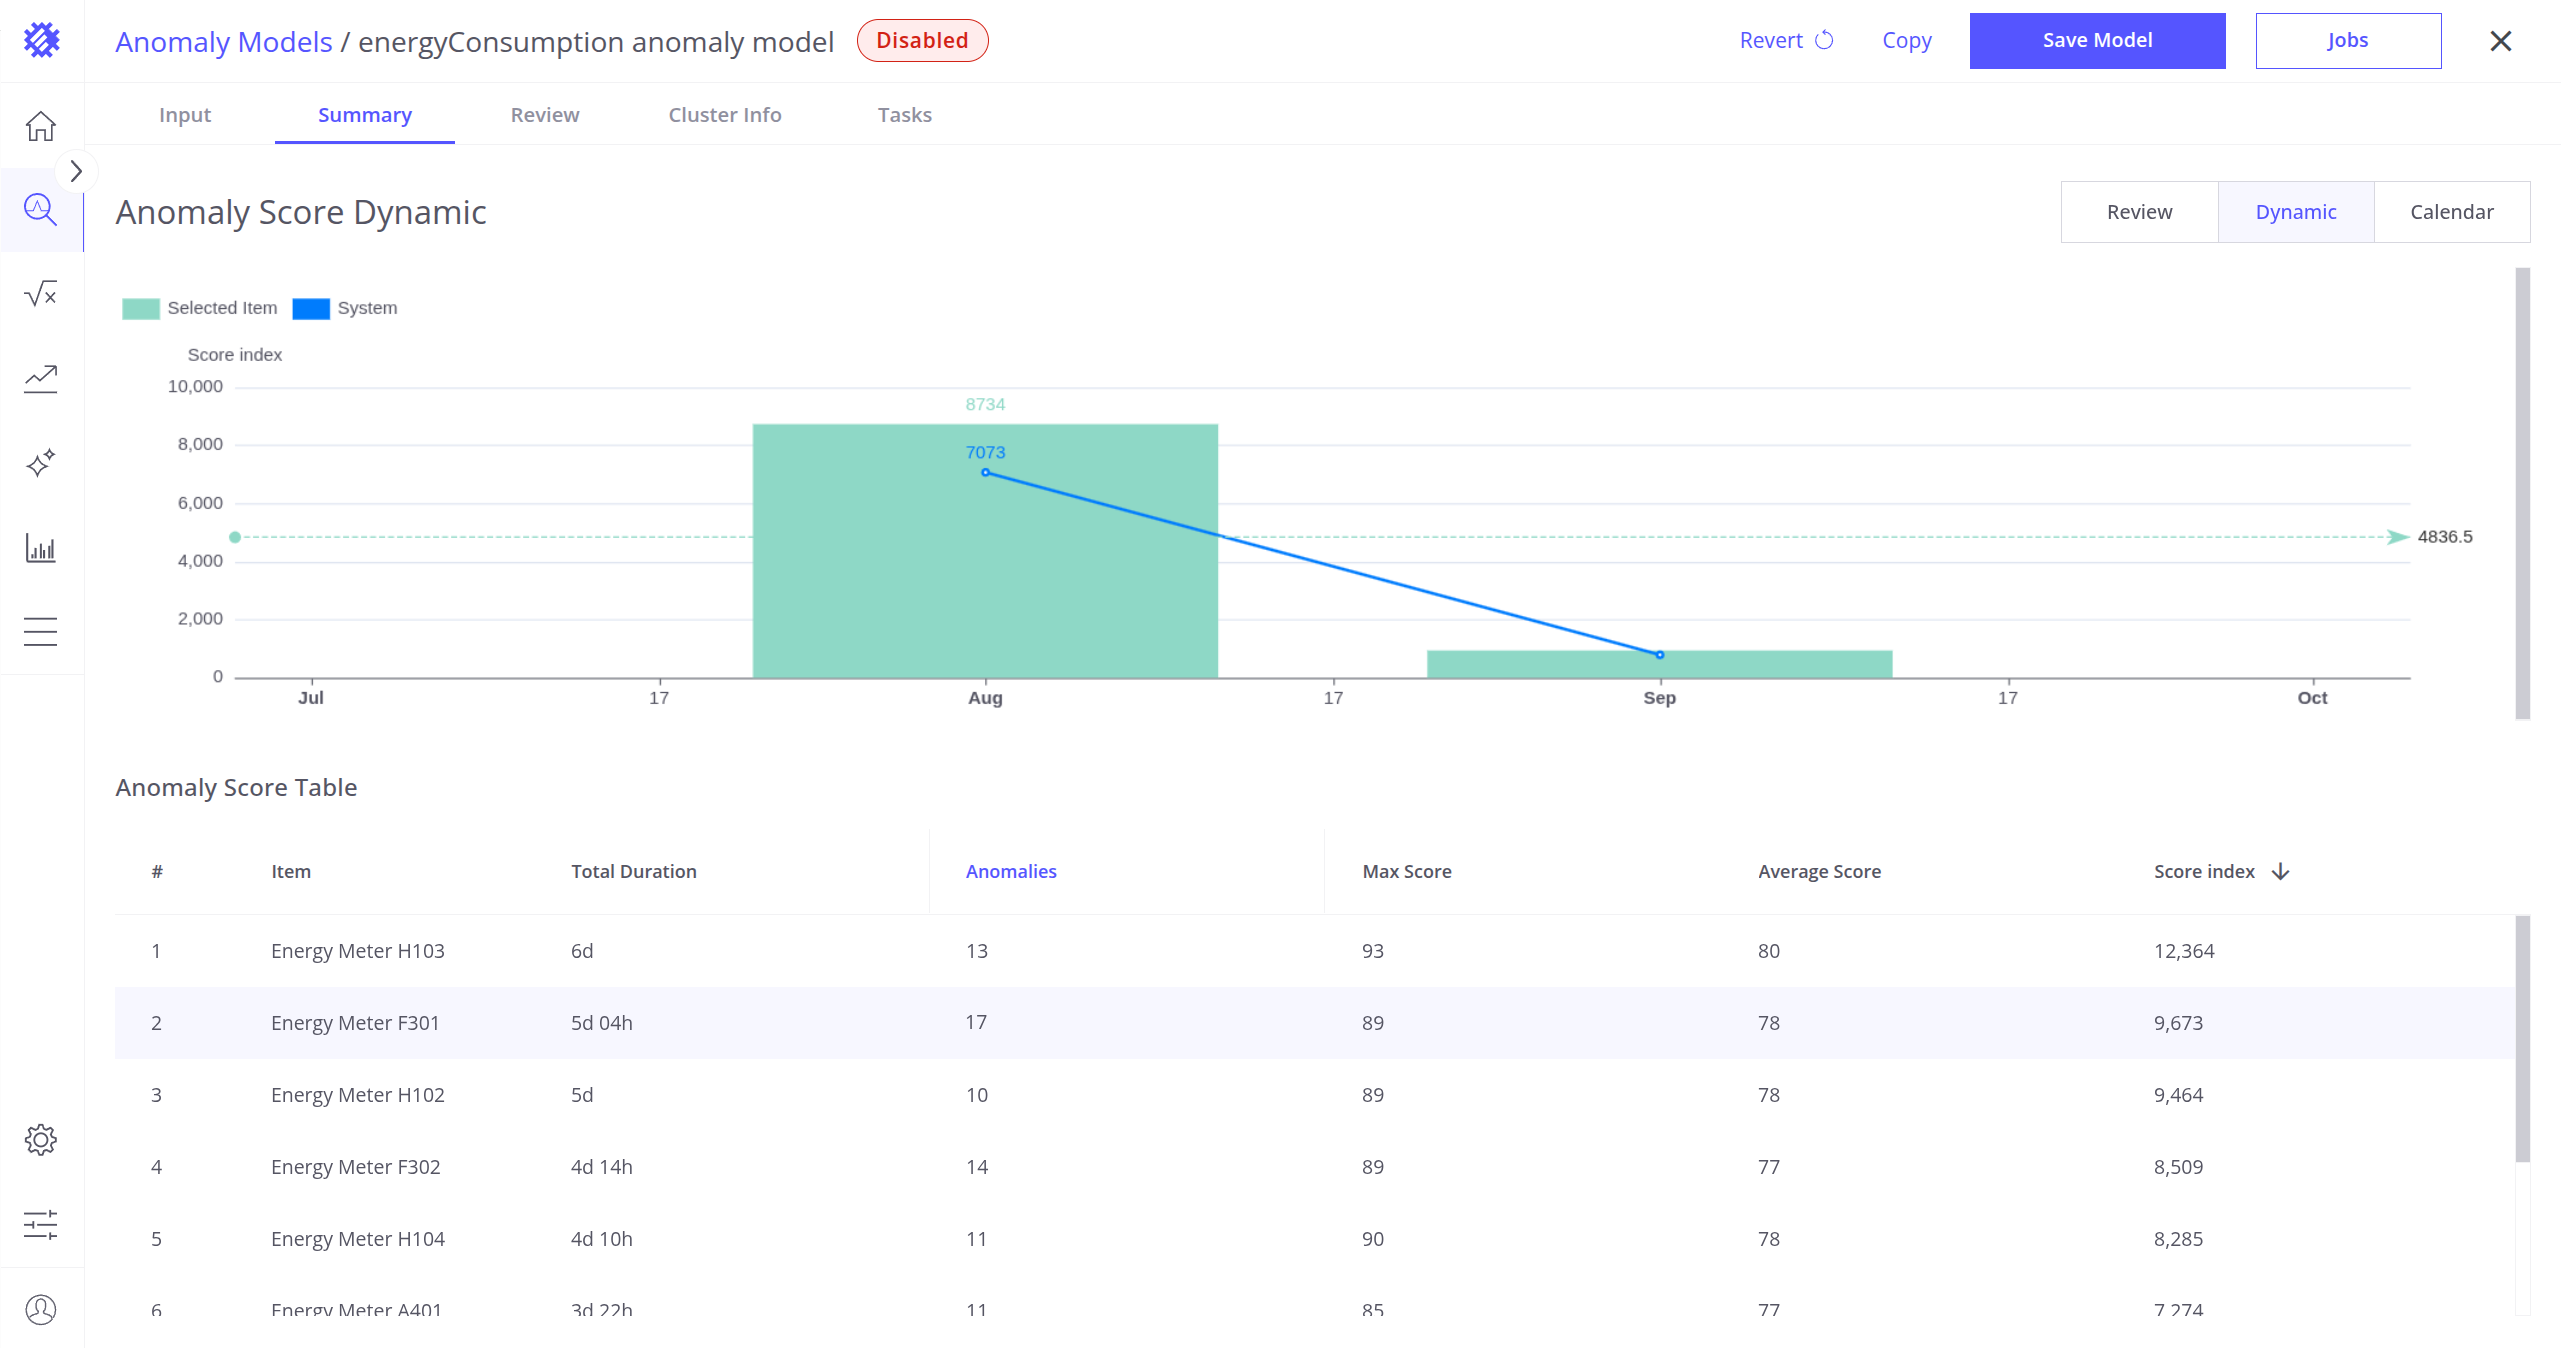
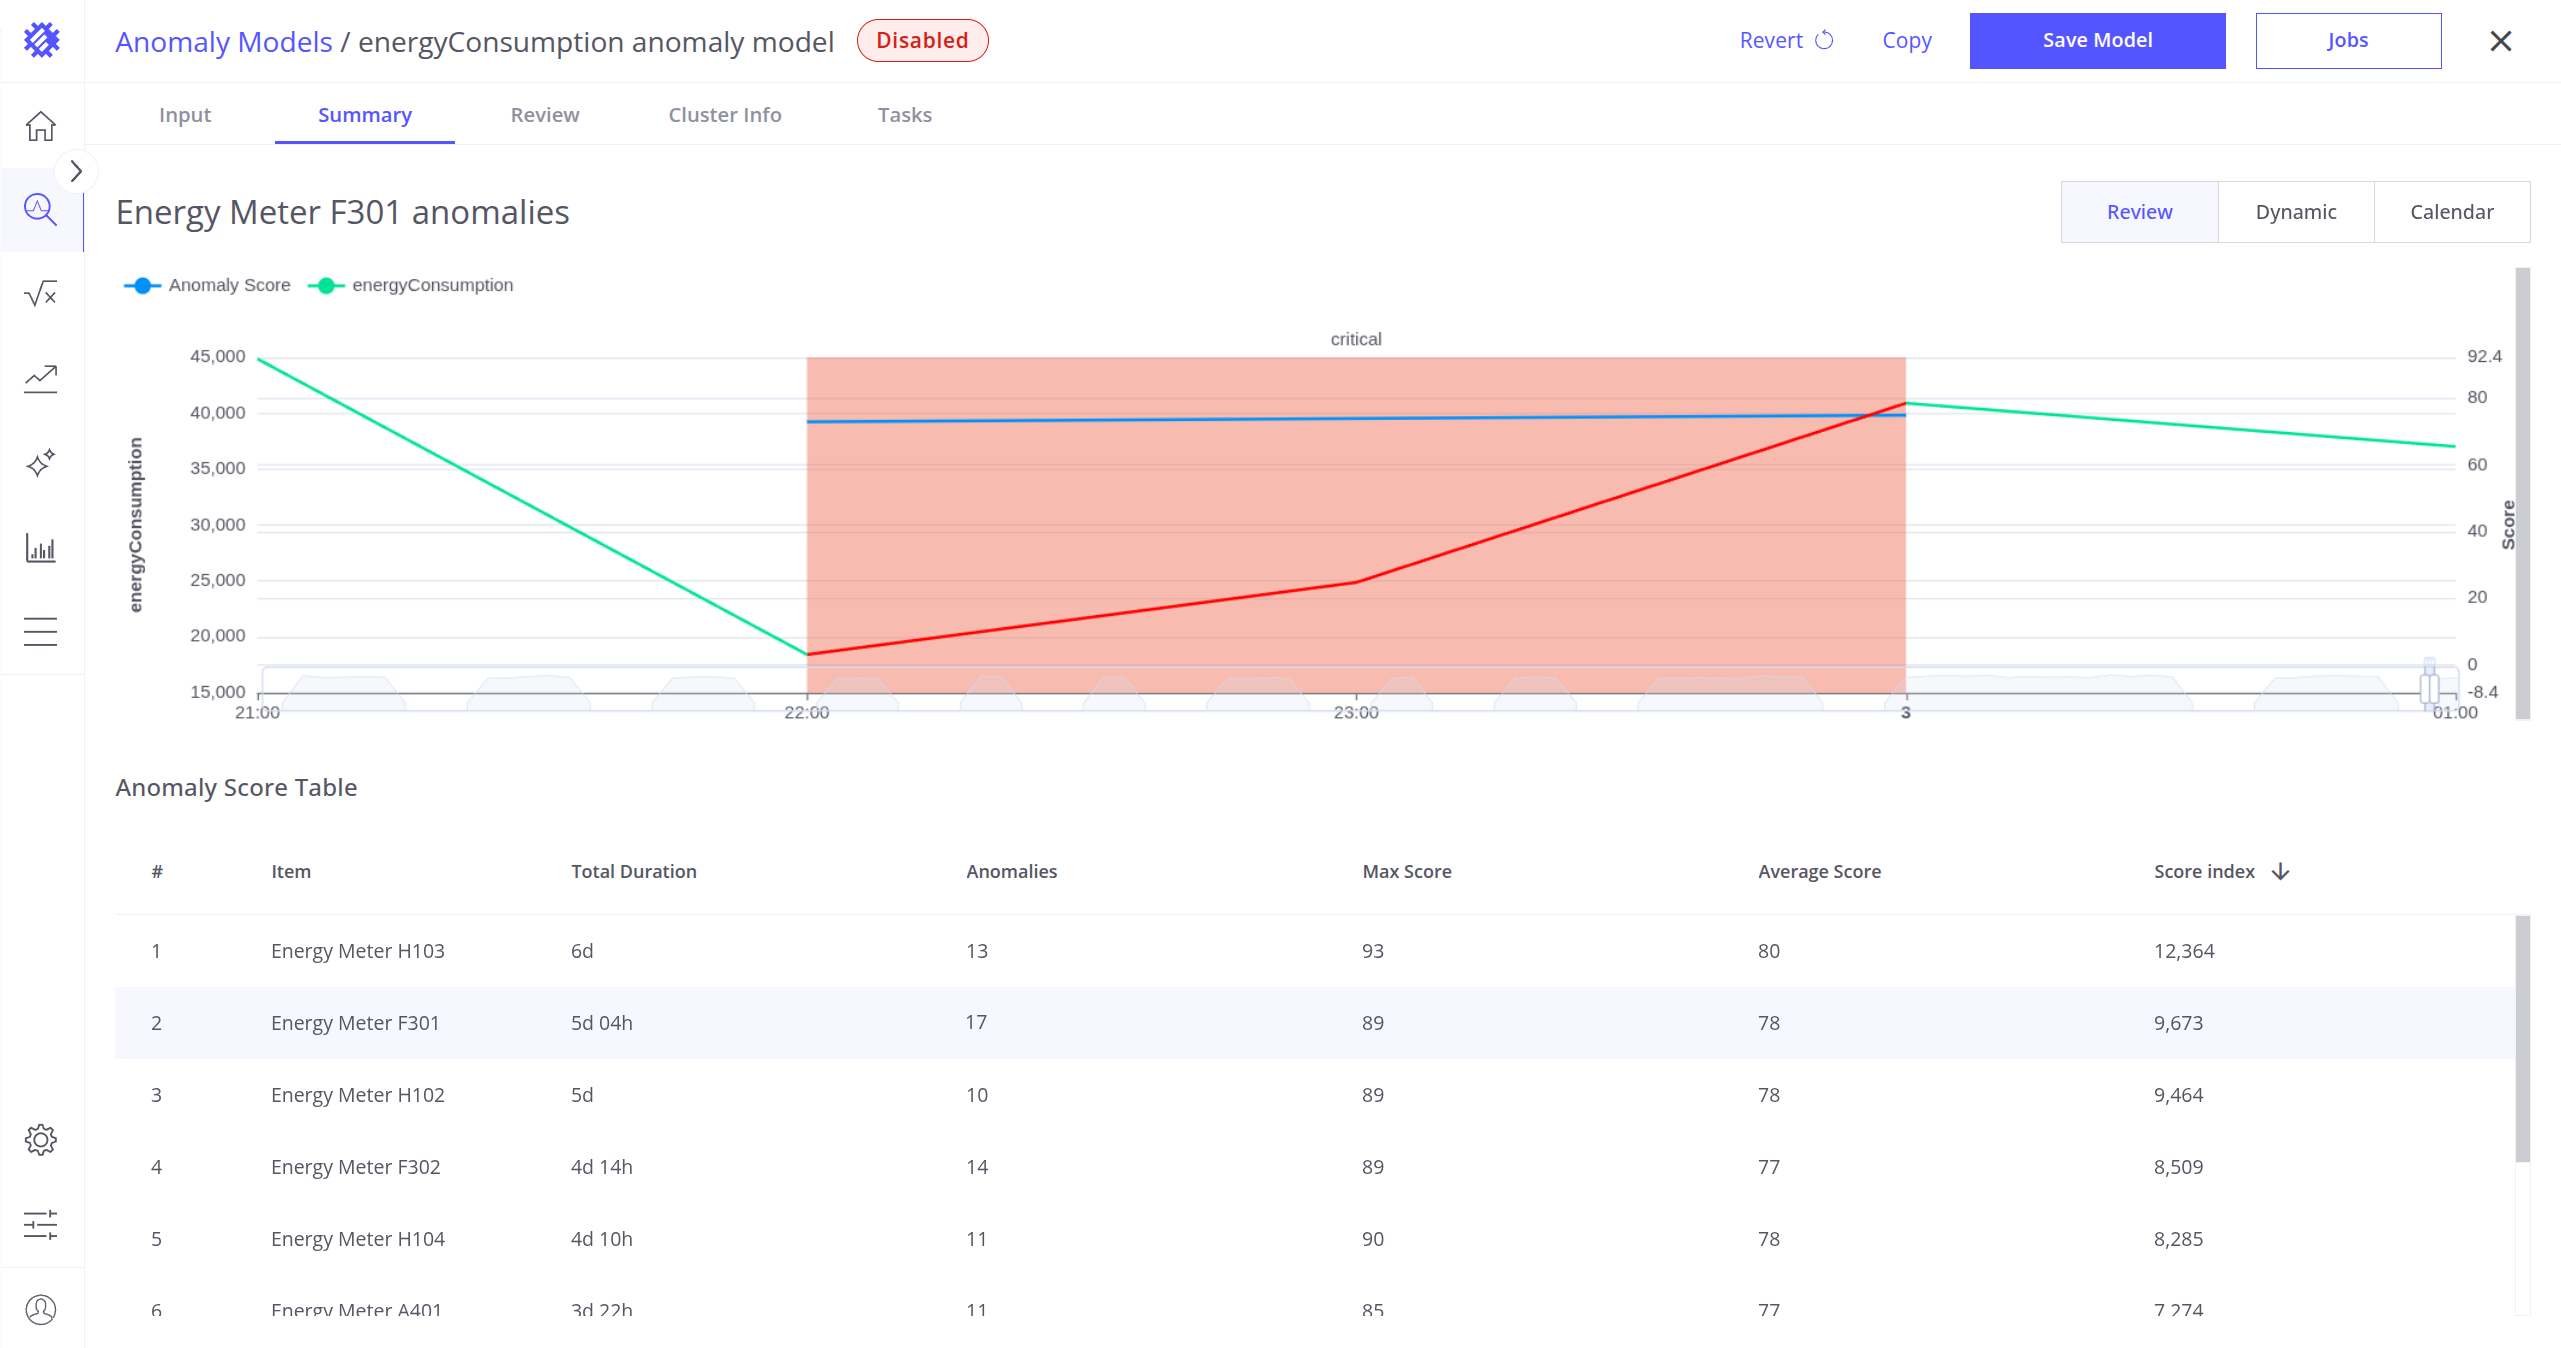
Summary Tab
The Summary tab provides an overview of anomalies grouped by device.
You can:
- View anomaly statistics for all devices or a specific device.
- Select or deselect devices using the table below the graph.
- Choose the display mode using the Review, Dynamic, and Calendar buttons located in the upper-right corner of the screen.
Available Modes
- Calendar Mode (All Devices):
- Displays the total anomaly index per day across all items.
- Only months with anomalies are shown by default.
- Enable the Full Range toggle to view the entire year.
- Dynamic Mode (Selected Device Only):
- Visualizes monthly distribution of anomalies for the selected item.
- Green bars represent the total anomaly score index for the current device.
- The blue line represents the average total score index per month for all devices.
- Review Mode (Selected Device Only):
- Shows the latest detected anomaly.
- You can zoom out to explore the full history of anomalies discovered on the current device.
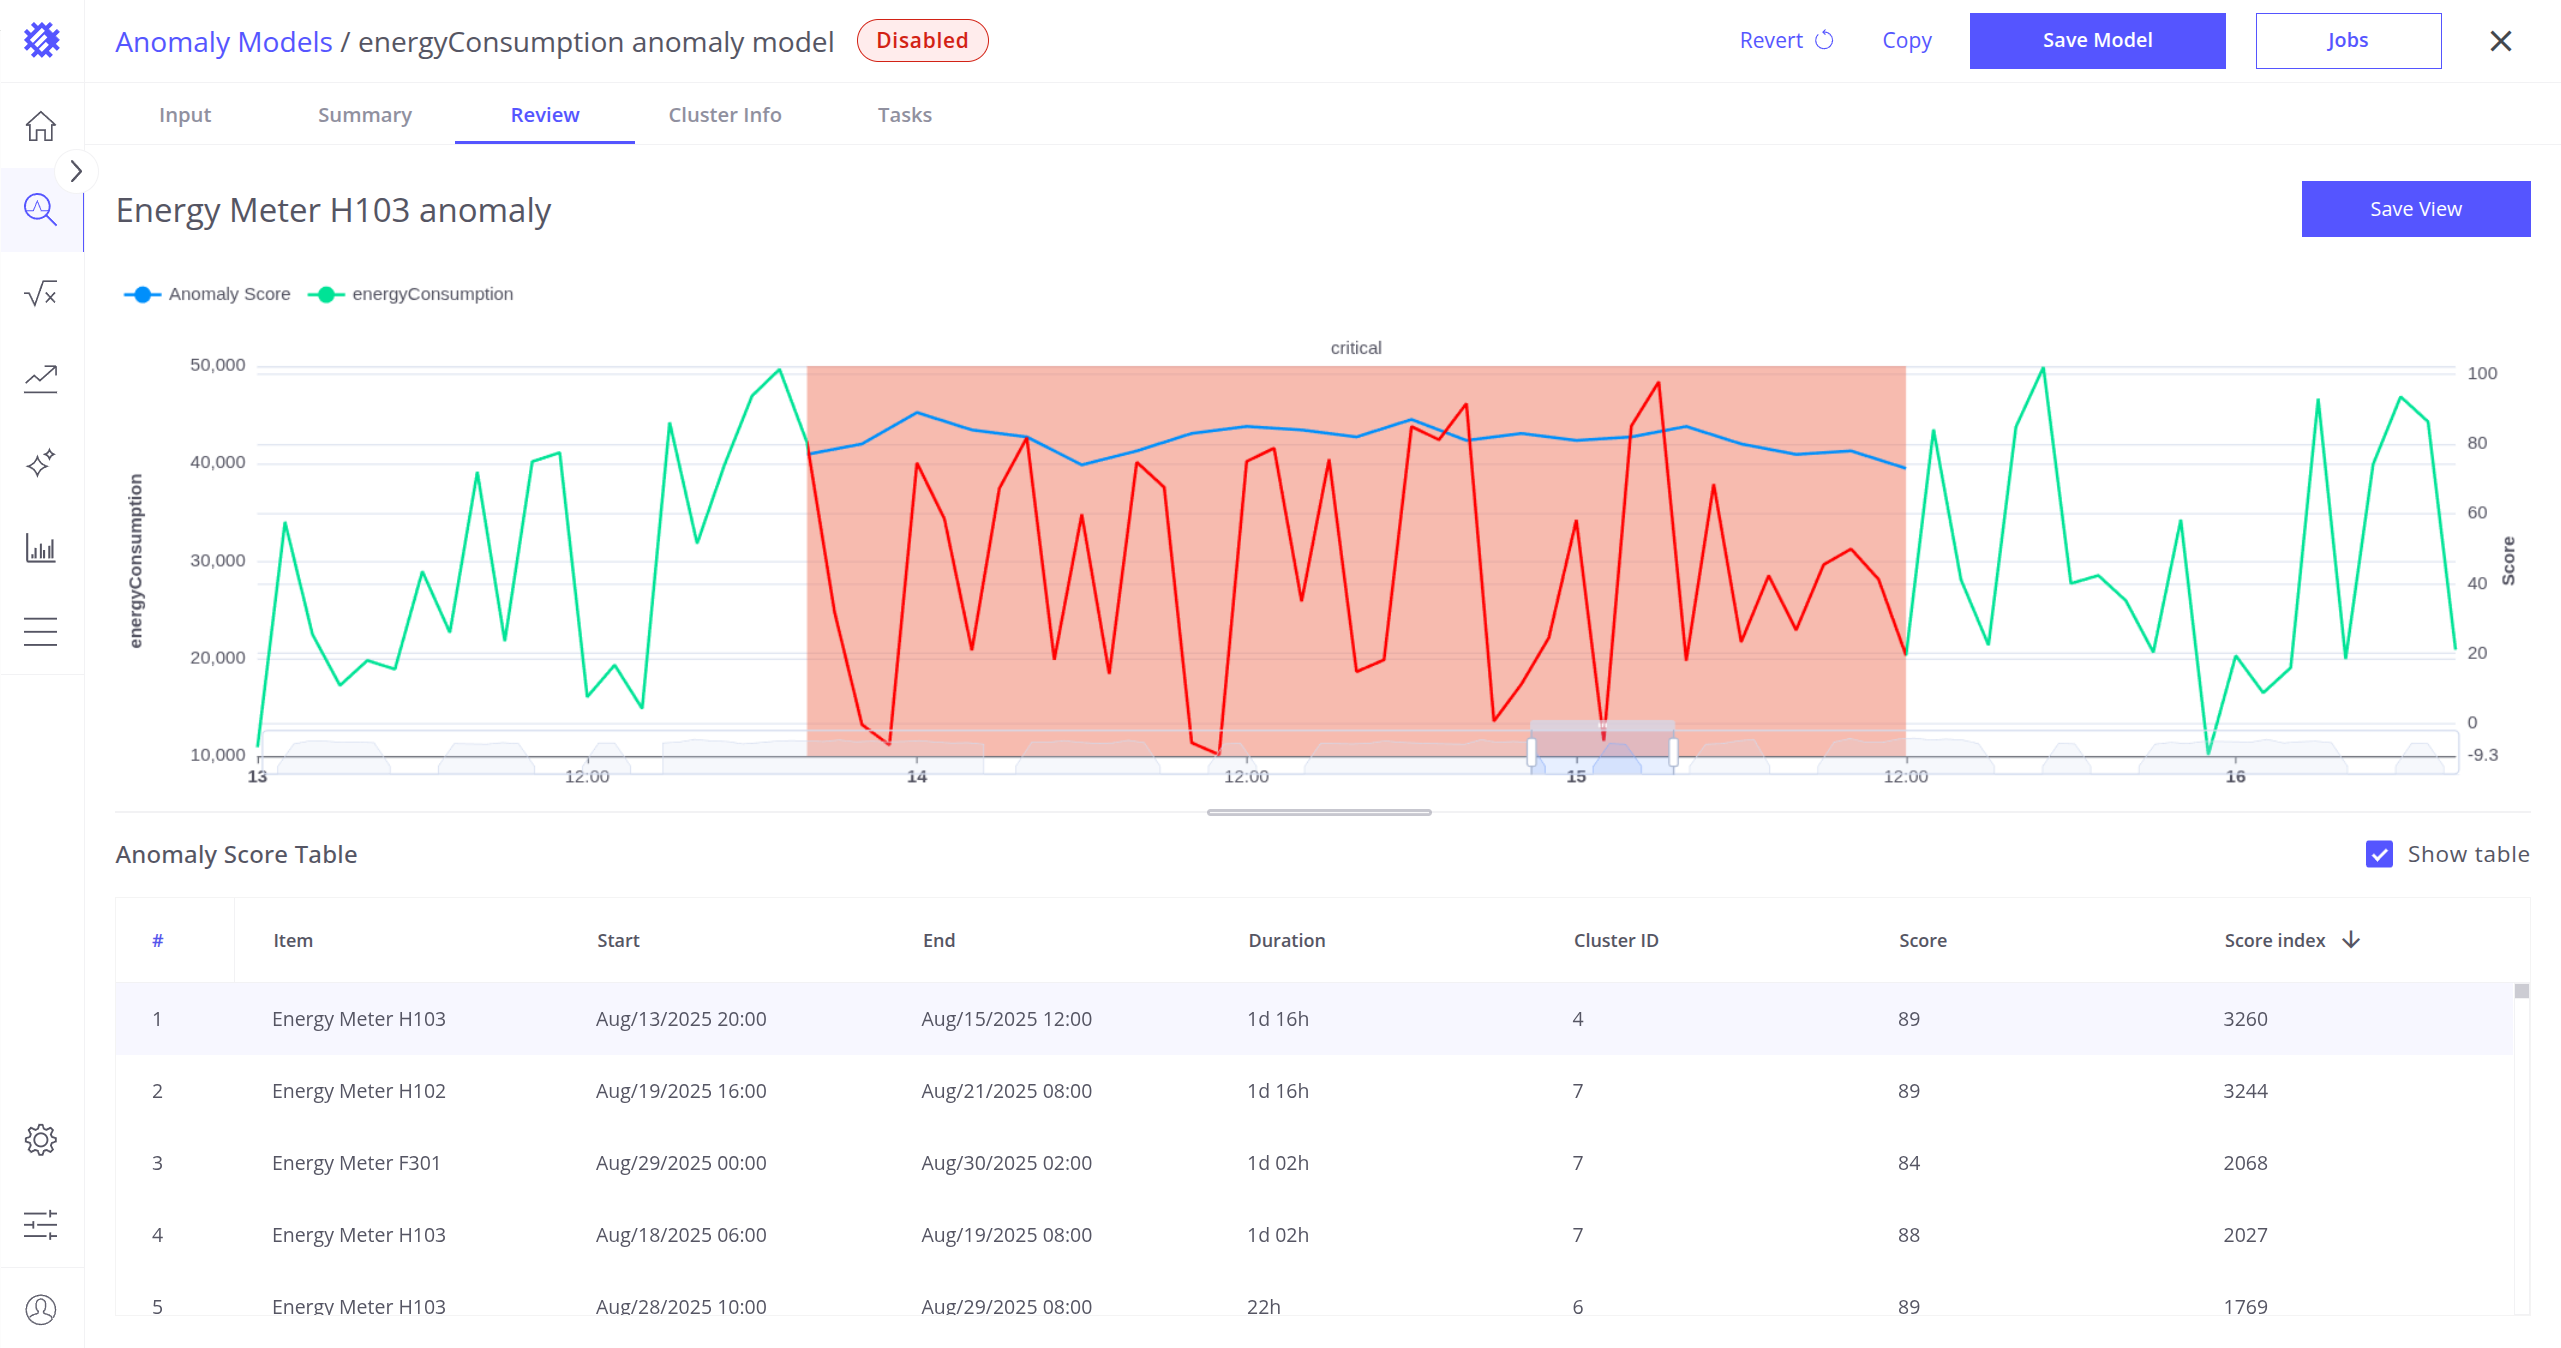
Review Tab
The Review tab allows you to inspect all anomalies detected during the build, refresh, or reprocess operations.
You can use this tab to:
- Validate the anomalies discovered by the anomaly model.
- Fine-tune the model by reviewing results and retraining if necessary.
- Determine optimal thresholds for alarm creation (read more about alarms here).
You can sort anomalies by various fields to better analyze the results:
- Total Duration
- Score
- Score Index
- Item
- End Timestamp
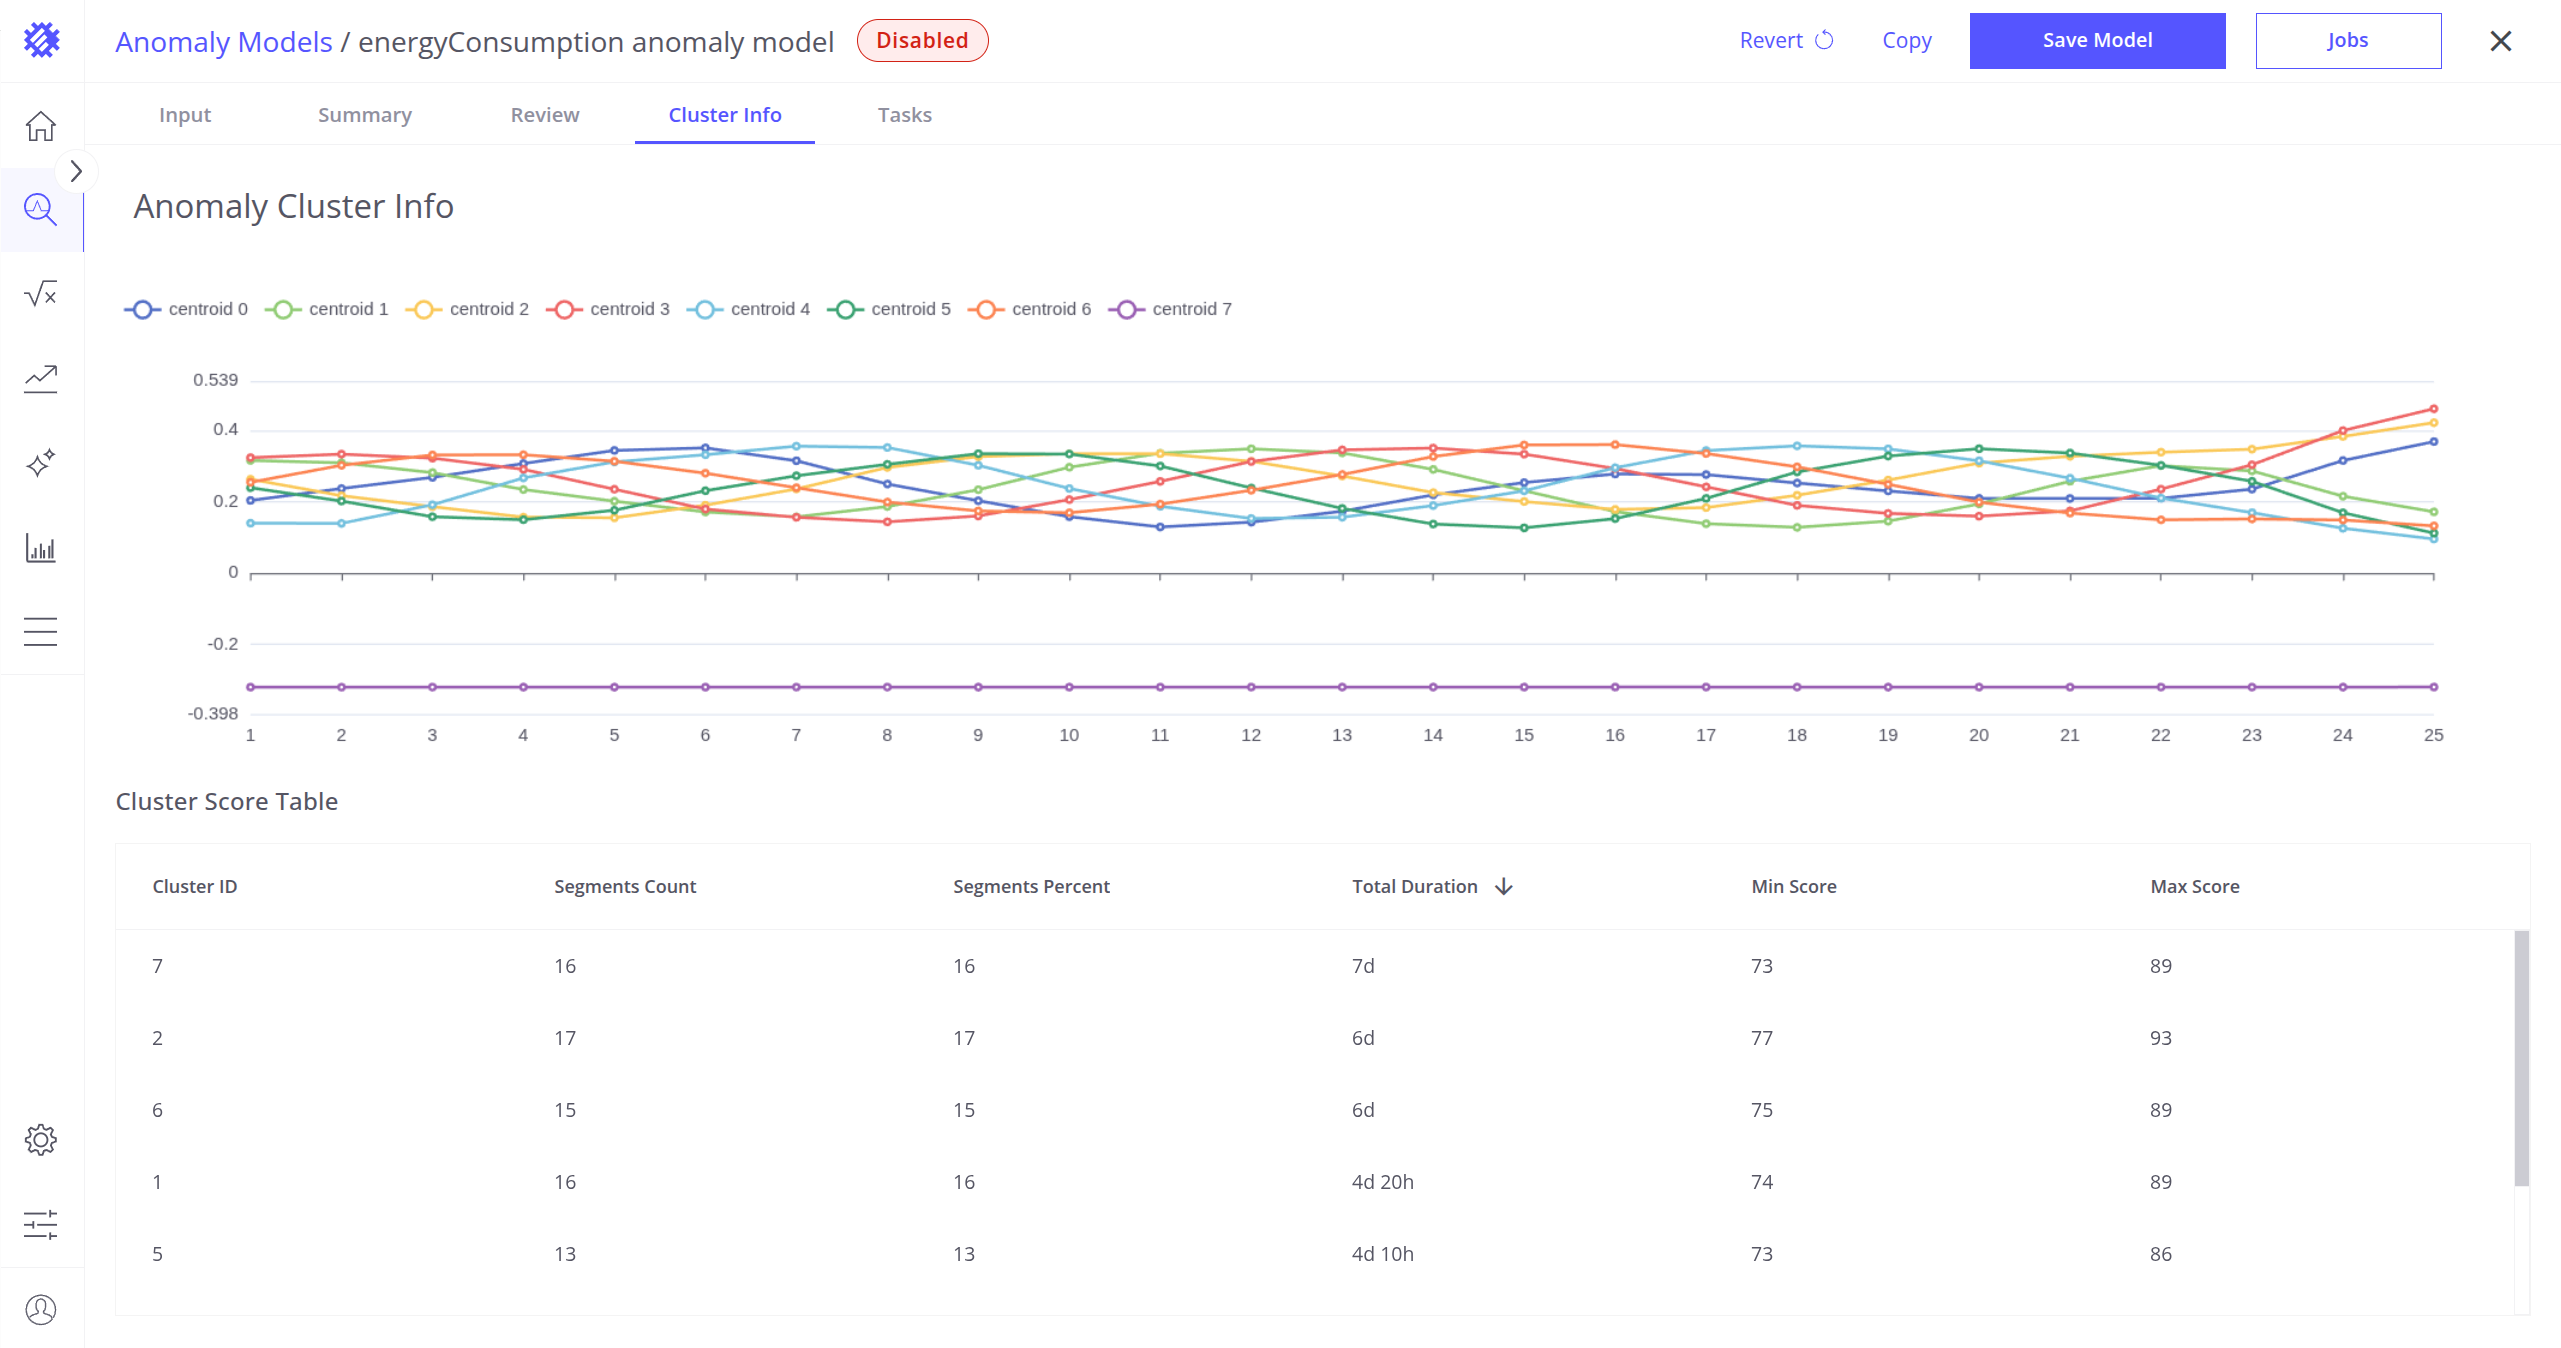
Cluster Info Tab
In this tab, you can validate the clusters that were created during the model build process.
The Cluster Info tab provides insight into how many clusters were formed, what shape or pattern they represent, and how segments were distributed across them.
Cluster Table
At the bottom of the screen, a table is displayed with the following columns:
- Cluster ID – Unique identifier of the cluster.
- Segments Count – Number of anomaly segments that are closest to this cluster.
- Segments Percent – Percentage of anomaly segments that fall into this cluster.
- Total Duration – Combined duration of all anomaly segments that are closest to this cluster.
- Min Score – Minimum anomaly score among segments that are closest to this cluster.
- Max Score – Maximum anomaly score among segments that are closest to this cluster.
Centroid Visualization
At the top of the screen, you can view the centroids of all clusters. Each centroid represents the average pattern of all segments that belong to a cluster. These curves help users understand typical shapes or behaviors captured by each cluster.
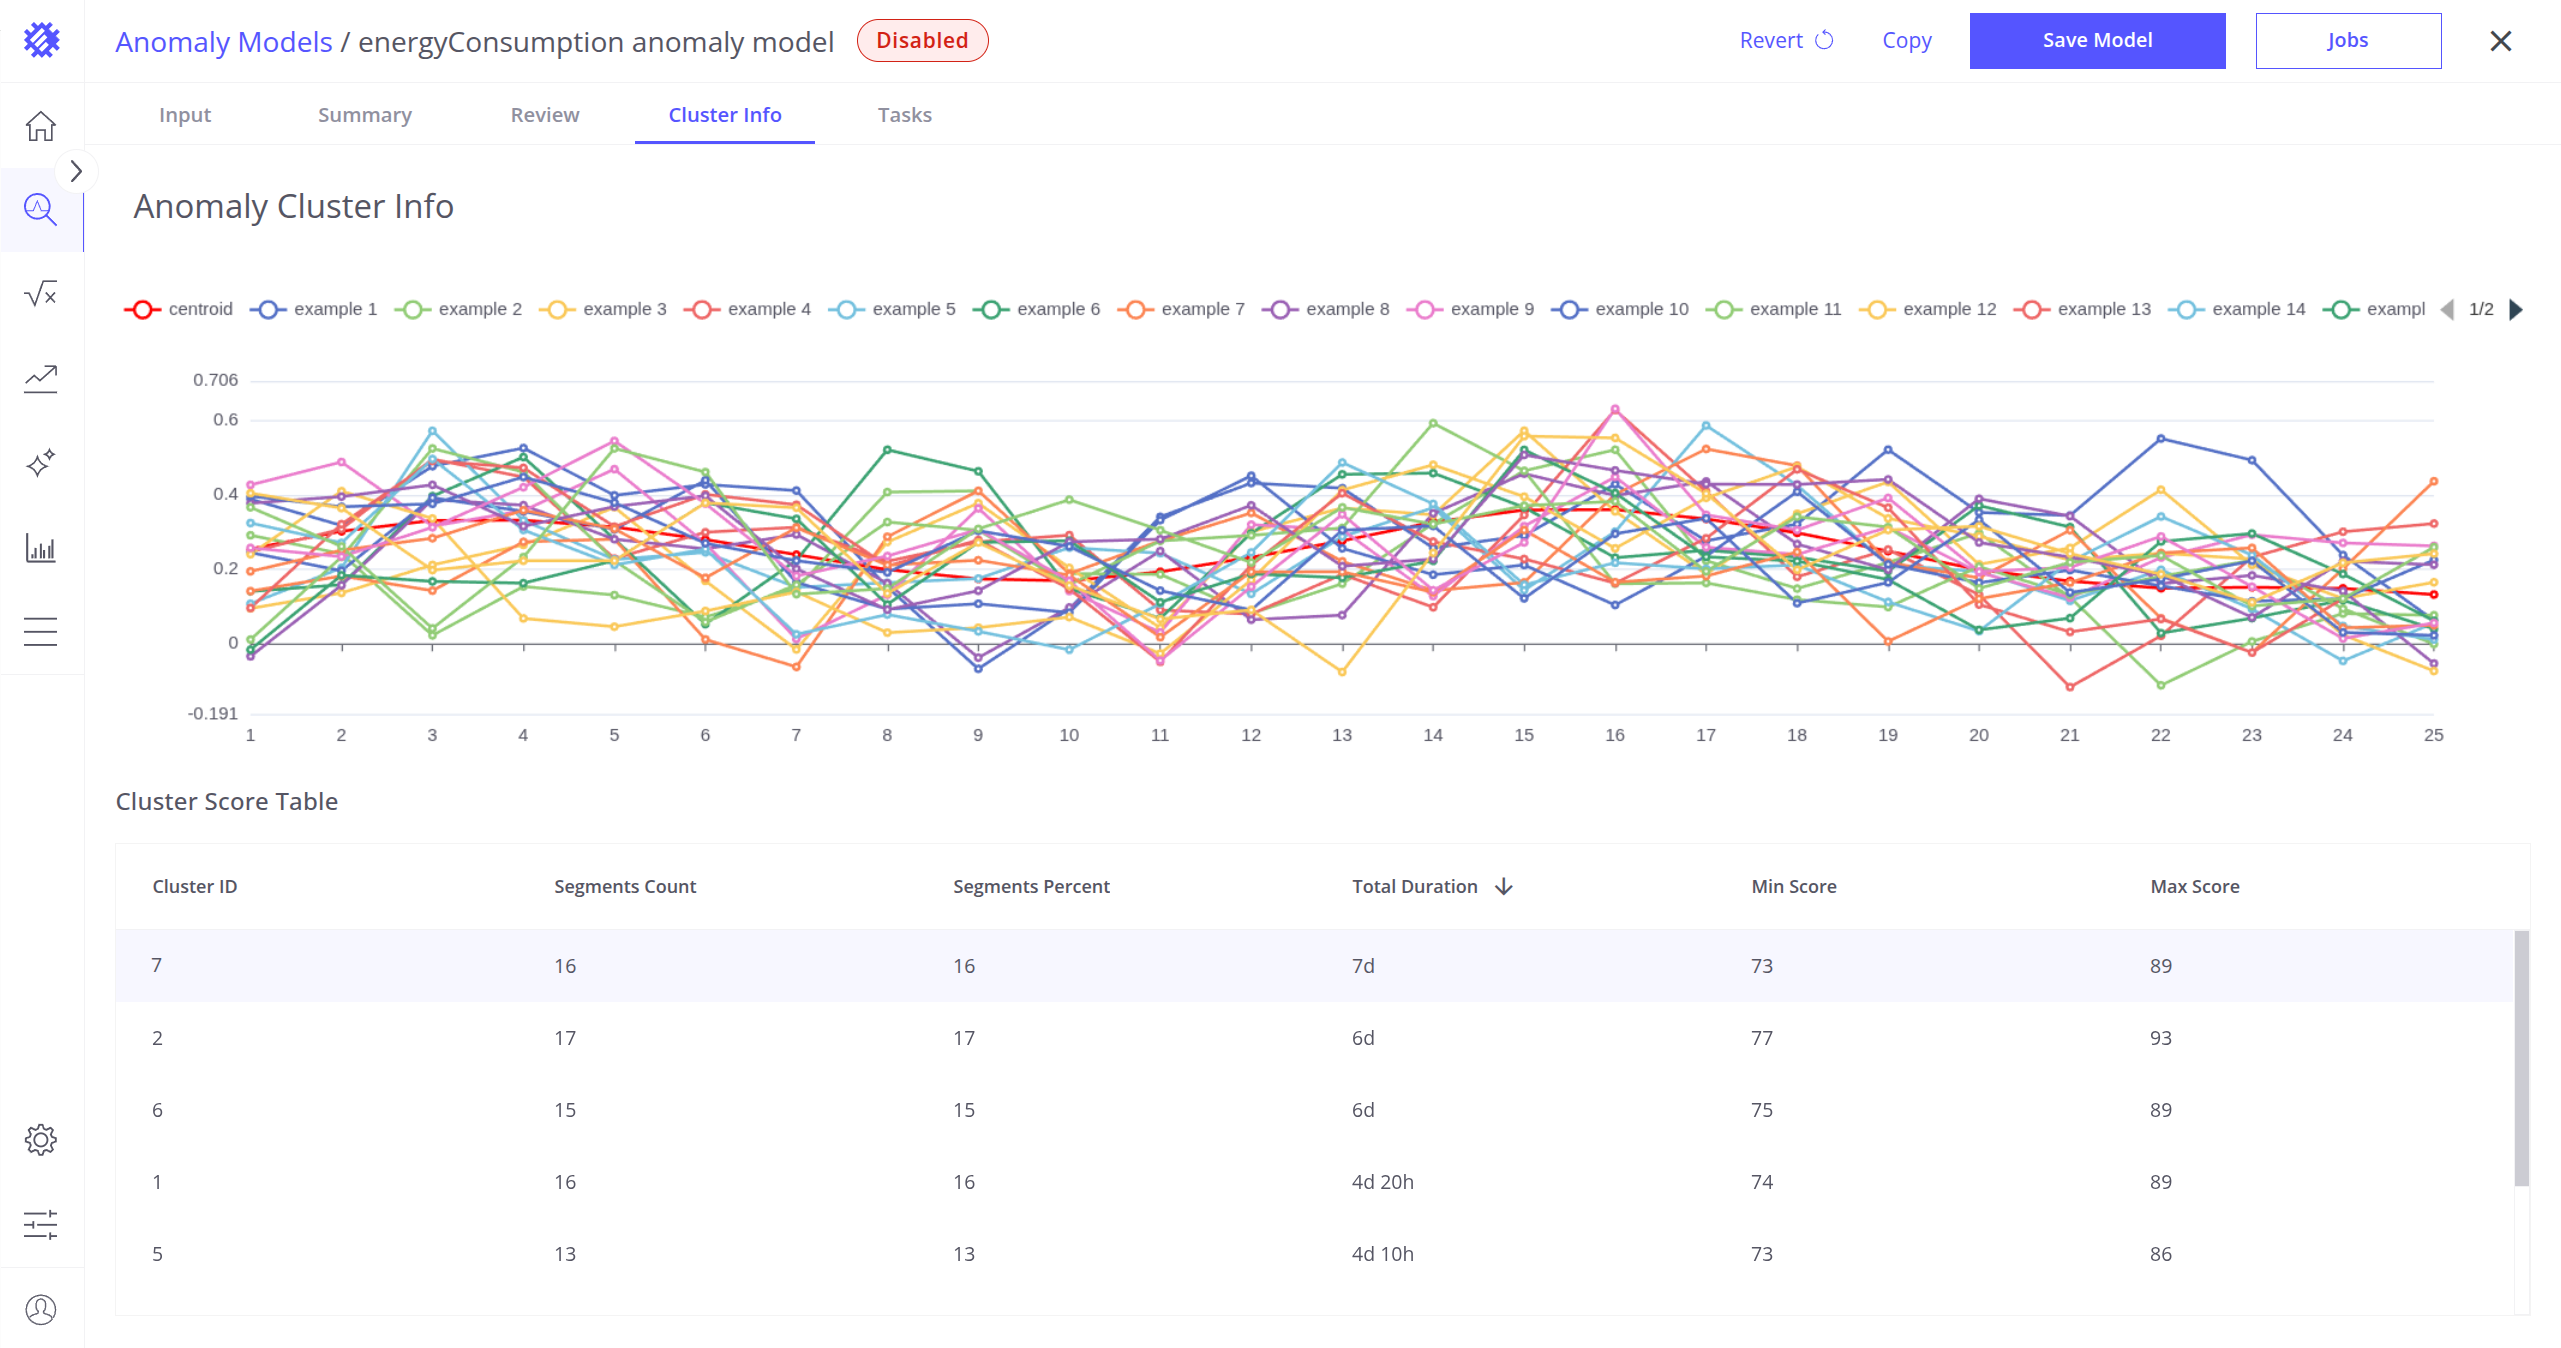
You can also click on any row in the cluster table to open a detailed view. This view shows:
- The selected centroid, and
- 20+ random segments that belong to this cluster.
This feature is useful for visually comparing segment variability within the cluster and validating clustering accuracy.
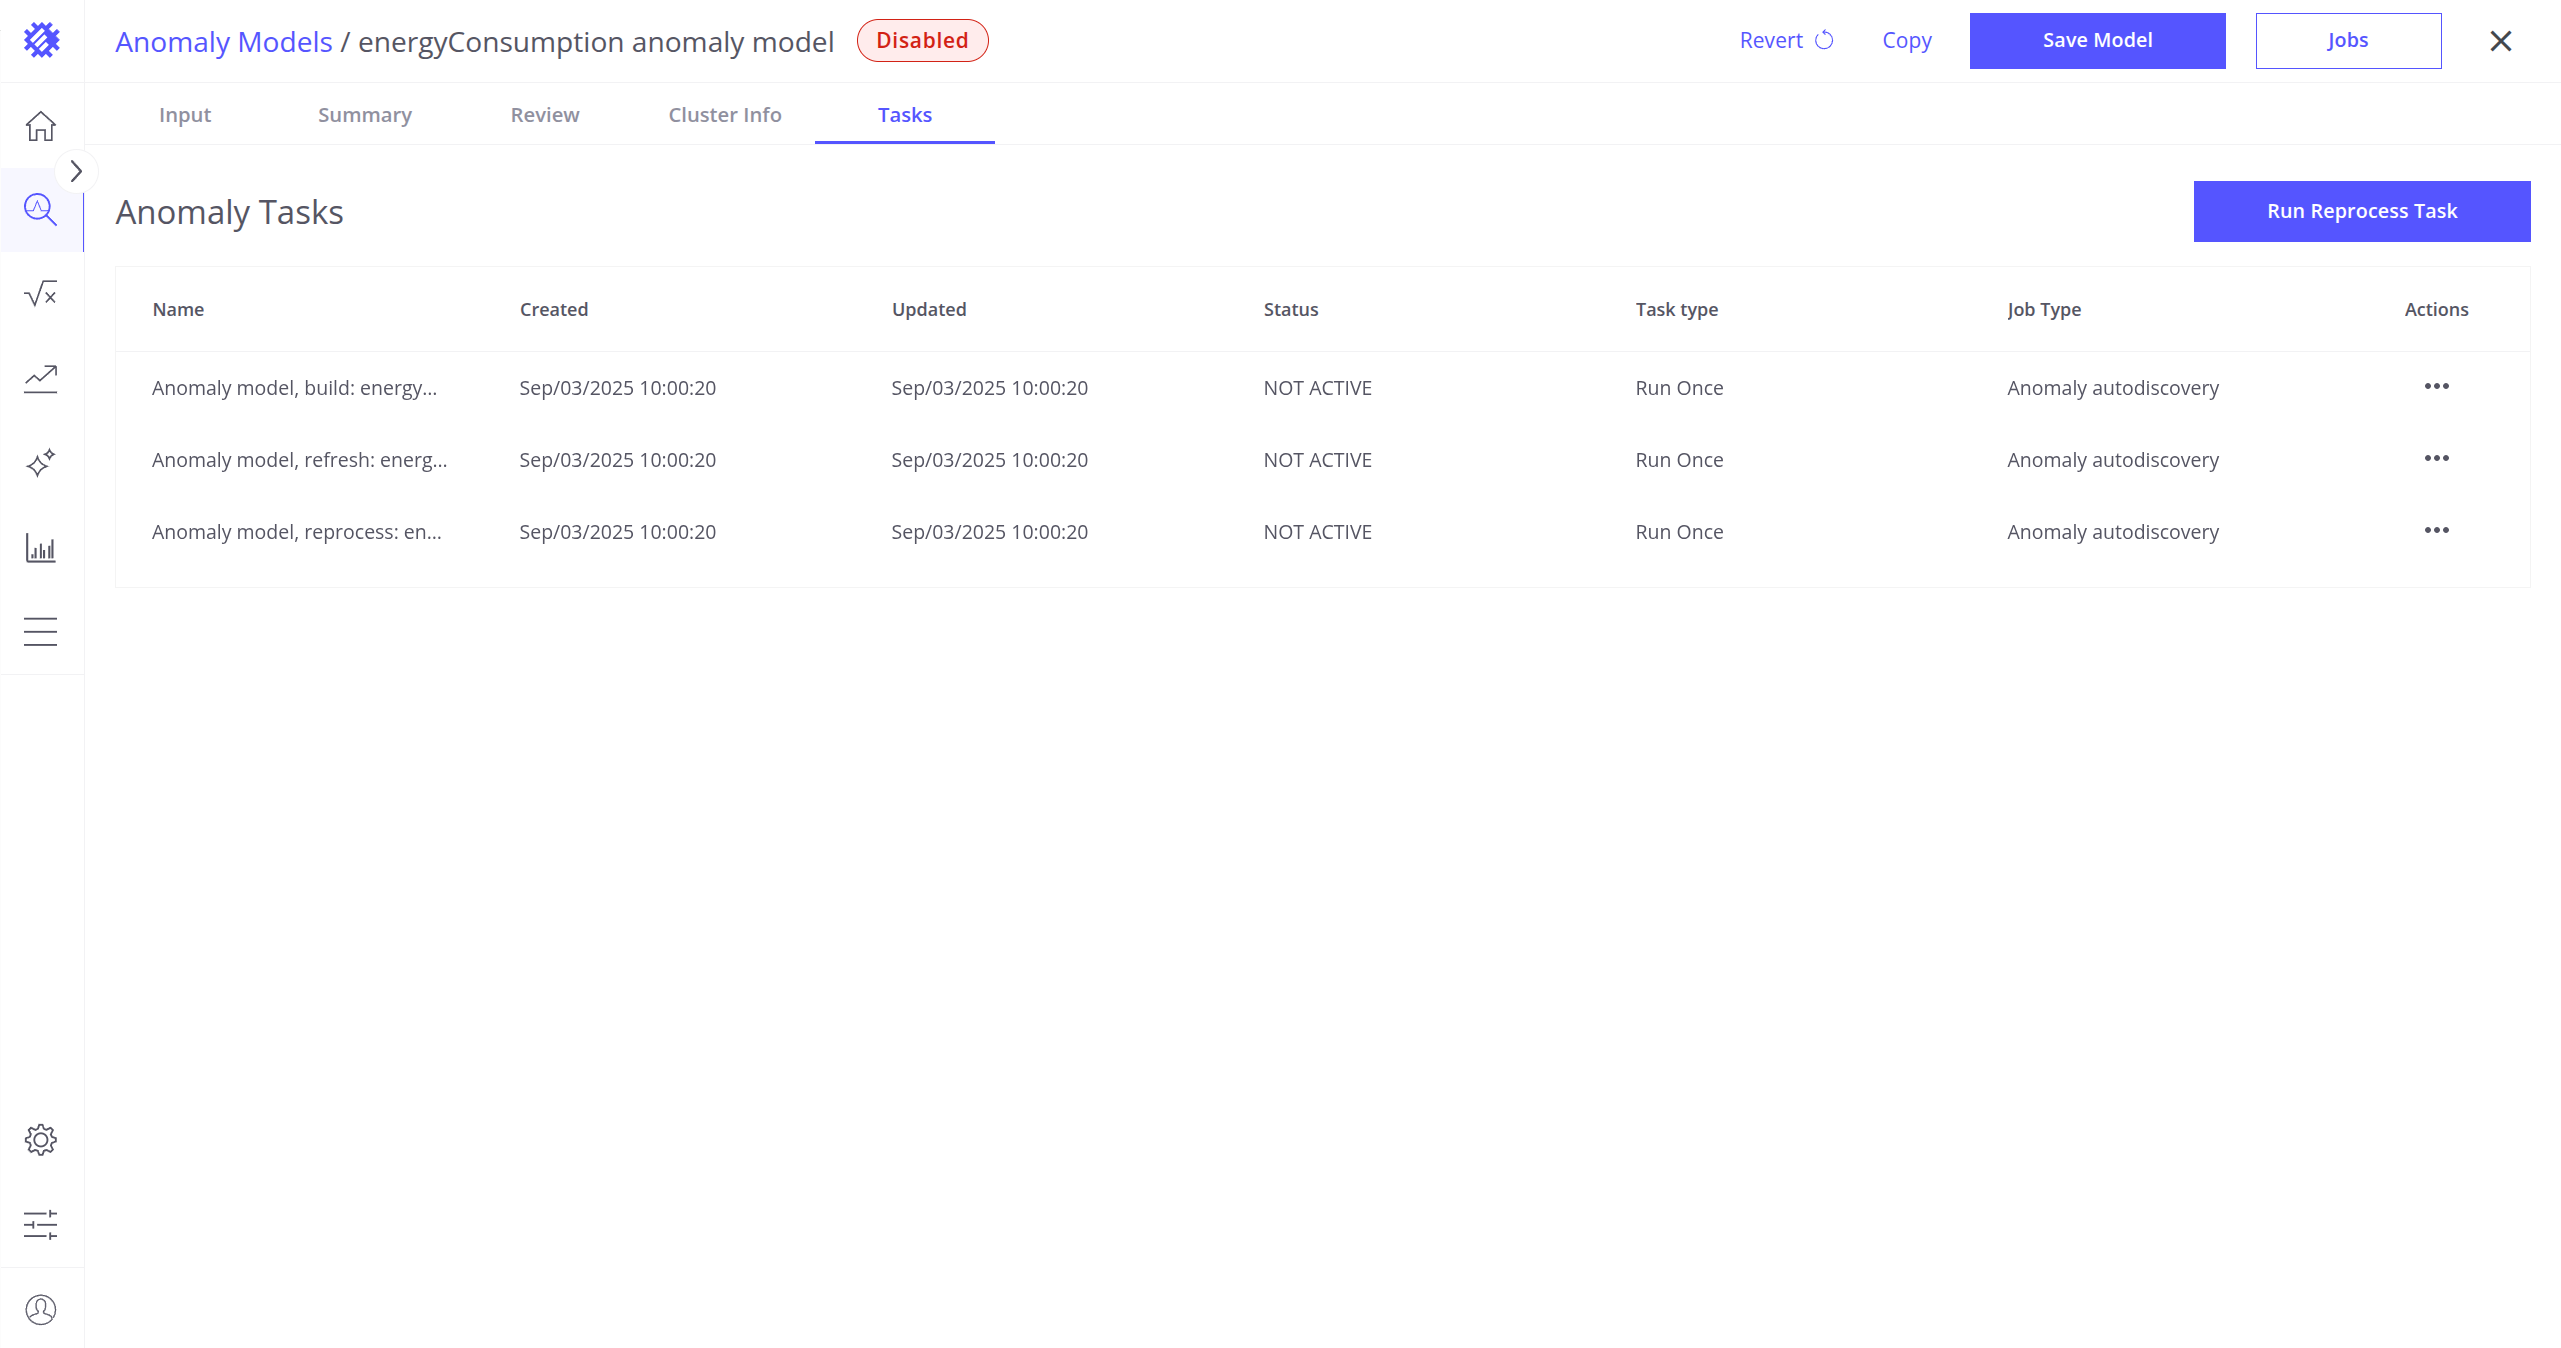
Tasks Tab
In the Tasks tab, you can review tasks that are associated with the current anomaly model. Here you can validate tasks such as:
- Anomaly model build
- Anomaly model refresh
- Anomaly model reprocess
You can see their results, last executions, and more. Read more about Trendz tasks here.
It is also possible to run the anomaly model reprocess task directly from this tab by clicking the Run Reprocess Task button located in the upper right corner of the screen (read more about anomaly reprocess here).
Next Steps
-
Getting started guide - These guide provide quick overview of main Trendz features.
-
Installation guides - Learn how to setup ThingsBoard on various available operating systems.
-
Metric Explorer - Learn how to explore and create new metrics with Trendz Metric Explorer.
-
Calculated Fields - Learn about Calculated fields and how to use them.
-
States - Learn how to define and analyse states for assets based on raw telemetry.
-
Prediction - Learn how to make forecasts and predict telemetry behavior.
-
Filters - Learn how filter dataset during analysis.
-
Available Visualizations - Learn about visualization widgets available in Trendz and how to configure them.
-
Share and embed Visualizations - Learn how to add Trendz visualizations on ThingsBoard dashboard or 3rd party web pages.
-
AI Assistant - Learn how to utilize Trendz AI capabilities.