Data Visualization
The Visualization Layer transforms raw telemetry into interactive control panels. Dashboards aggregate multiple data sources into a single pane of glass for real-time monitoring and remote hardware control.
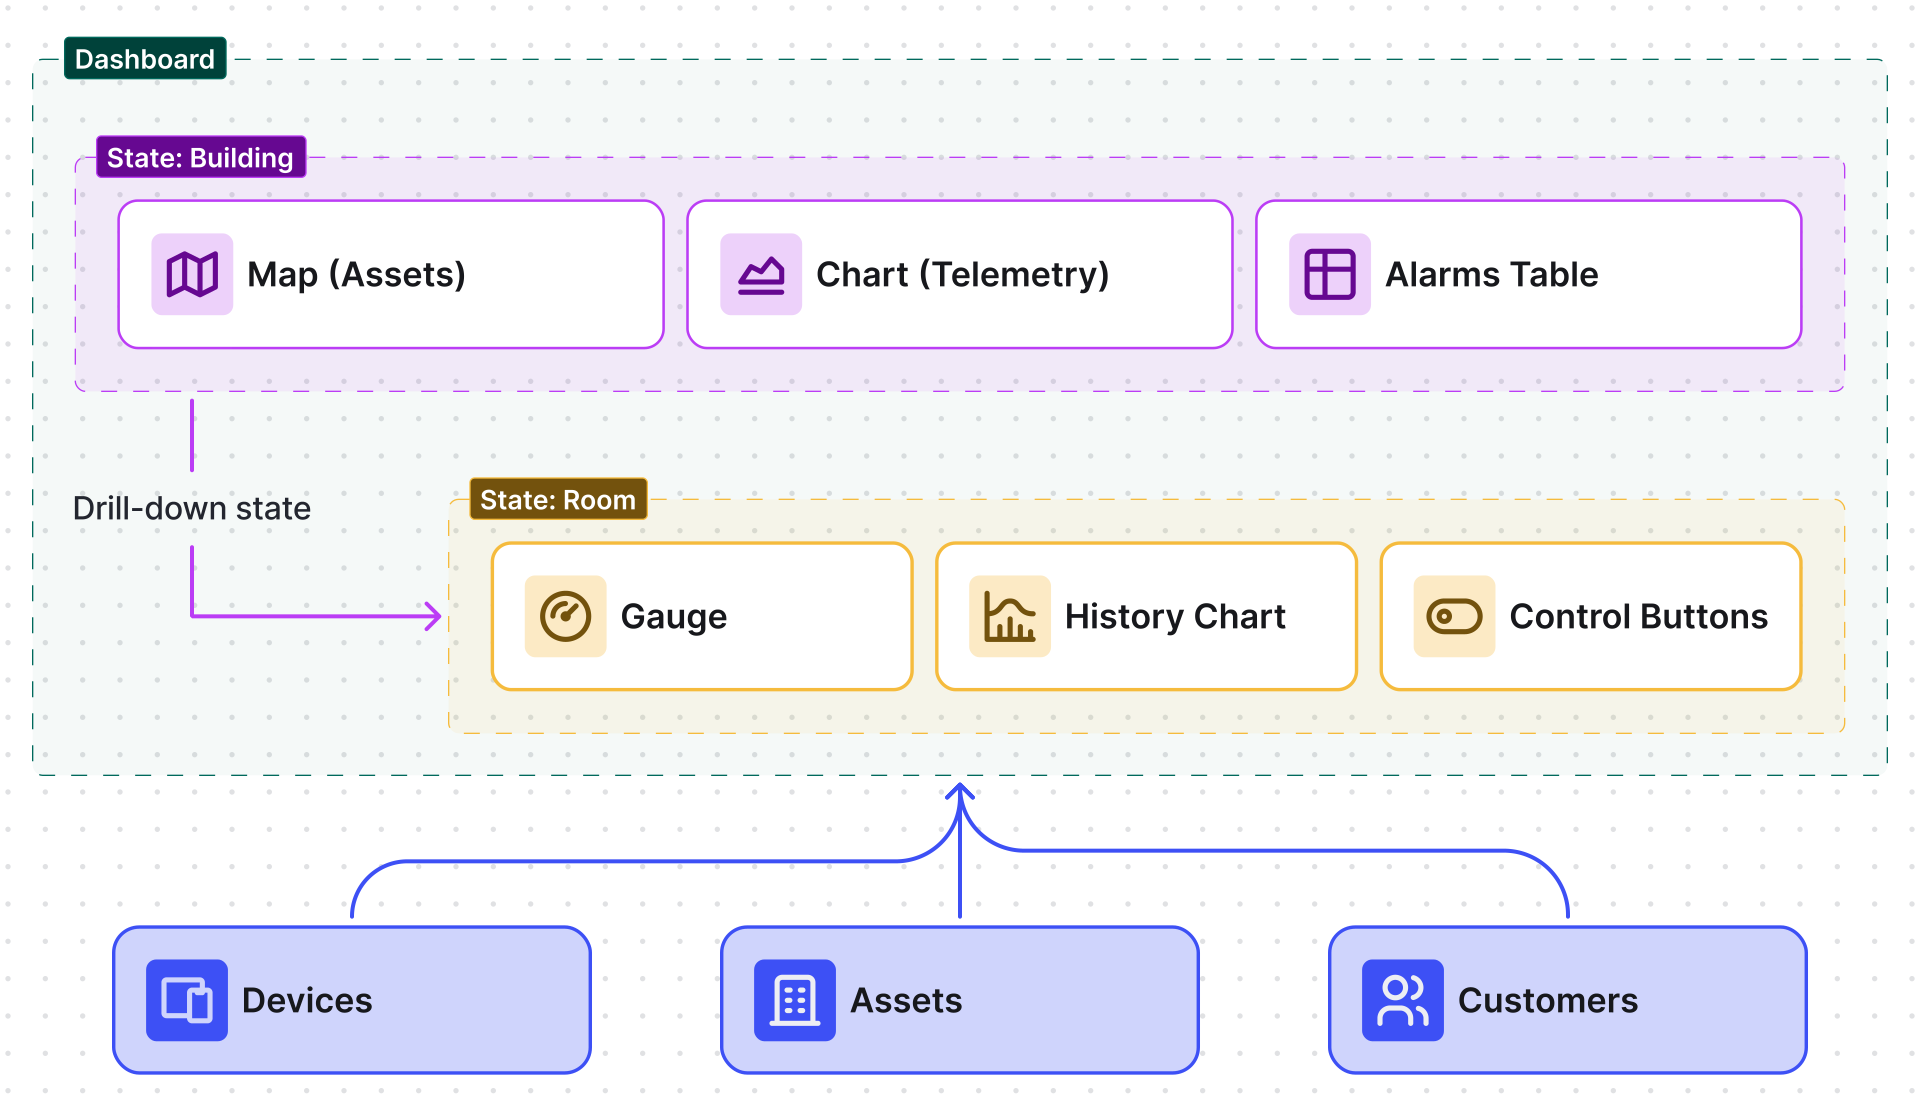
- Dashboard: Centralized UI container for visualizing data and managing entities. Support multiple entities, states, and layouts.
- Dashboard State: Logical “page” or view within a dashboard. Used to build drill-down hierarchies, like Building asset → Room sensor.
- Widget: Modular UI element used to display telemetry or execute commands: Charts, Gauges, Maps, Tables, etc.
- Widget bundle: Curated collection of widgets grouped by function: Digital Gauges, Charts, Control Widgets, etc.
Was this helpful?
Thank you for your feedback!