Data Filtering and Traffic Reduction
This recipe demonstrates an in-vehicle IoT monitoring system connected to ThingsBoard Edge. The device sends readings from 10 sensors — distance, gas consumption, vehicle speed, engine temperature, ambient temperature, tire temperature, and tire pressure (four tires) — to the Edge. The Edge root rule chain filters that data and forwards only the distance readings to the cloud, reducing bandwidth while keeping full sensor history available locally.
Prerequisites
Section titled “Prerequisites”- Completed the Getting Started guide.
- Familiar with the Edge Rule Chain Templates.
- ThingsBoard server is running and ThingsBoard Edge is connected to it.
Create device on Edge
Section titled “Create device on Edge”Create a device named “In-vehicle monitoring system” on the Edge instance.
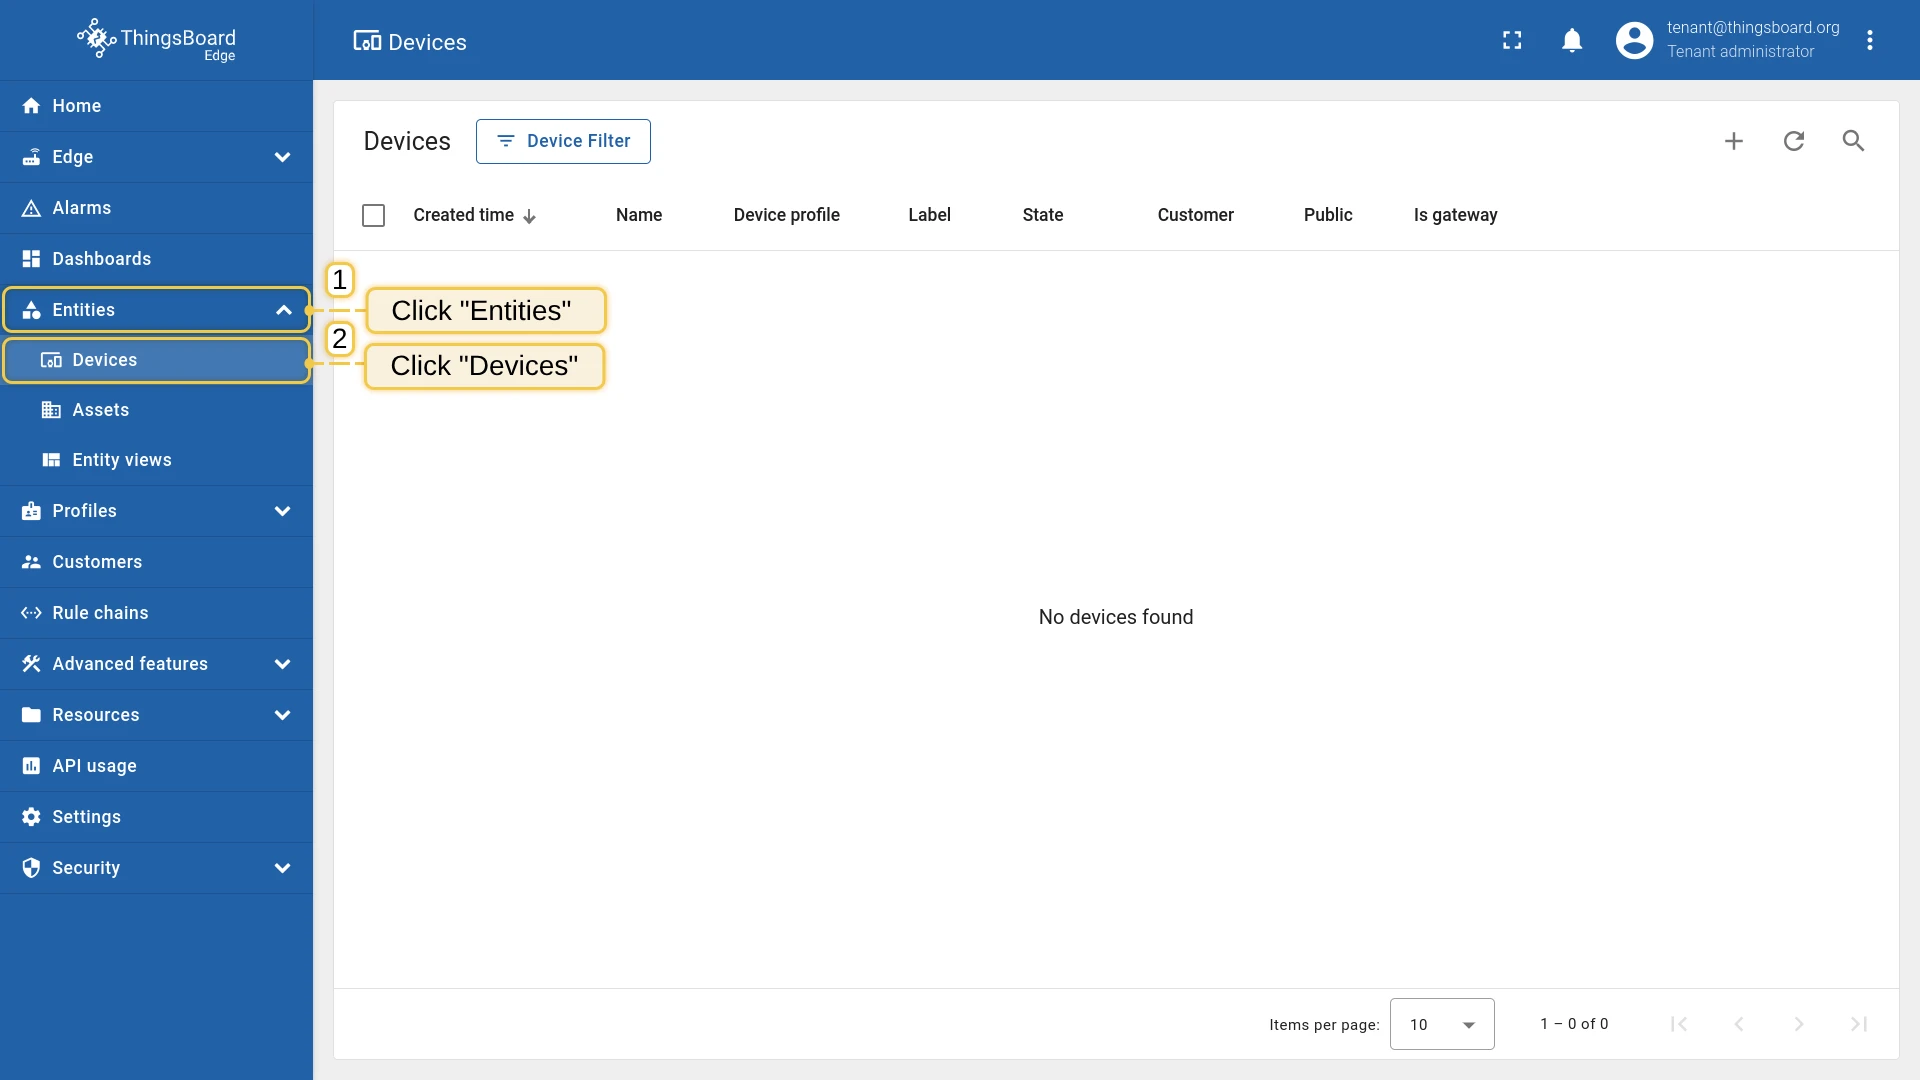
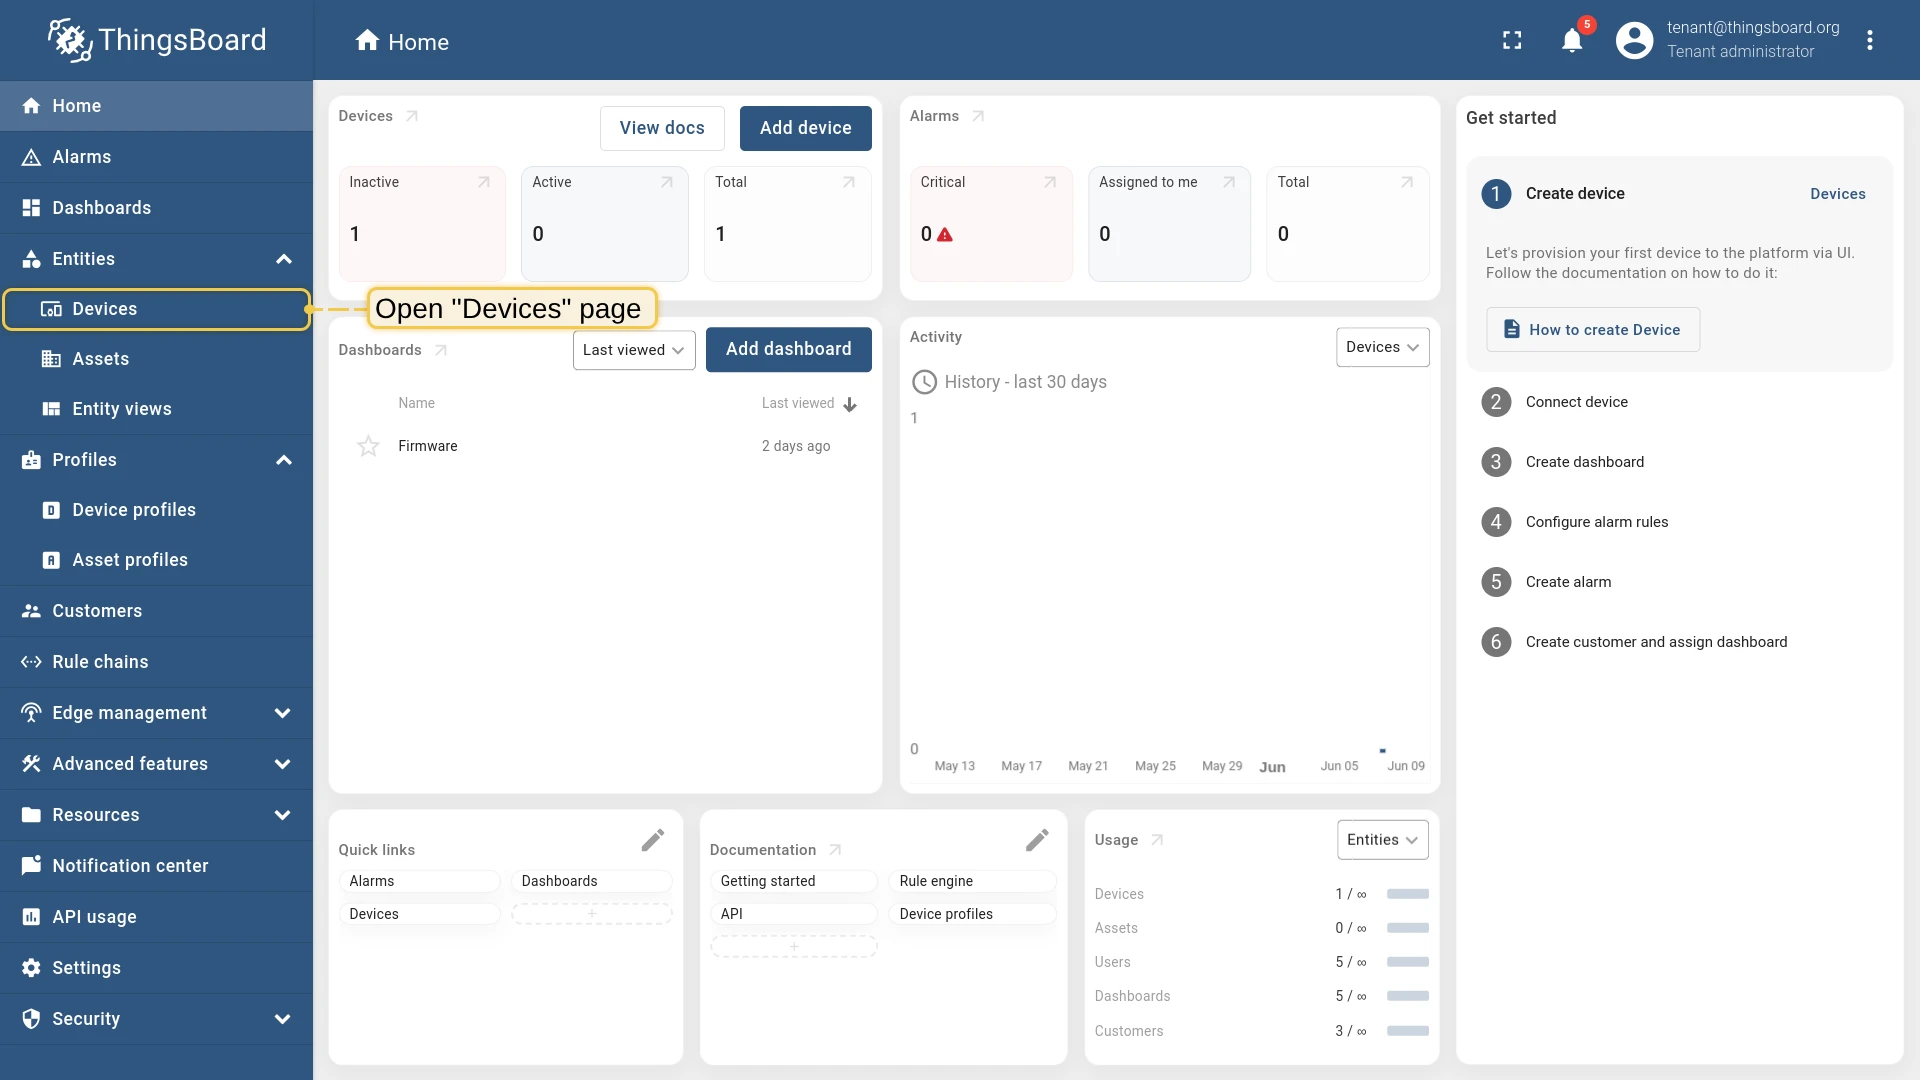
- Log in to your ThingsBoard Edge instance and go to the Devices page.
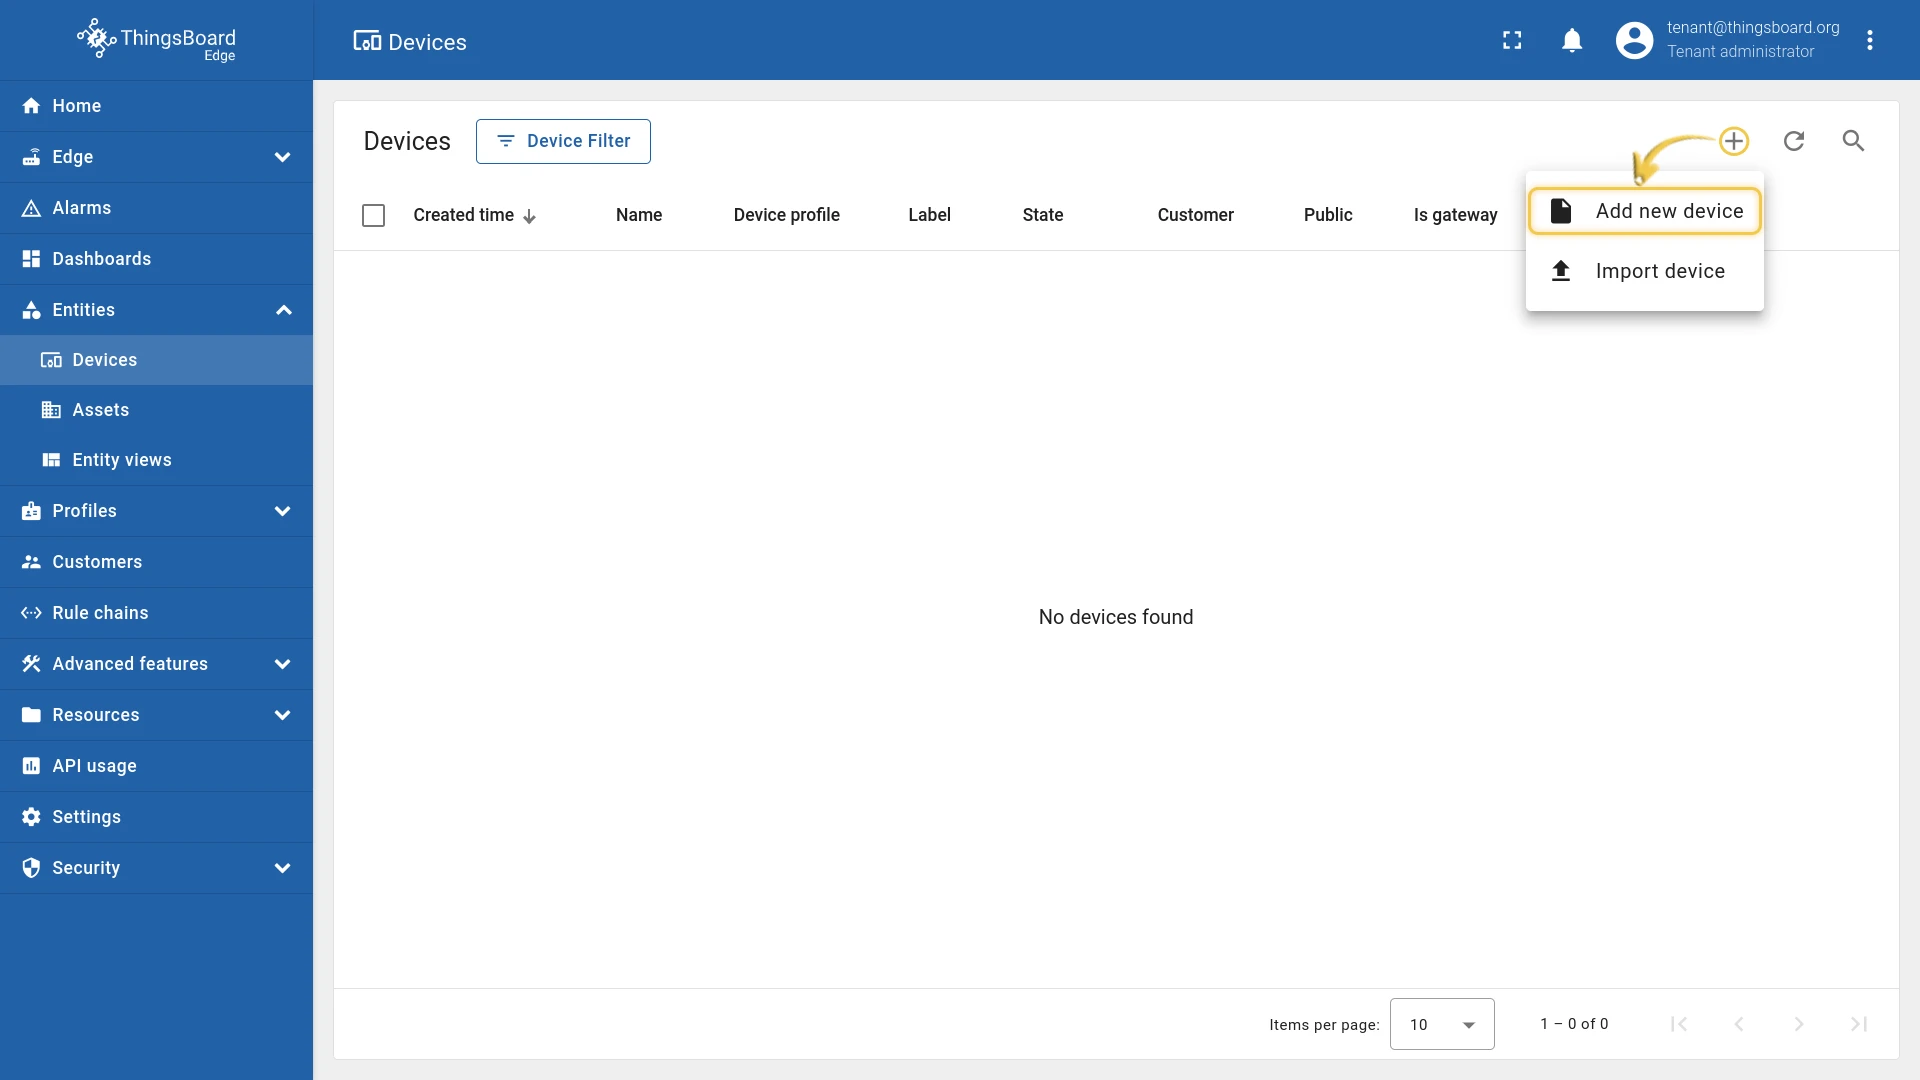
- Click ”+” in the top-right corner, then click Add new device.
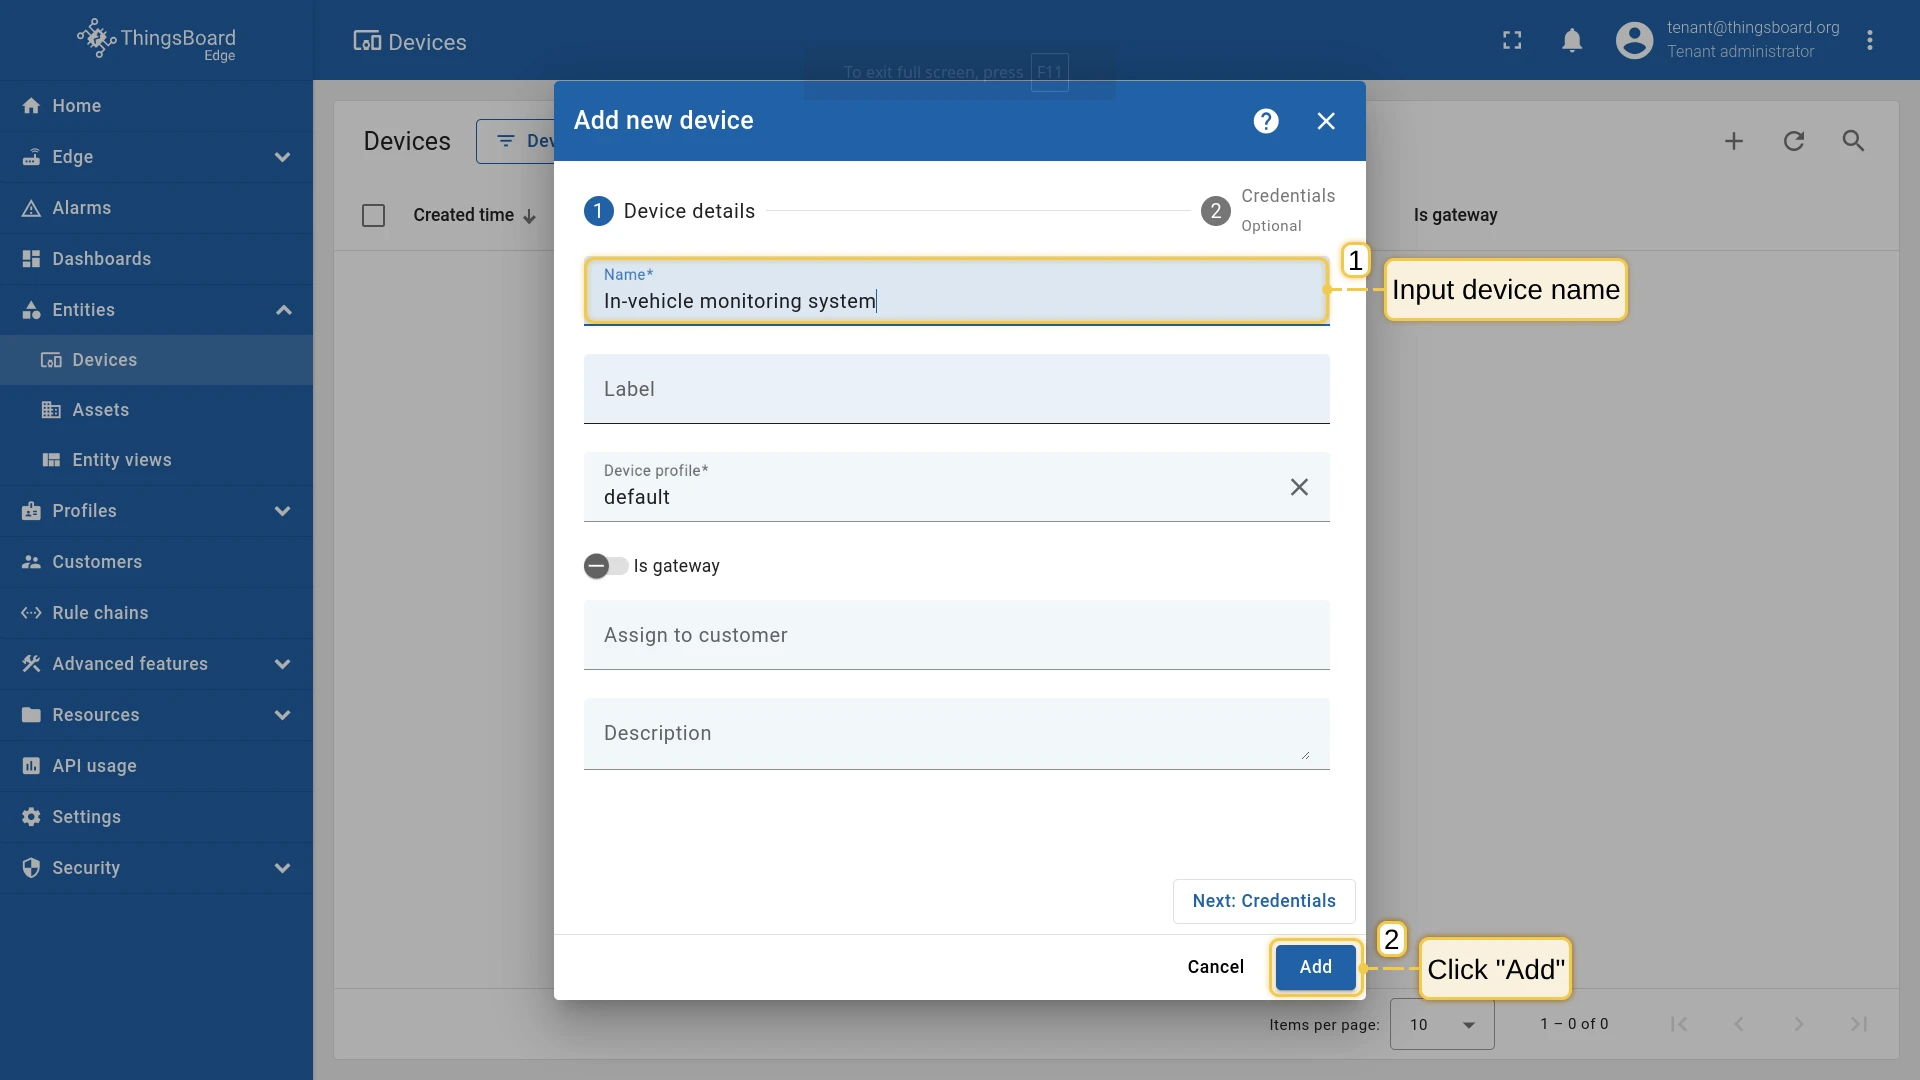
- Enter the name “In-vehicle monitoring system” and click Add.
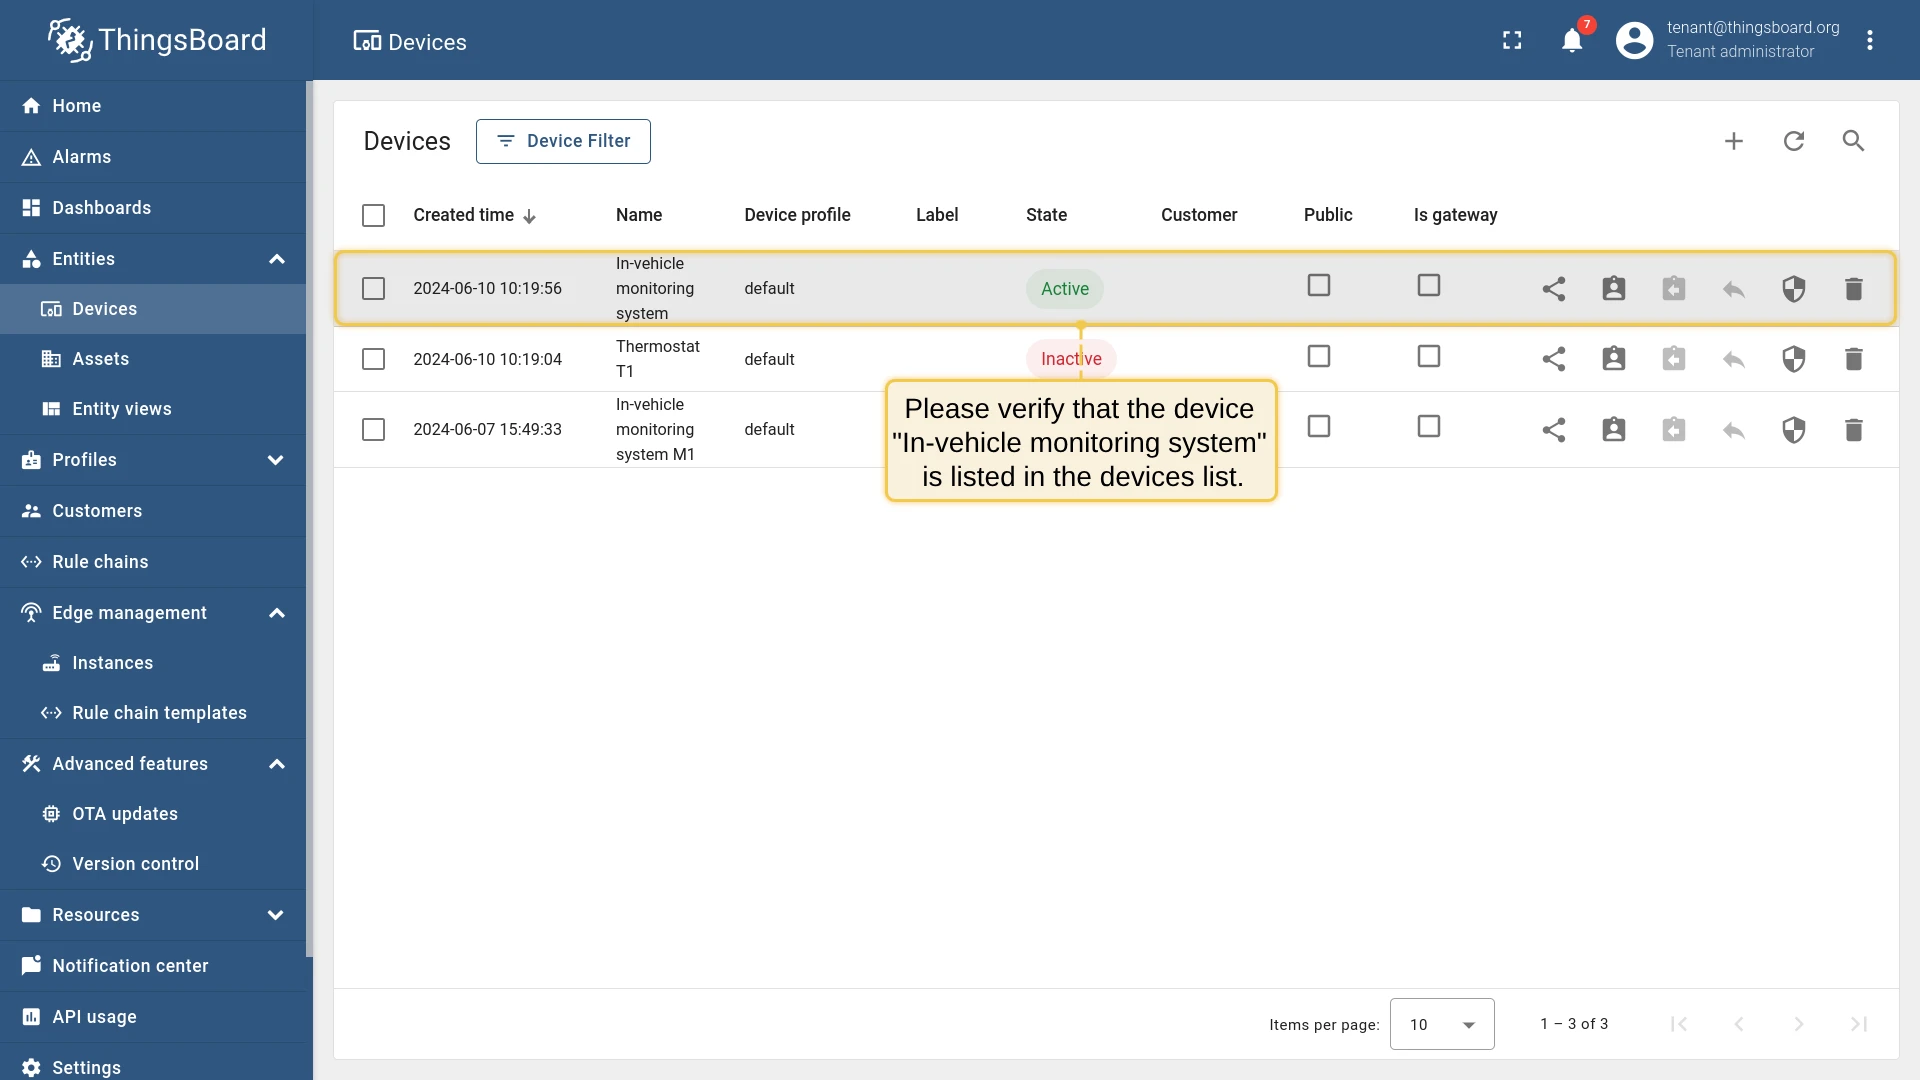
- The device now appears in the devices table.

Once the device is created on Edge, verify it has been synchronized to the ThingsBoard server.
Configure Edge rule engine
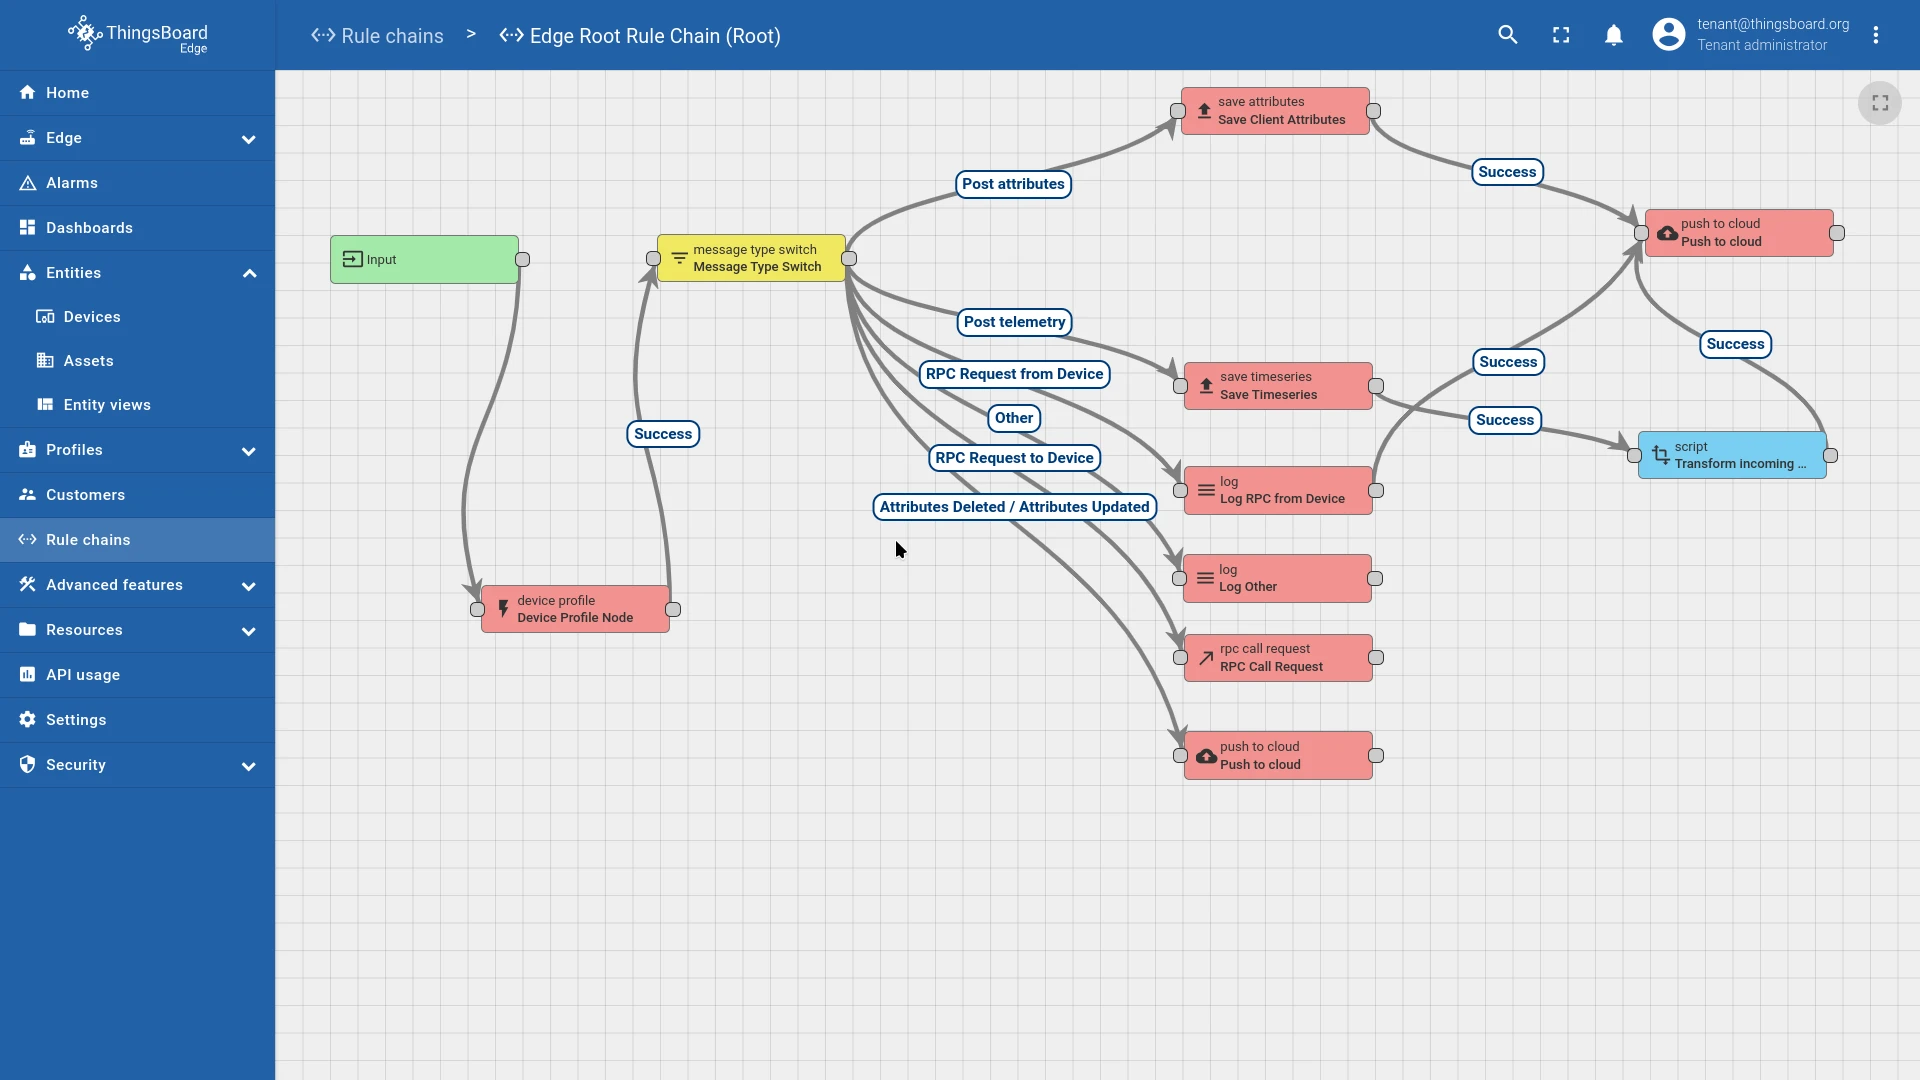
Section titled “Configure Edge rule engine”Update the Edge Root Rule Chain on the ThingsBoard server to add a transformation script that filters incoming messages and forwards only the distance reading to the cloud.
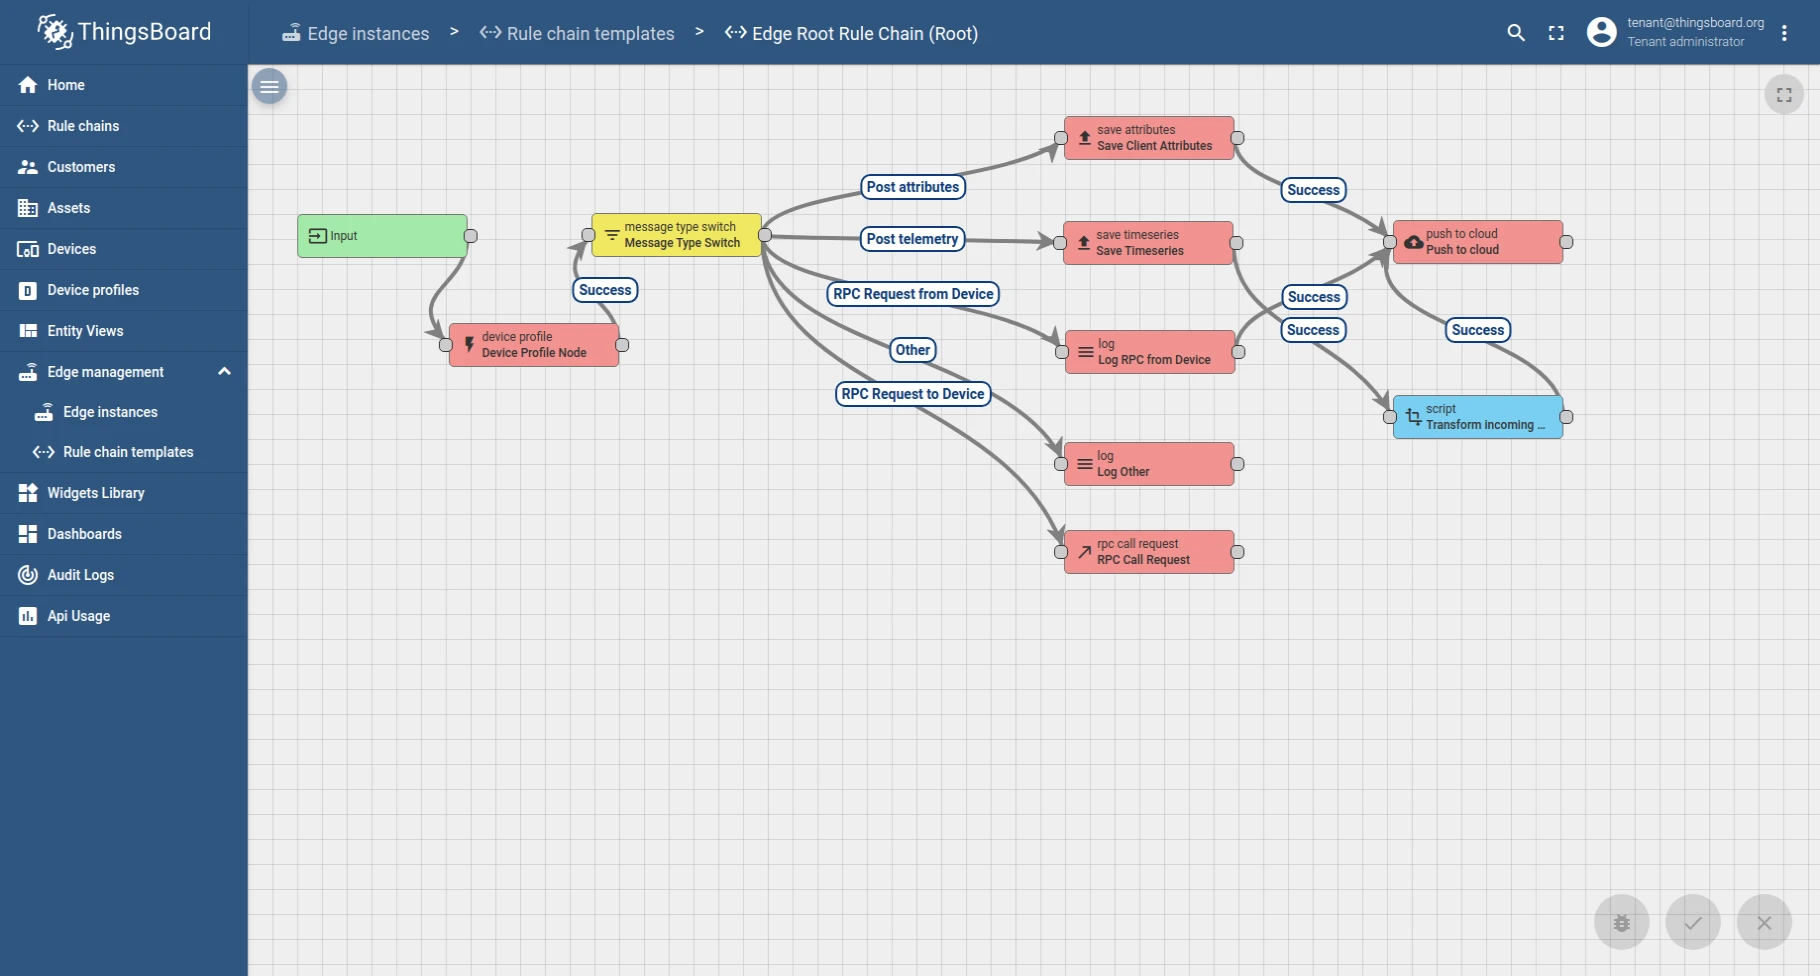
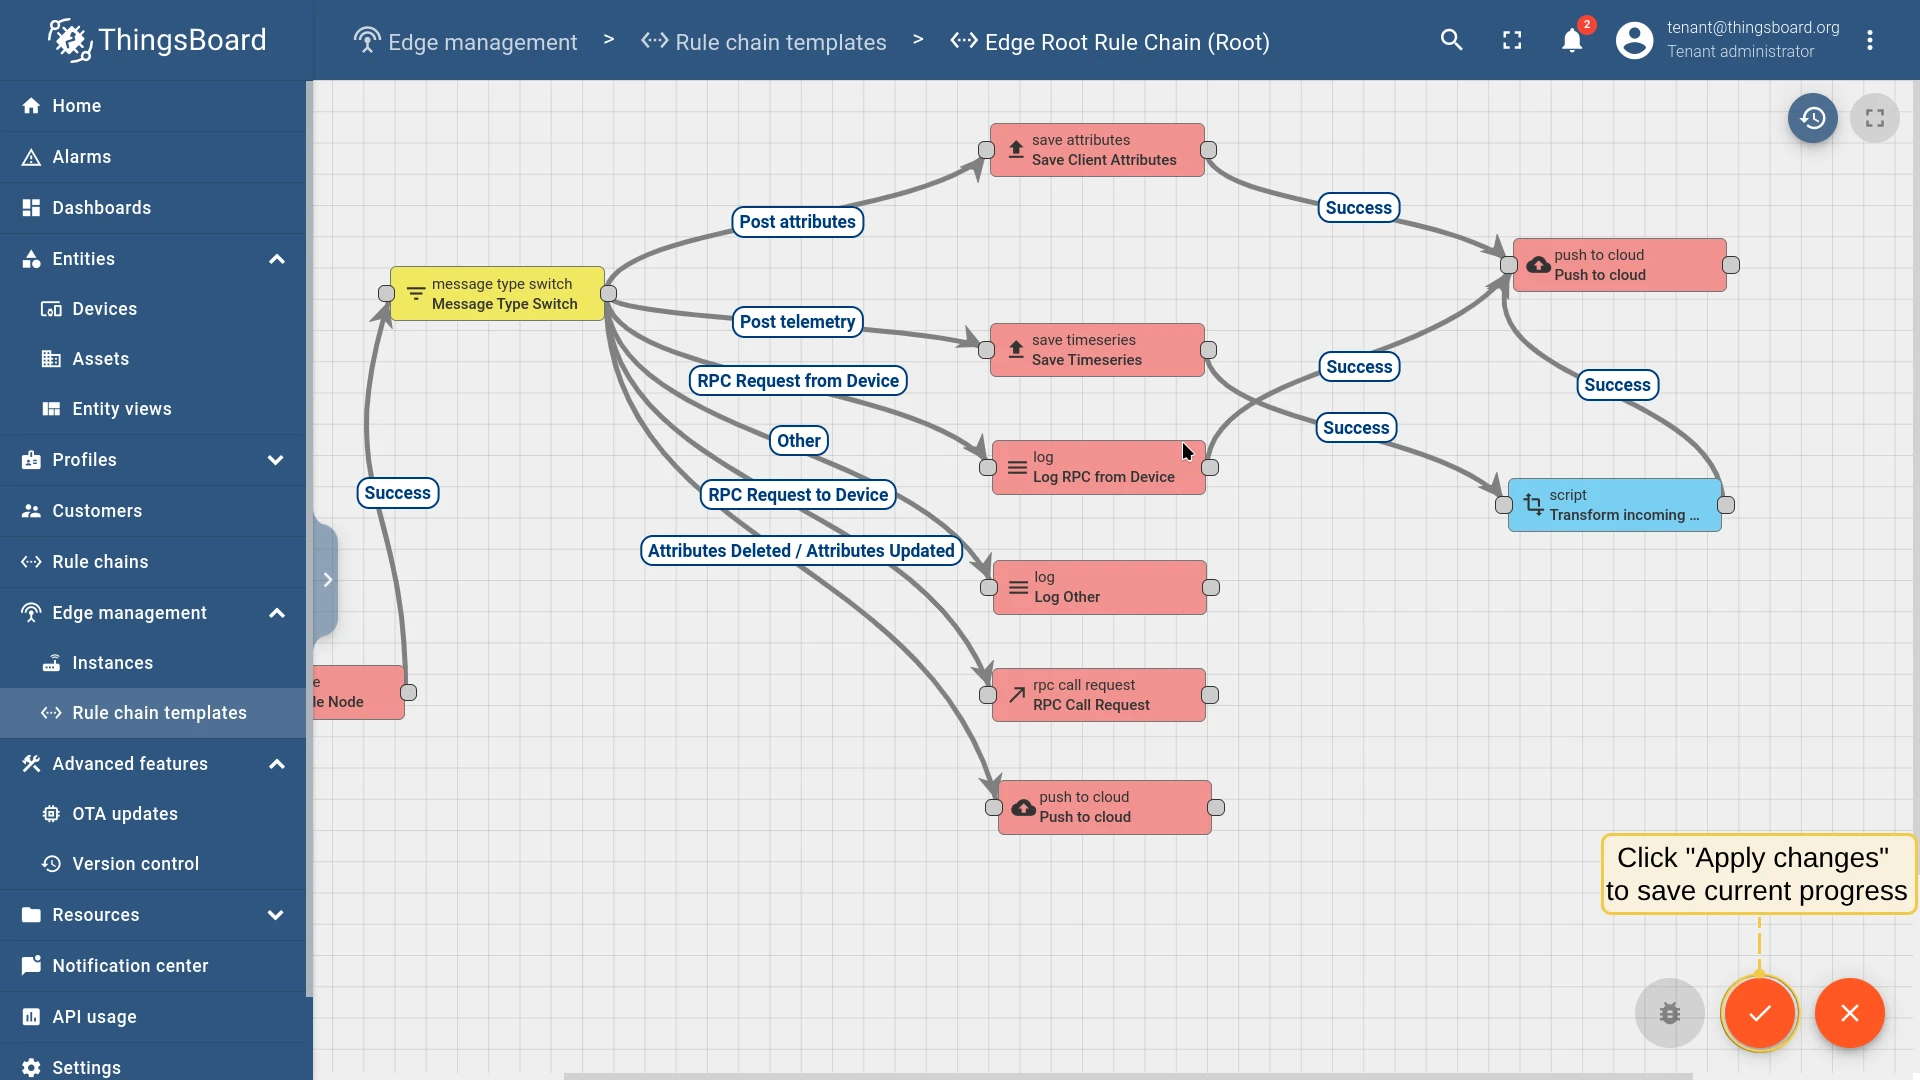
Here is the final rule chain configuration you are aiming for:
The transformation script creates a new message containing only the distance field:
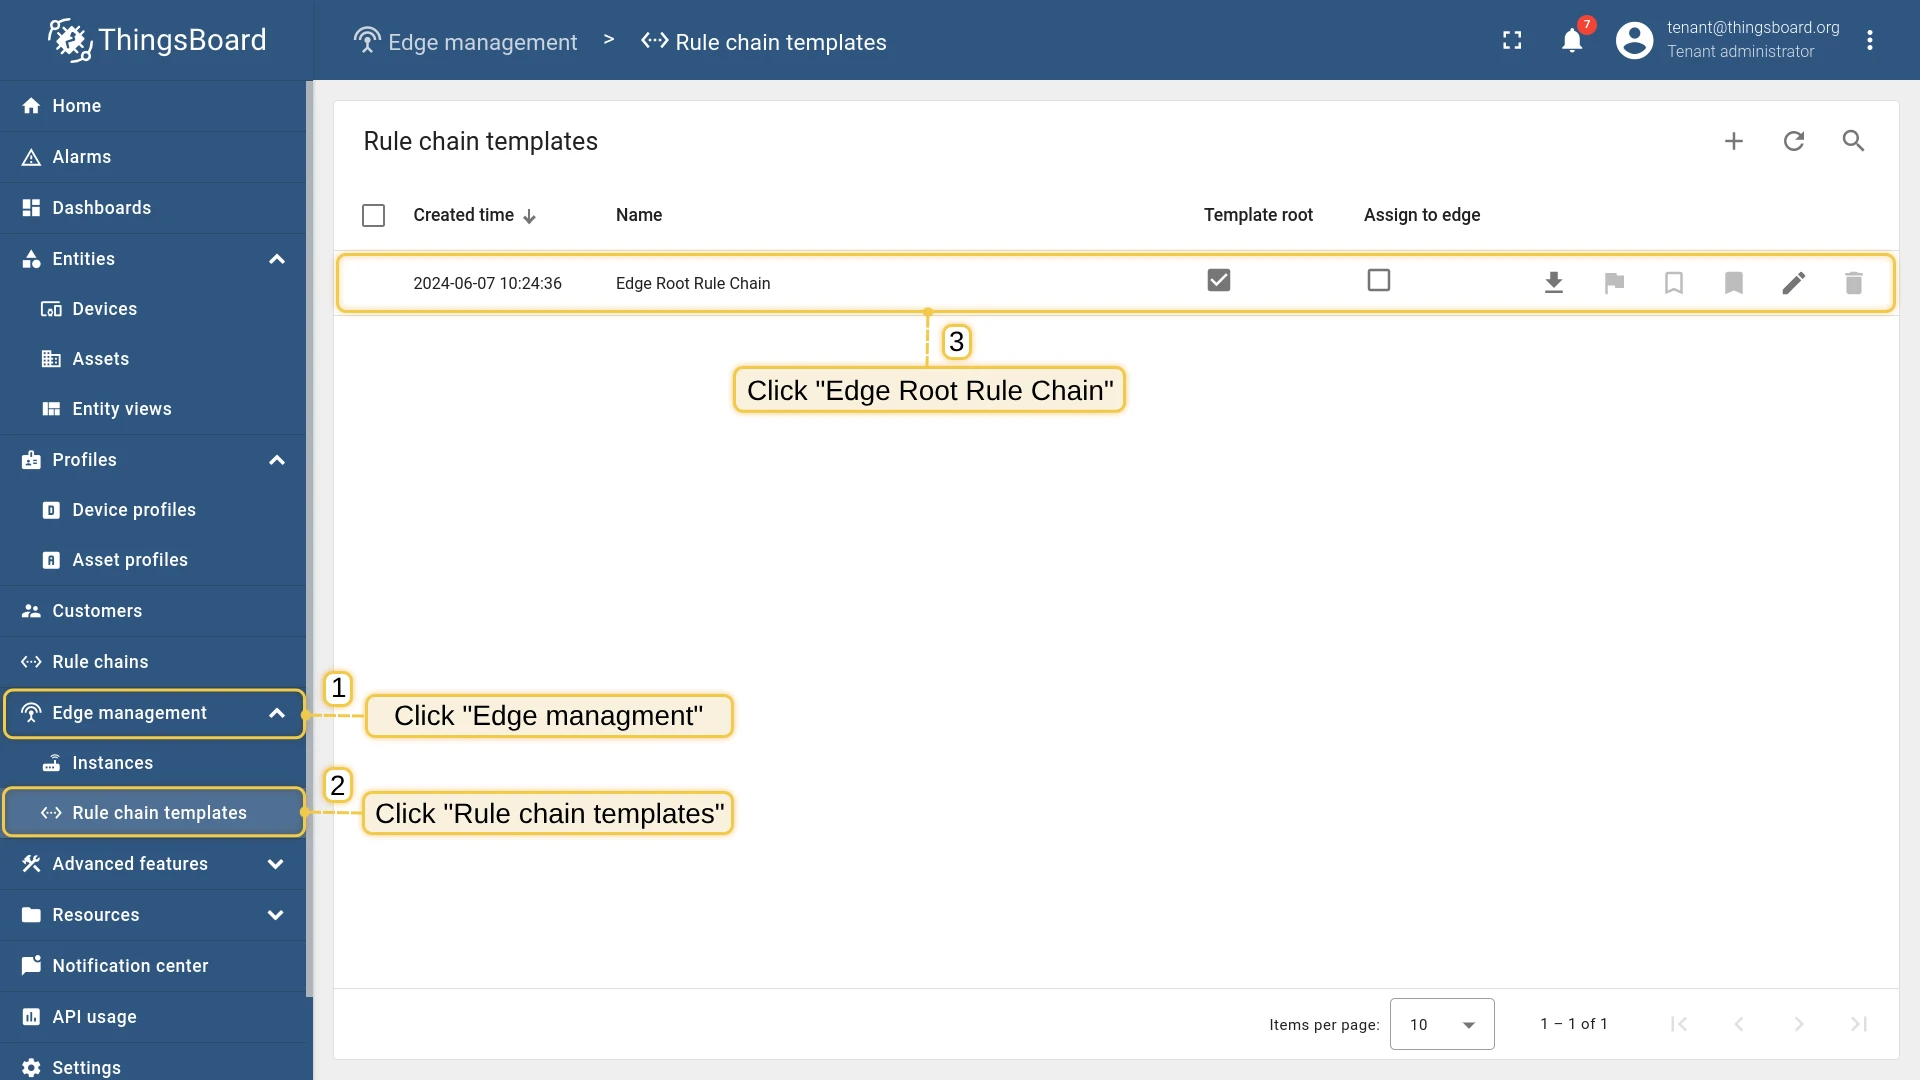
var newMsg = {};newMsg.distance = msg.distance;return { msg: newMsg, metadata: metadata, msgType: msgType };- Log in to your ThingsBoard server. Go to Edge management → Rule chain templates and open Edge Root Rule Chain.
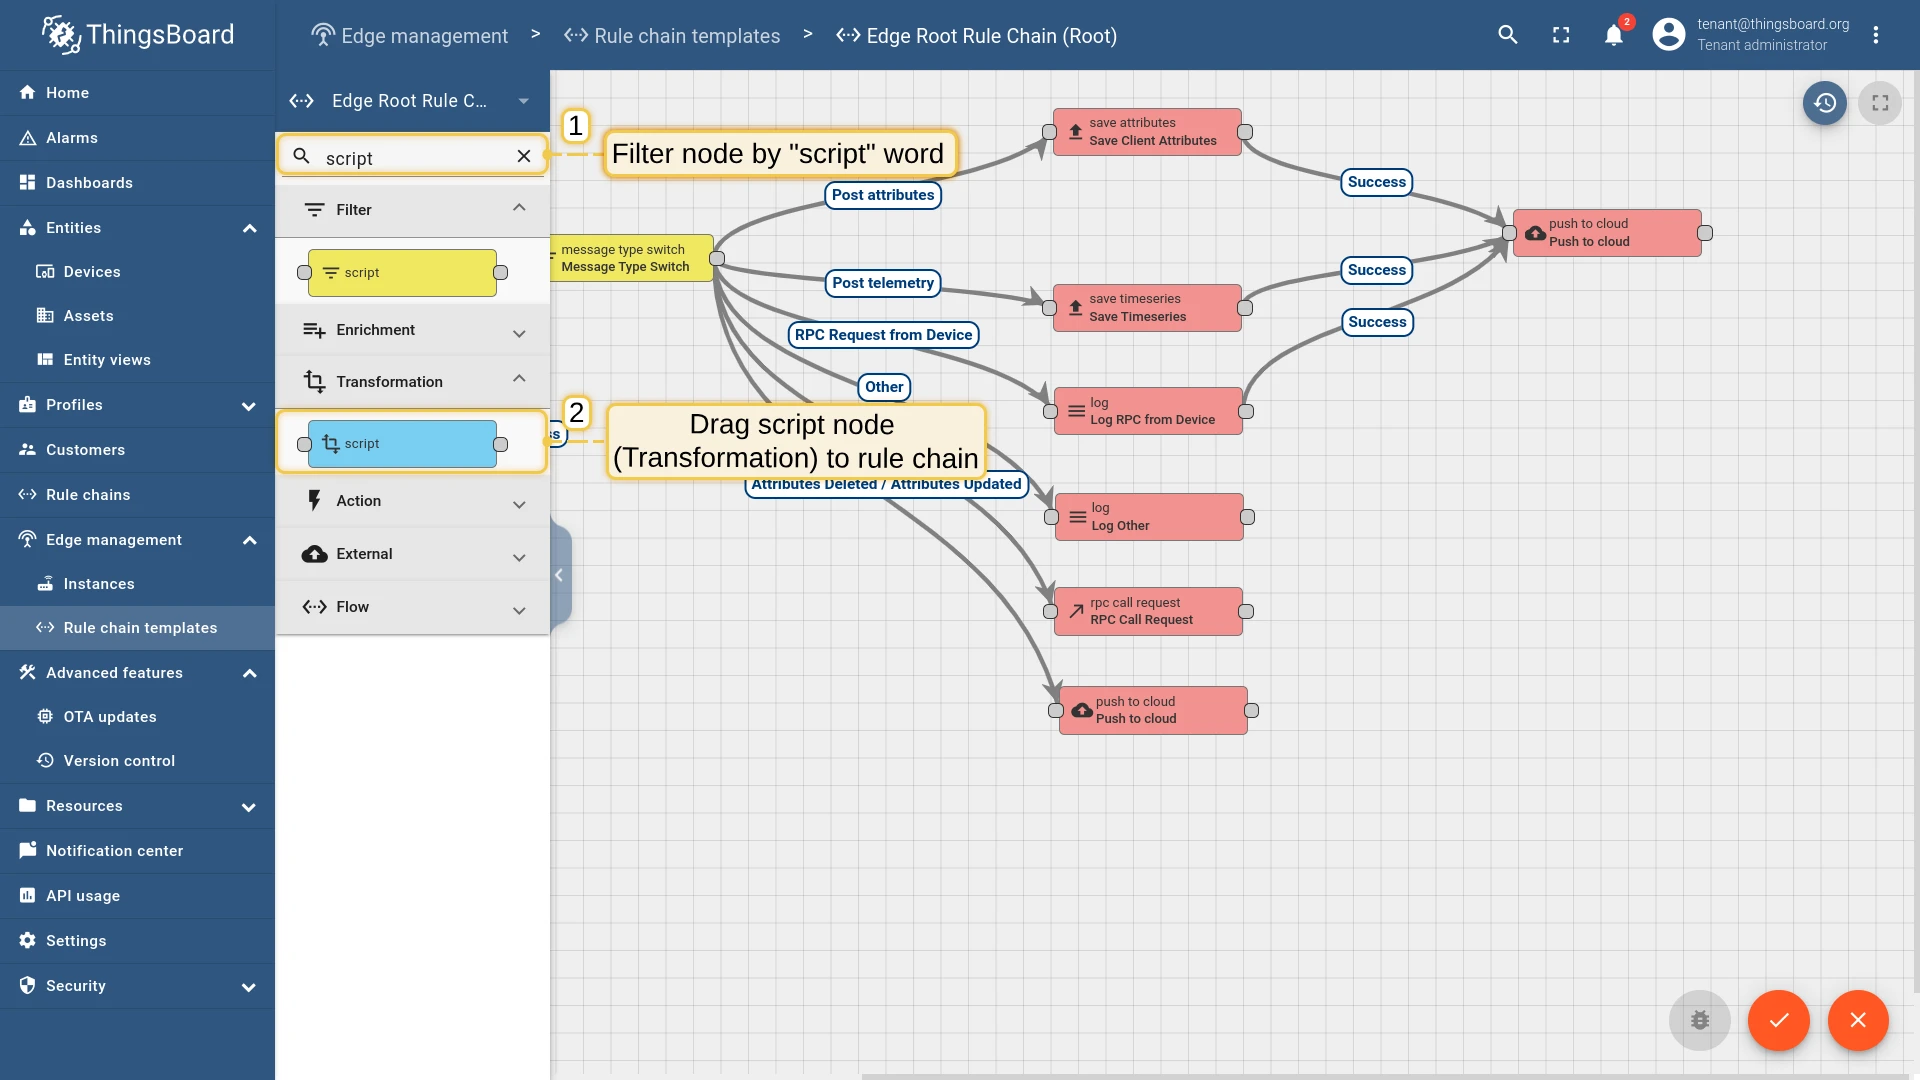
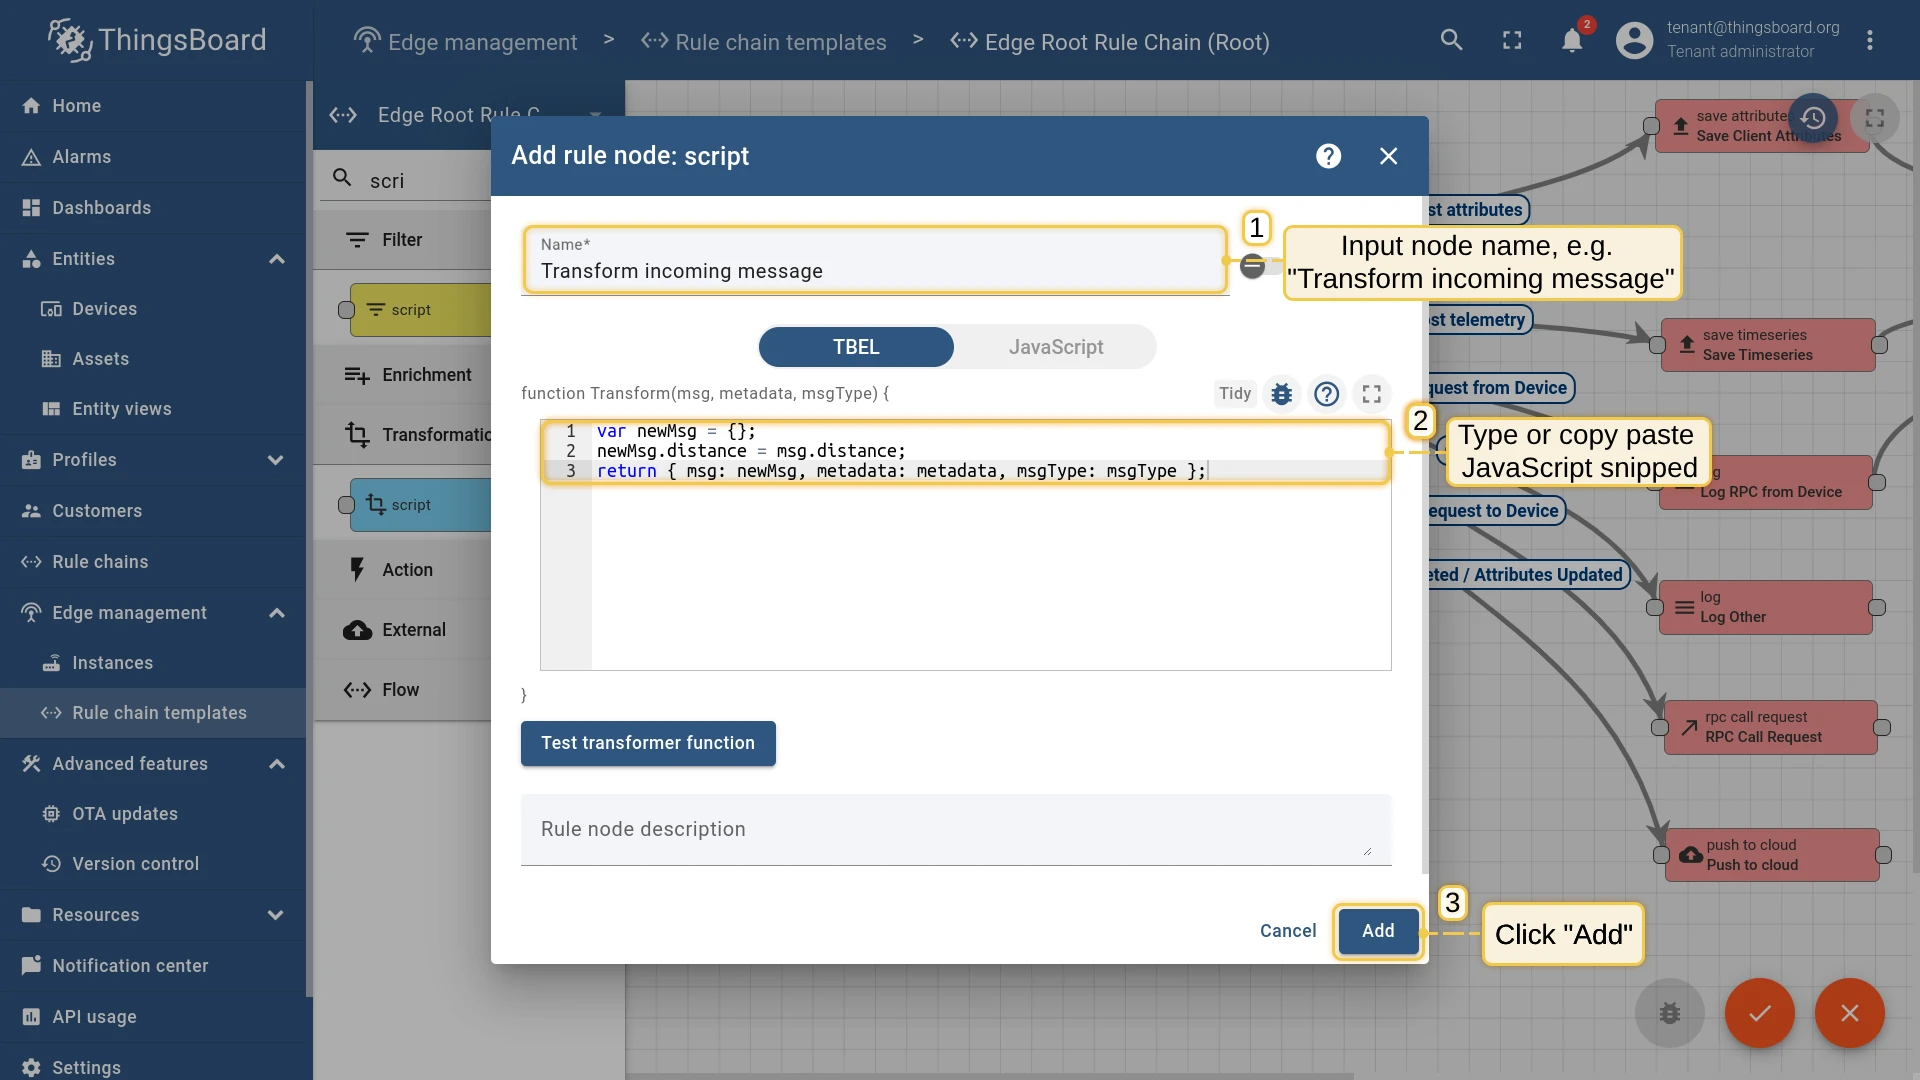
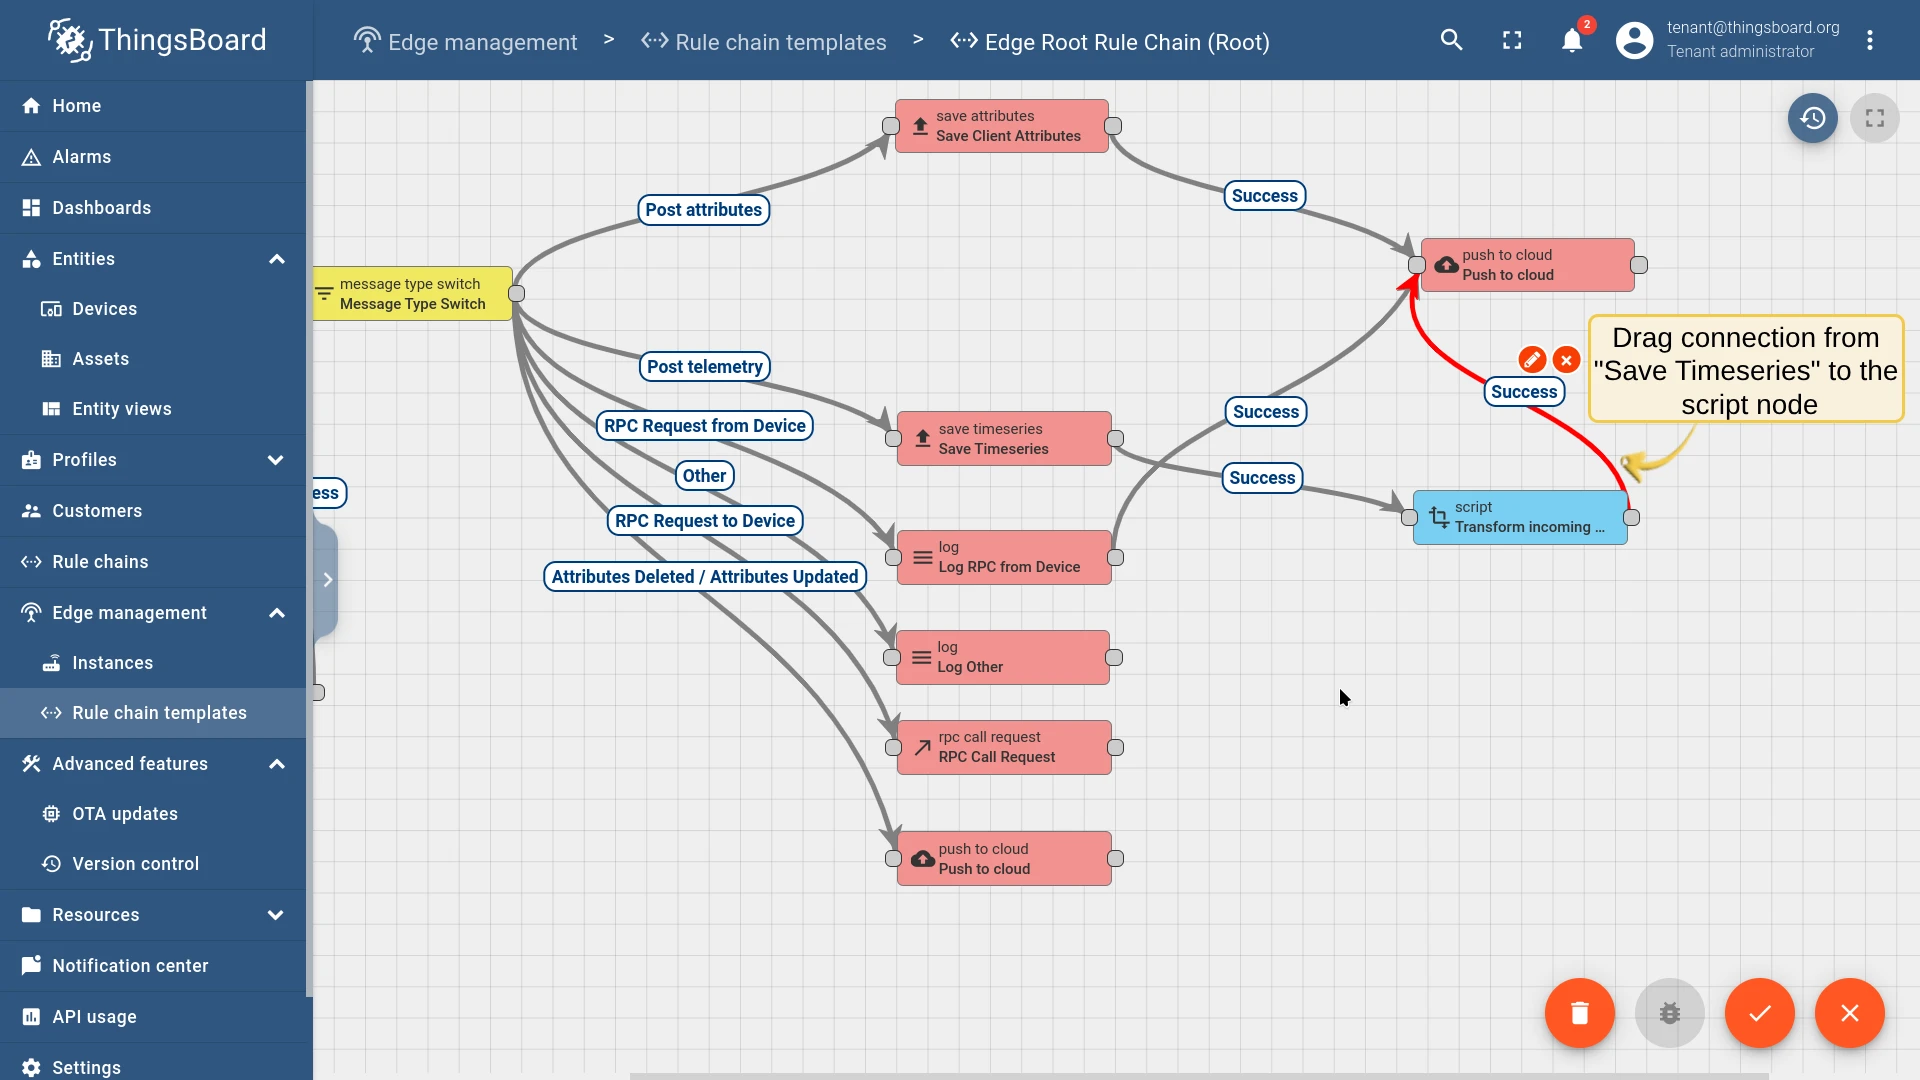
- Search for nodes containing “script”. Drag a Script (Transformation) node onto the canvas.
- Enter the node name “Transform Incoming Message” and paste the JavaScript snippet above.
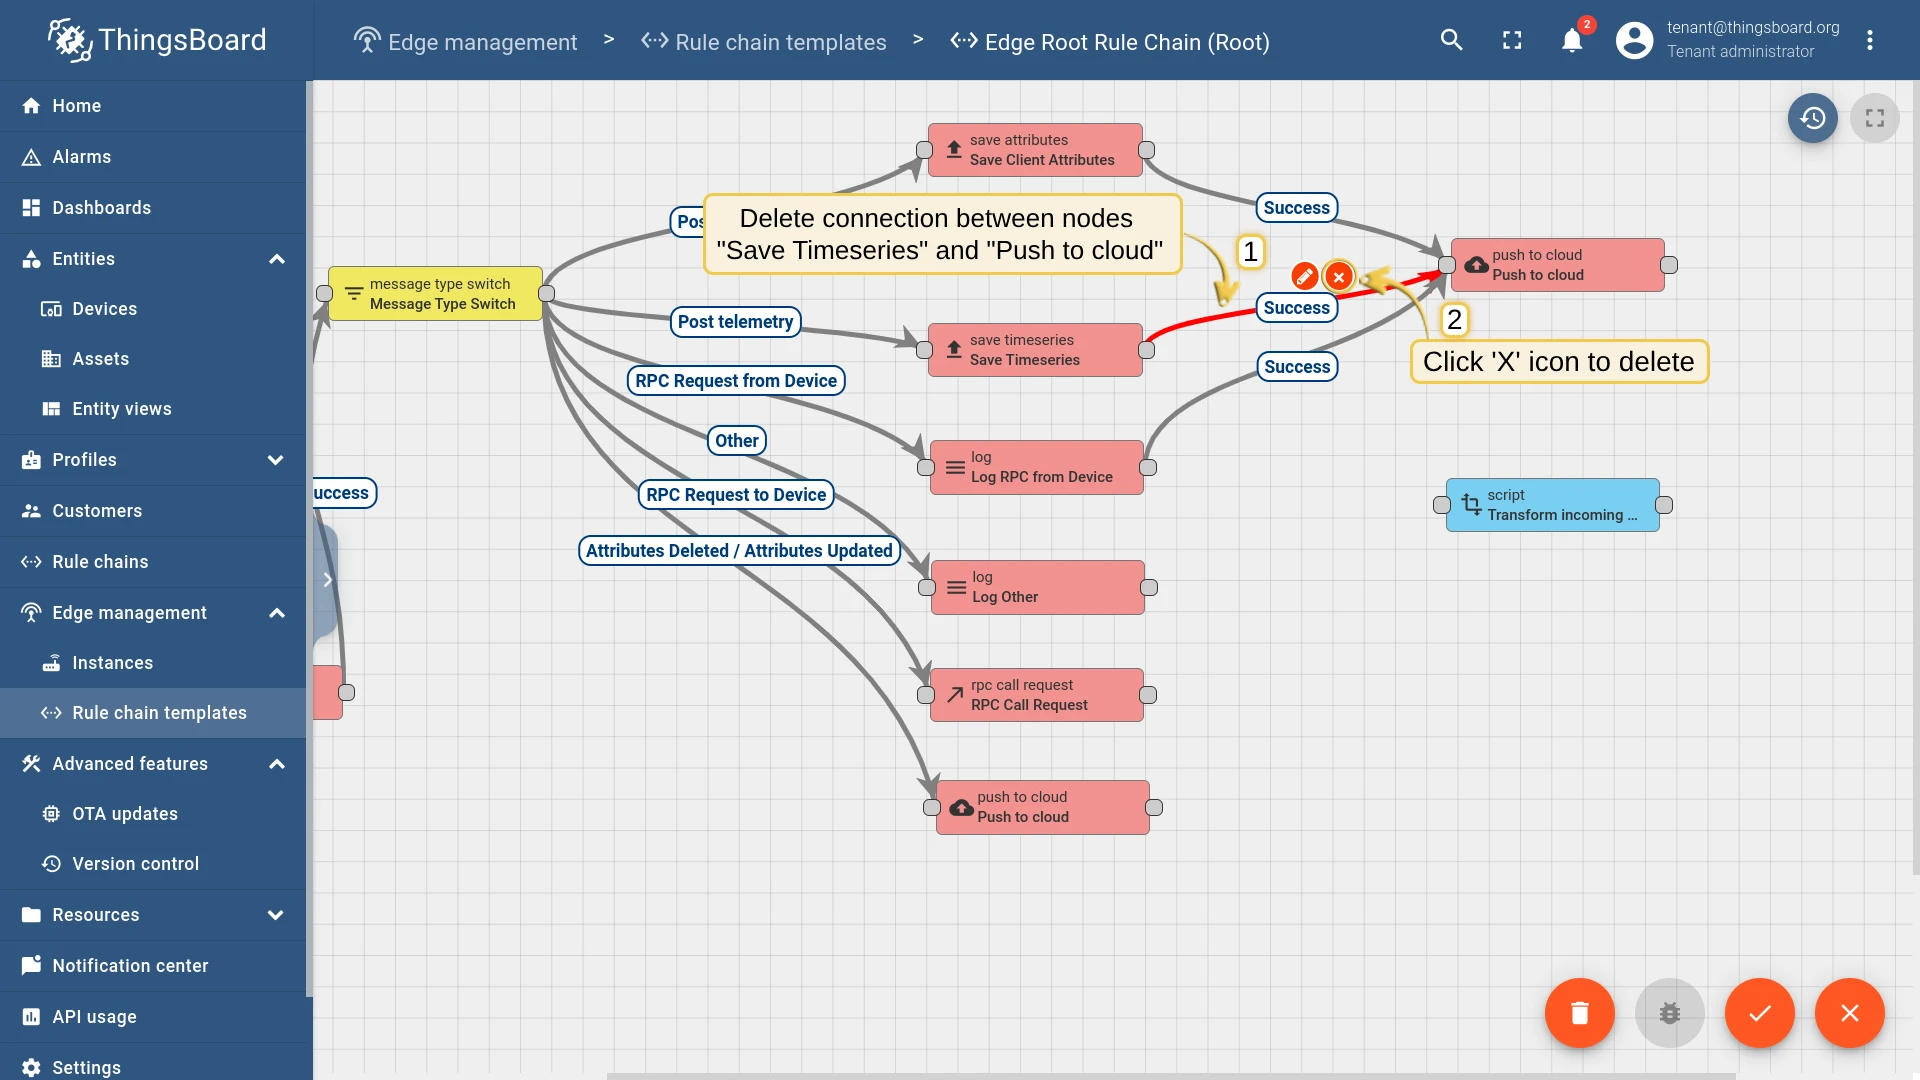
- Delete the connection between “save timeseries” and “push to cloud”: select the connection, then click X.
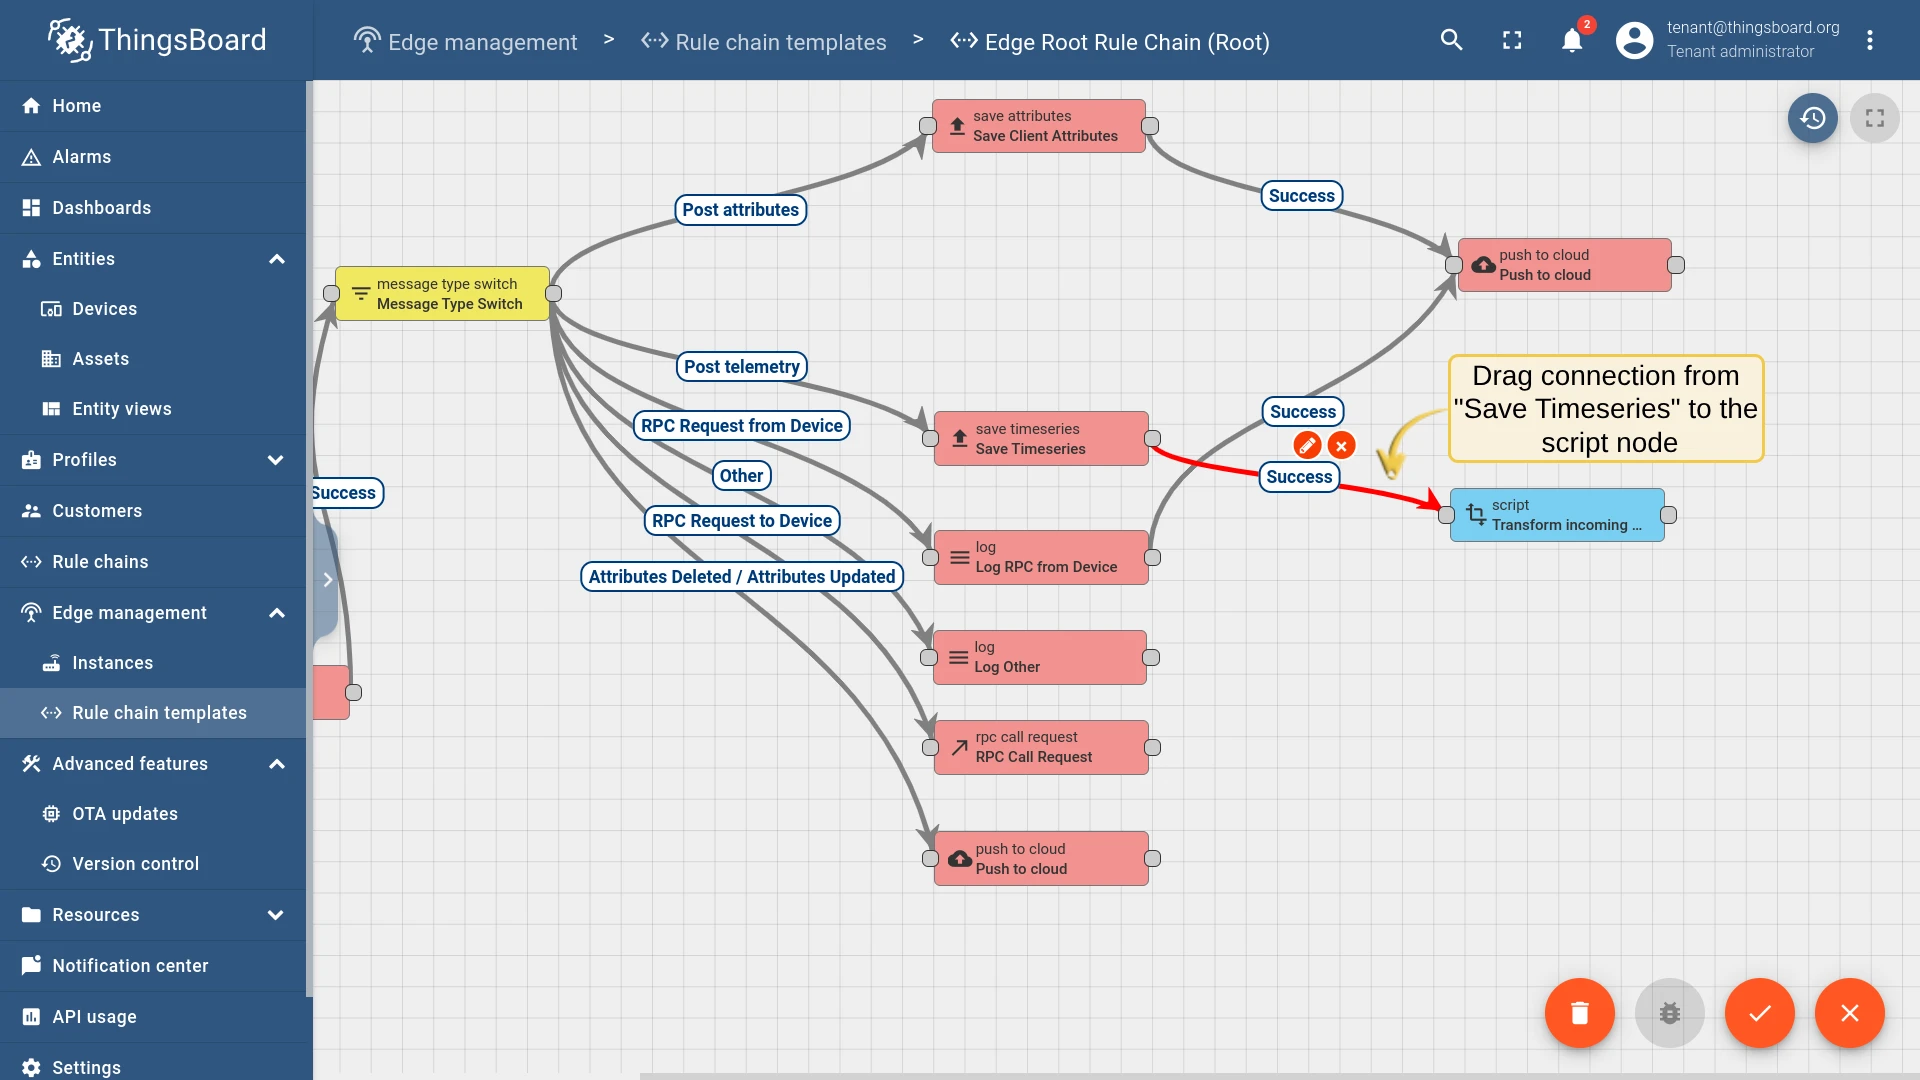
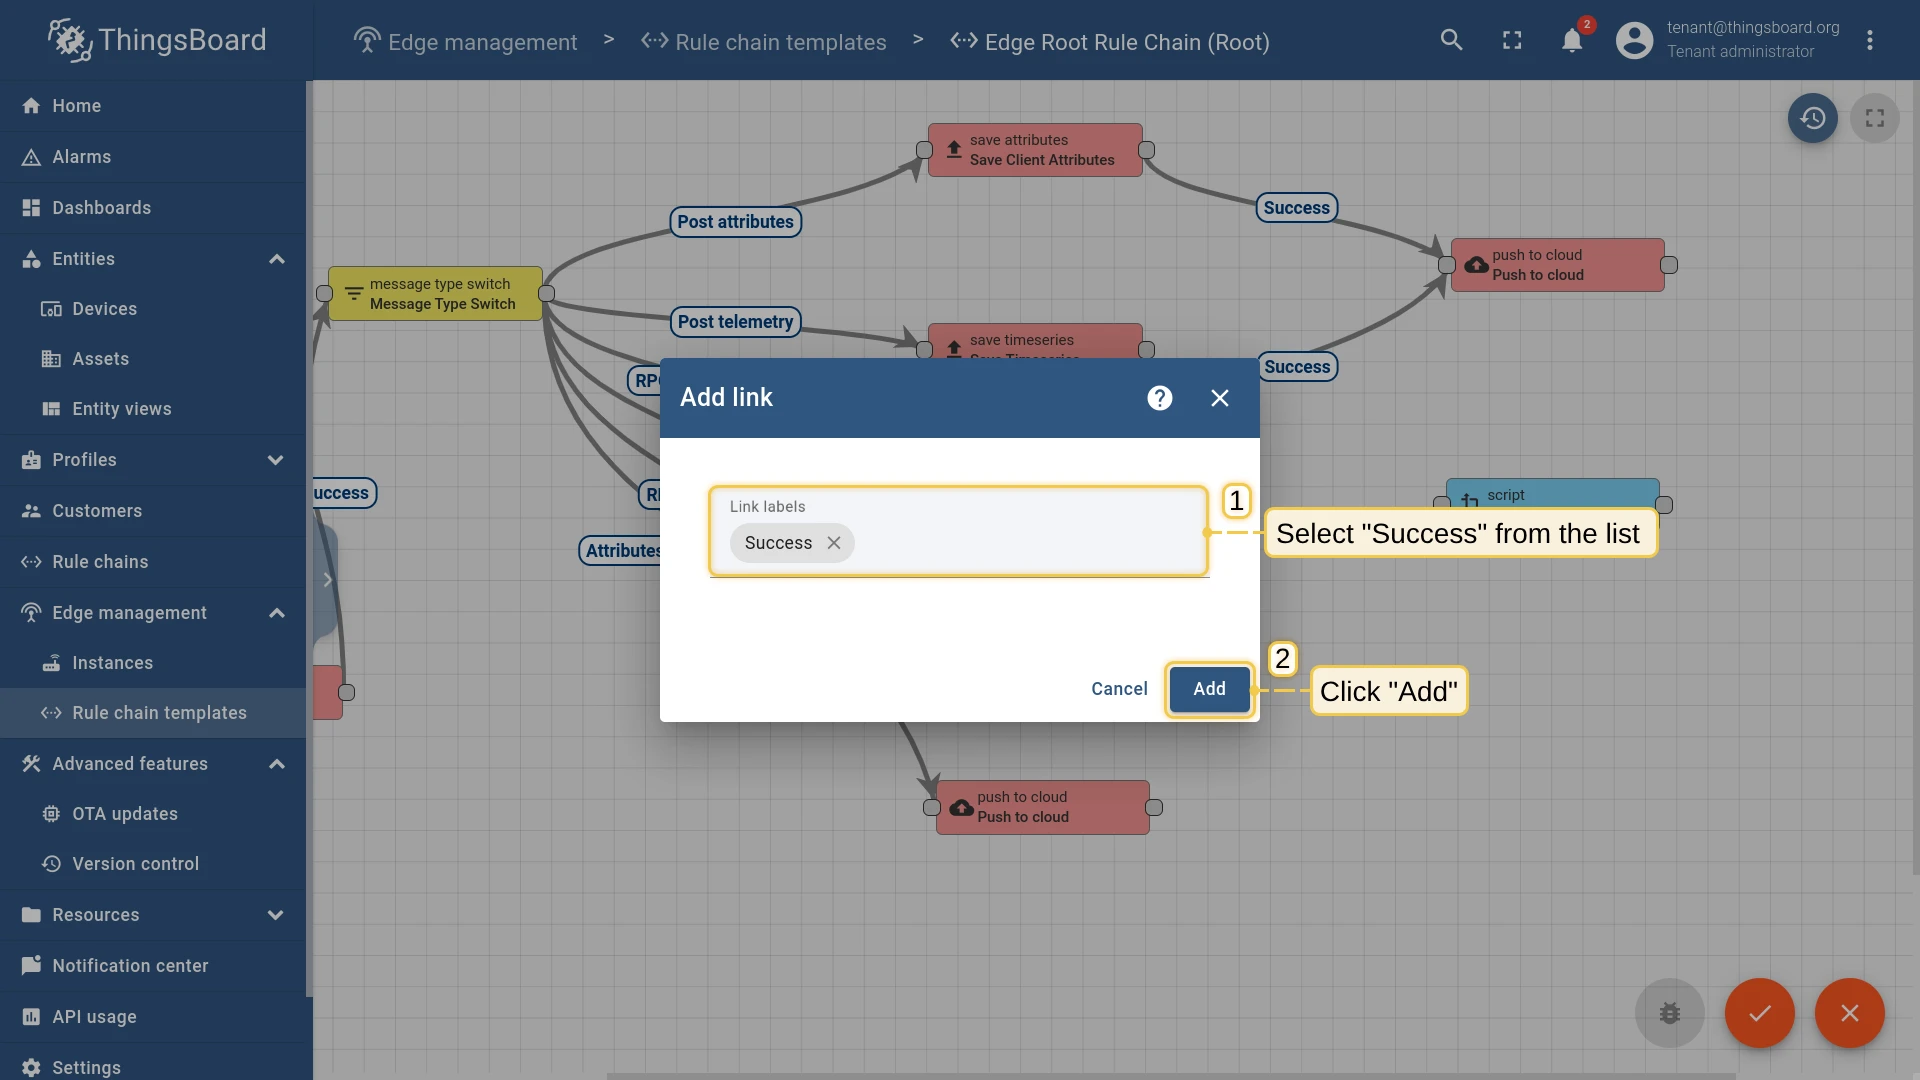
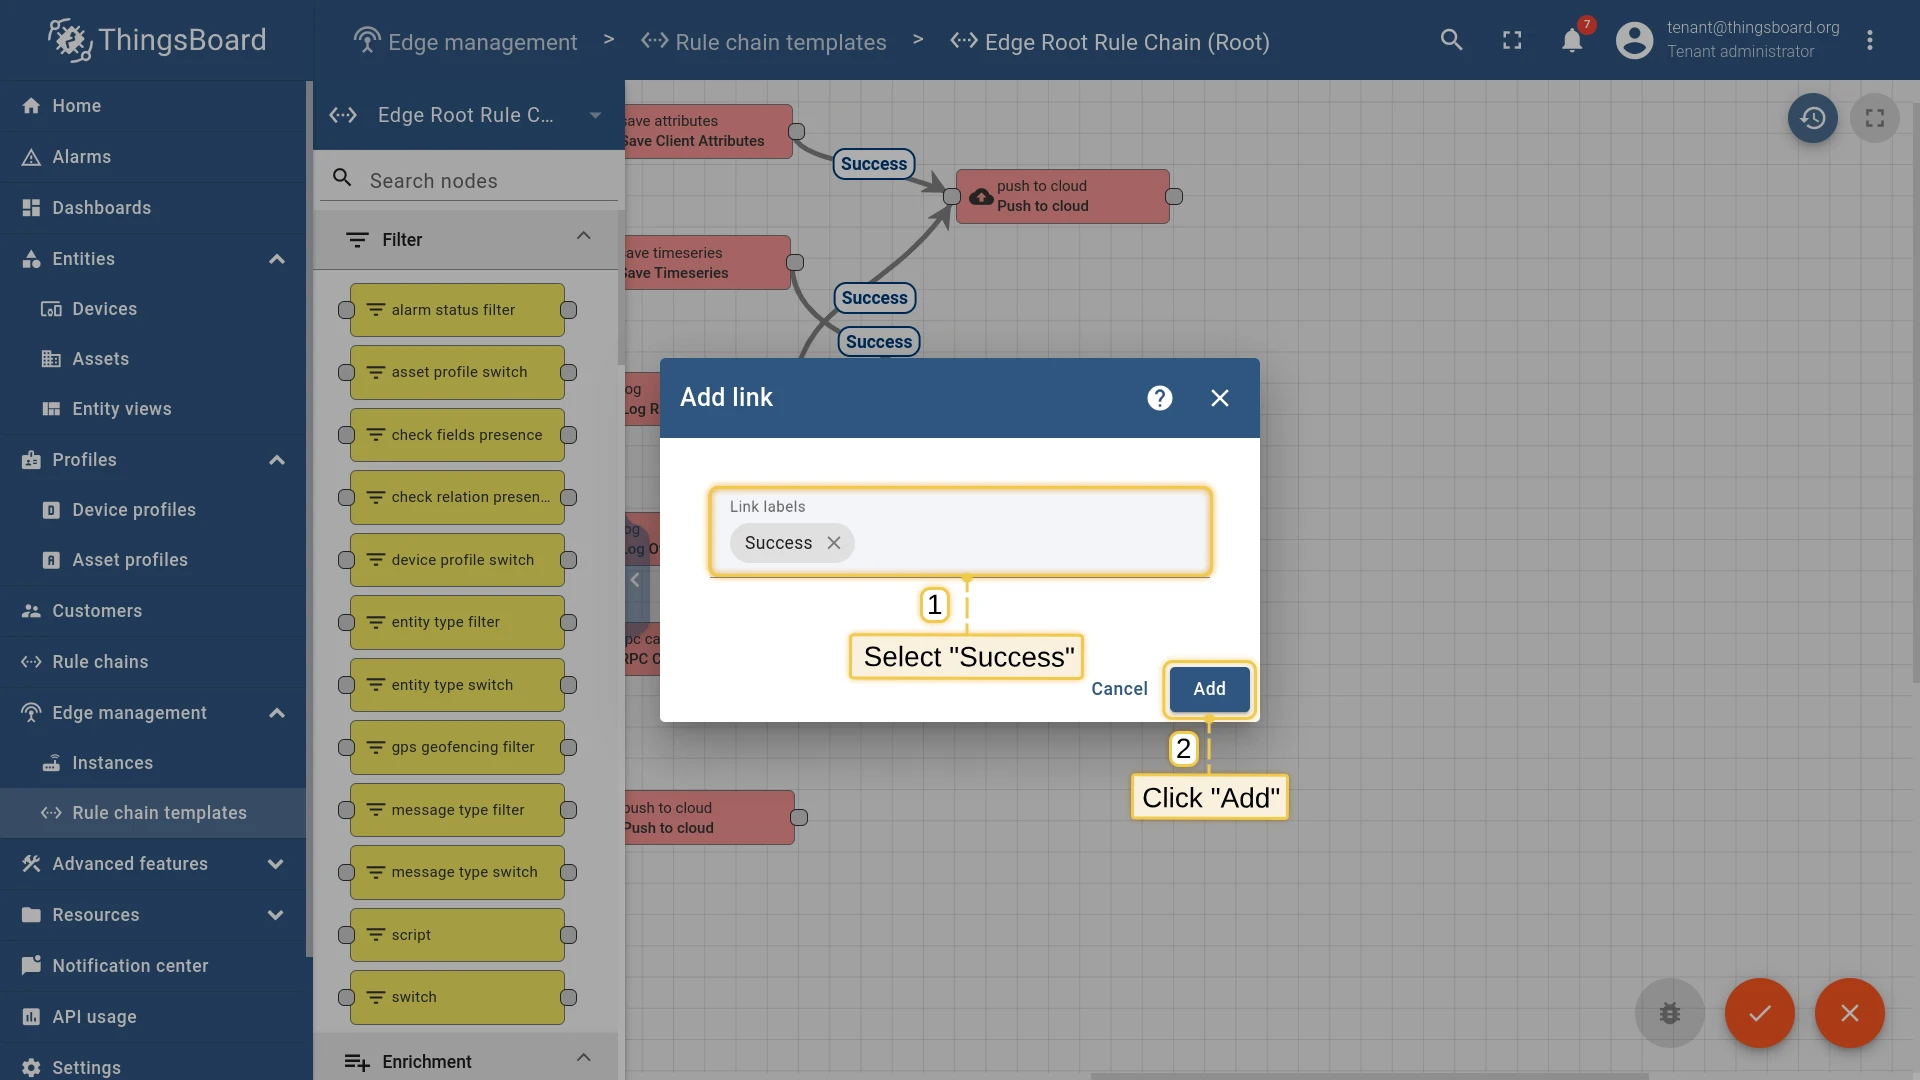
- Drag a new connection from “save timeseries” to “Transform Incoming Message”. Choose Success and click Add.
- Drag a connection from “Transform Incoming Message” to “push to cloud”. Choose Success and click Add.
- Click Apply Changes to save.
Now verify that the updated rule chain has been synchronized to the Edge instance.

Connect device and post telemetry
Section titled “Connect device and post telemetry”Get the device access token from Edge, then run the telemetry generator script.
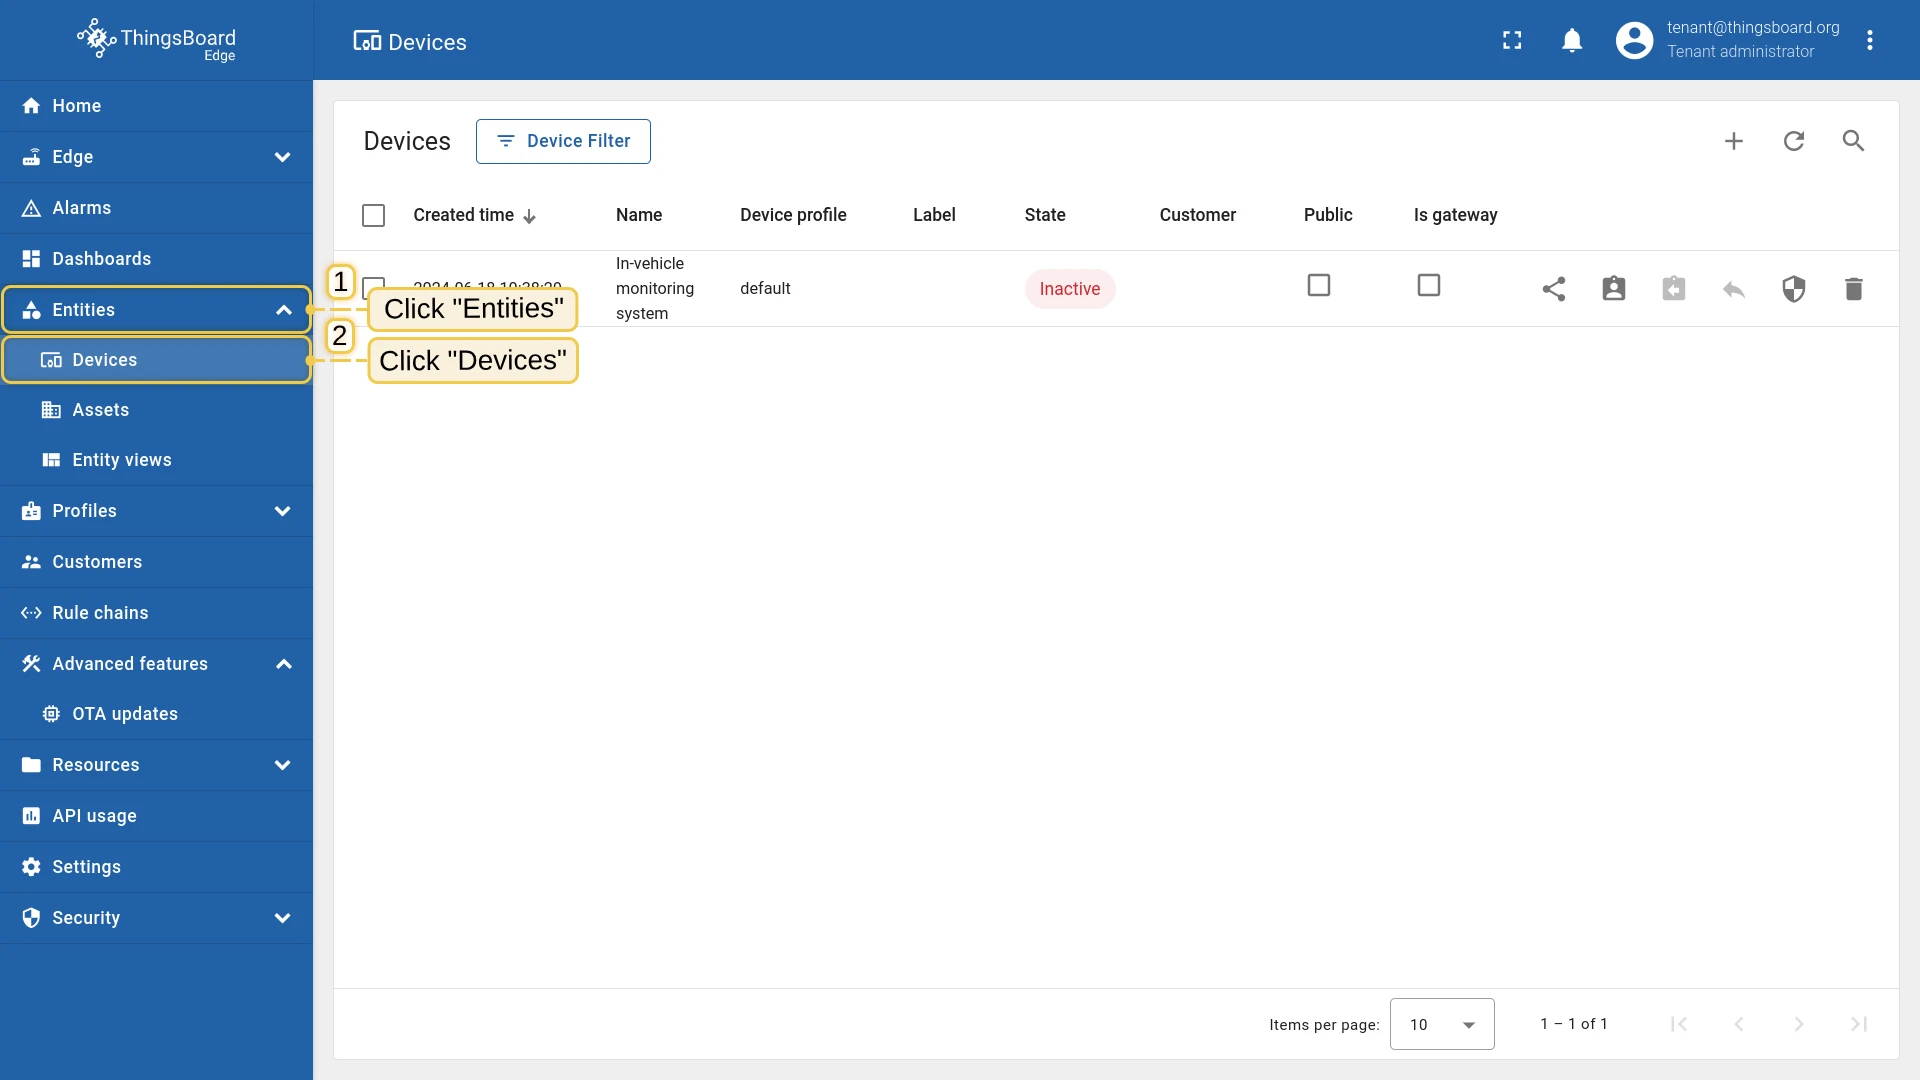
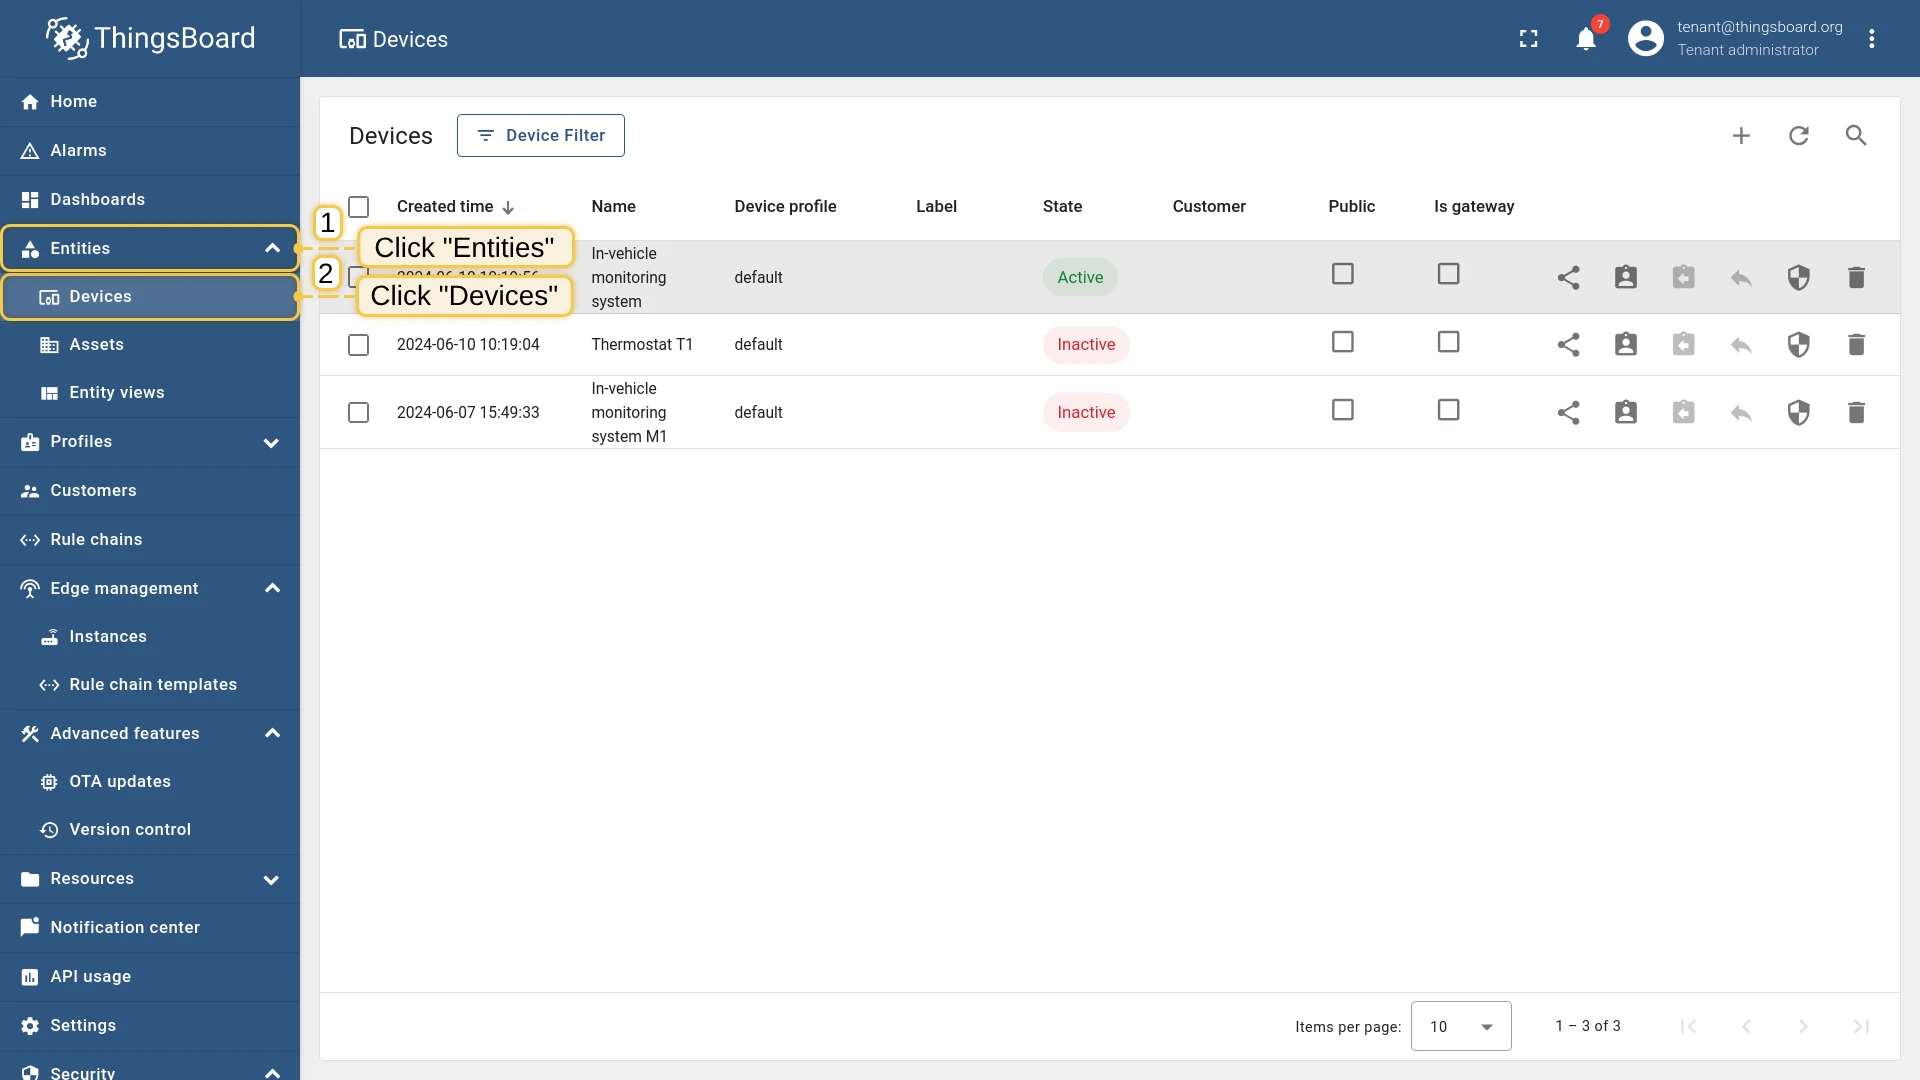
- In the ThingsBoard Edge UI, go to Entities → Devices.
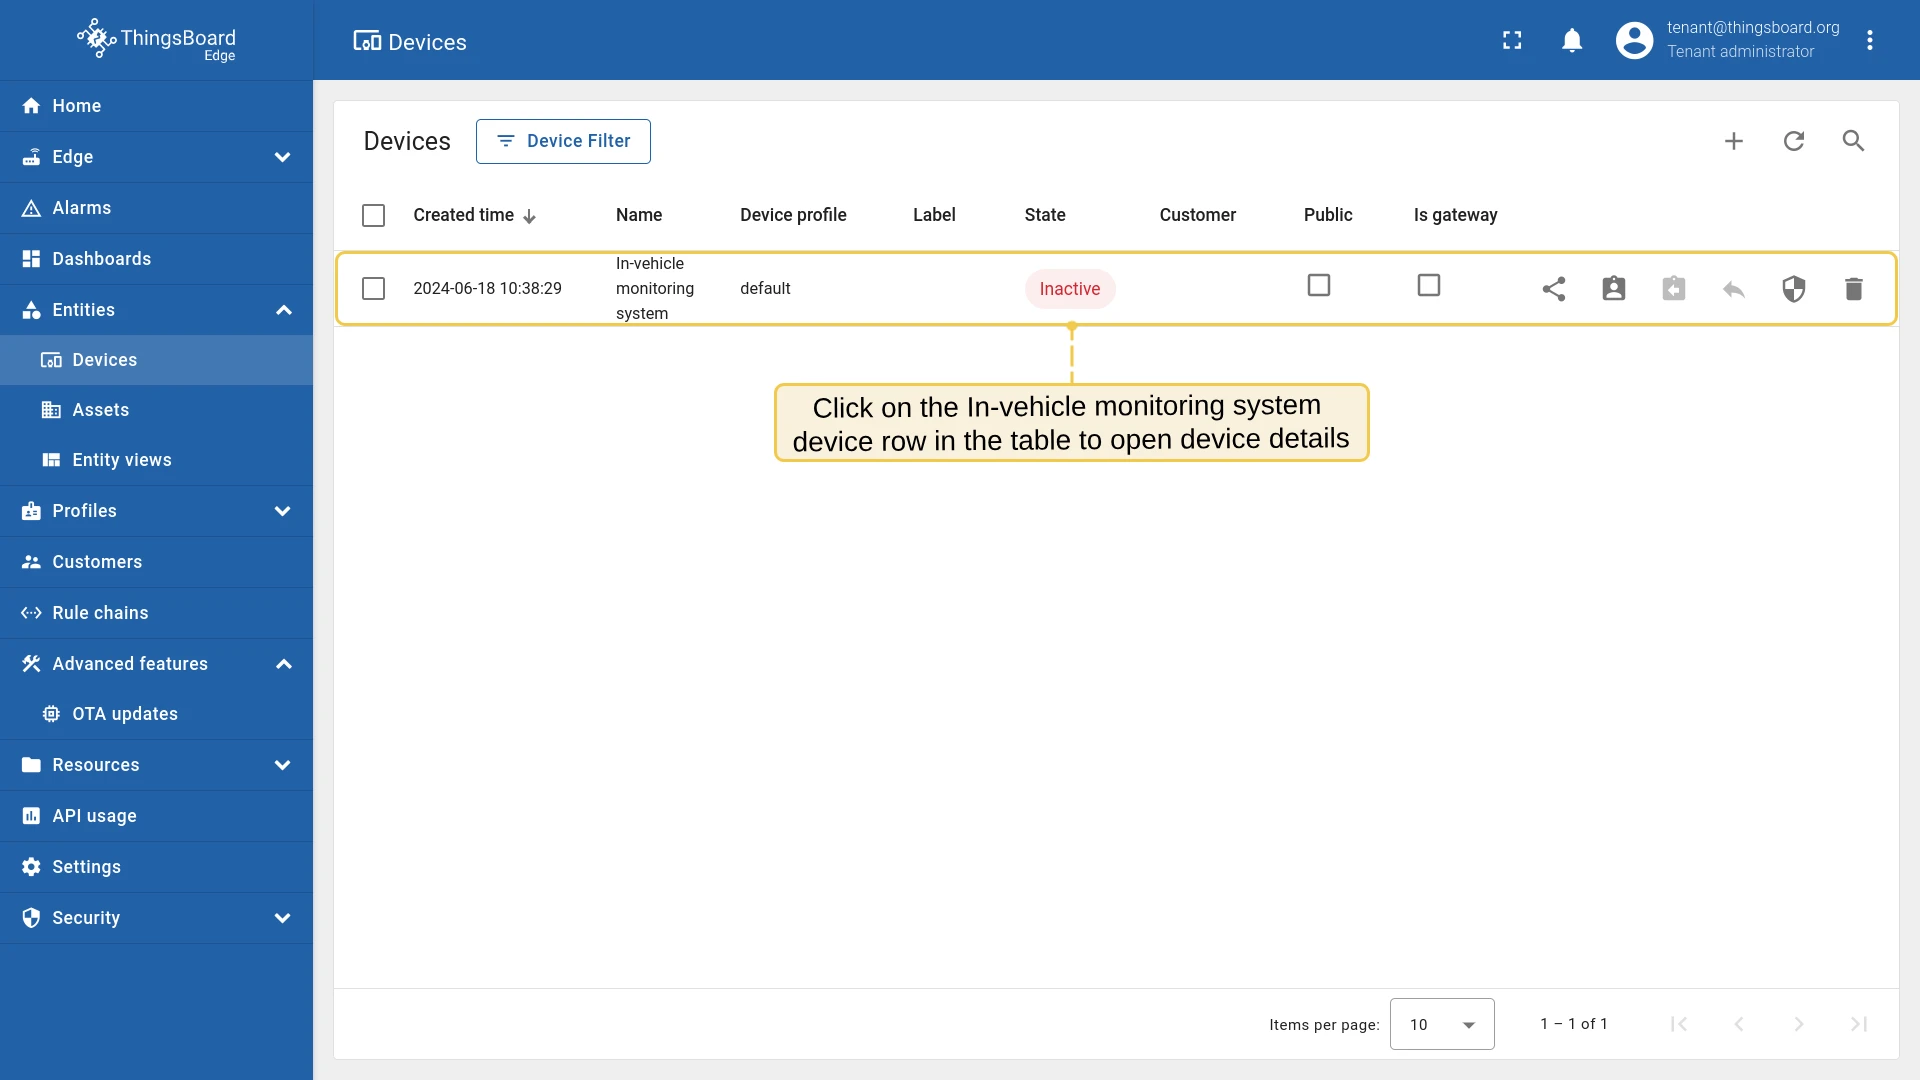
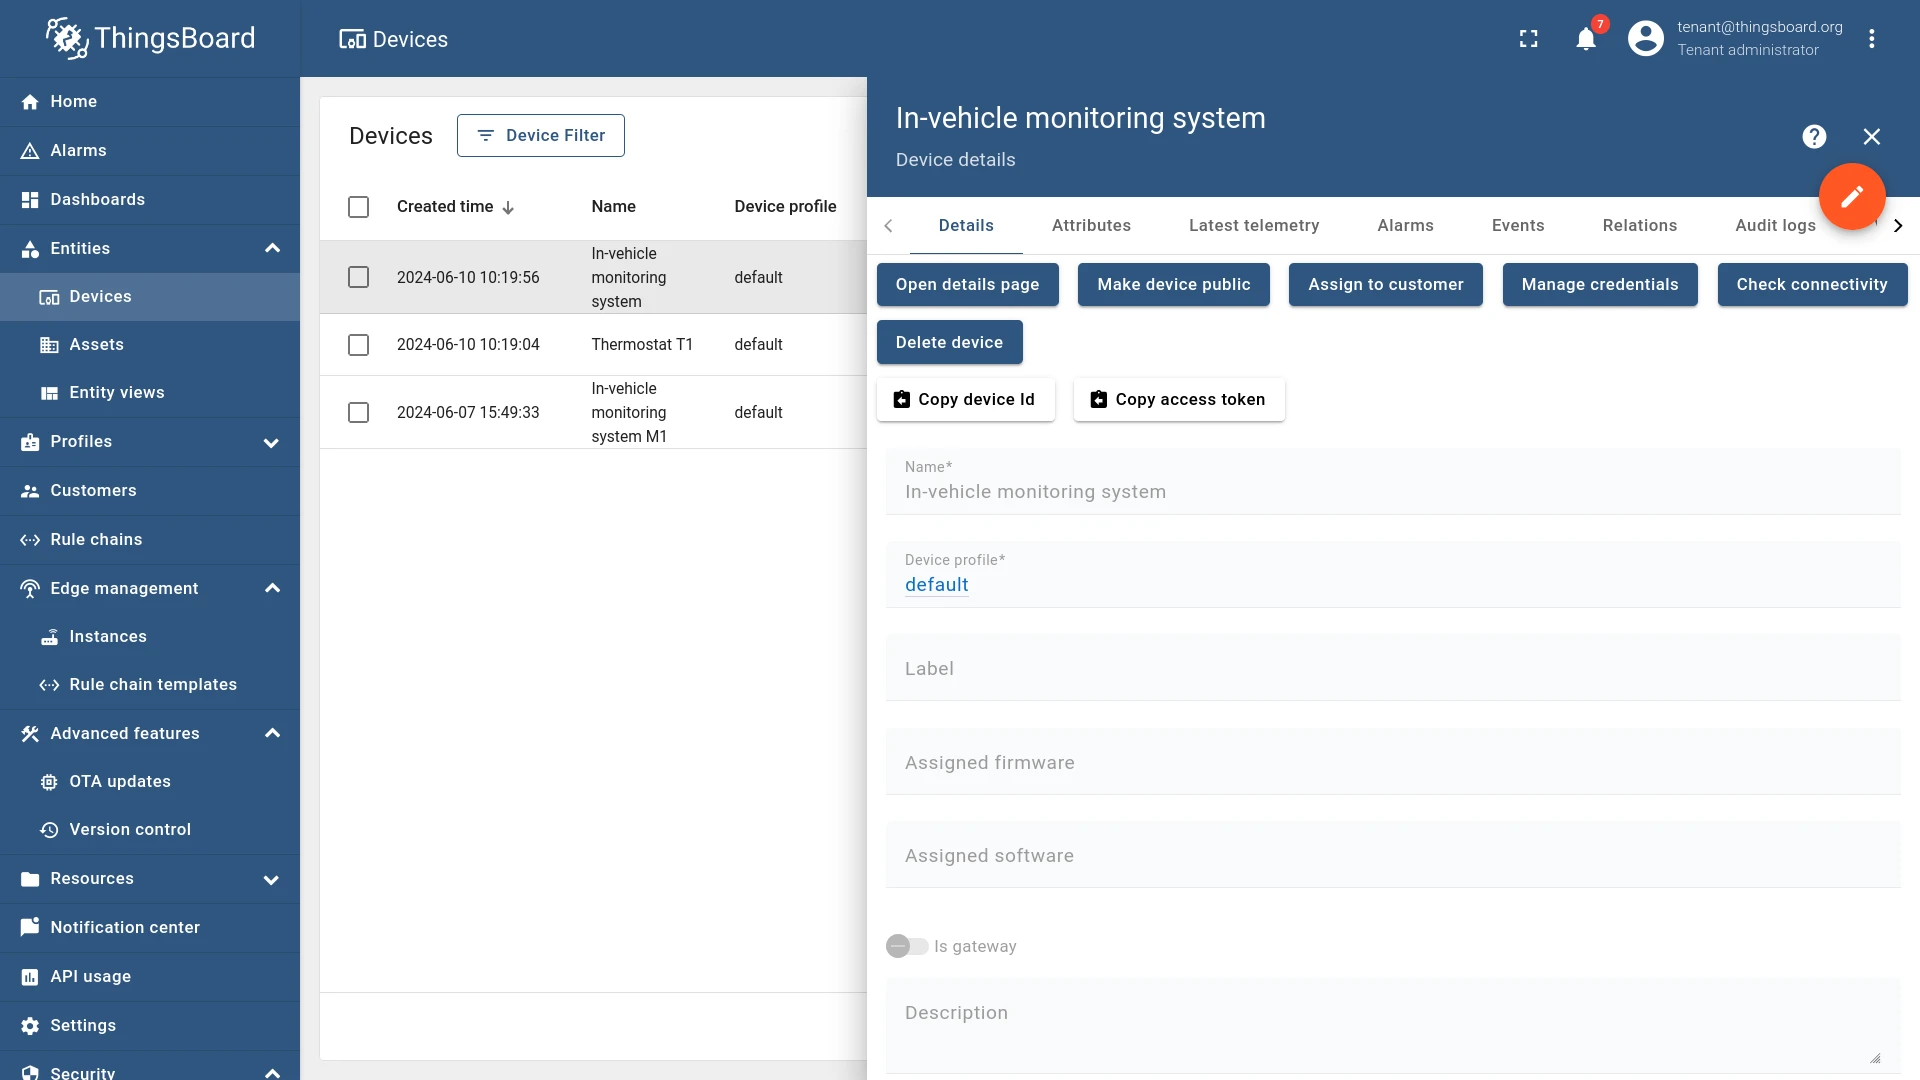
- Click on “In-vehicle monitoring system” to open device details.
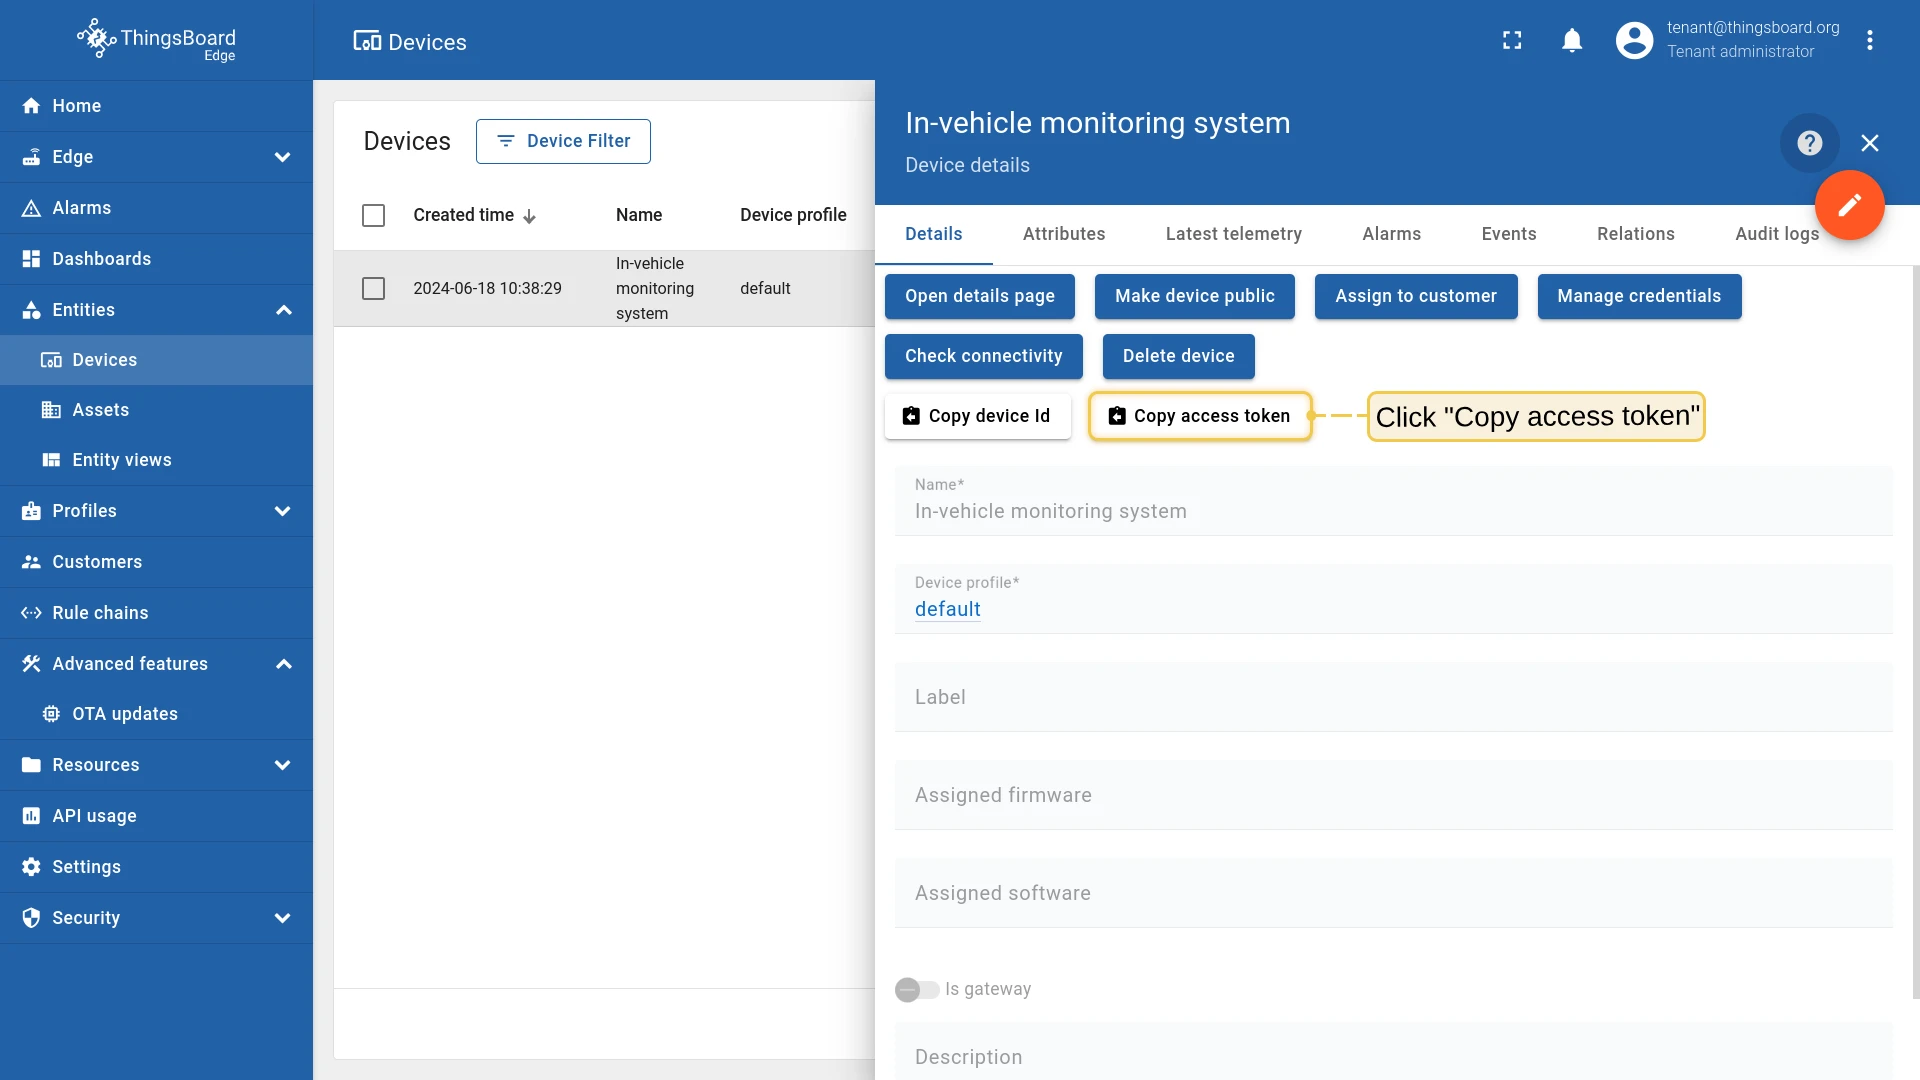
- Click Copy access token — the token is copied to your clipboard.
Install the MQTT Python library:
pip install paho-mqttDownload the telemetry generator script, update the three placeholders at the top, then run it:
import paho.mqtt.client as mqttimport jsonimport randomimport time
ACCESS_TOKEN = YOUR_ACCESS_TOKEN # REPLACE with your device access token, e.g. 'edge_vehicle'THINGSBOARD_EDGE_HOST = YOUR_TB_EDGE_HOST # REPLACE with your ThingsBoard Edge host, e.g. 'localhost'THINGSBOARD_EDGE_MQTT_PORT = YOUR_TB_EDGE_MQTT_PORT # REPLACE with your Edge MQTT port, e.g. 11883 or 1883DISTANCE = 0
def on_connect(client, userdata, rc, *extra_params): client.subscribe('v1/devices/me/rpc/request/+') client.publish('v1/devices/me/telemetry', get_telemetry(), 1) print(get_telemetry())
def get_telemetry(): return json.dumps(device)
while(True): device = { 'distance': DISTANCE, 'gas_consumption': random.randint(10, 15), 'vehicle_speed': random.randint(60, 70), 'engine_temperature': random.randint(195, 220), 'ambient_temperature': random.randint(65, 80), 'tire_temperature': random.randint(90, 110), 'tire_pressure_front_left': random.randint(30, 35), 'tire_pressure_front_right': random.randint(30, 35), 'tire_pressure_rear_left': random.randint(30, 35), 'tire_pressure_rear_right': random.randint(30, 35), } DISTANCE = DISTANCE + random.randint(0, 100)
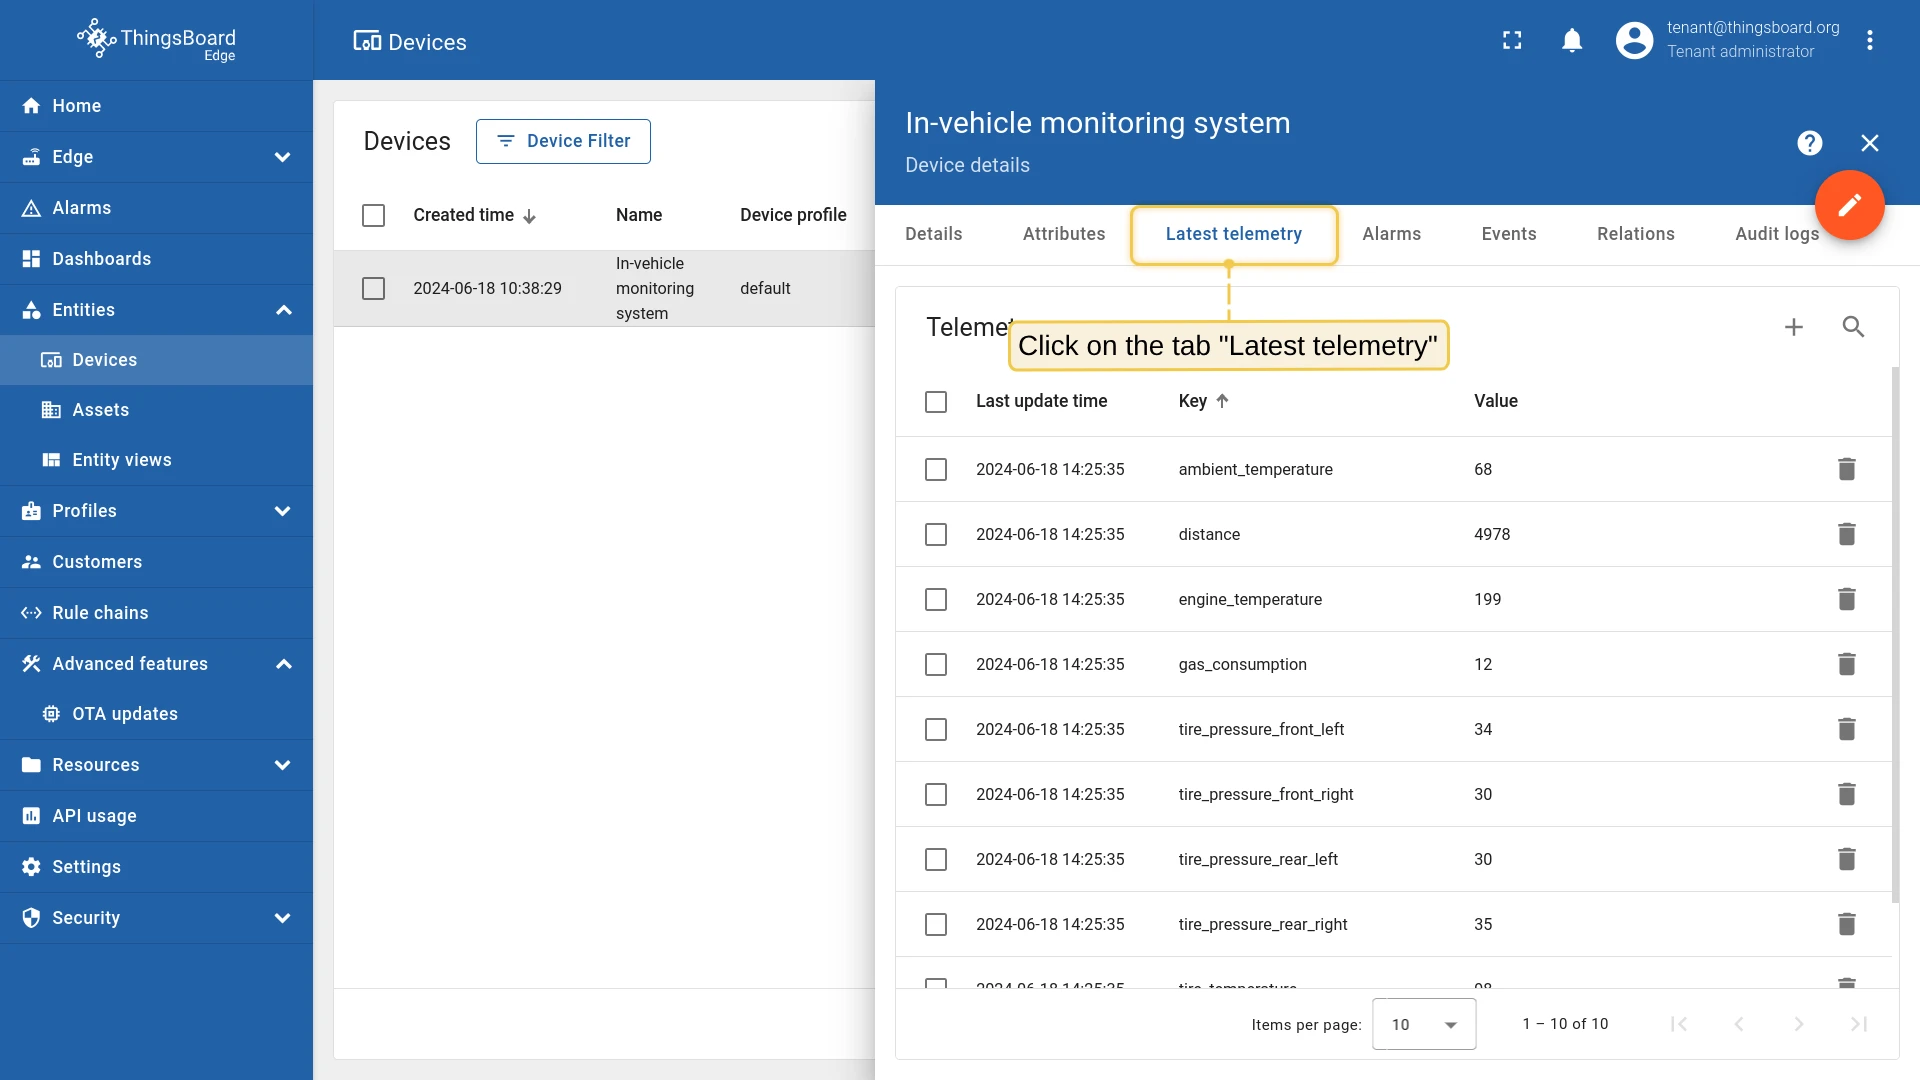
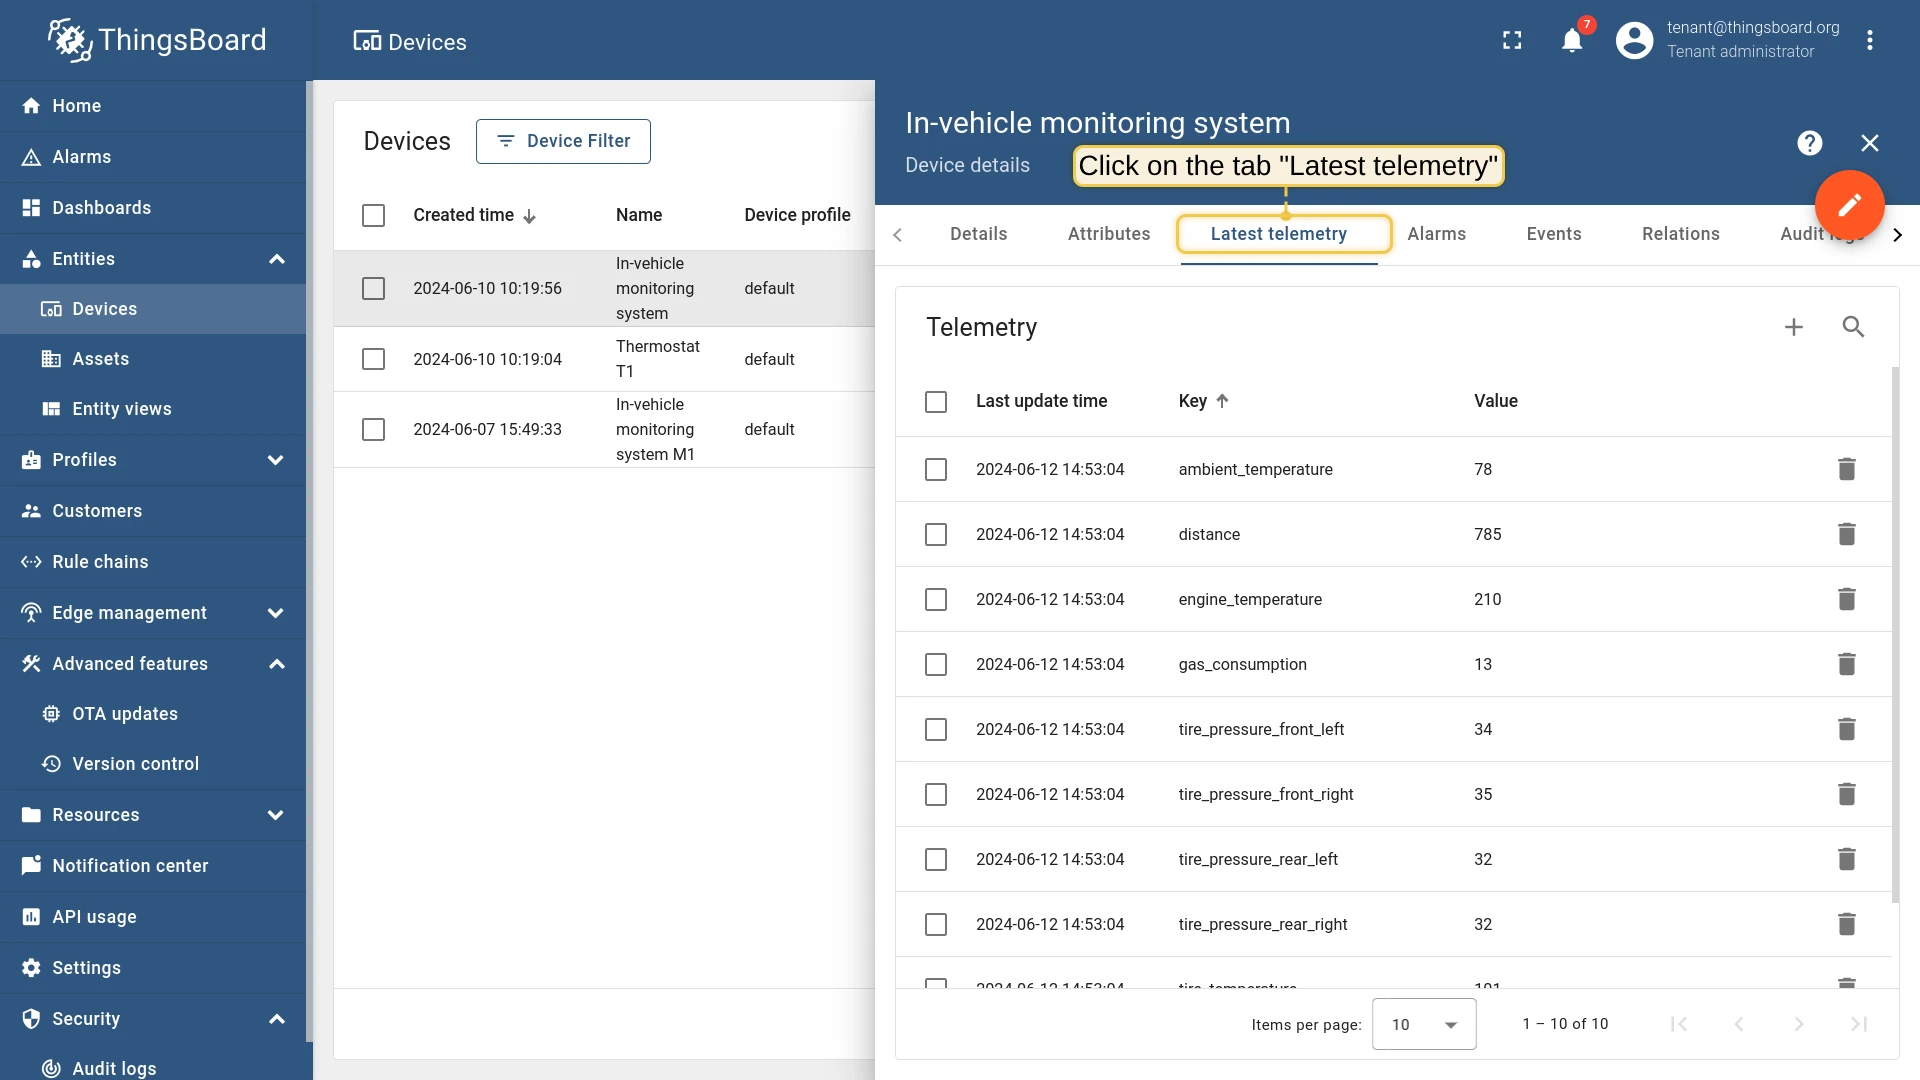
client = mqtt.Client() client.on_connect = on_connect client.username_pw_set(ACCESS_TOKEN) client.connect(THINGSBOARD_EDGE_HOST, THINGSBOARD_EDGE_MQTT_PORT, 60) try: time.sleep(5) client.loop() except KeyboardInterrupt: client.loop_stop() print("Exited!")python mqtt-generator.pyVerify that the device is receiving all 10 sensor readings on Edge:


Verify that only distance readings are pushed to the ThingsBoard server:
Create dashboard
Section titled “Create dashboard”Create a dashboard on the ThingsBoard server to visualize the total distance traveled.
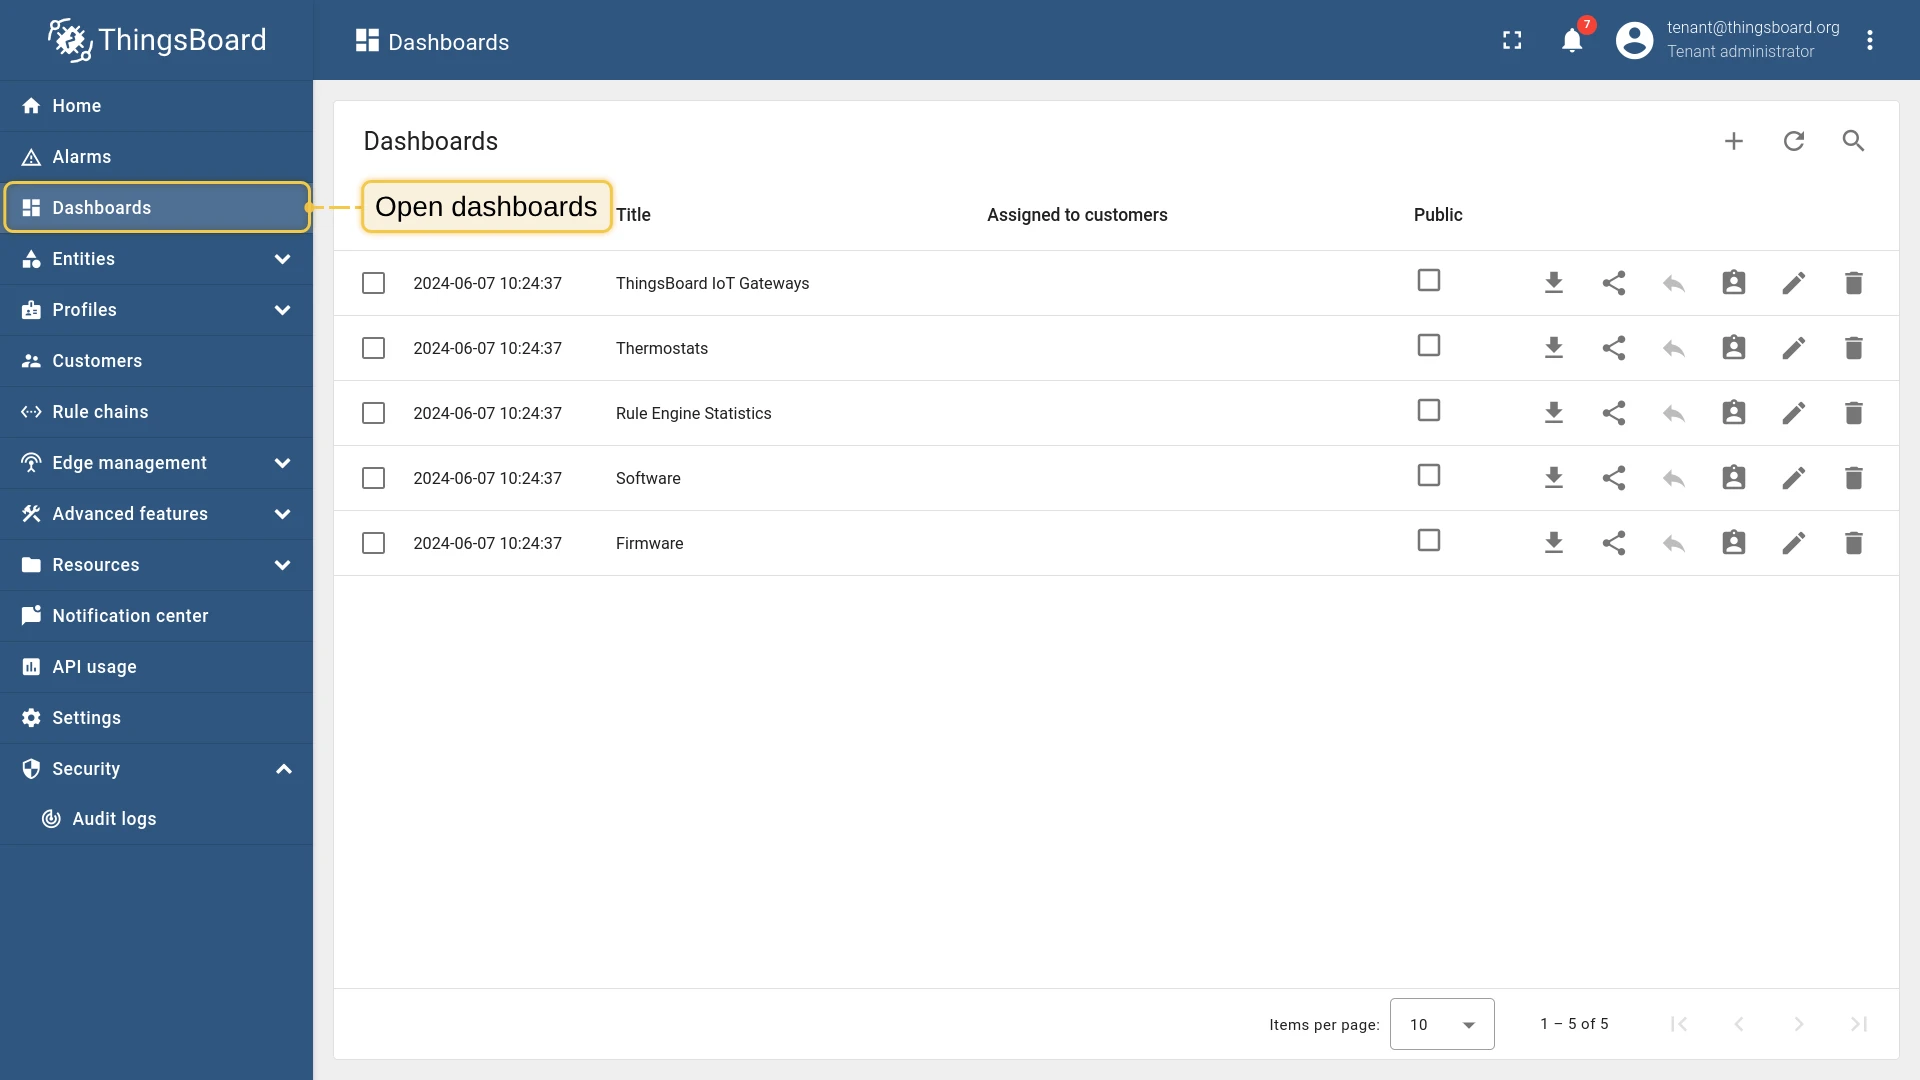
- Log in to the ThingsBoard server. Navigate to Dashboards.
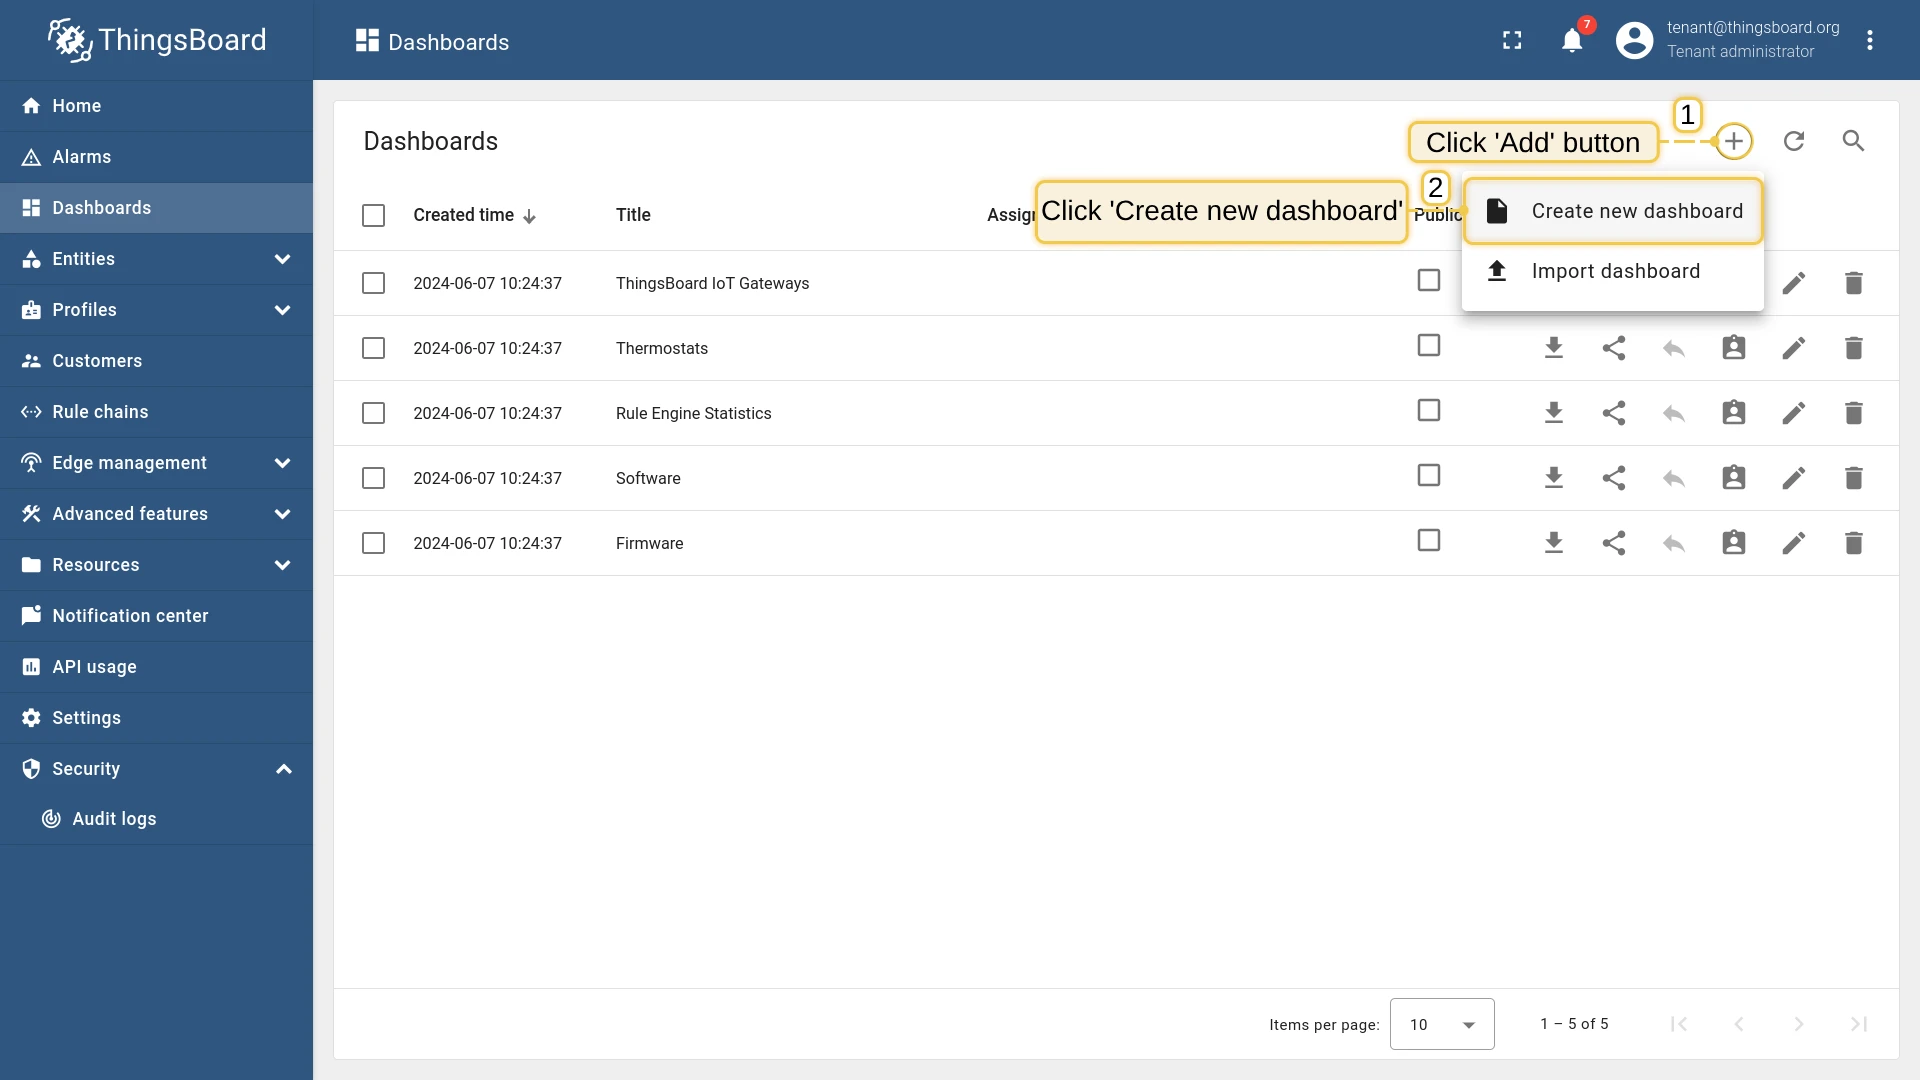
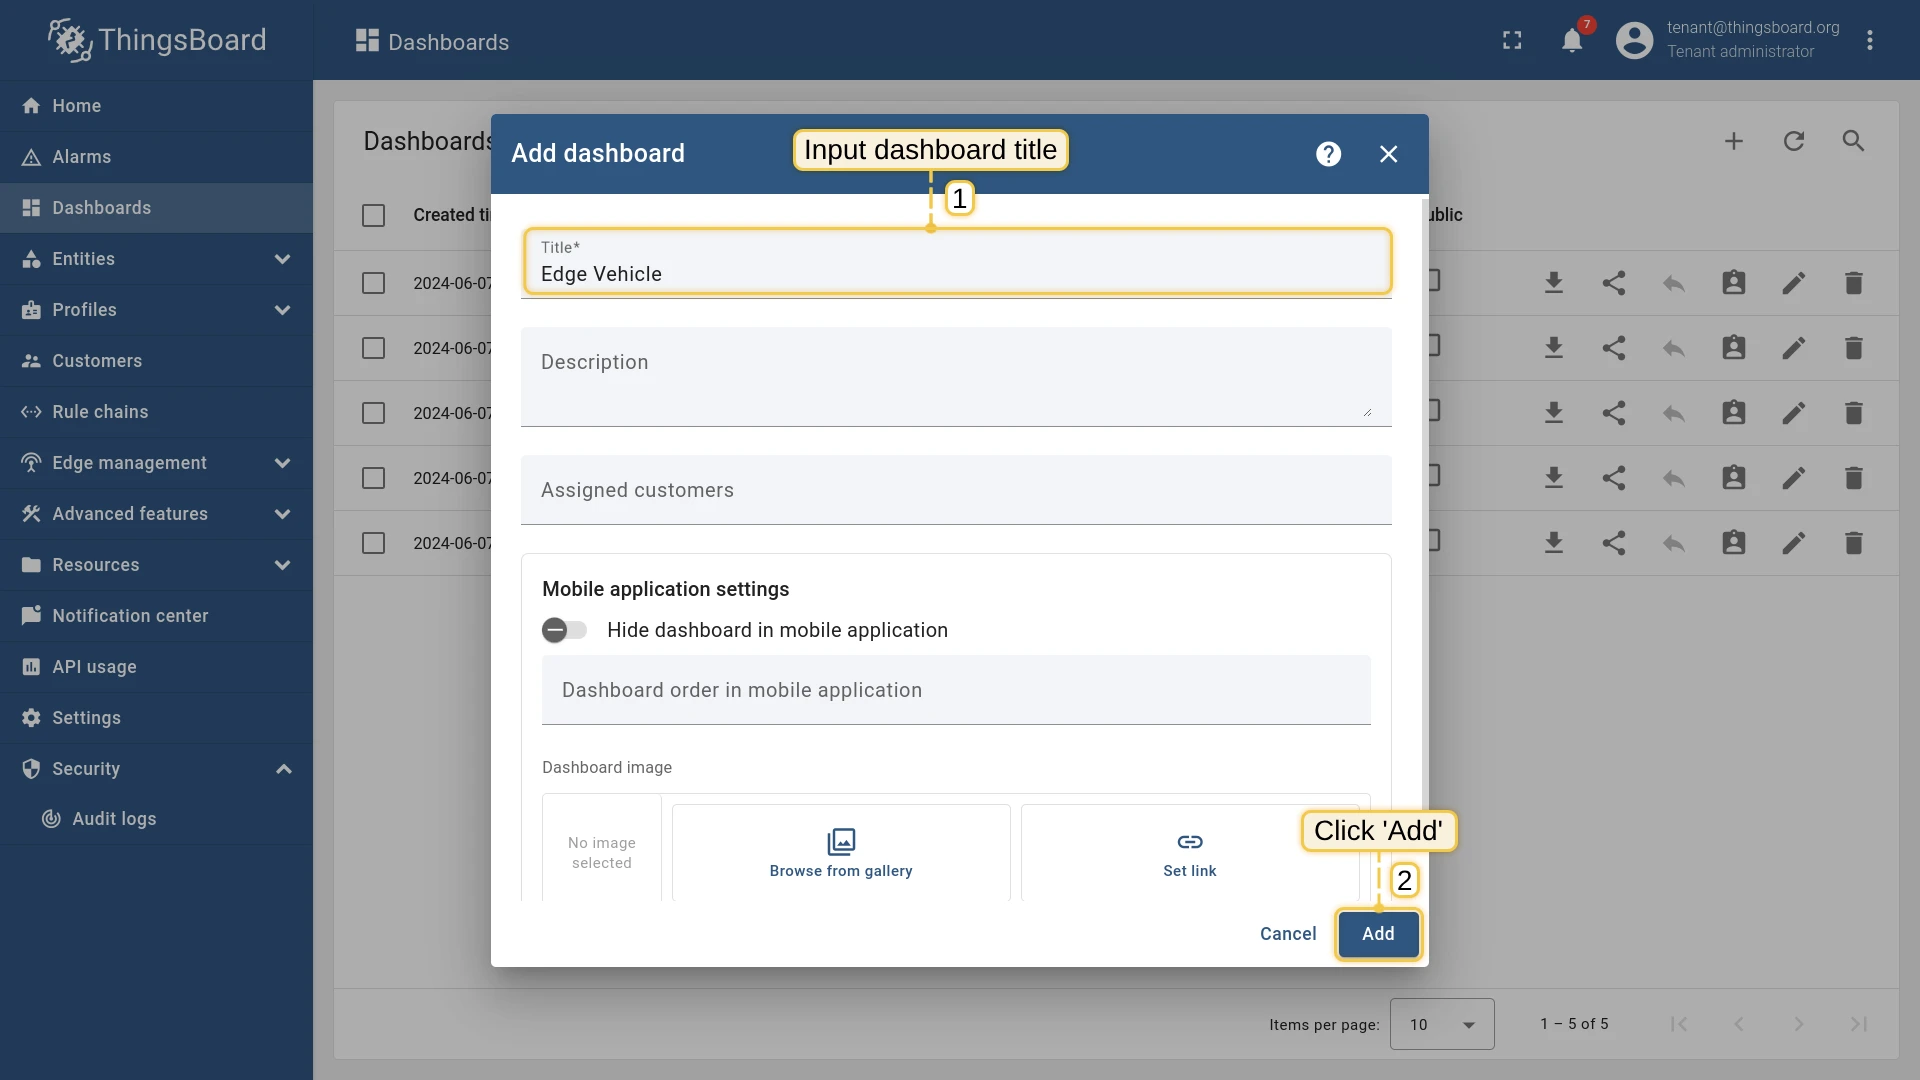
- Click ”+” and select Create new dashboard. Enter the title “Edge Vehicle” and click Add.
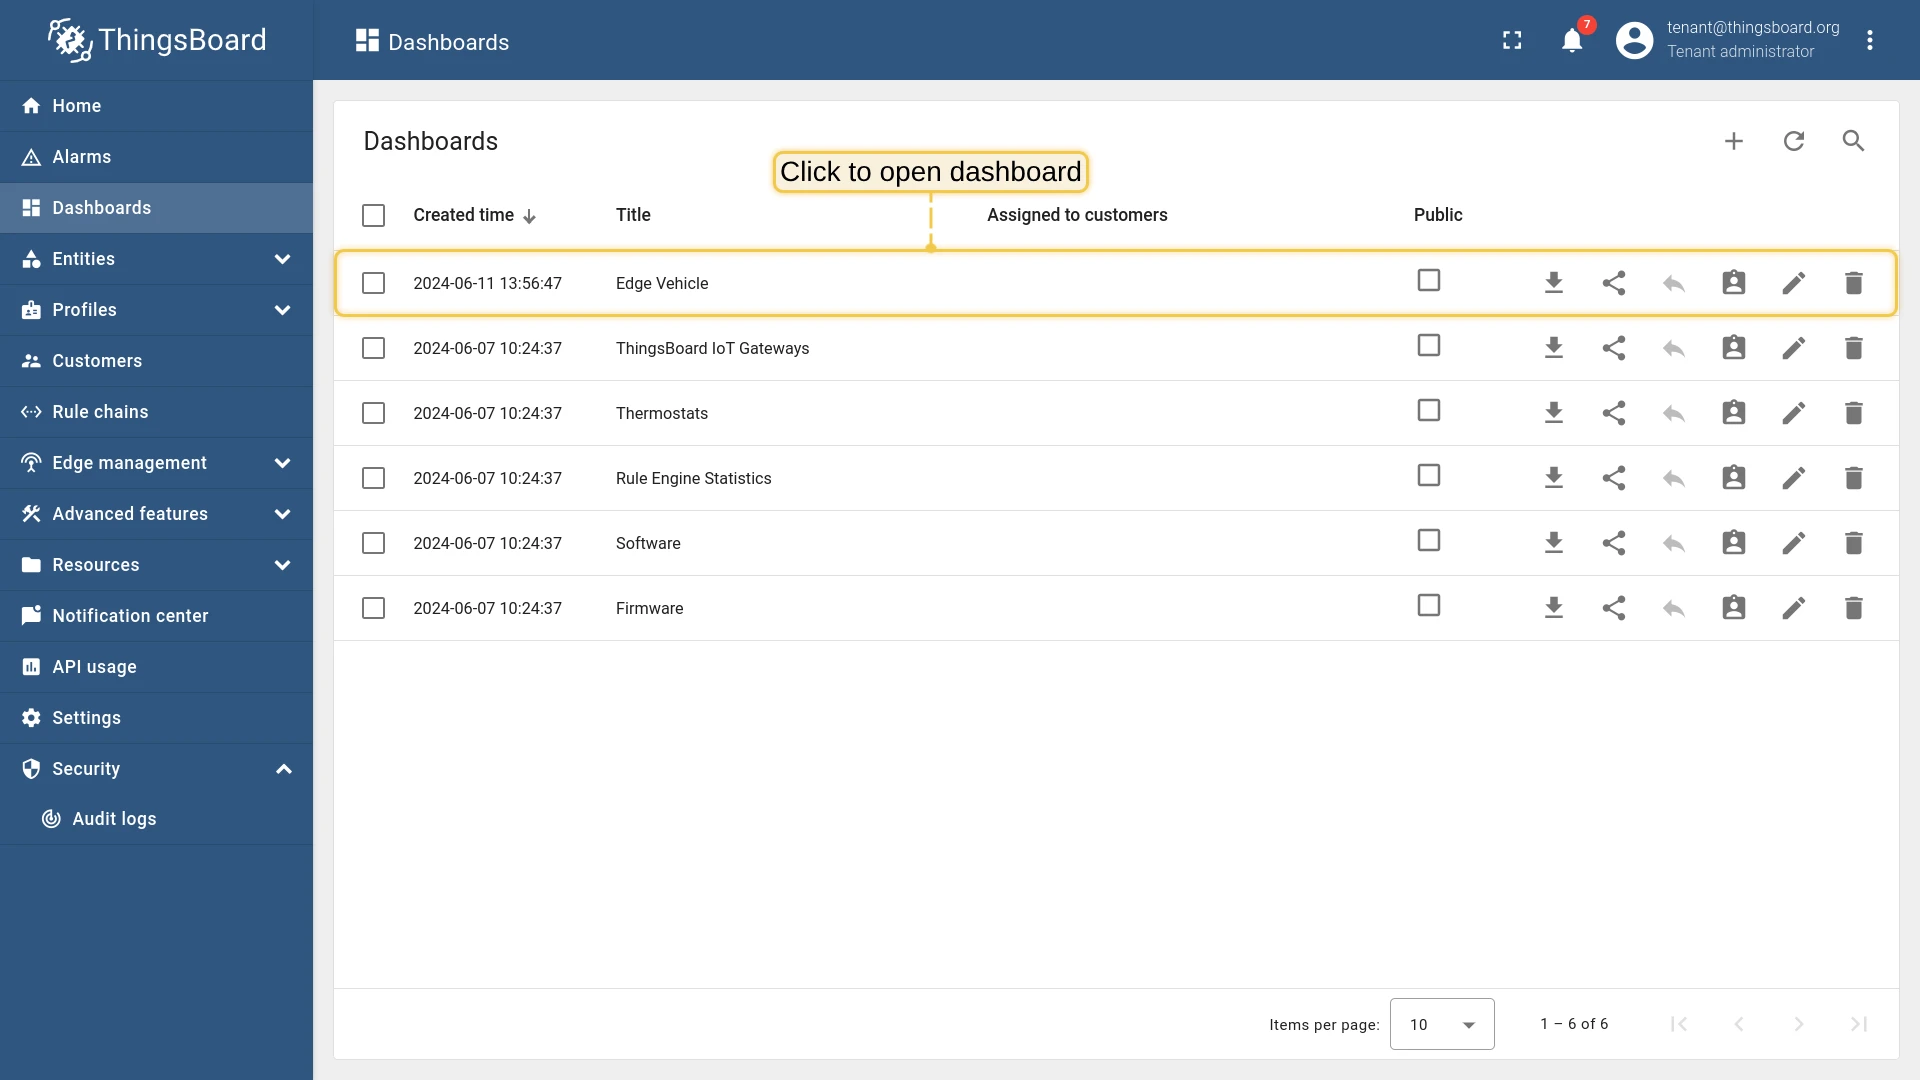
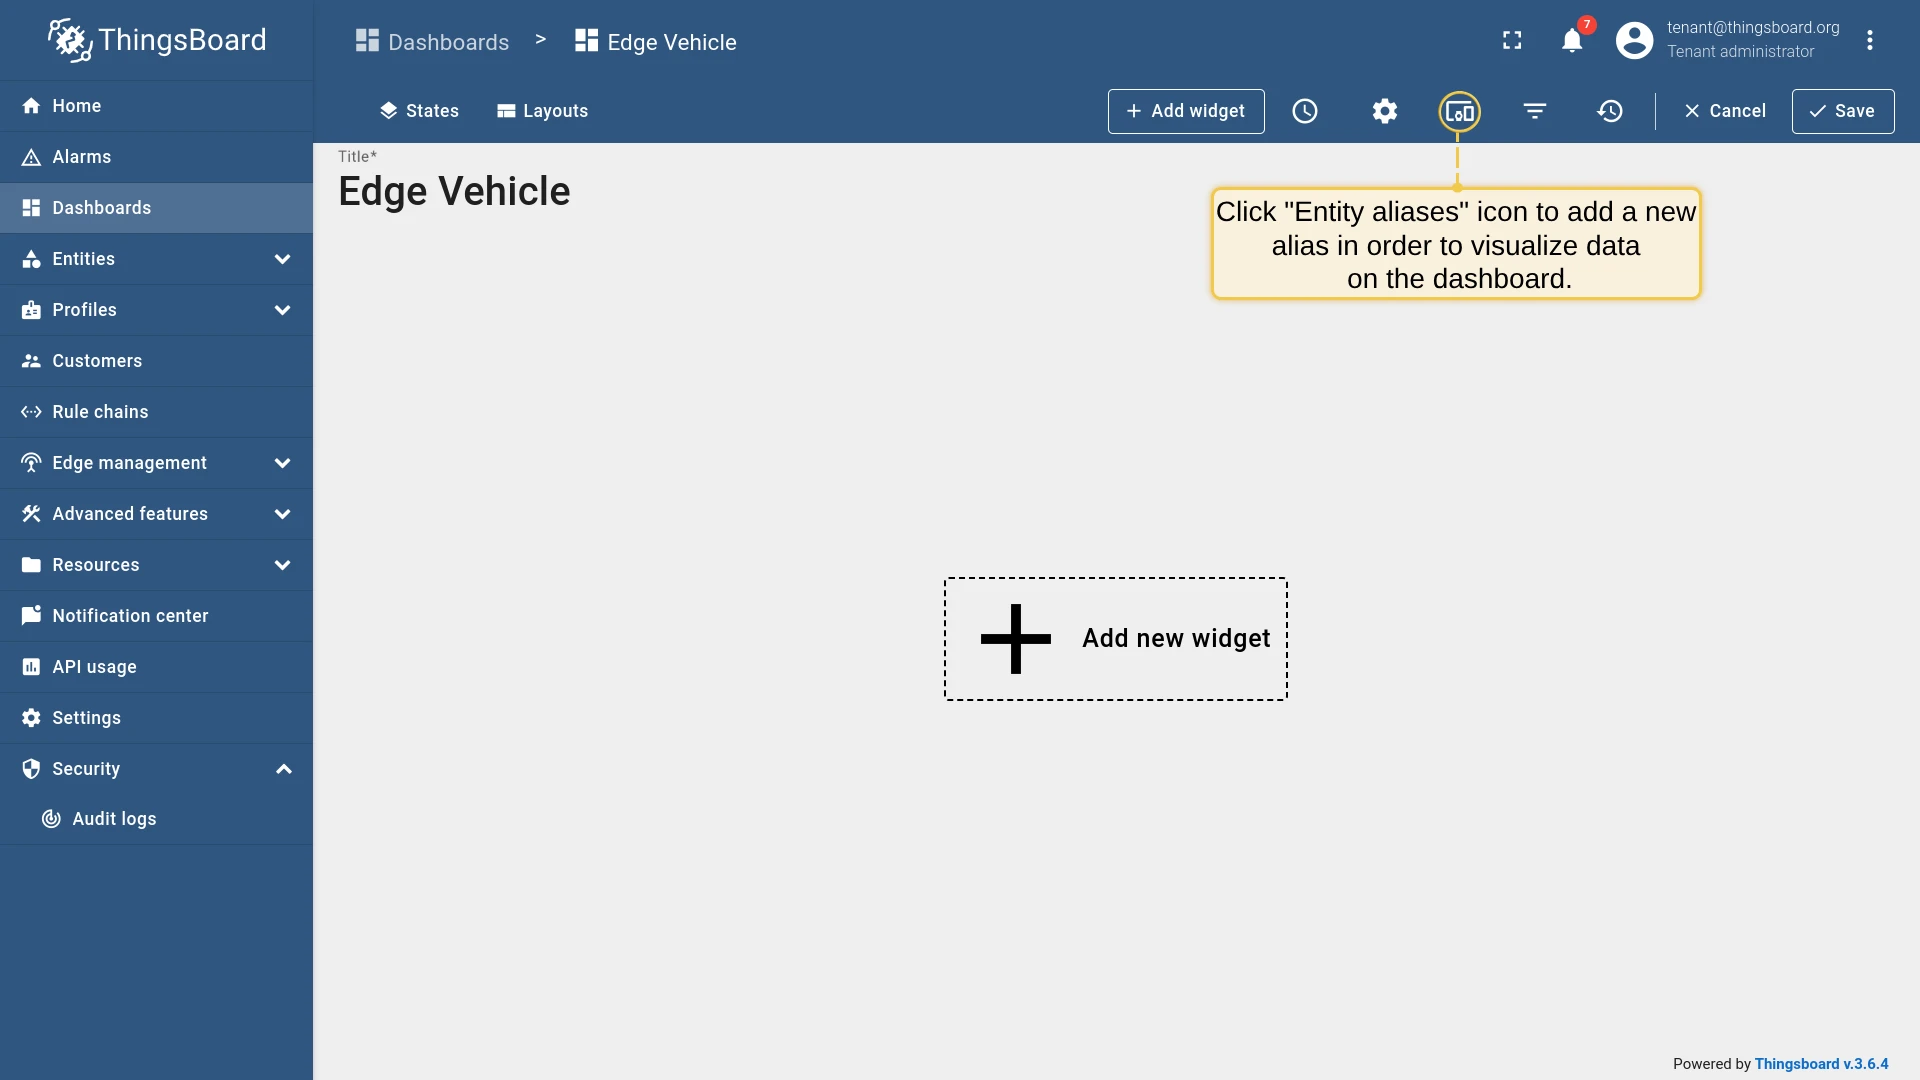
- Open the “Edge Vehicle” dashboard to begin editing.
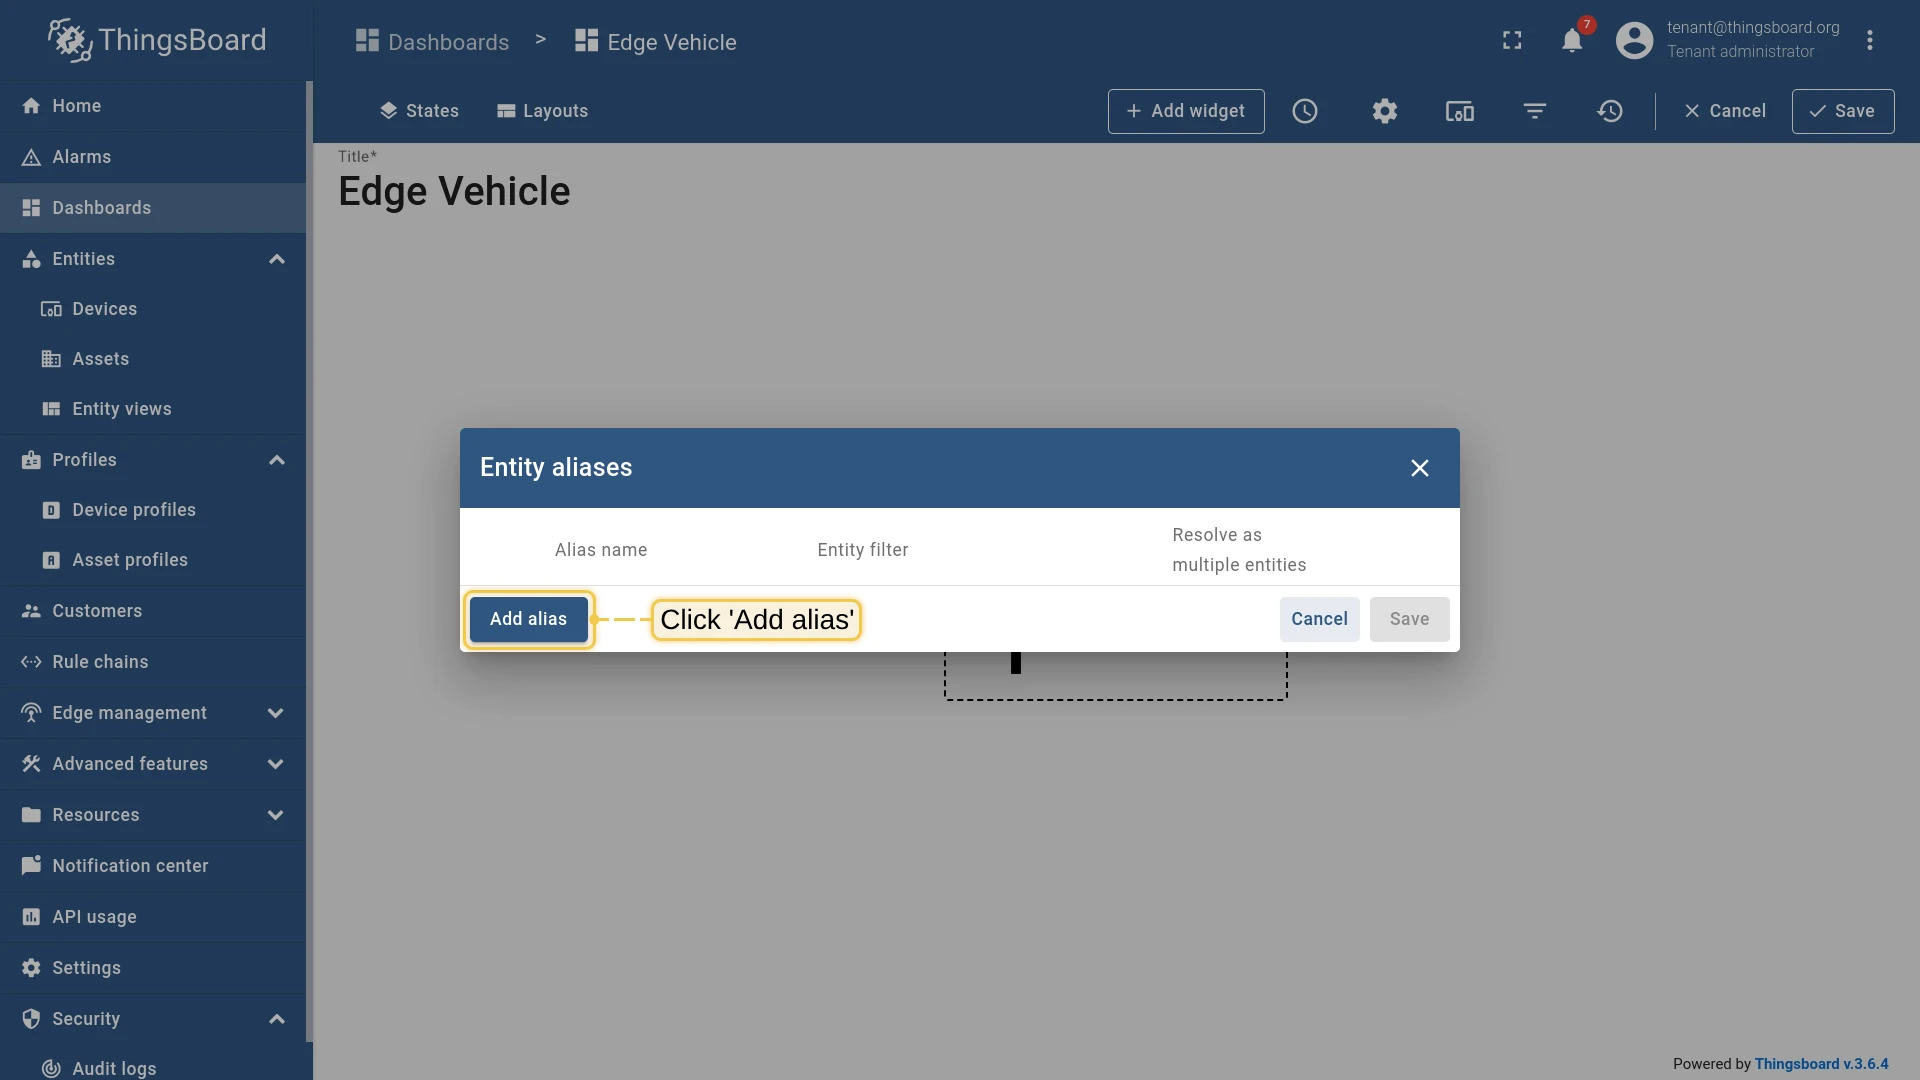
- Click the Entity aliases icon in the toolbar. Click Add alias.
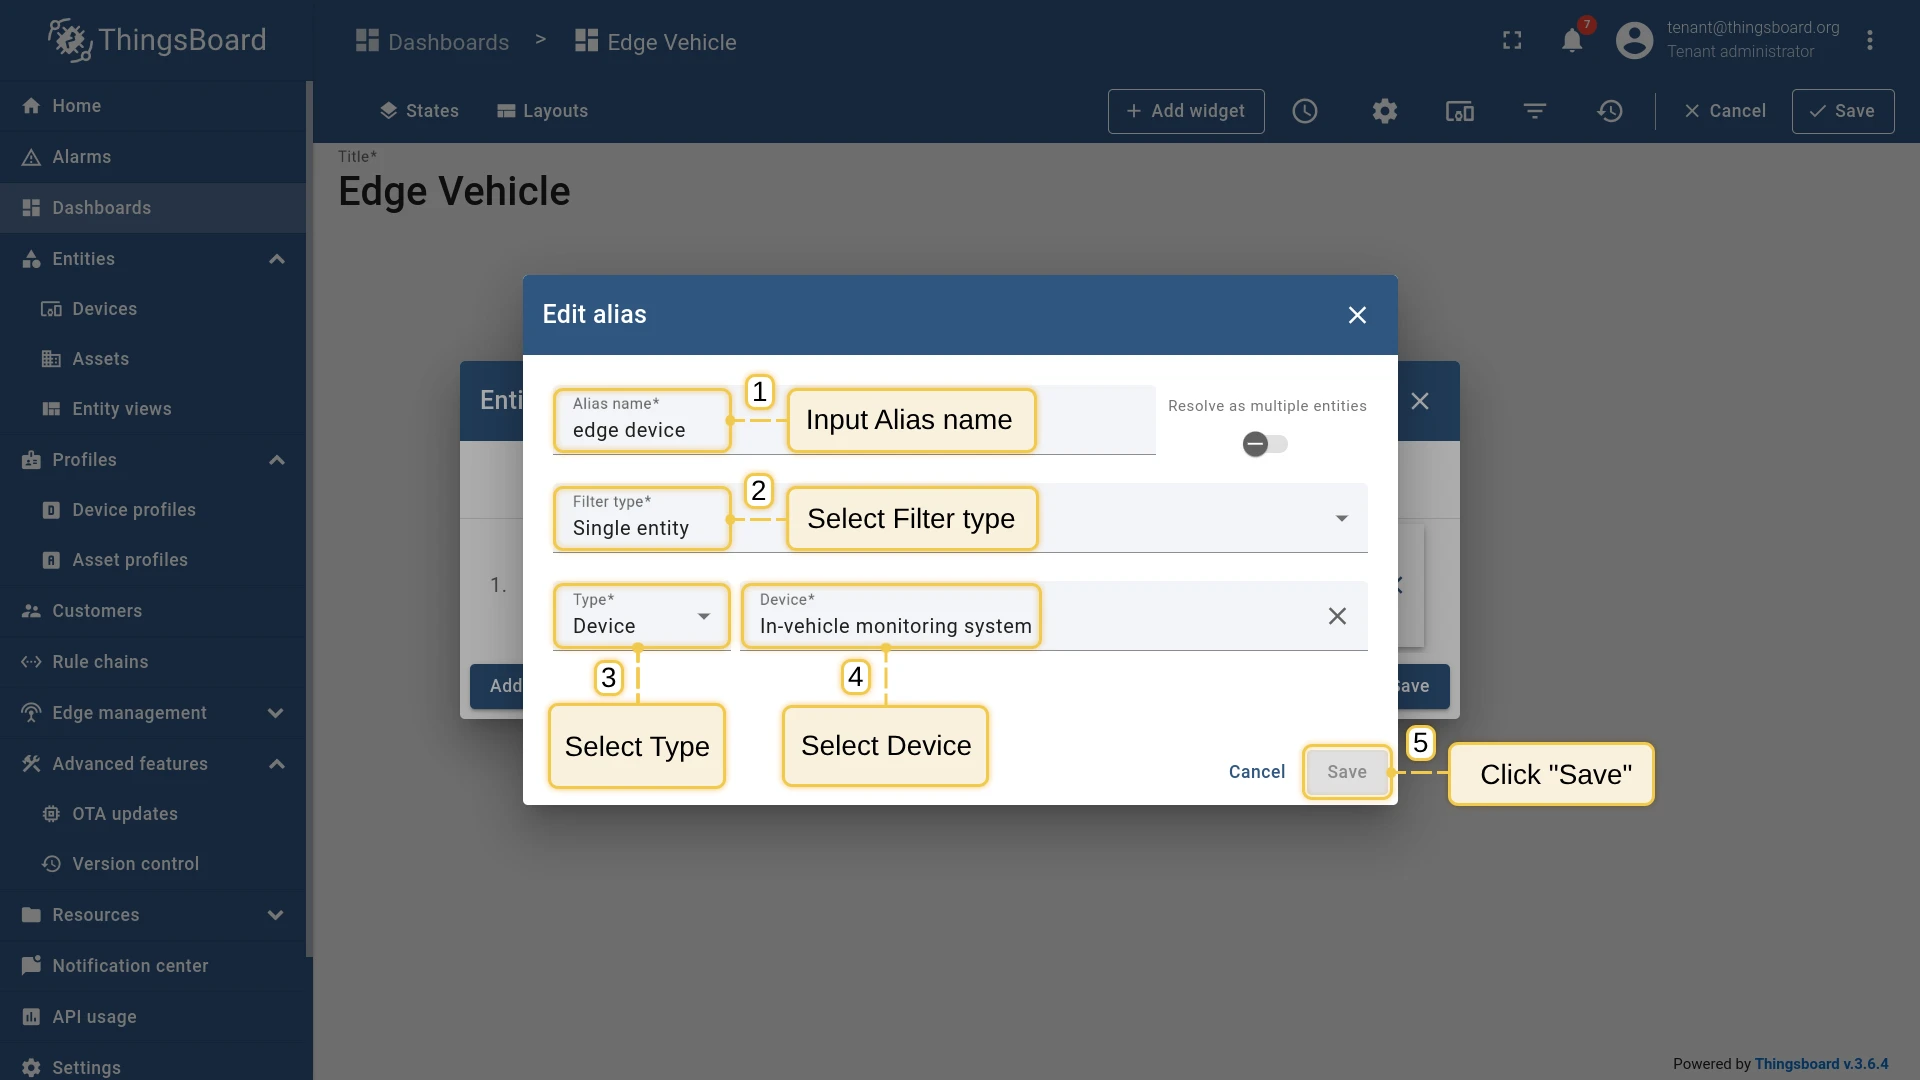
- Set Alias name to
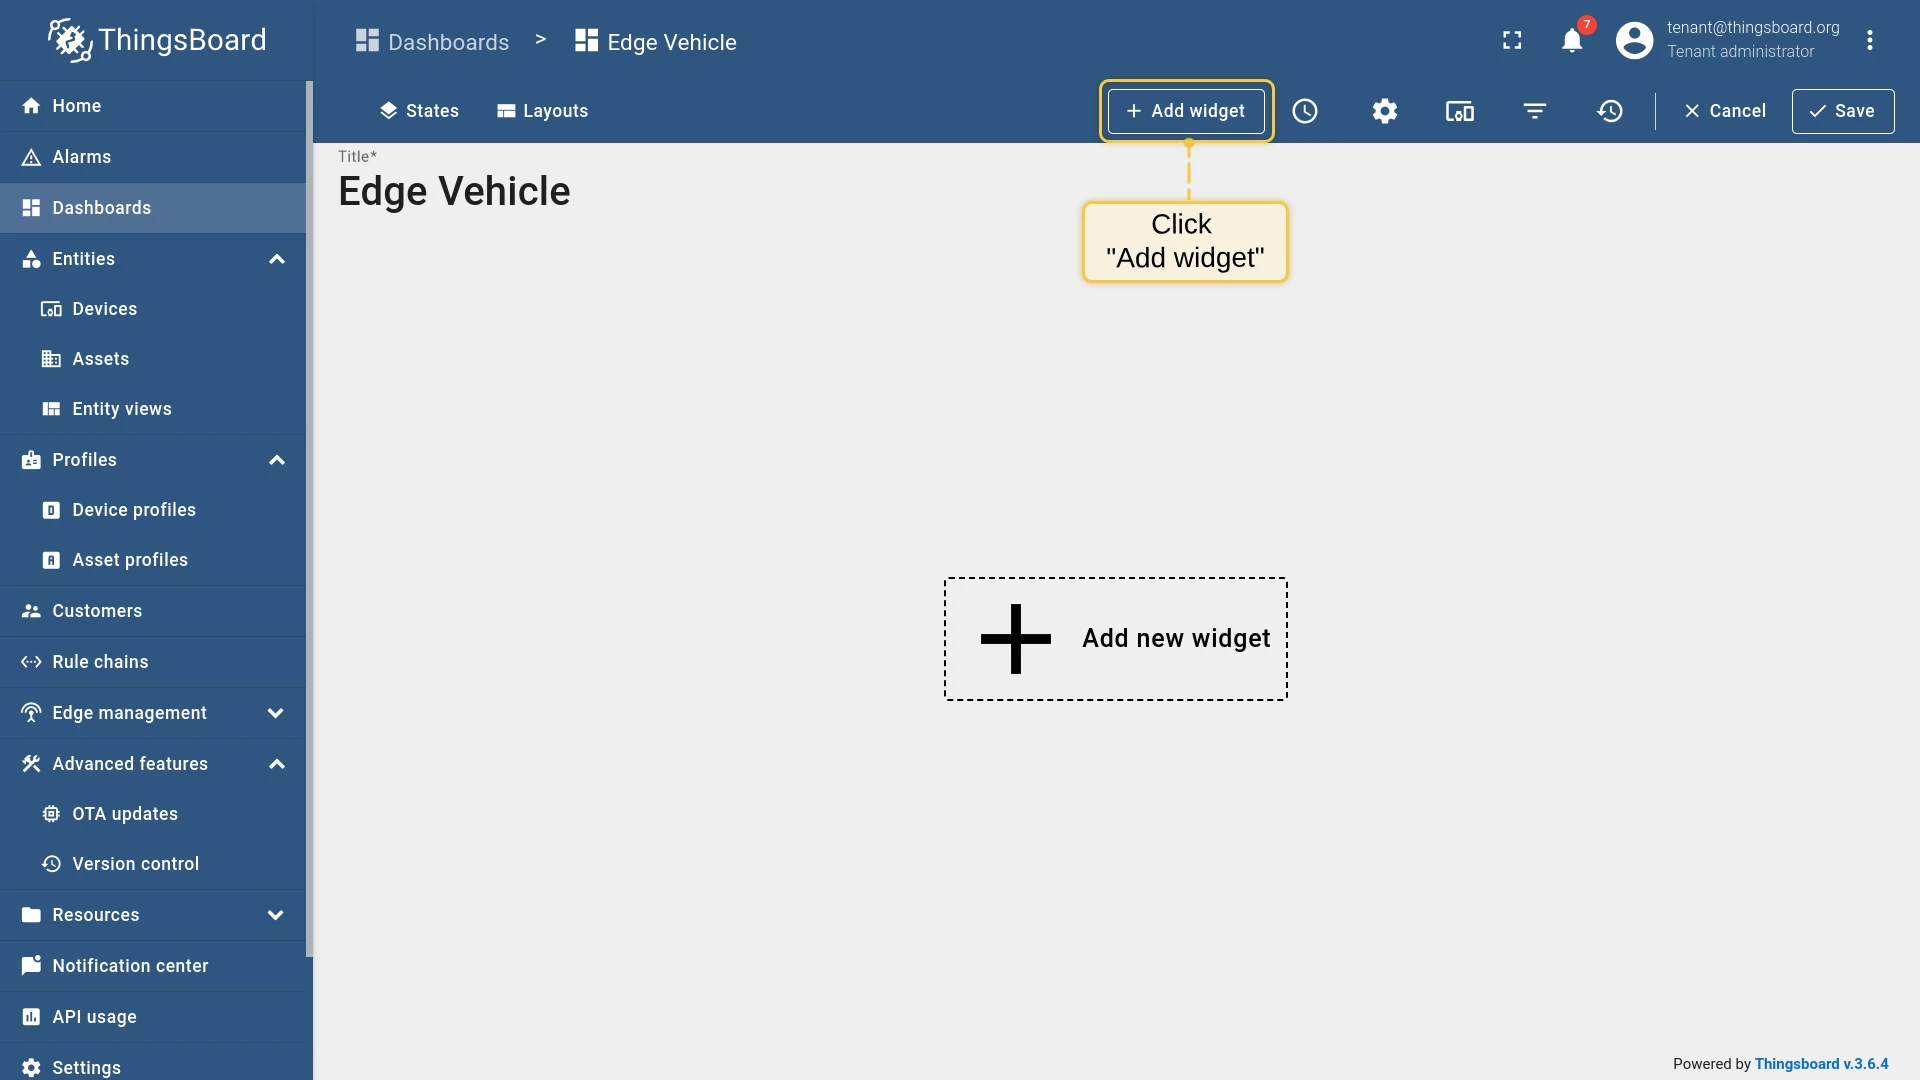
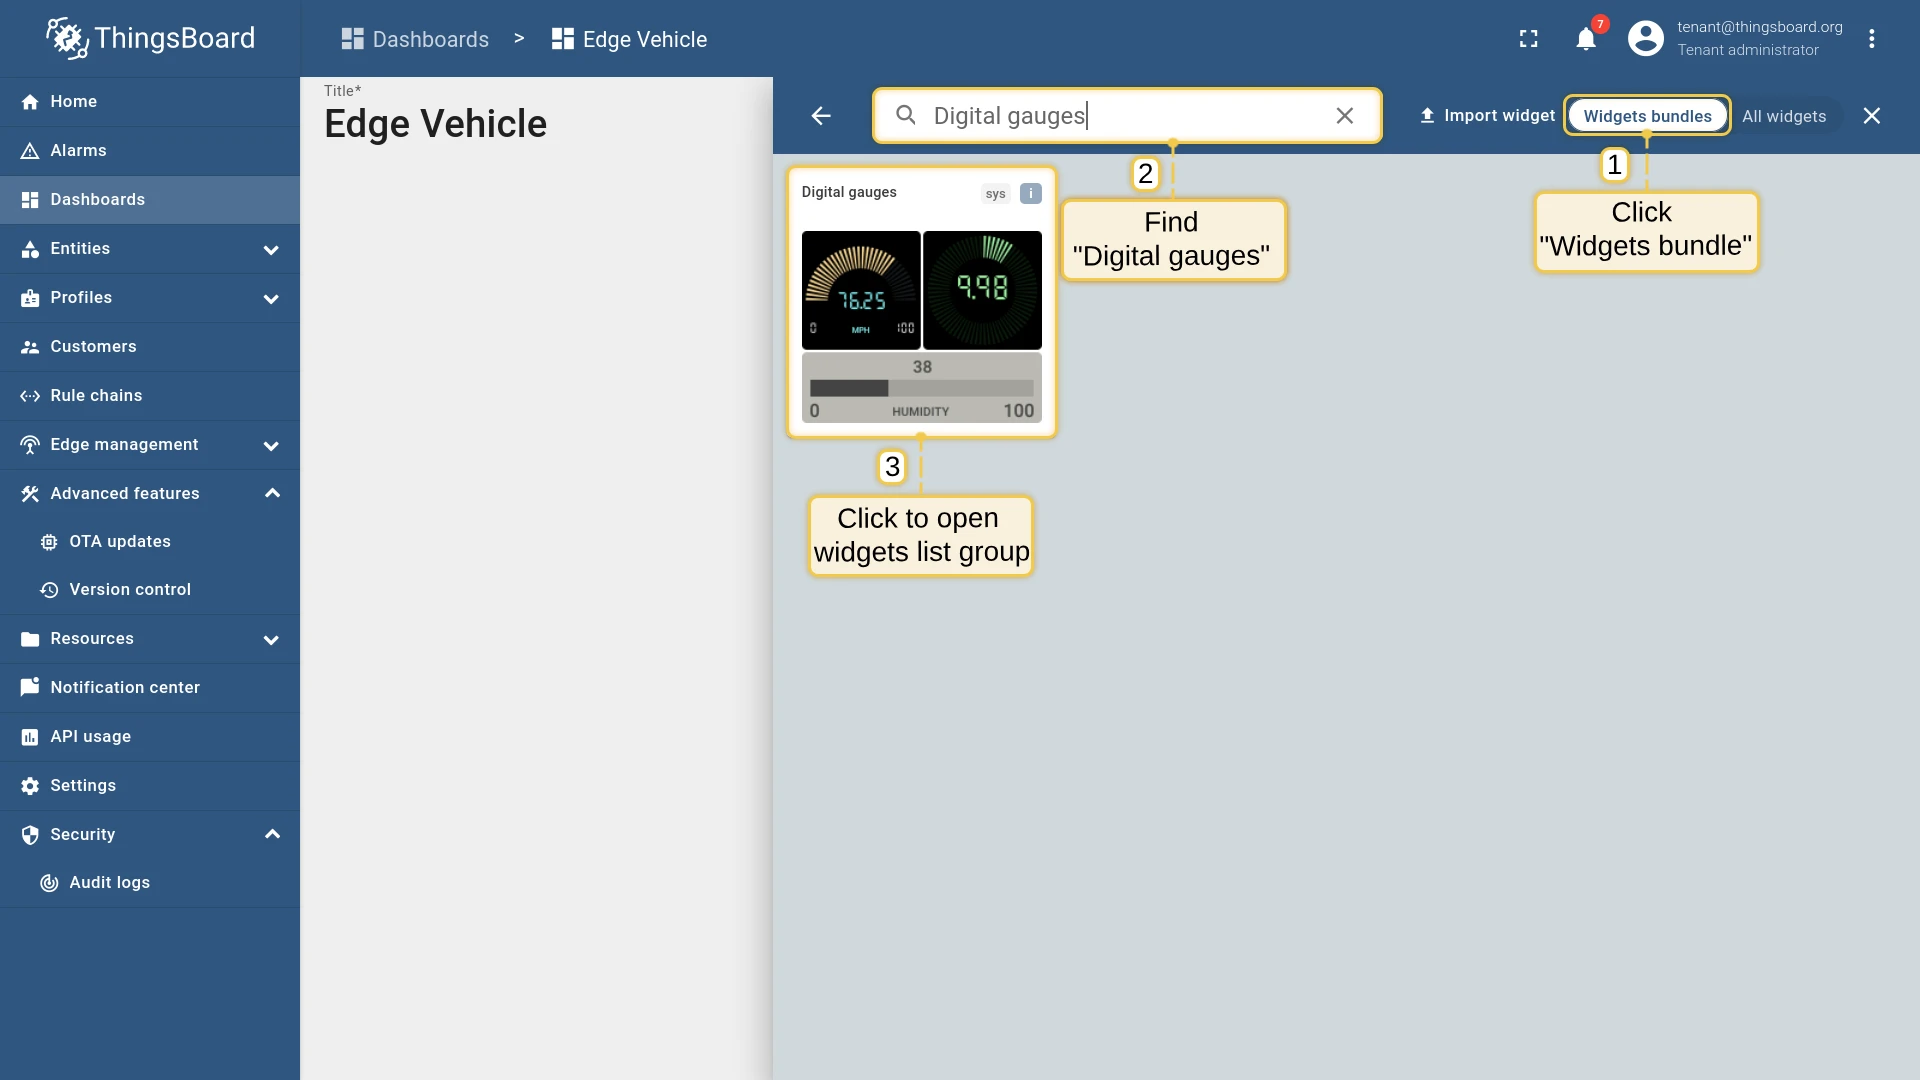
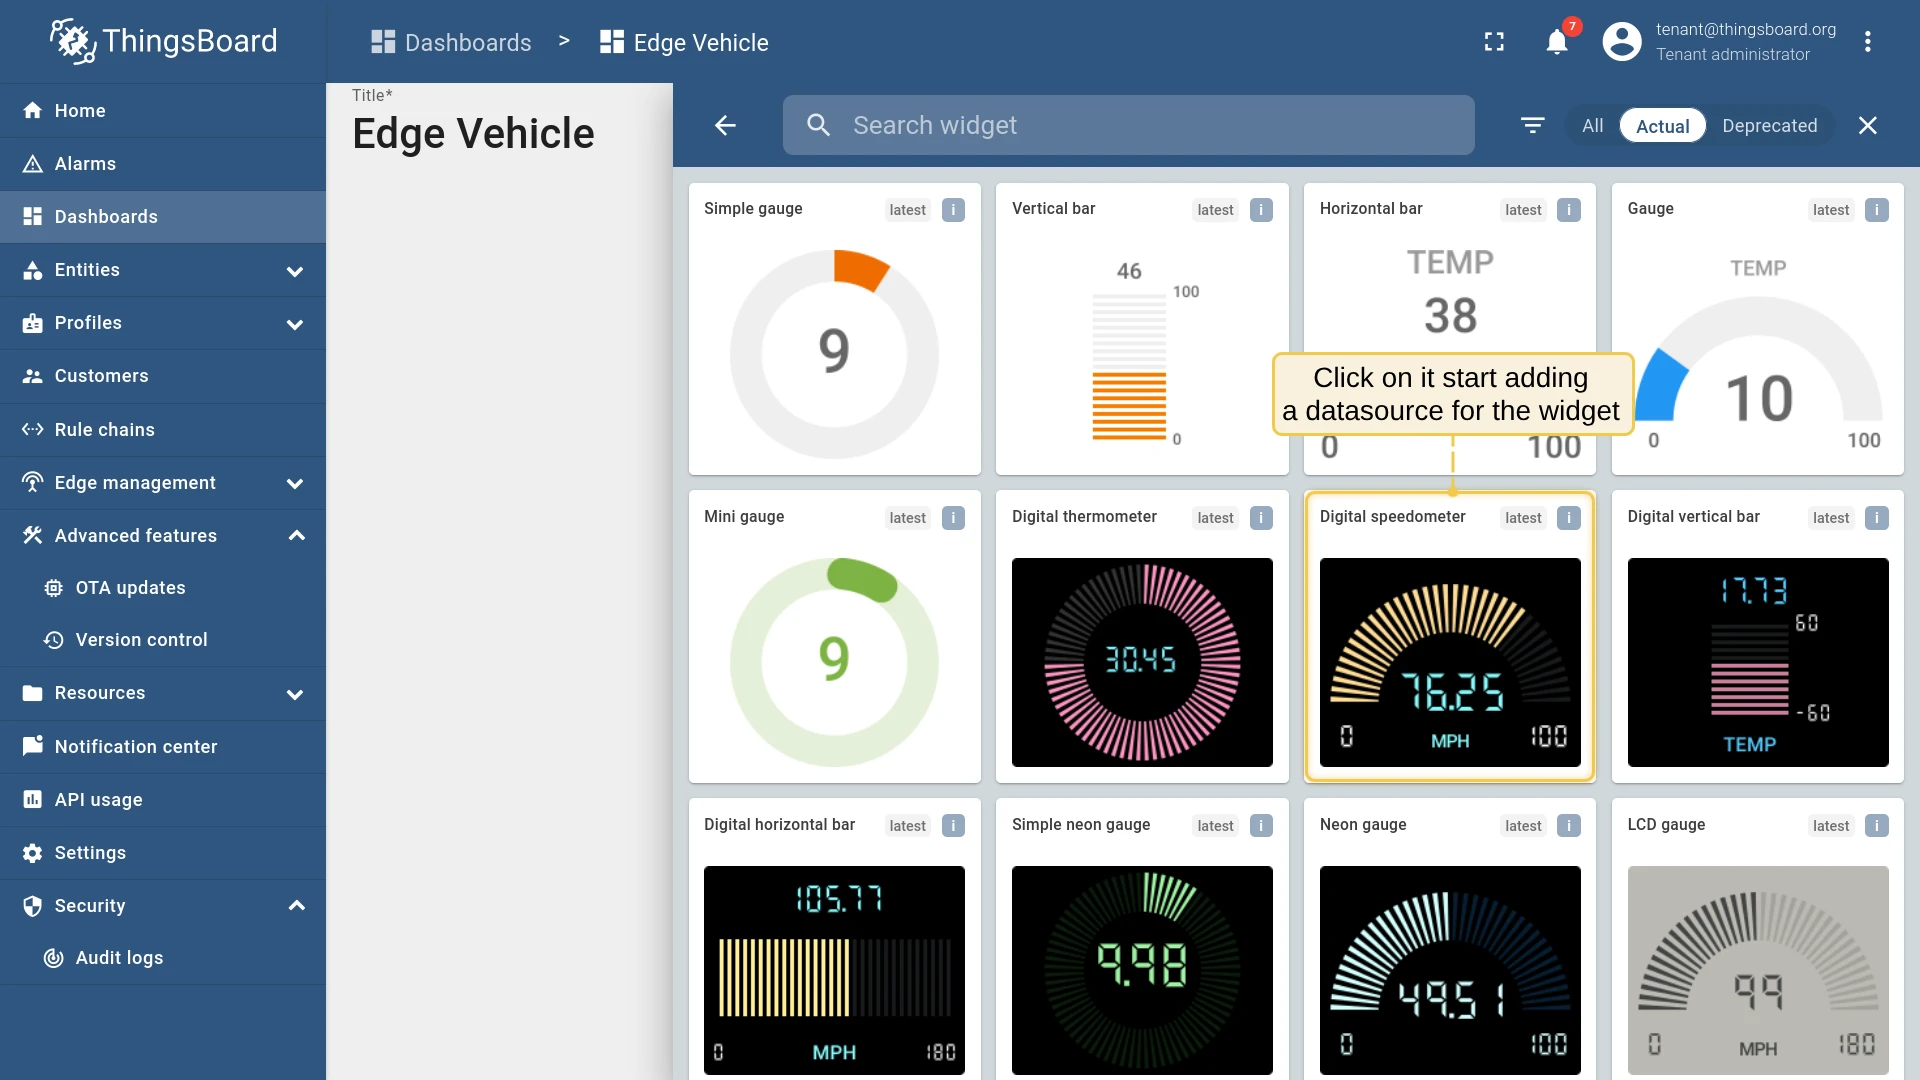
edge device, Filter type toSingle entity, Type toDevice, and select “In-vehicle monitoring system”. Click Save. - Click Add Widget, find Digital gauges in the Widgets Bundle, and select the gauge widget.
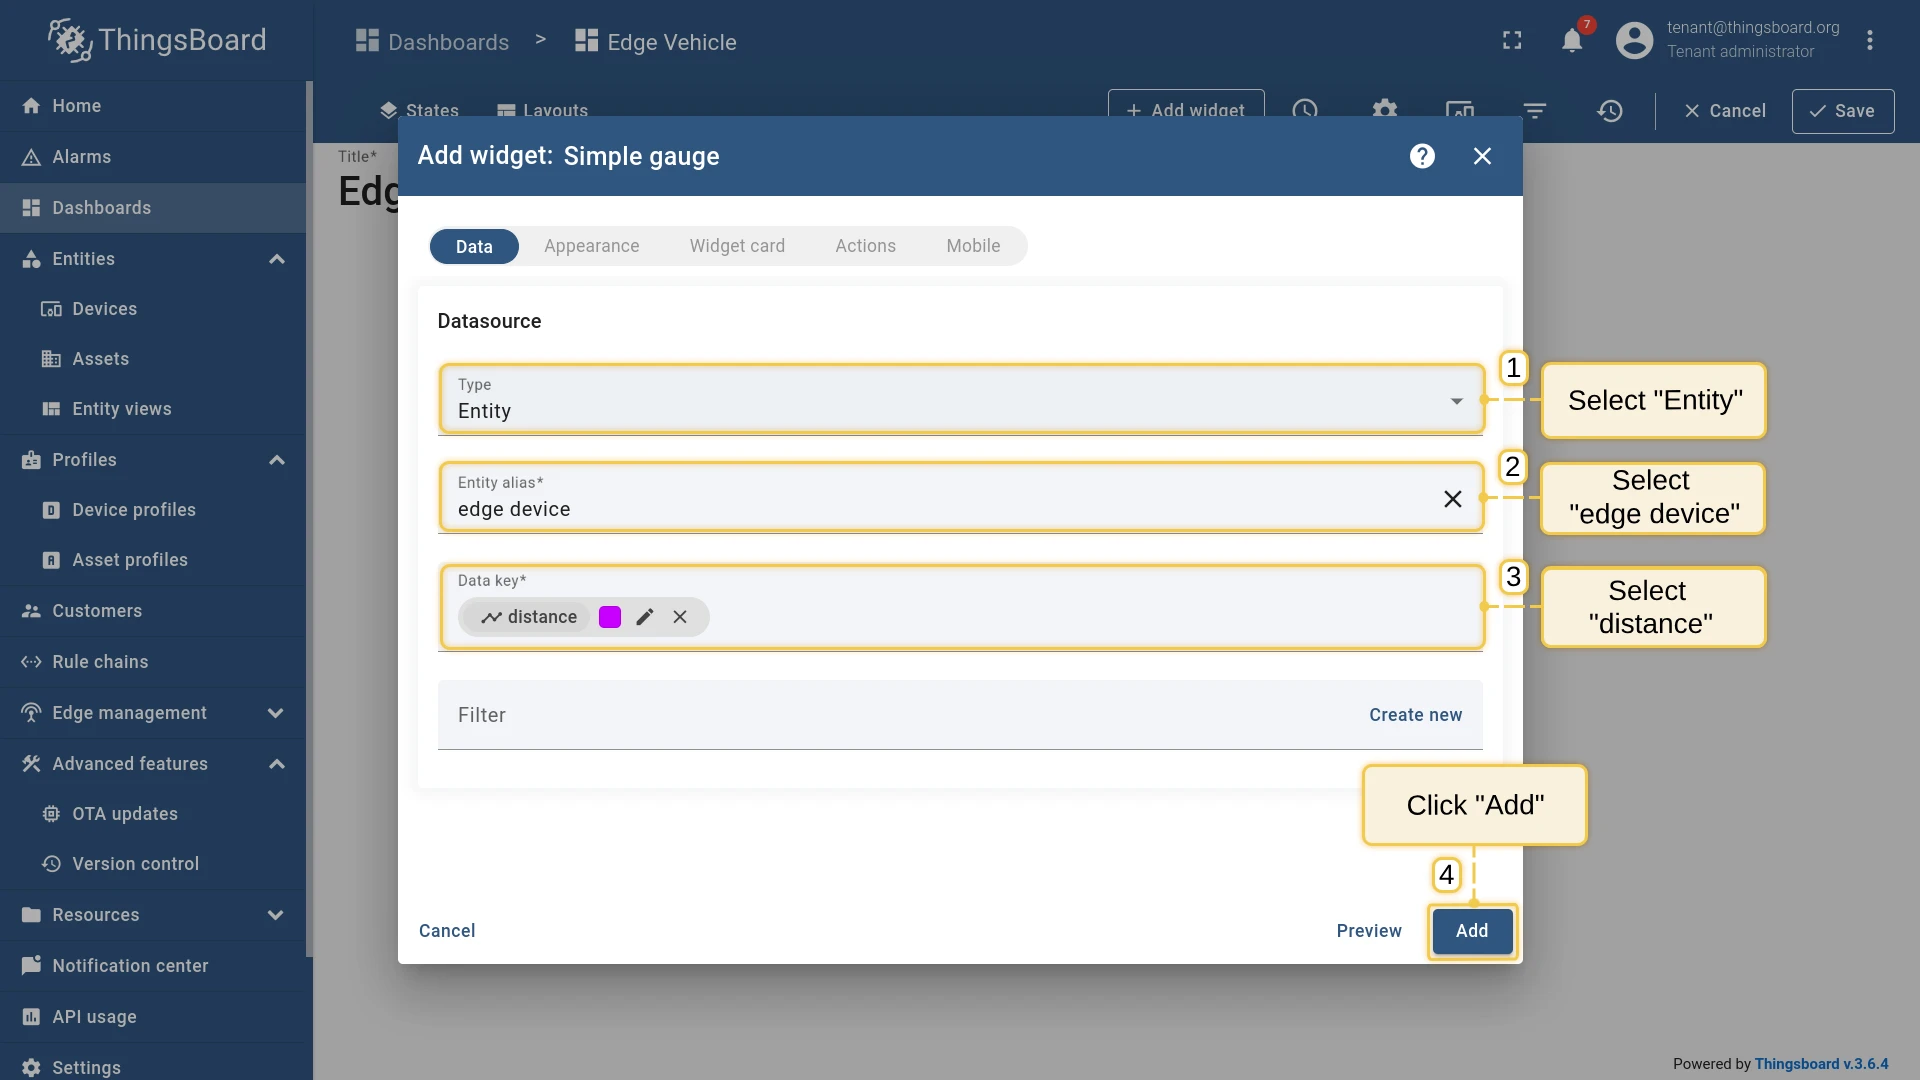
- Set Type to
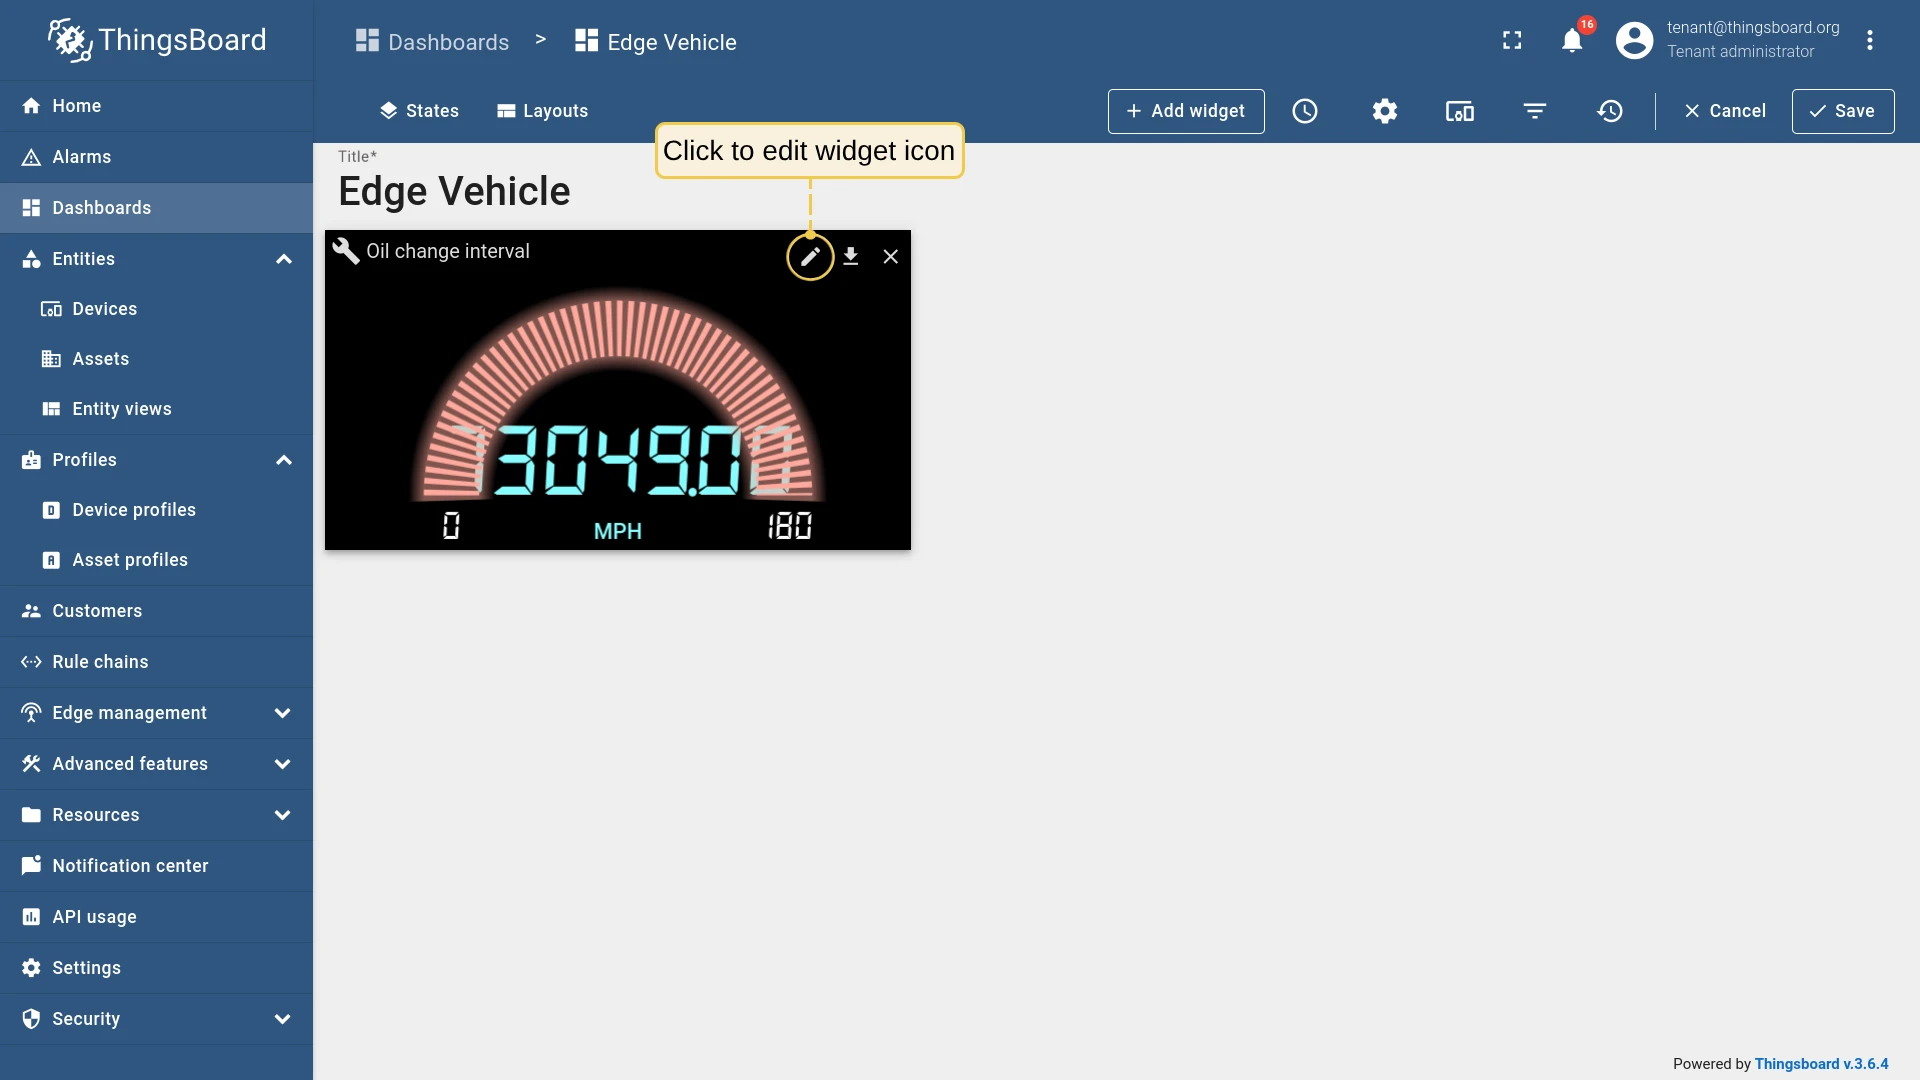
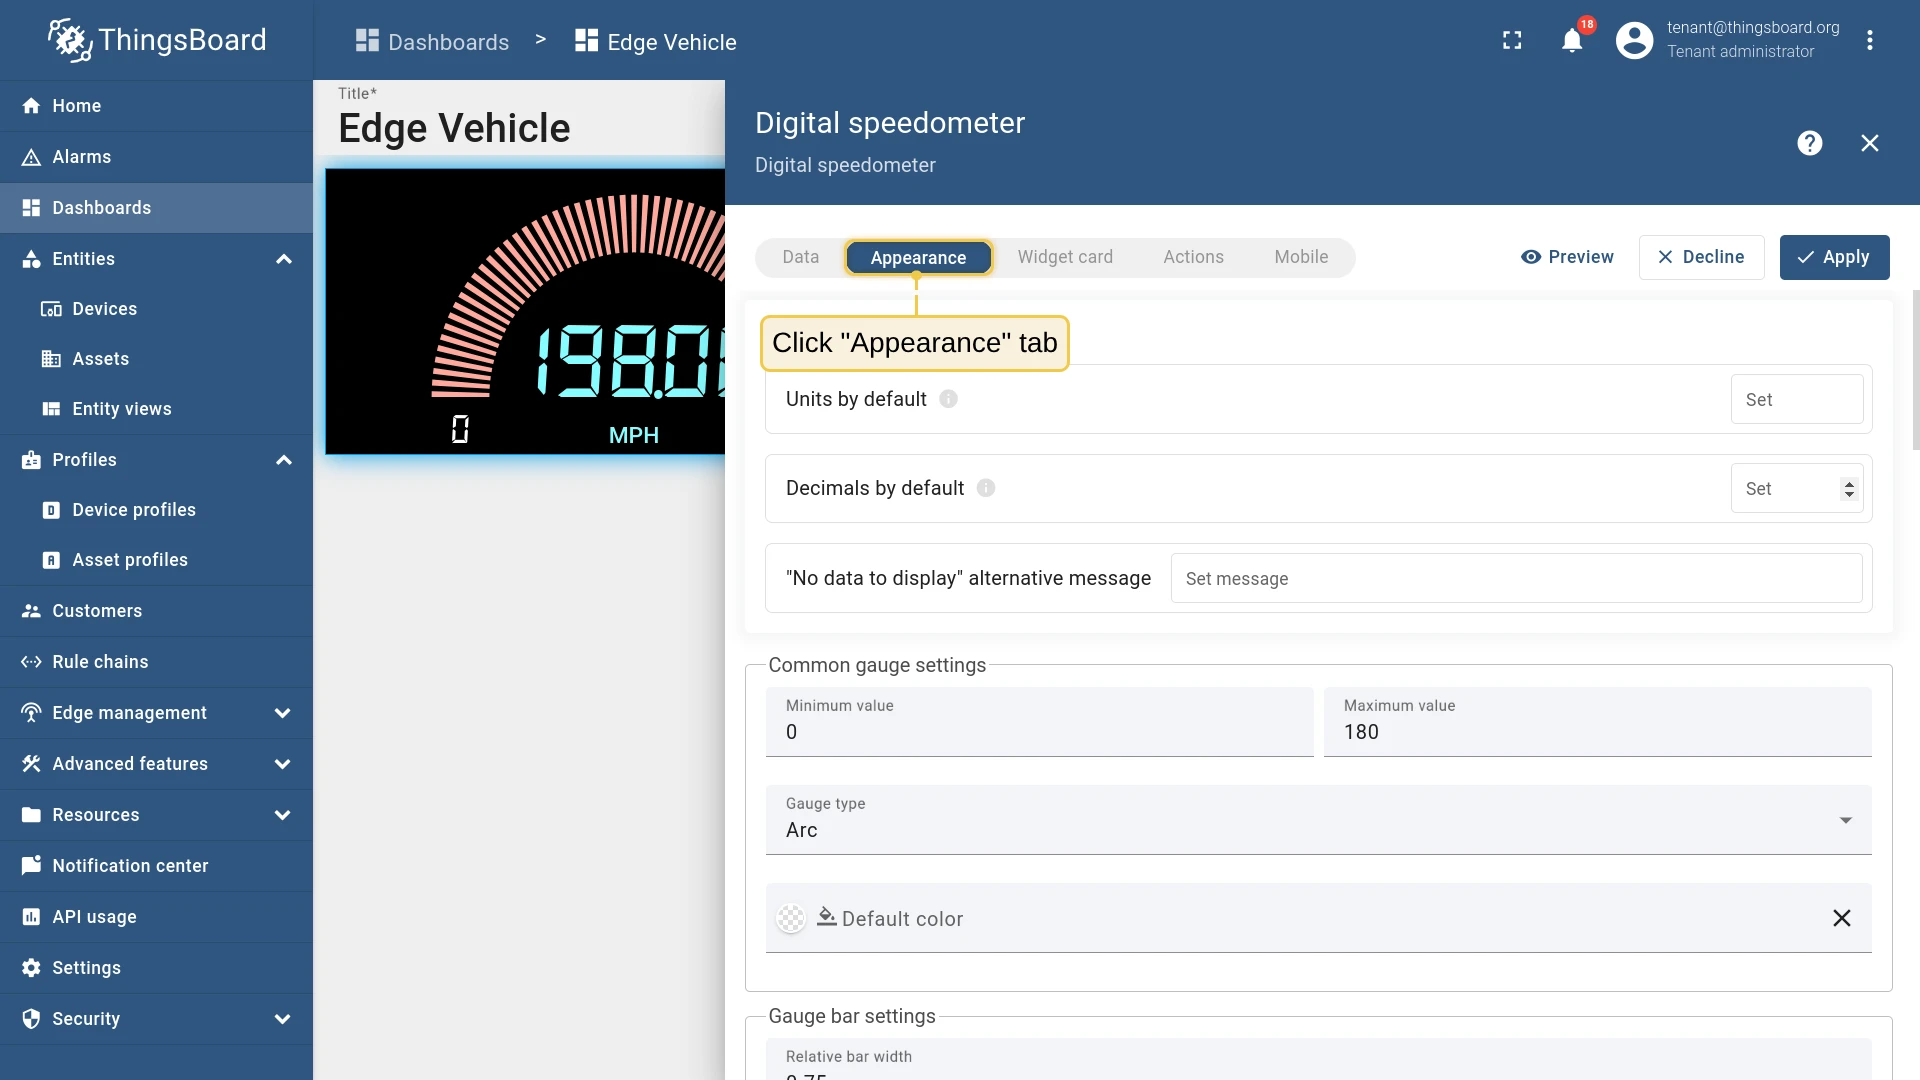
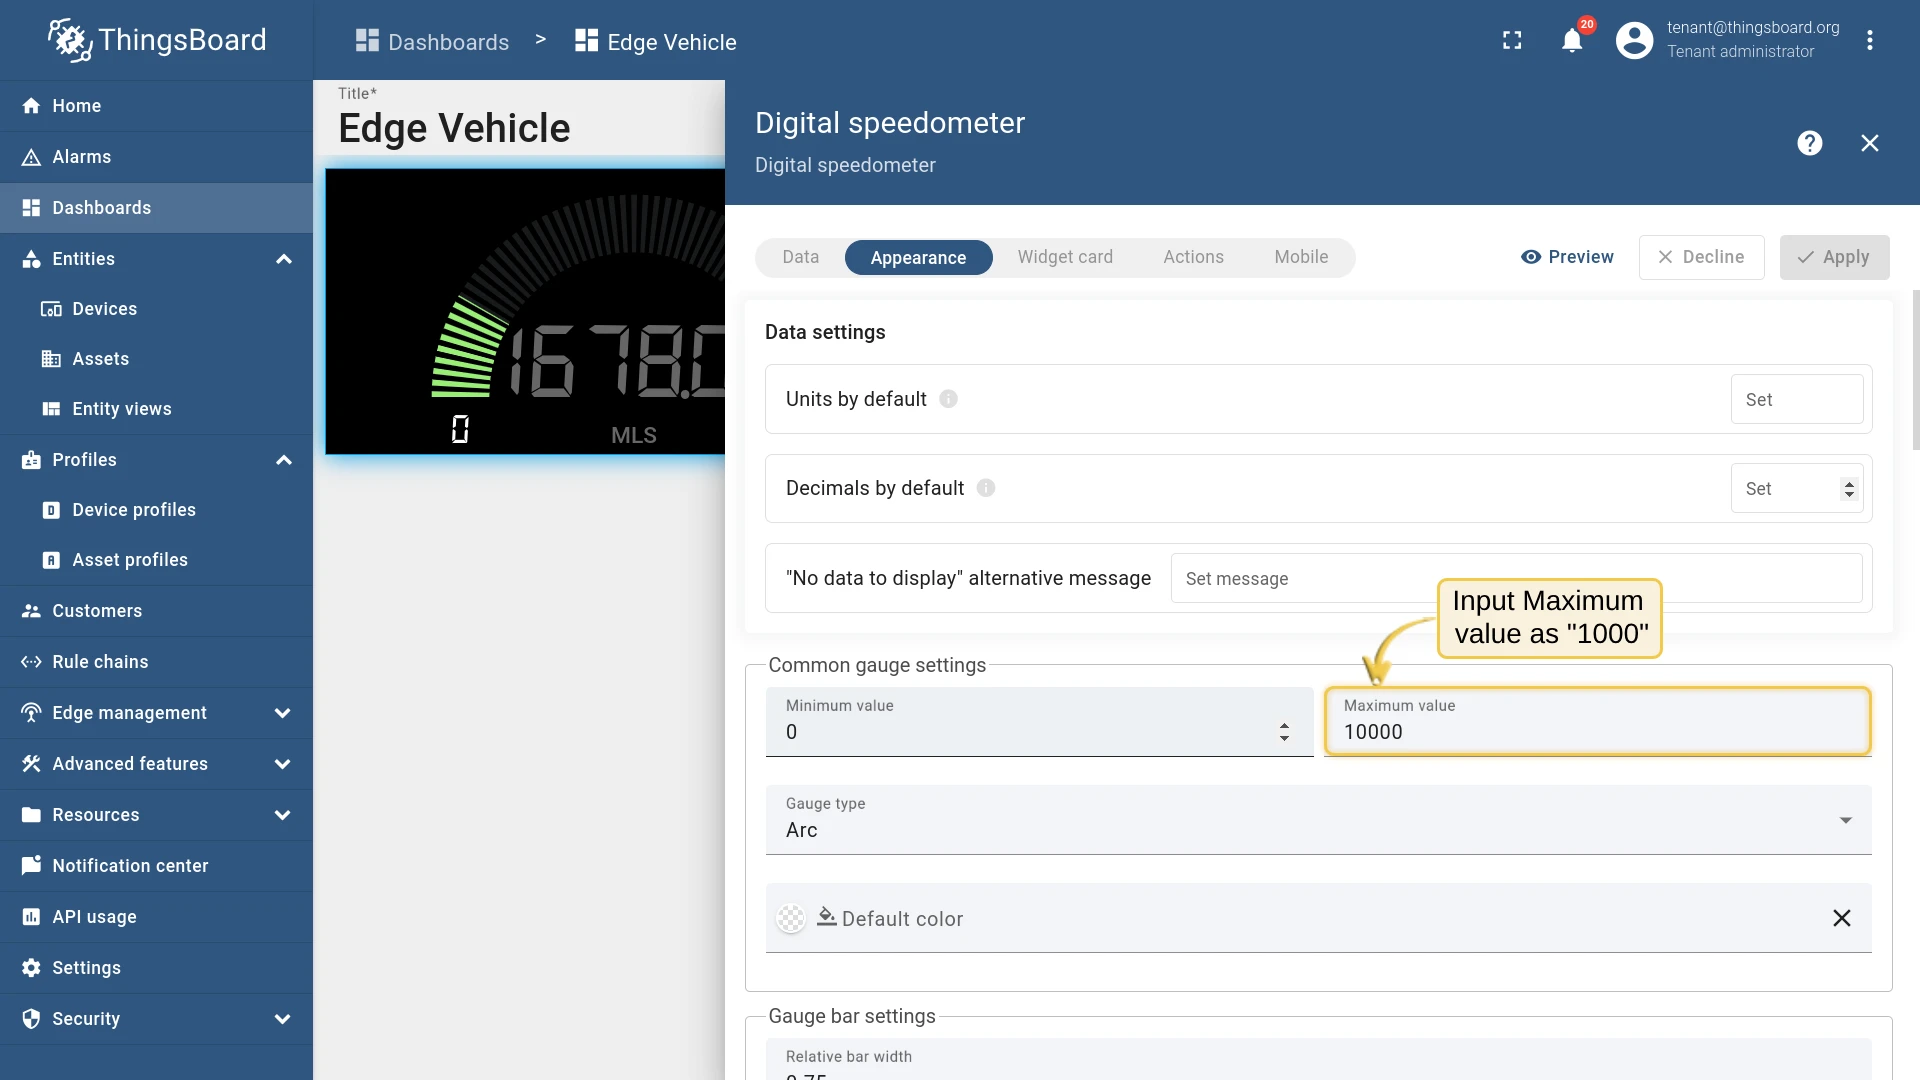
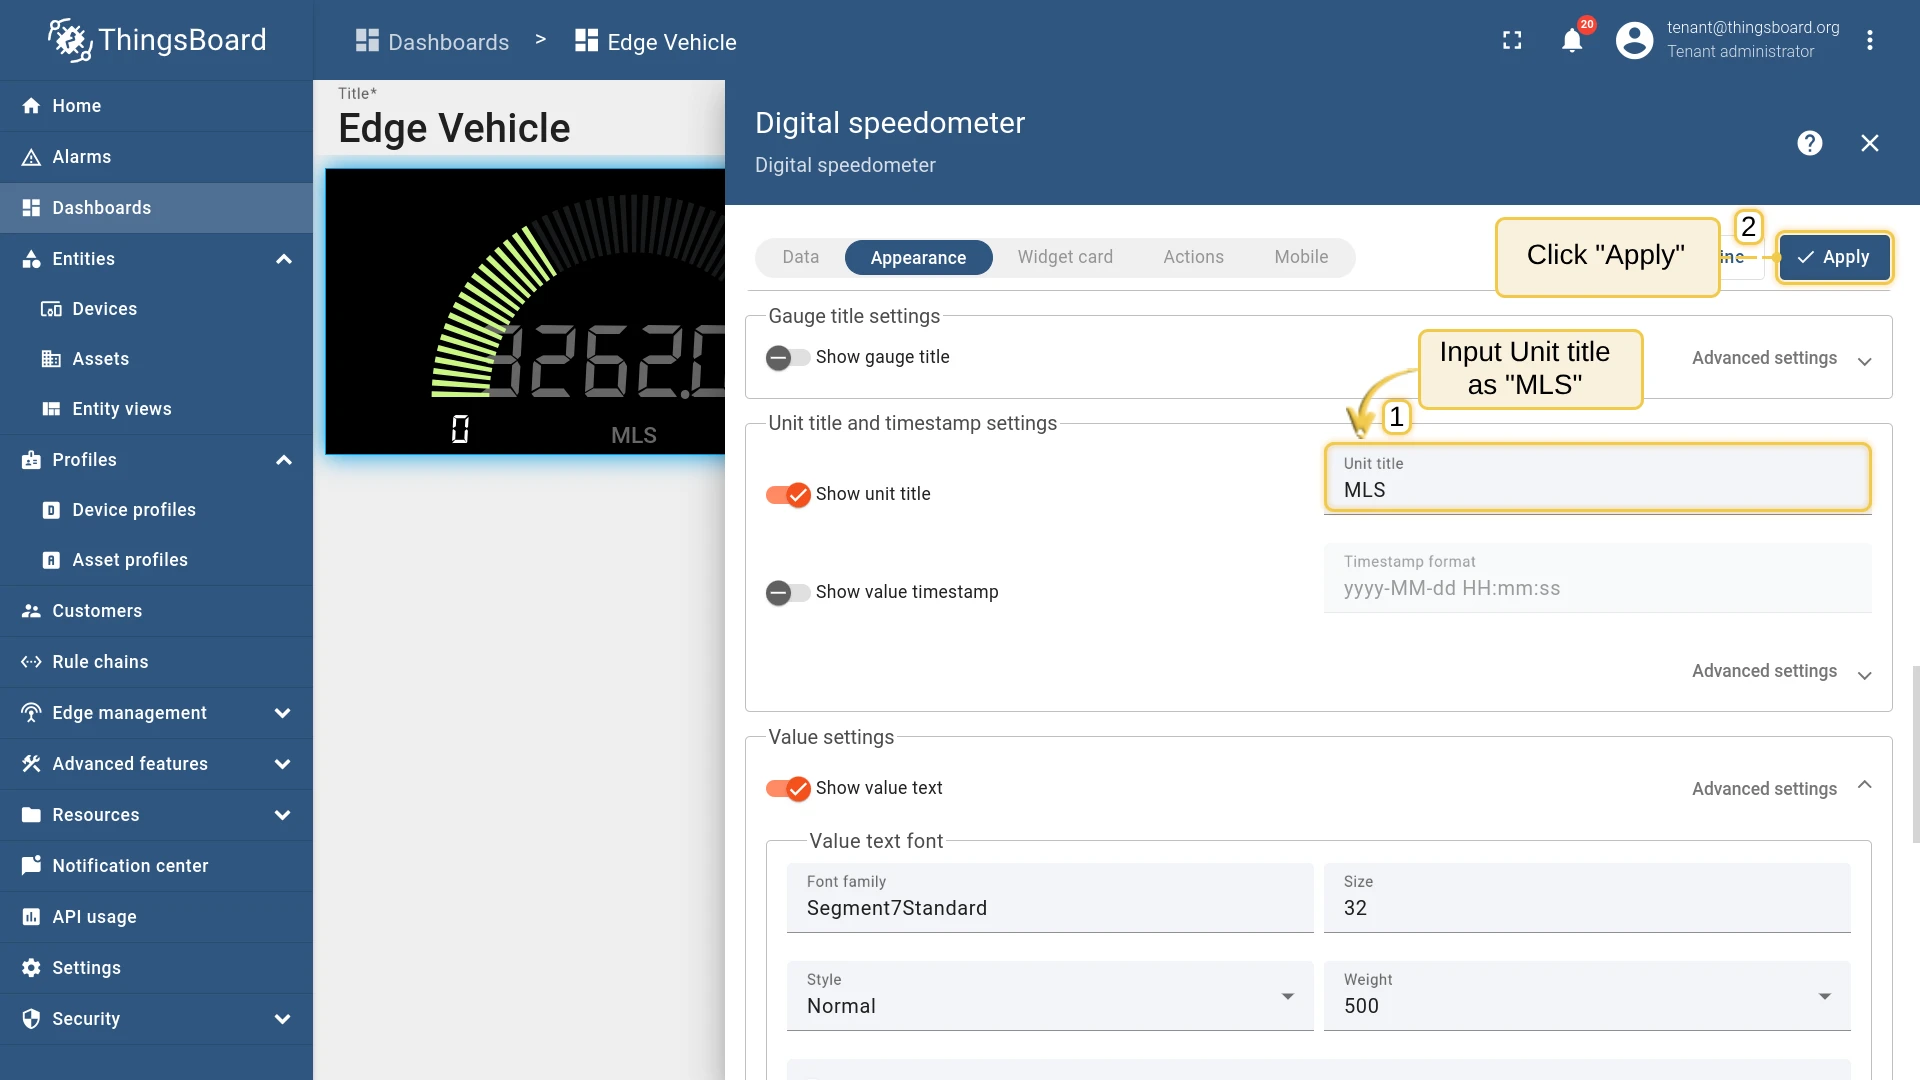
Entity, Entity Alias toedge device, and Data Key todistance. Click Add. - Open the widget edit panel. On the Appearance tab, set Max value to
10000and Unit title toMLS. Click Add.
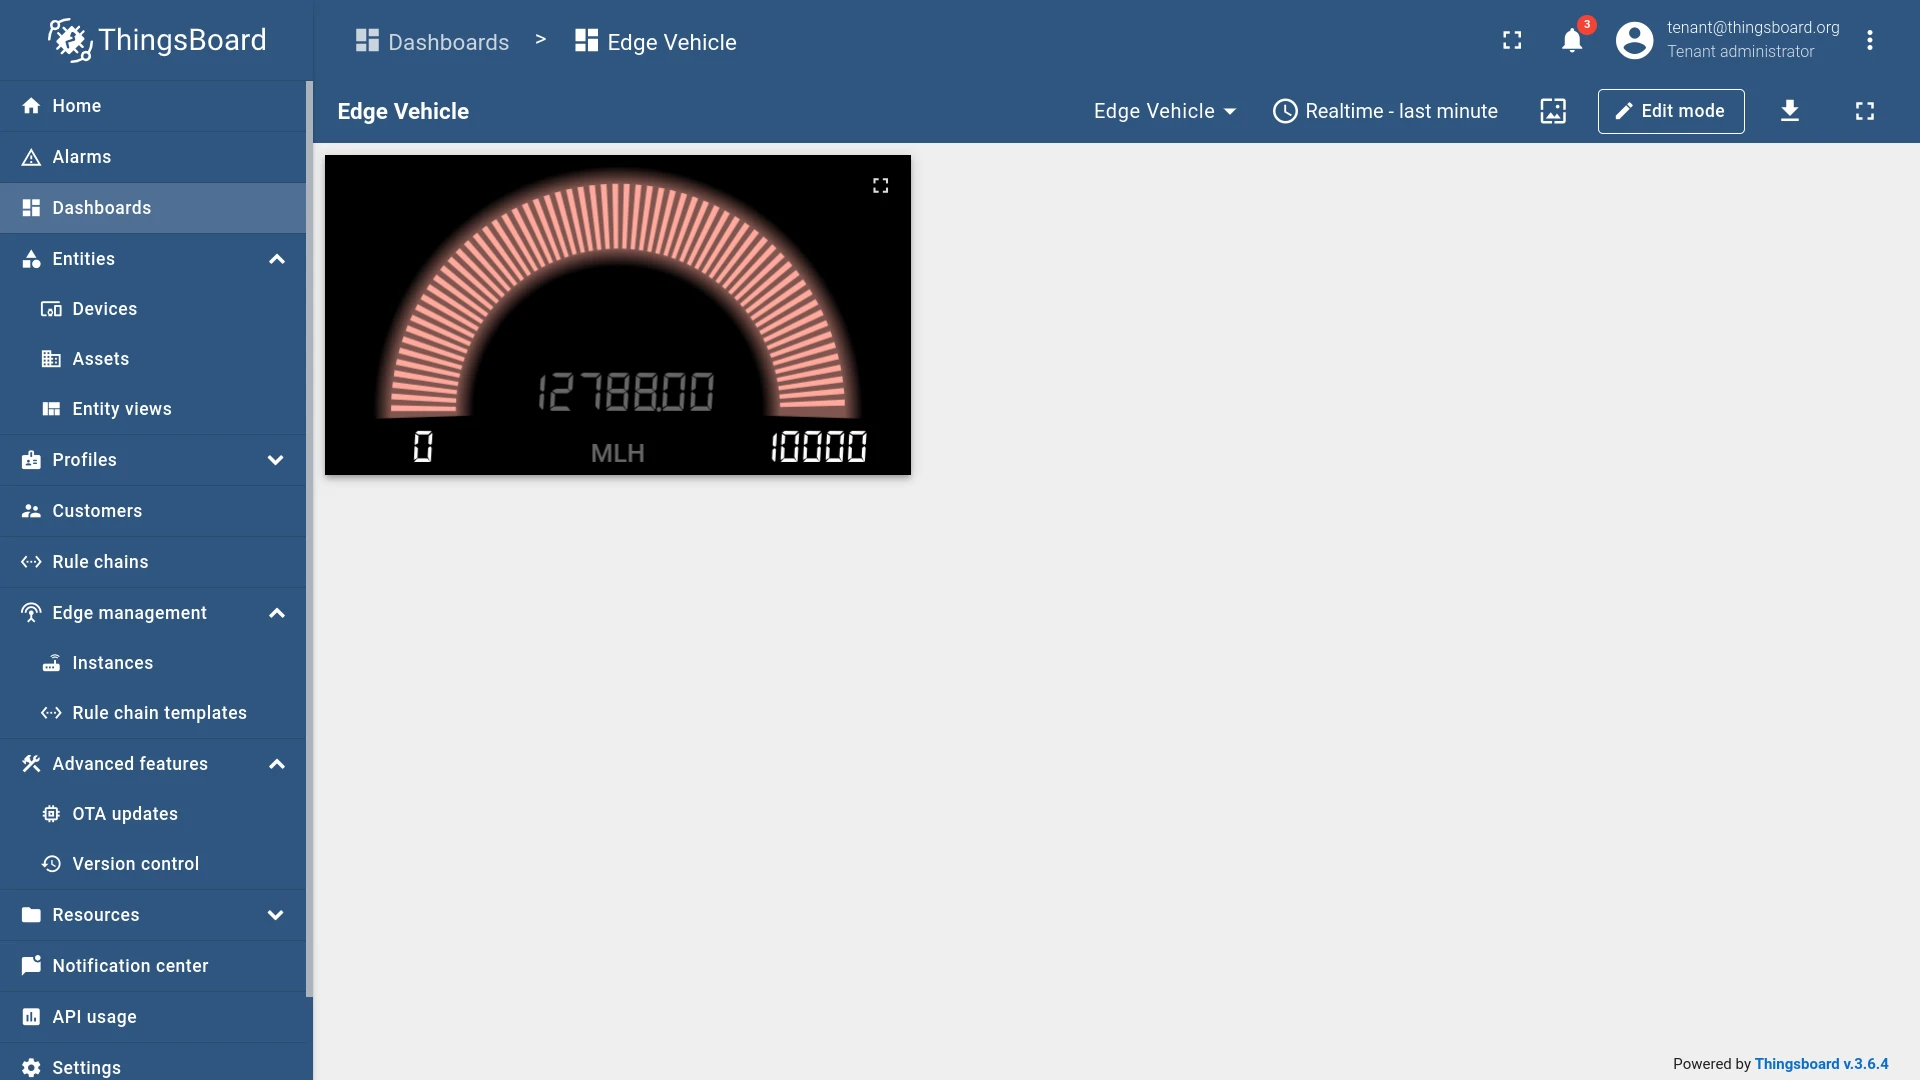
You have successfully sent telemetry from the device, saved all sensor readings on the Edge, pushed only the filtered distance data to the cloud, and visualized it on the dashboard.
Was this helpful?