TBMQ cluster supports 100M MQTT connections
An essential attribute of an MQTT broker is receiving published messages, filtering by topic, and distributing them to subscribers — a procedure that becomes critical under substantial workloads. This article demonstrates how TBMQ cluster reliably handles 100 million connected clients while managing a throughput of 6M MQTT publish messages per second.
Test methodology
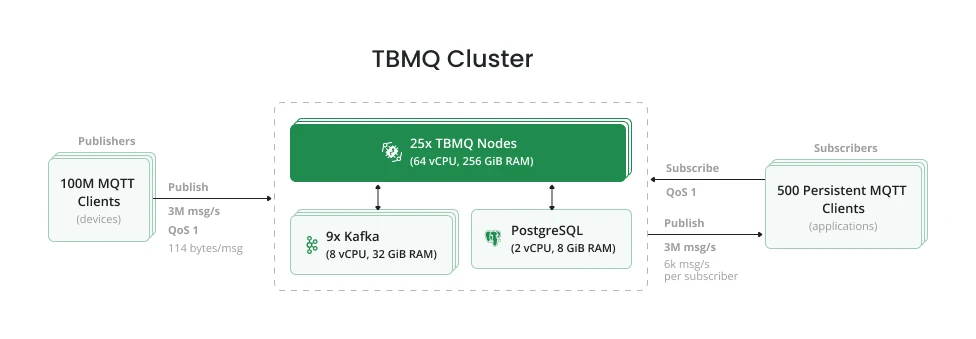
Section titled “Test methodology”The test environment was deployed on AWS. A TBMQ cluster of 25 nodes ran on an EKS cluster (one broker pod per EC2 instance), connected to RDS and Kafka. RDS was a single instance; Kafka consisted of 9 brokers across 3 Availability Zones. For a detailed overview of the broker’s internal design, see the TBMQ architecture page.
The test emulated smart tracker devices sending 5-field messages of approximately 114 bytes:
{ "lat": 40.761894, "long": -73.970455, "speed": 55.5, "fuel": 92, "batLvl": 81 }Publishers: 500 groups × 200k total publishers = 6k msg/sec per group, publishing to topics in the format
CountryCode/RandomString/GroupId/ClientId, creating 100M unique topics.
Subscribers: 500 APPLICATION subscriber groups, each with a single persistent subscriber using the topic filter
CountryCode/RandomString/GroupId/+, receiving 6k msg/sec.
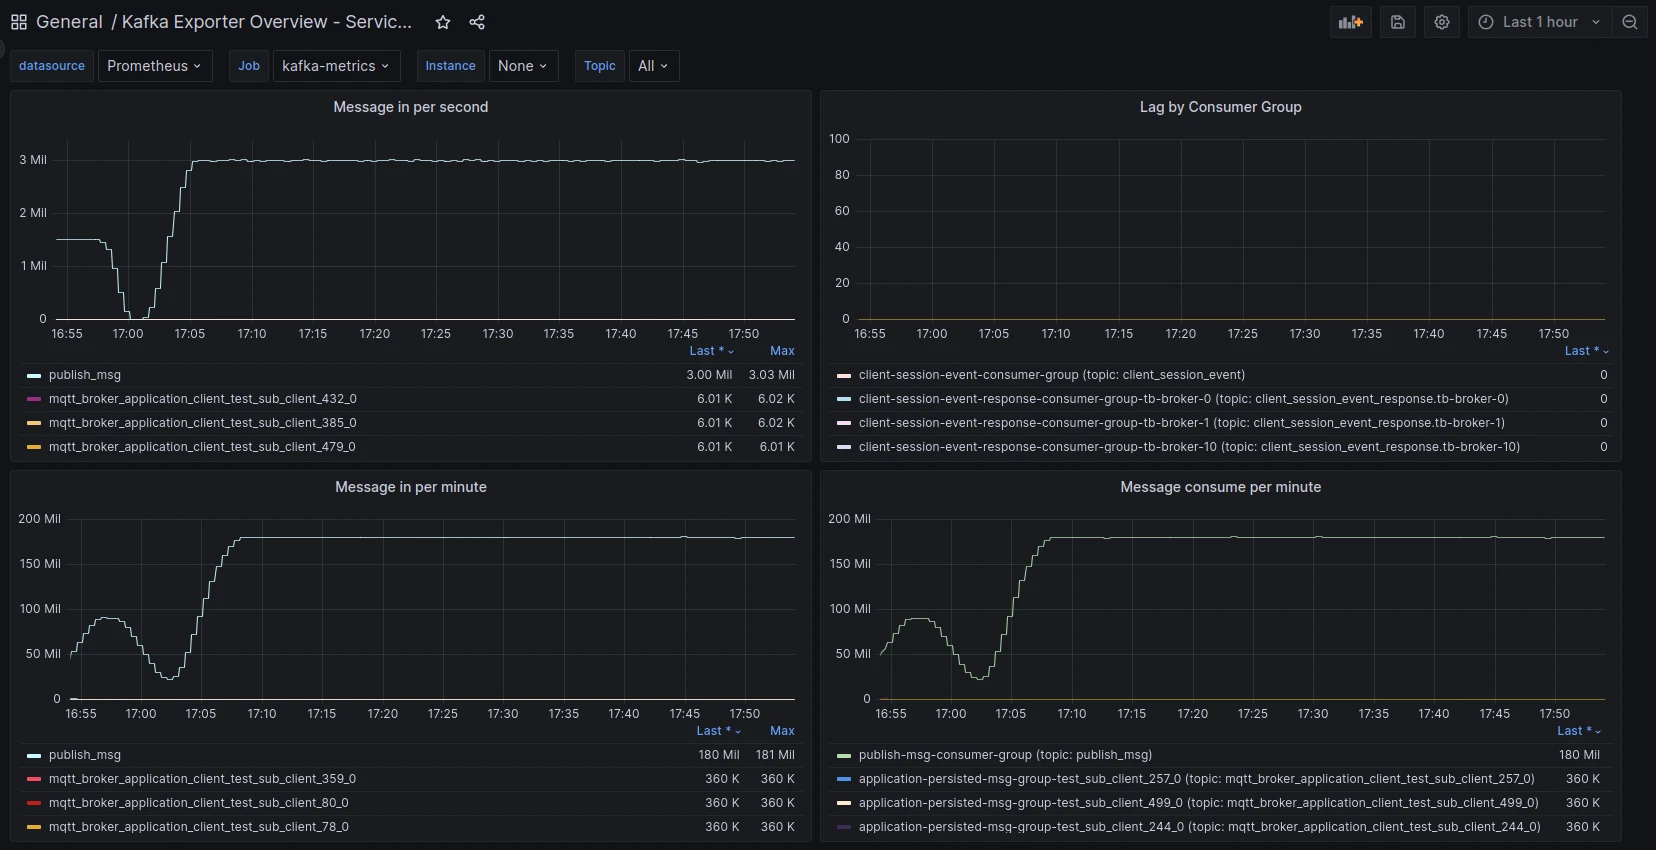
The TBMQ cluster sustained 100,000,500 connections and handled 6M messages per second (3M incoming × 2 for publish + delivery). Over the 1-hour test, 3M incoming msg/sec resulted in 10,800M total messages processed.
Including a warm-up phase (6 iterations × 100M publishers × 1 message each = 600M warm-up messages in ~7 min),
the grand total was 11,400M messages — approximately 1TB stored in the tbmq.msg.all Kafka topic.
The test agent orchestrates the provisioning of MQTT clients, allowing flexible configuration of their count. Clients operate persistently, continuously publishing time series data over MQTT to designated topics. The agent also provisions subscriber clients that subscribe by topic filter to receive the published messages.
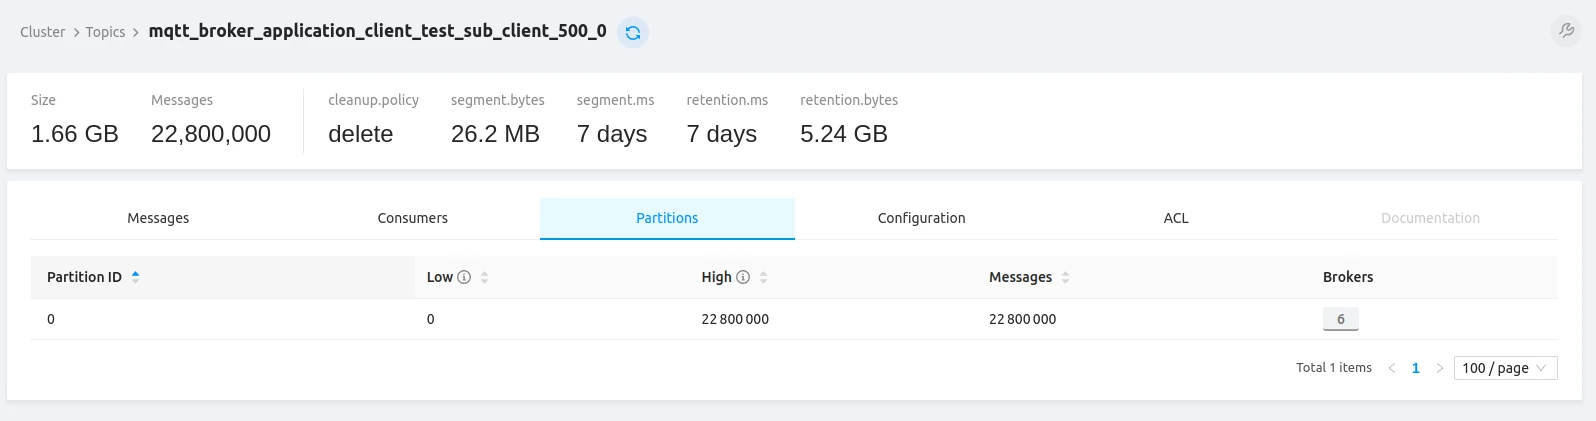
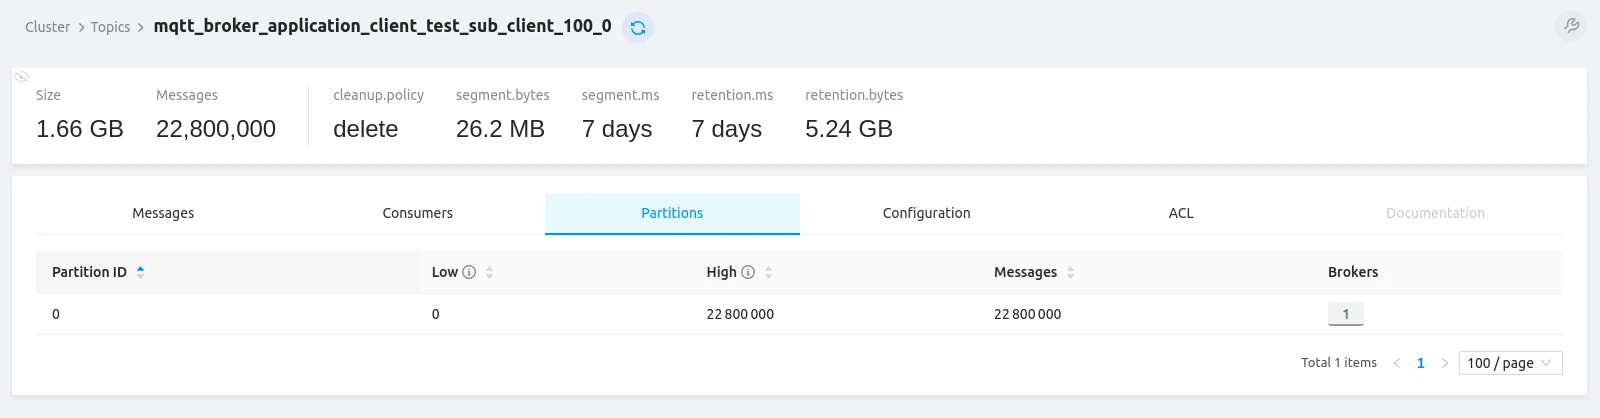
Each of the 500 APPLICATION subscribers received 22.8M messages in its dedicated per-client Kafka topic. With only APPLICATION clients, PostgreSQL handled only a few operations per second — Kafka was the sole persistence layer.
Tip: to plan and manage Kafka disk space, adjust the size retention policy and period retention policy. For details on topic-level configuration, see the configuration reference.
Hardware used
Section titled “Hardware used”| Service | TBMQ | AWS RDS (PostgreSQL) | Kafka |
|---|---|---|---|
| Instance type | m6g.metal | db.m6i.large | m6a.2xlarge |
| vCPU | 64 | 2 | 8 |
| Memory (GiB) | 256 | 8 | 32 |
| Storage (GiB) | 10 | 100 | 500 |
| Network (Gbps) | 25 | 12.5 | 12.5 |
Test summary
Section titled “Test summary”| Metric | Value |
|---|---|
| Connection rate | ~22k connections/sec |
| Test duration | 1 hour |
| Total messages | 11,400M |
| Total data volume | ~1TB |
| QoS | 1 (AT_LEAST_ONCE) |
| Devices | Throughput | Broker CPU | Broker memory | Kafka CPU | Kafka read/write | PostgreSQL CPU | PostgreSQL IOPS |
|---|---|---|---|---|---|---|---|
| 100M | 6M msg/s | 45% | 160 GiB | 58% | 7k / 80k KiB/s | 2% | <1 / <3 |
Latency:
| Msg latency avg | Msg latency 95th | Pub ACK avg | Pub ACK 95th |
|---|---|---|---|
| 195 ms | 295 ms | 23 ms | 55 ms |
Where:
- Msg latency avg: average time from publisher transmission to subscriber receipt
- Pub ACK avg: average time from publisher transmission to PUBACK receipt
- 95th: 95th percentile
The tbmq.client.session Kafka topic confirms all 100M+ client sessions were established:
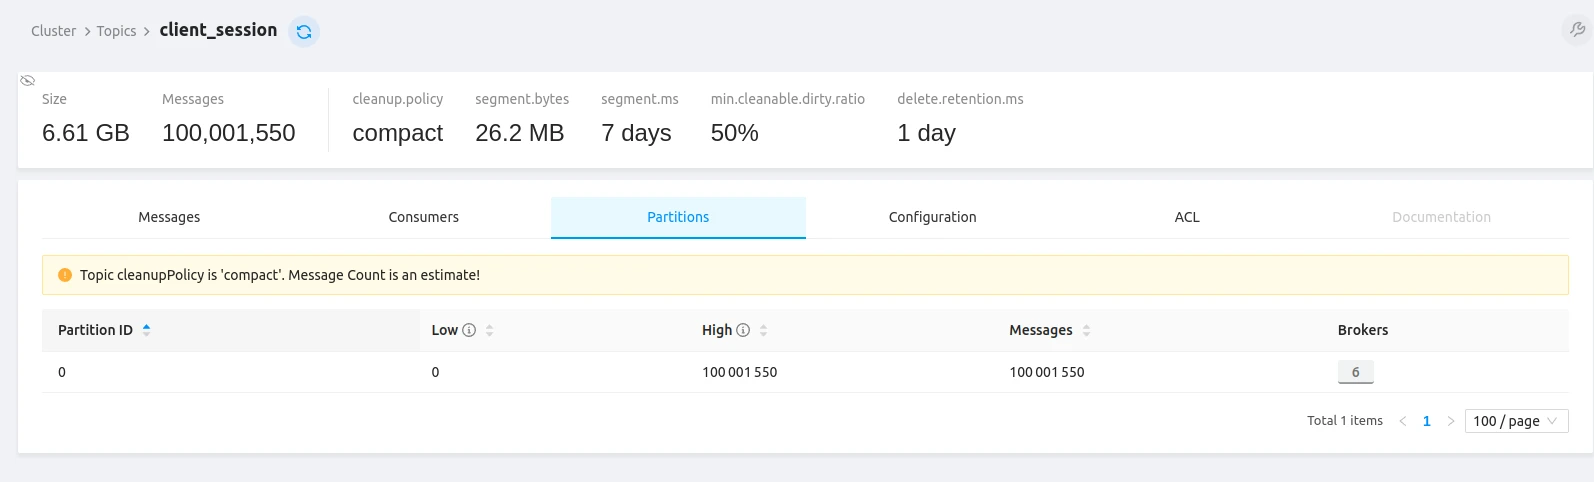
Kafka topic statistics (100% message delivery success):
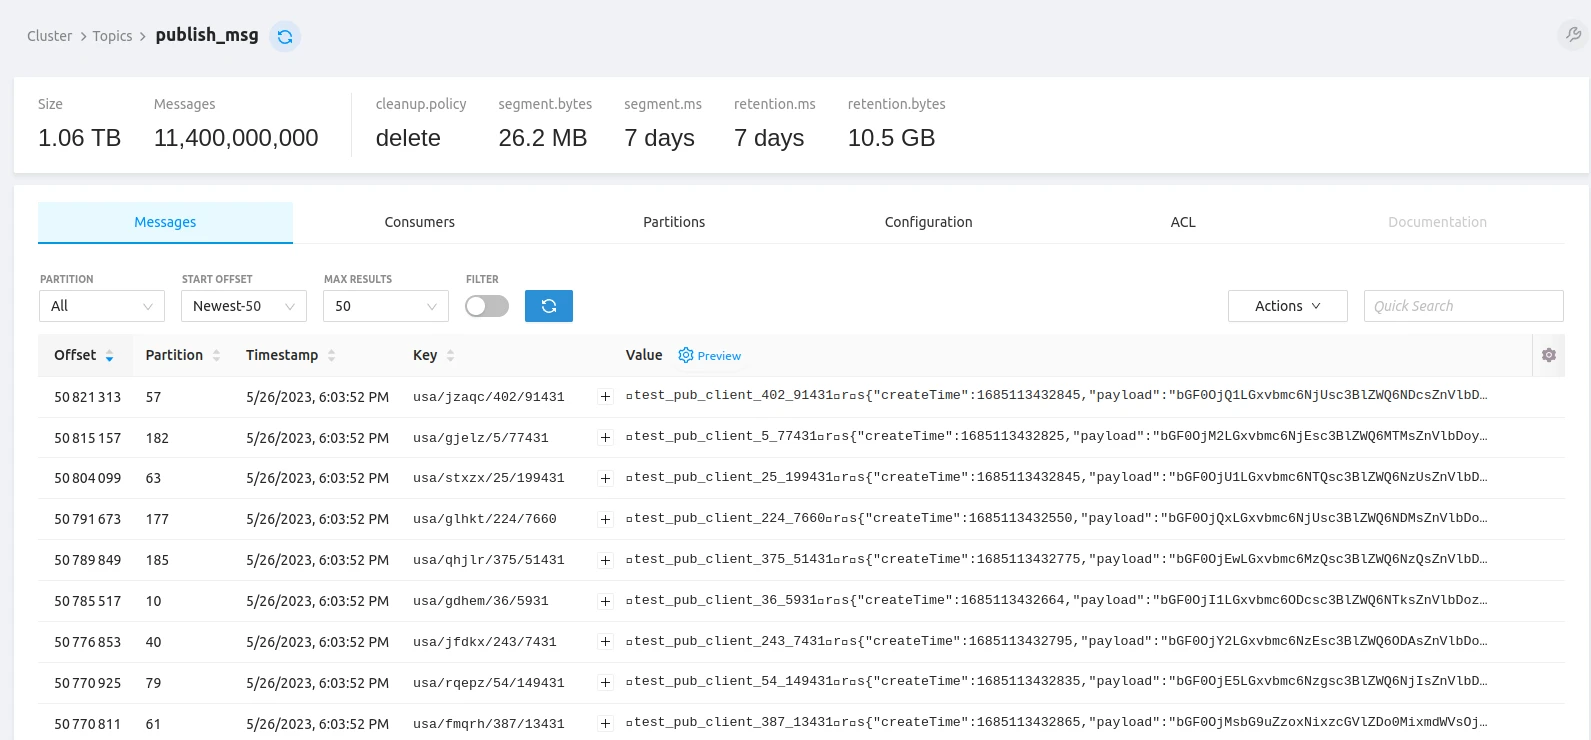
All topics show 100% message delivery success. Topic data is compressed — producers send compressed data and Kafka brokers retain the original compression codec (compression.type property), ensuring efficient storage and transmission.
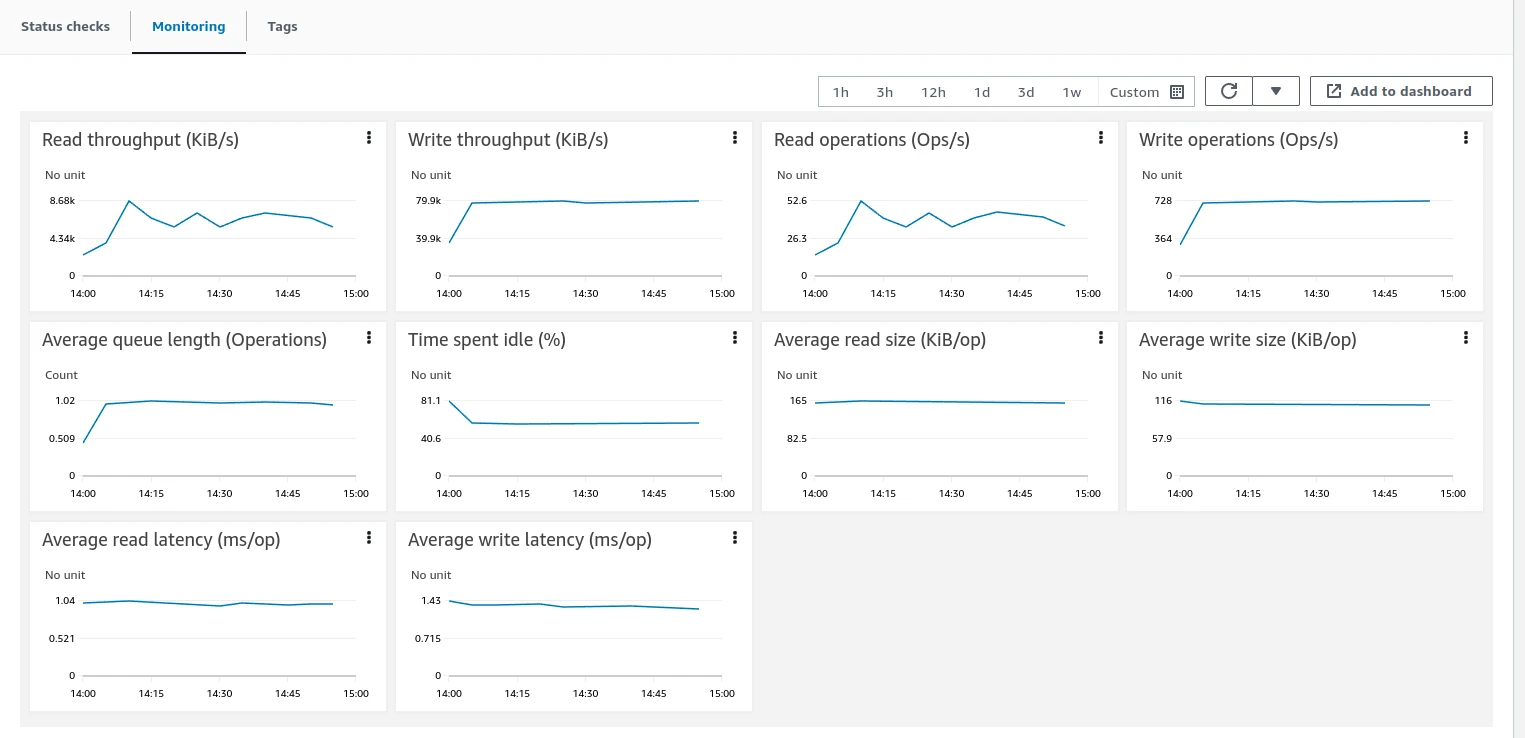
Grafana monitoring:
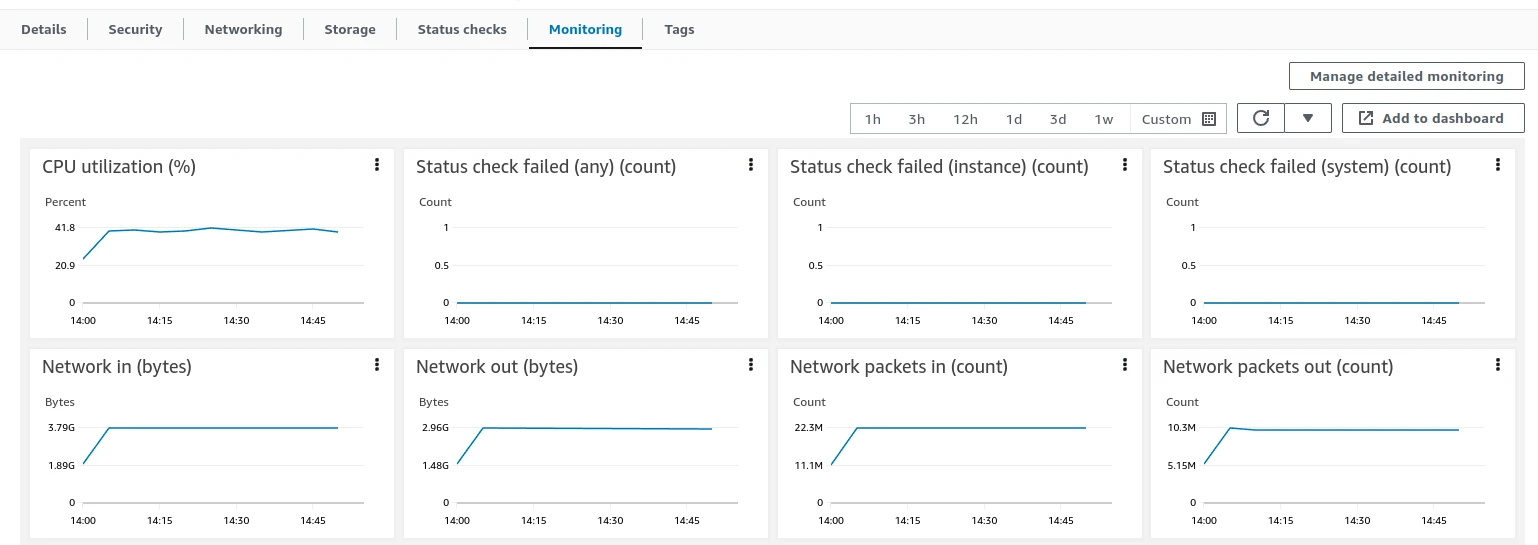
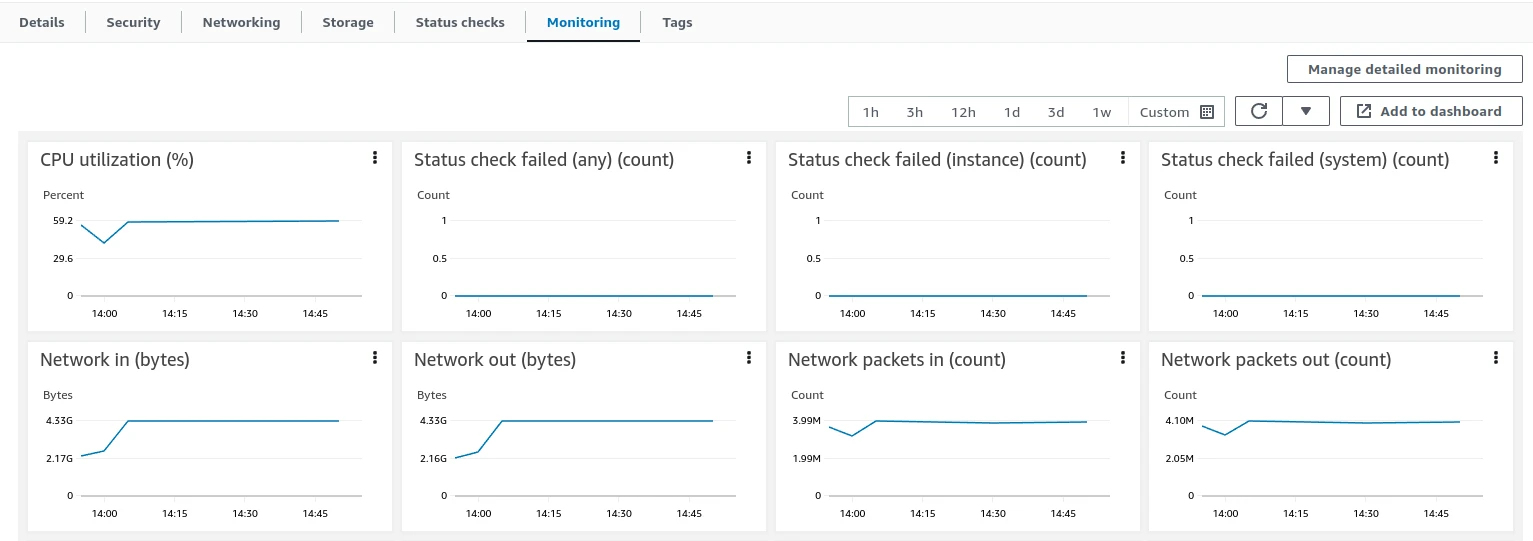
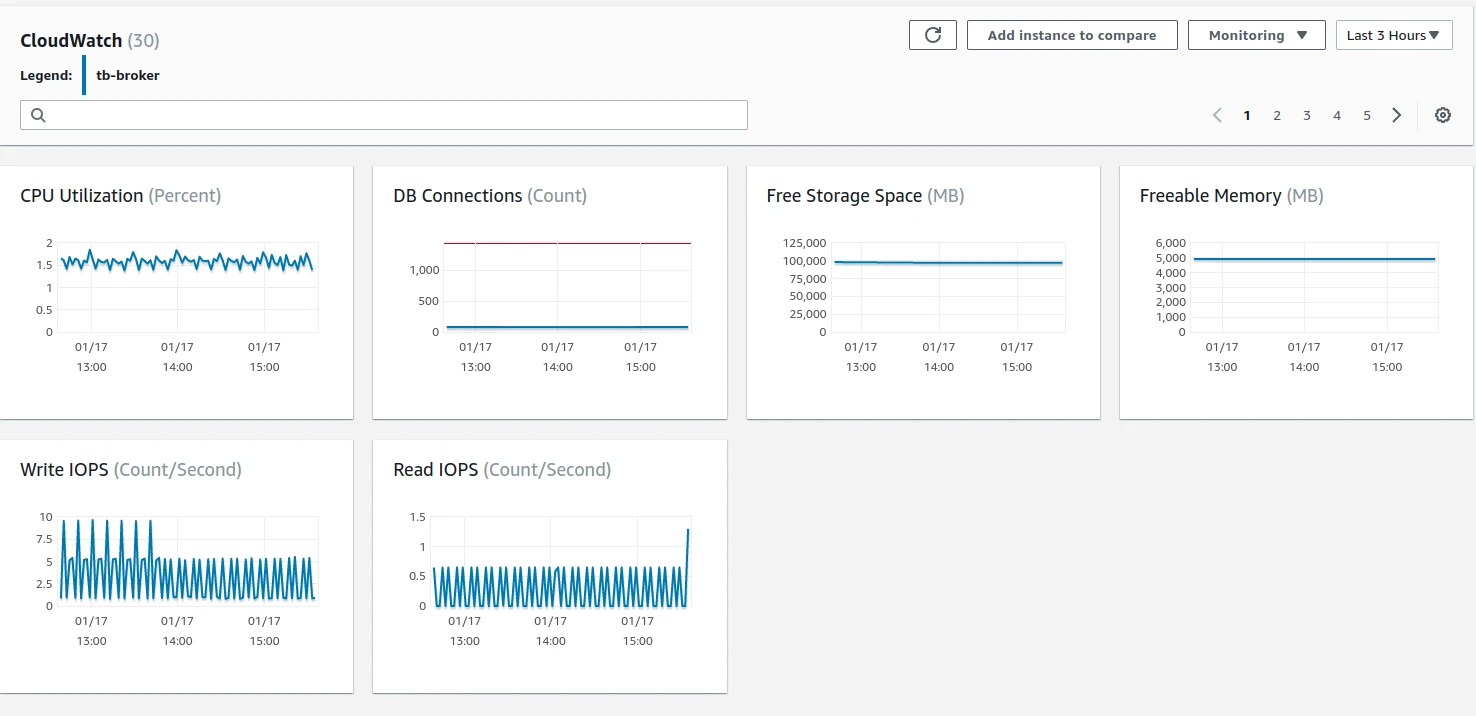
AWS instance monitoring (TBMQ ~45% avg CPU, PostgreSQL minimal, Kafka has headroom for more load):
JVM monitoring (forward the JMX port then open VisualVM):
kubectl port-forward tb-broker-0 9999:9999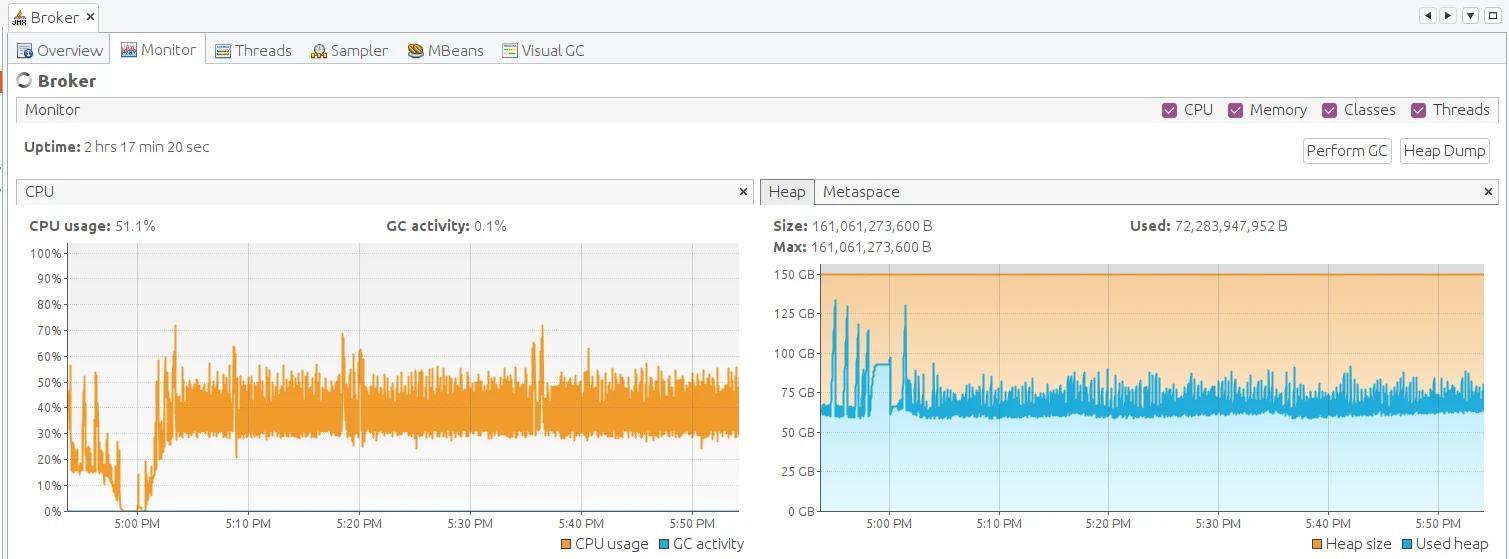
Lessons learned
Section titled “Lessons learned”- TBMQ cluster has capacity to process even higher loads.
- Kafka provides reliable, highly available message processing.
- No direct communication between TBMQ nodes enables horizontal scaling.
- Employing QoS 0 would further elevate the message rate, but QoS 1 was chosen to demonstrate a more practical setup. QoS 1 is widely favored as it balances message delivery speed and reliability.
- TBMQ excels at fan-in, P2P, and fan-out scenarios at both small and large scale.
Challenges faced during testing
Section titled “Challenges faced during testing”Kafka producer disconnects — caused message loss. Resolved by implementing a dedicated executor service for processing publish callbacks.
Publishing queue overhead — eliminated by using the thread-safe nature of Kafka producers directly, with message ordering achieved another way.
Throughput tuning — additional improvements to message pack processing and UUID generation and sending messages without explicit flushing.
Memory optimization — reduced unnecessary object creation, improving Garbage Collector performance and reducing stop-the-world pauses: ClientSessionInfo reuse, application publish msg copies, Bytebuf in publish msg.
Uneven client distribution — resolved by implementing even distribution of clients among broker nodes.
TCO calculations
Section titled “TCO calculations”Approximate monthly cost for this setup on AWS us-east-1 (prices are illustrative — consult AWS for accurate pricing; Savings Plans (up to 72% discount), RDS Reserved Instances (up to 69%), and MSK Tiered Storage (50% or more) can reduce costs significantly):
| Component | Details | Approx. cost/month |
|---|---|---|
| AWS EKS cluster | — | ~$73 |
| TBMQ nodes | 25 × m6g.metal (64 vCPU, 256 GiB, 10 GiB EBS GP3) | ~$23,800 |
| AWS RDS | db.m6i.large, 100 GiB | ~$100 |
| AWS MSK | 9 × m6a.2xlarge, 4,500 GiB total | ~$2,600 |
| Total | — | ~$26,573 |
~$0.0003 per device per month.
How to repeat the tests
Section titled “How to repeat the tests”Load configuration:
- 100M publish MQTT clients (smart tracker devices)
- 500 persistent subscribe MQTT clients (APPLICATION consumers for analysis)
- 6M msg/sec throughput over MQTT; each message contains five data points, message size is 114 bytes
- PostgreSQL database to store MQTT client credentials and client session states
- Kafka queue to persist messages
At this message rate and size, the initial tbmq.msg.all Kafka topic receives approximately ~1 TB of data
per hour, and each subscriber topic receives around ~1.6 GB per hour. It is not necessary to store data for
an extended period — TBMQ distributes messages among subscribers and optionally stores them temporarily for
offline clients. Configure an appropriate storage size and adjust the size and period retention policies for
Kafka topics based on your requirements.
The test agent consisted of 2,000 publisher and 500 subscriber Kubernetes pods, with a single pod as the orchestrator.
Refer to the AWS cluster installation guide to deploy TBMQ on AWS.
- TBMQ branch with test scripts
- Performance testing tool
- Publisher configuration
- Subscriber configuration
Publisher group configuration:
{ "id": 1, "publishers": 200000, "topicPrefix": "usa/ydwvv/1/", "clientIdPrefix": null}id— identifier of the publisher group.publishers— number of publisher clients in the group.topicPrefix— topic prefix to which messages are published.clientIdPrefix— client ID prefix for publishers.
Subscriber group configuration:
{ "id": 1, "subscribers": 1, "topicFilter": "usa/ydwvv/1/+", "expectedPublisherGroups": [1], "persistentSessionInfo": { "clientType": "APPLICATION" }, "clientIdPrefix": null}id— identifier of the subscriber group.subscribers— number of subscriber clients in the group.topicFilter— topic filter to subscribe to.expectedPublisherGroups— list of publisher group IDs whose messages these subscribers receive (used for debugging and statistics).persistentSessionInfo— persistent session object containing the client type.clientIdPrefix— client ID prefix for subscribers.
Conclusion
Section titled “Conclusion”This test demonstrates TBMQ cluster’s capability to process 6M messages per second from diverse devices while handling 100M concurrent connections. TBMQ excels in high-throughput scenarios and scales both vertically and horizontally. Follow the project on GitHub for future performance updates.
Was this helpful?