Getting Started
The ThingsBoard IoT Gateway is an open-source solution, designed to serve as a bridge between IoT devices connected to legacy and third-party systems with ThingsBoard.
This guide covers initial IoT Gateway installation and configuration, we will do the following things:
- Create a new gateway device;
- Launch the gateway using Docker command;
- Configure different connector types (MQTT, OPC-UA, Modbus) in order to connect to a local demo servers and read data from them;
- Check received device data on ThingsBoard.
Prerequisites
Section titled “Prerequisites”- Before initiating the Gateway setup, ensure that the ThingsBoard server is up and running. The simplest approach is to use ThingsBoard Cloud. Alternatively, you can install ThingsBoard manually by following the steps outlined in the Installation Guide.
- Before moving forward, ensure Docker is installed and properly configured on your machine. If you haven’t installed Docker yet, you can download it from the official Docker website and follow their installation guide for your specific operating system.
Step 1. Create a new gateway device on ThingsBoard
Section titled “Step 1. Create a new gateway device on ThingsBoard”First, add a gateway device to your ThingsBoard instance by following these steps:
-
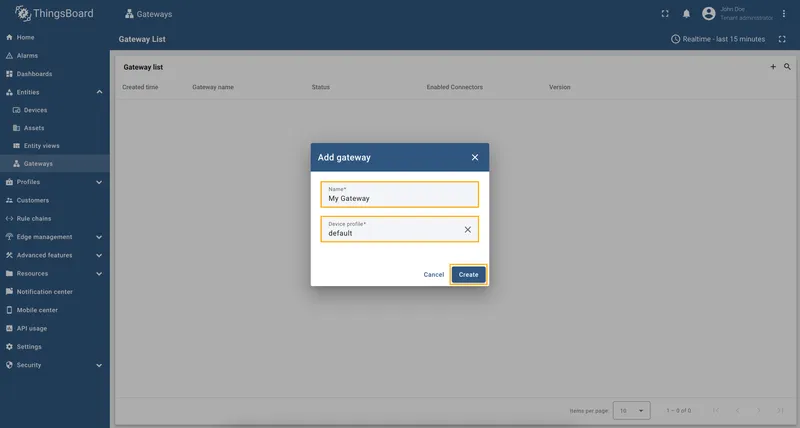
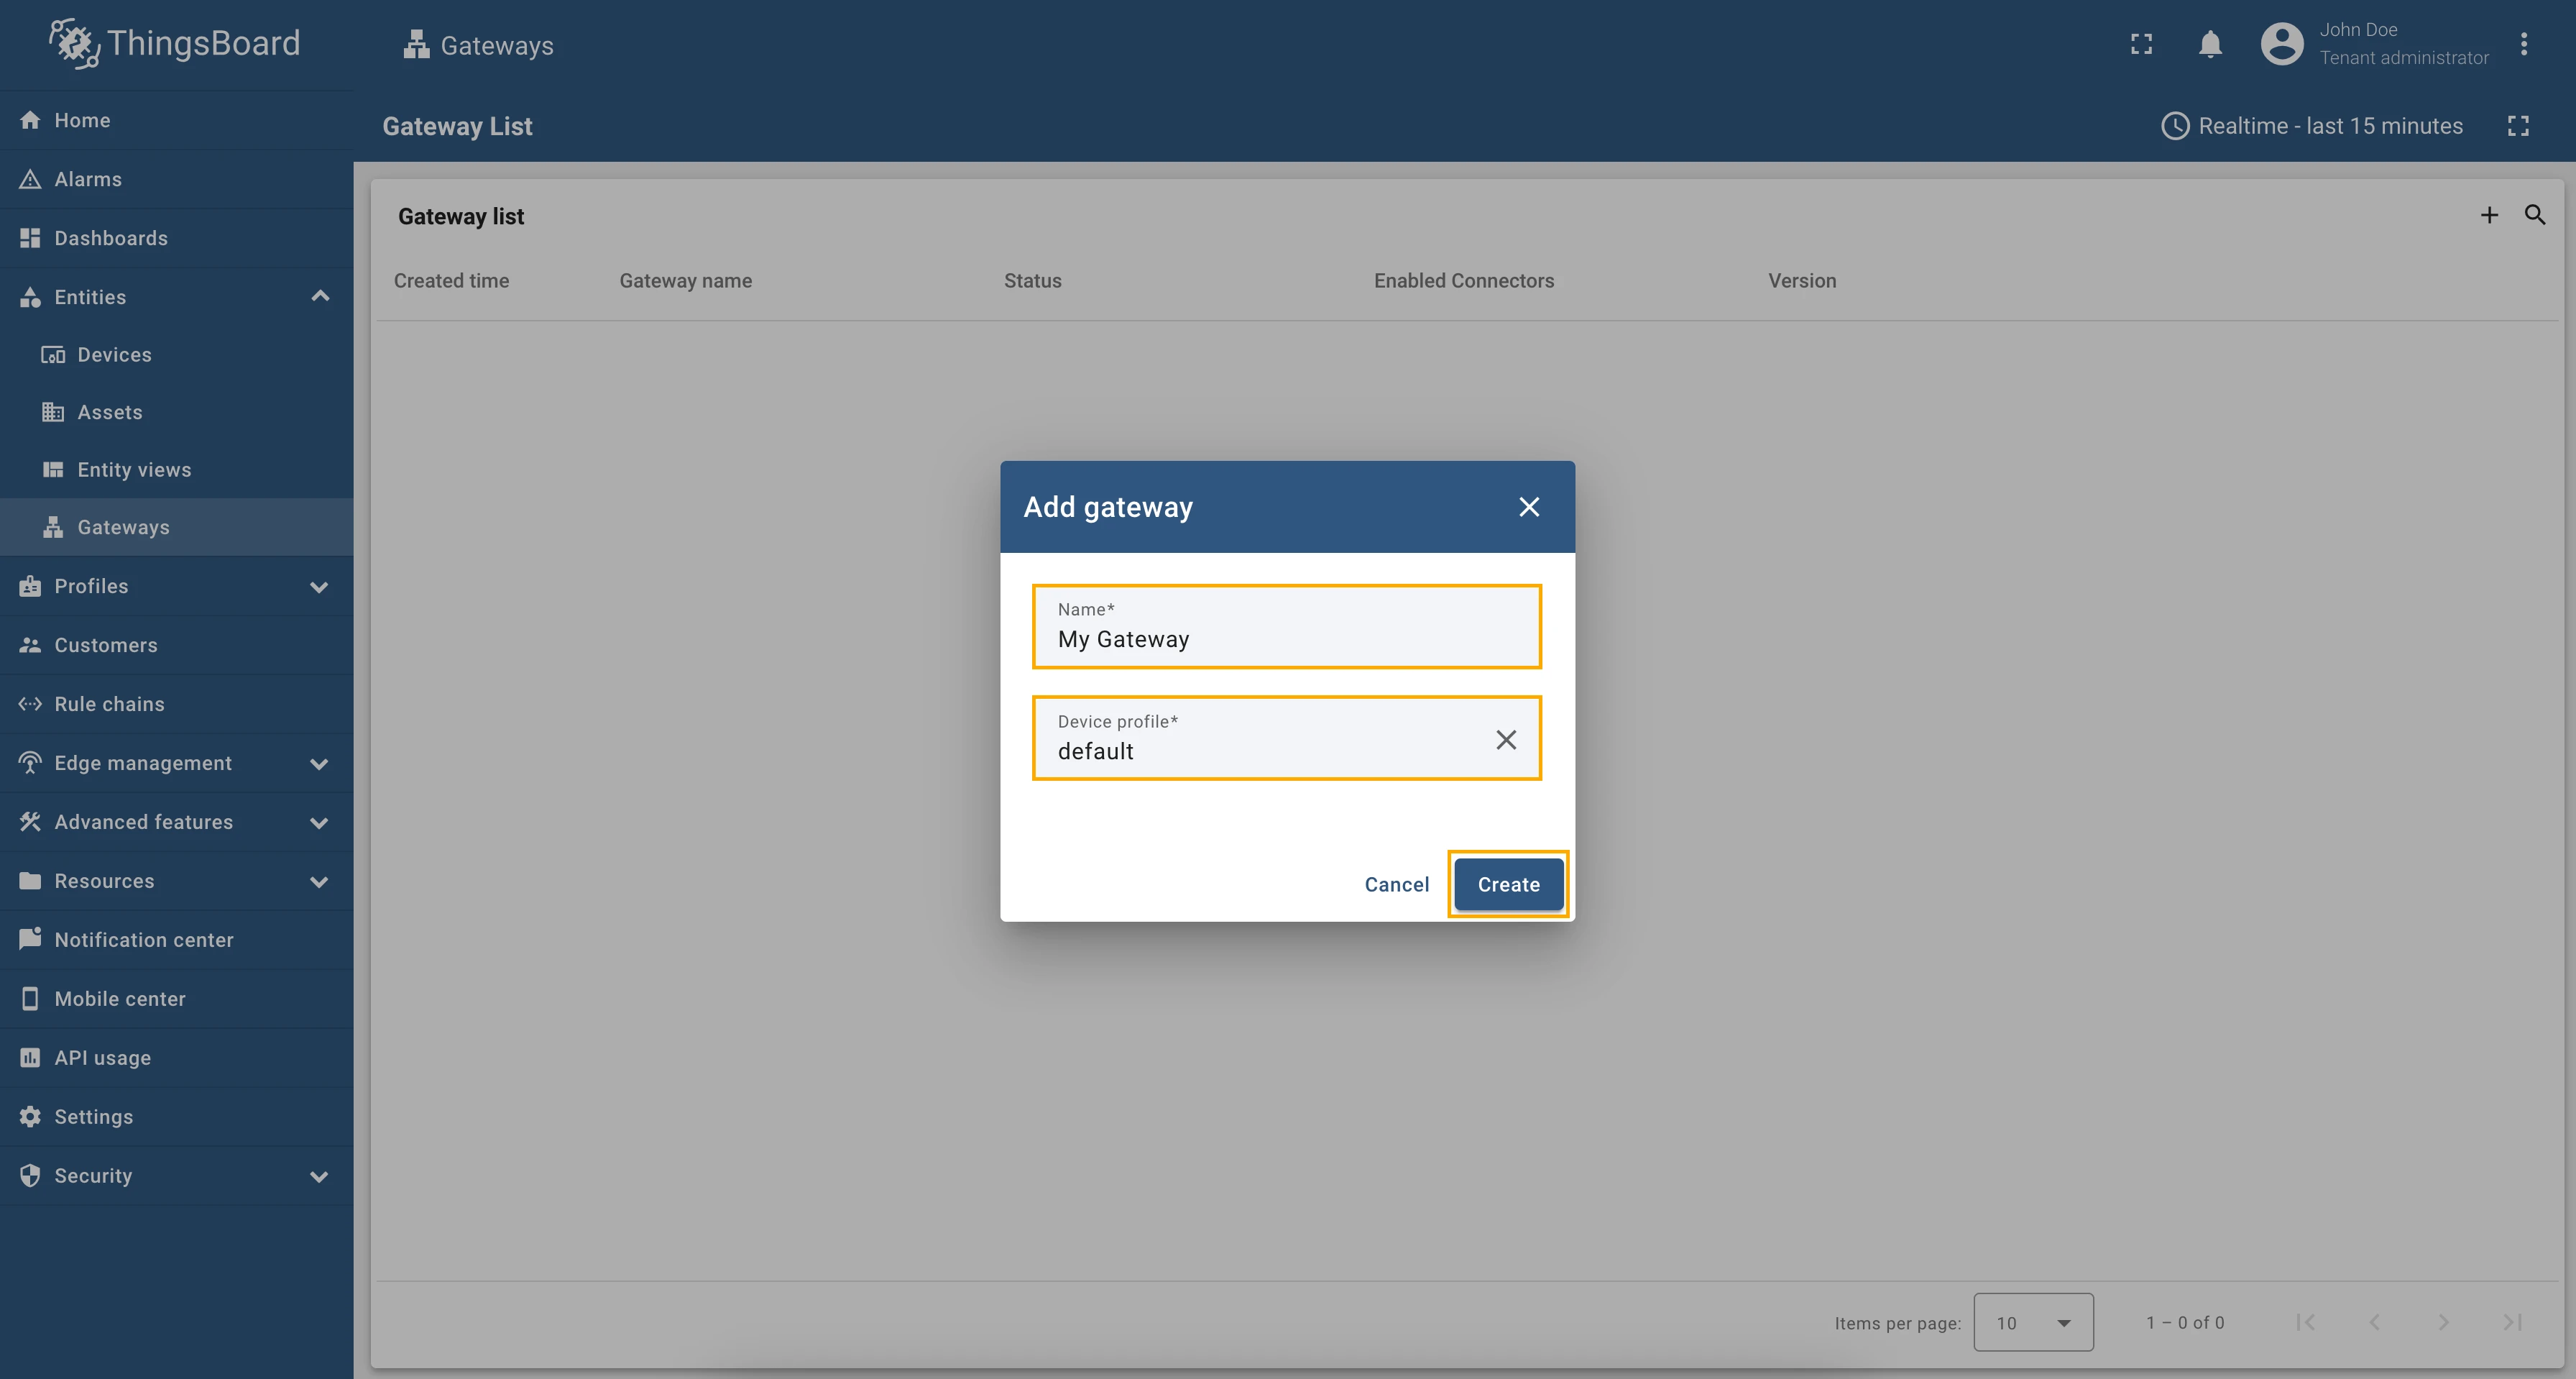
Go to Entities > Gateways tab.

-
Click the + button, enter the gateway device name (e.g., “My Gateway”), and select the device profile. Click on Create button.

To launch the gateway, use the following steps:
-
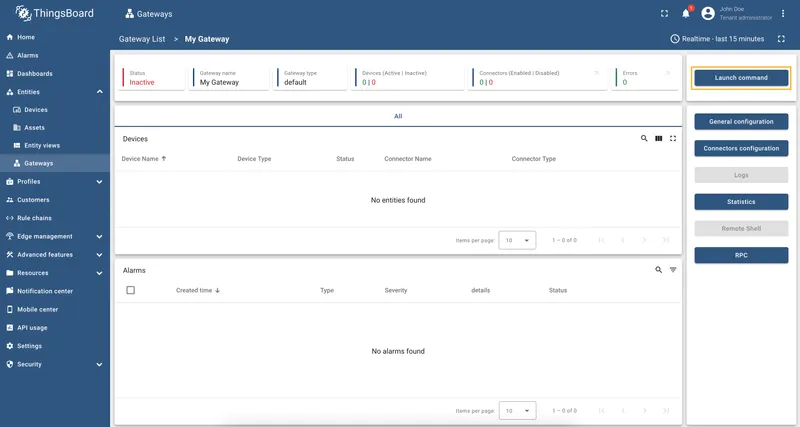
Select and click on newly created gateway, click on Launch command button in the top right corner.
-
Click to download
docker-compose.ymlfile to your PC, copy command and execute it in your terminal.

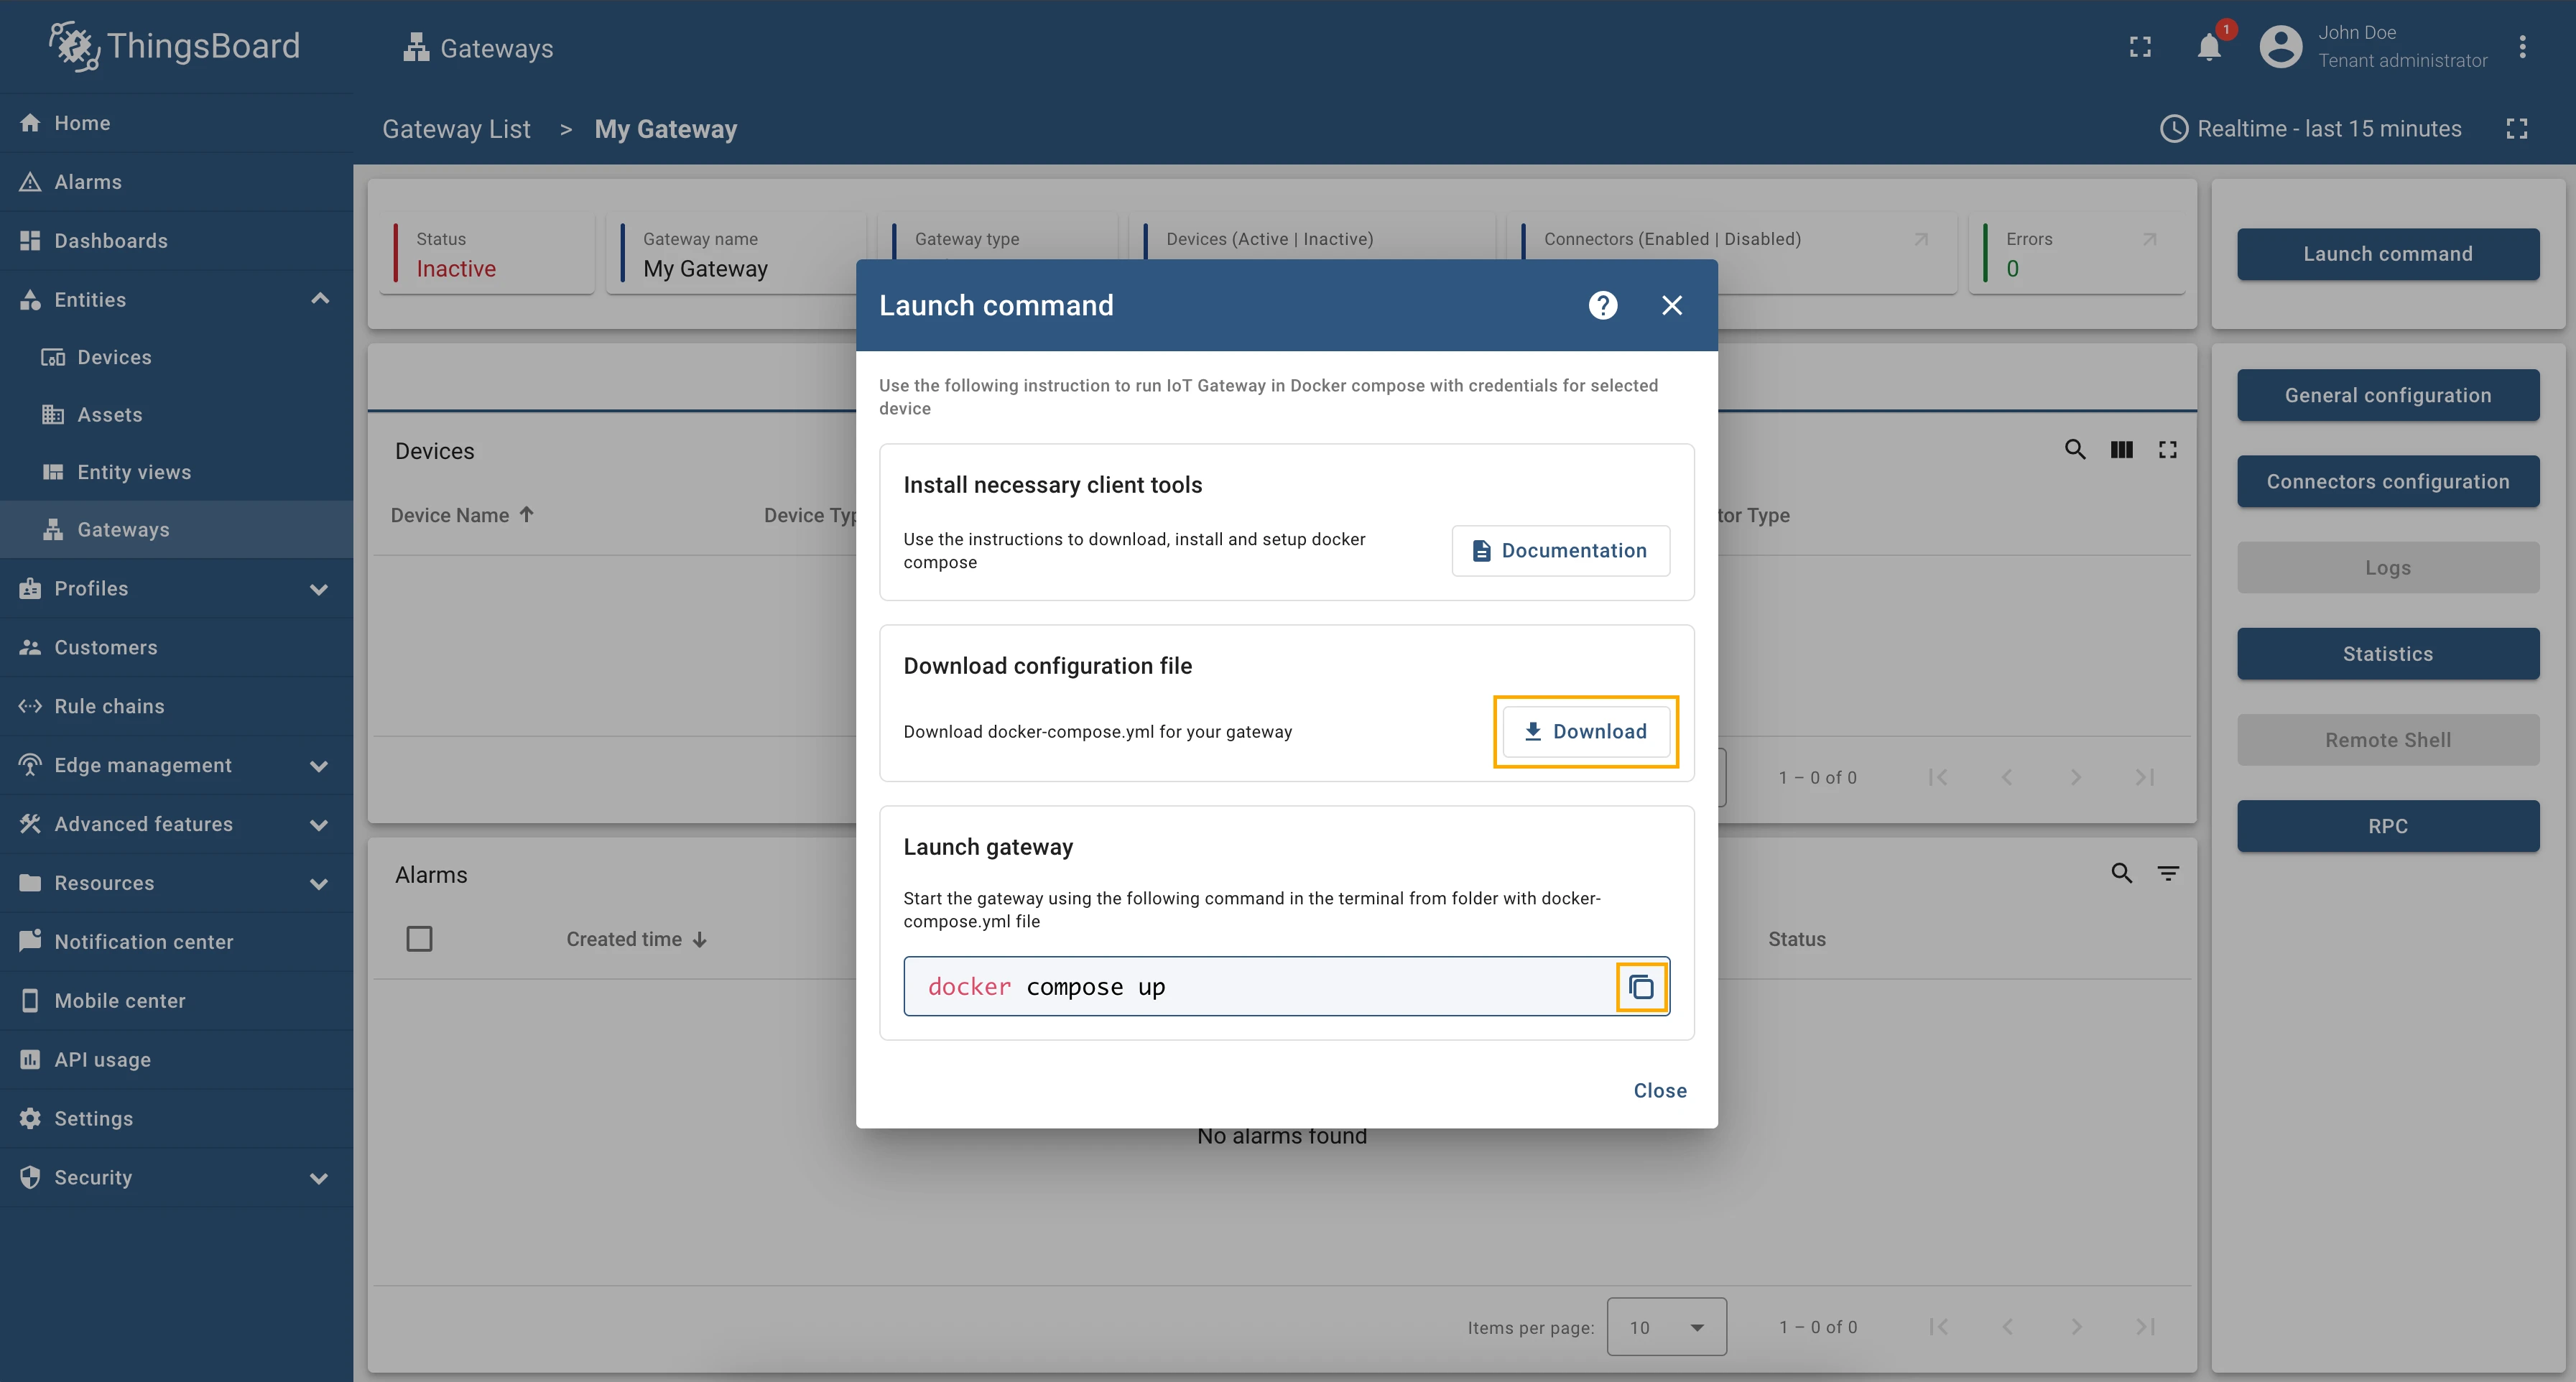
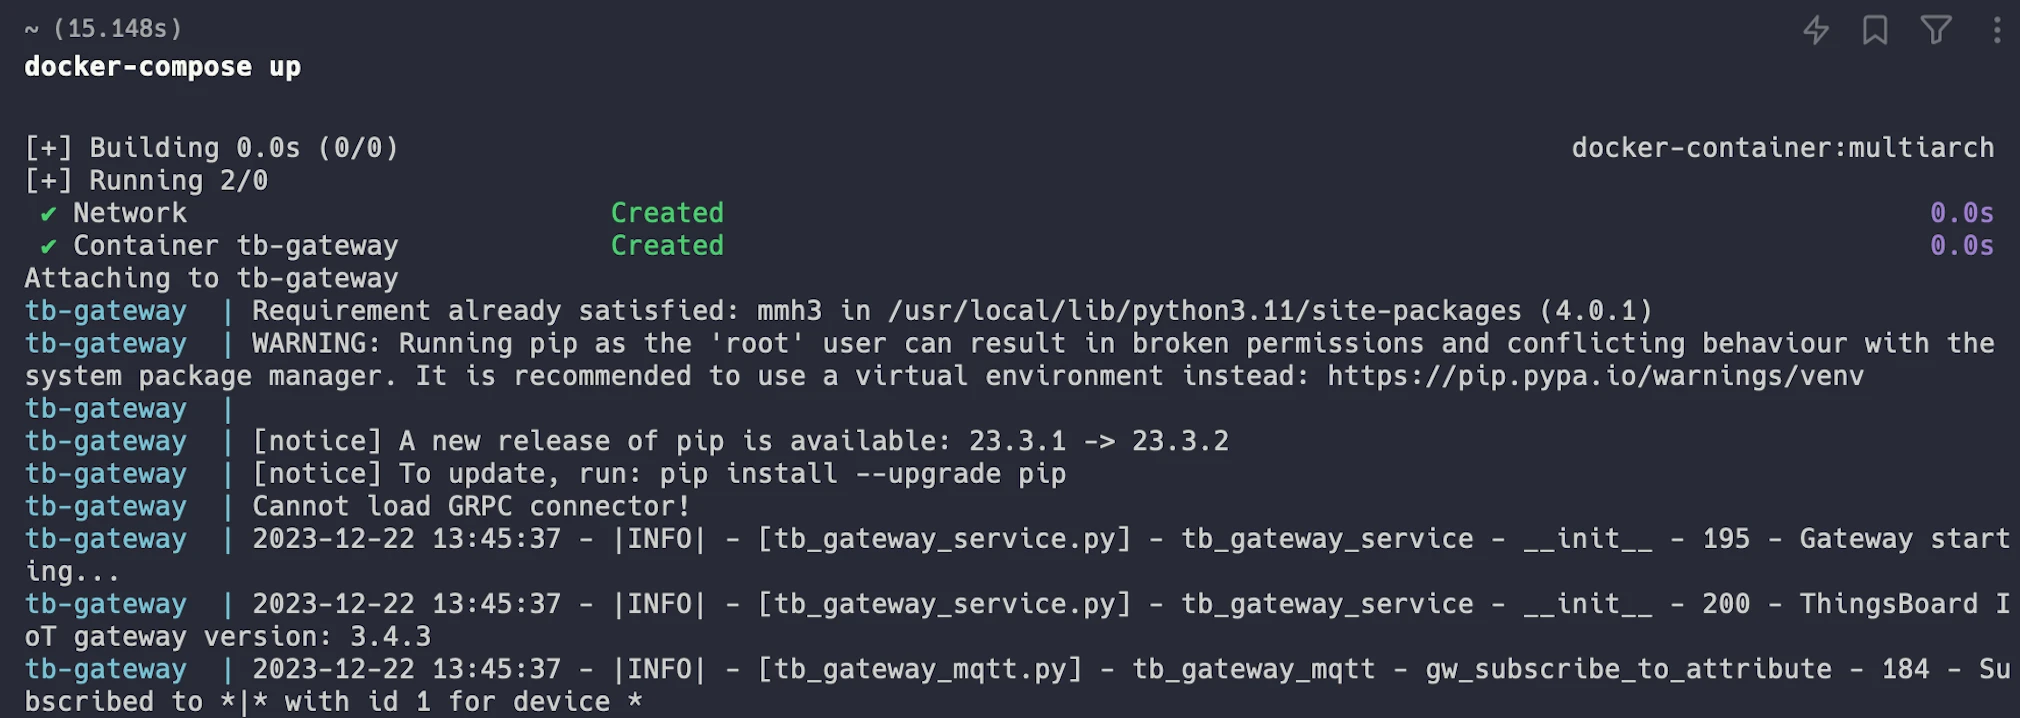
After running gateway docker image, you can see the following logs in your terminal:
Step 2. Enable remote logging
Section titled “Step 2. Enable remote logging”To view gateway and connector logs on the platform side, you need to enable remote logging. For this purpose, use the following steps:
-
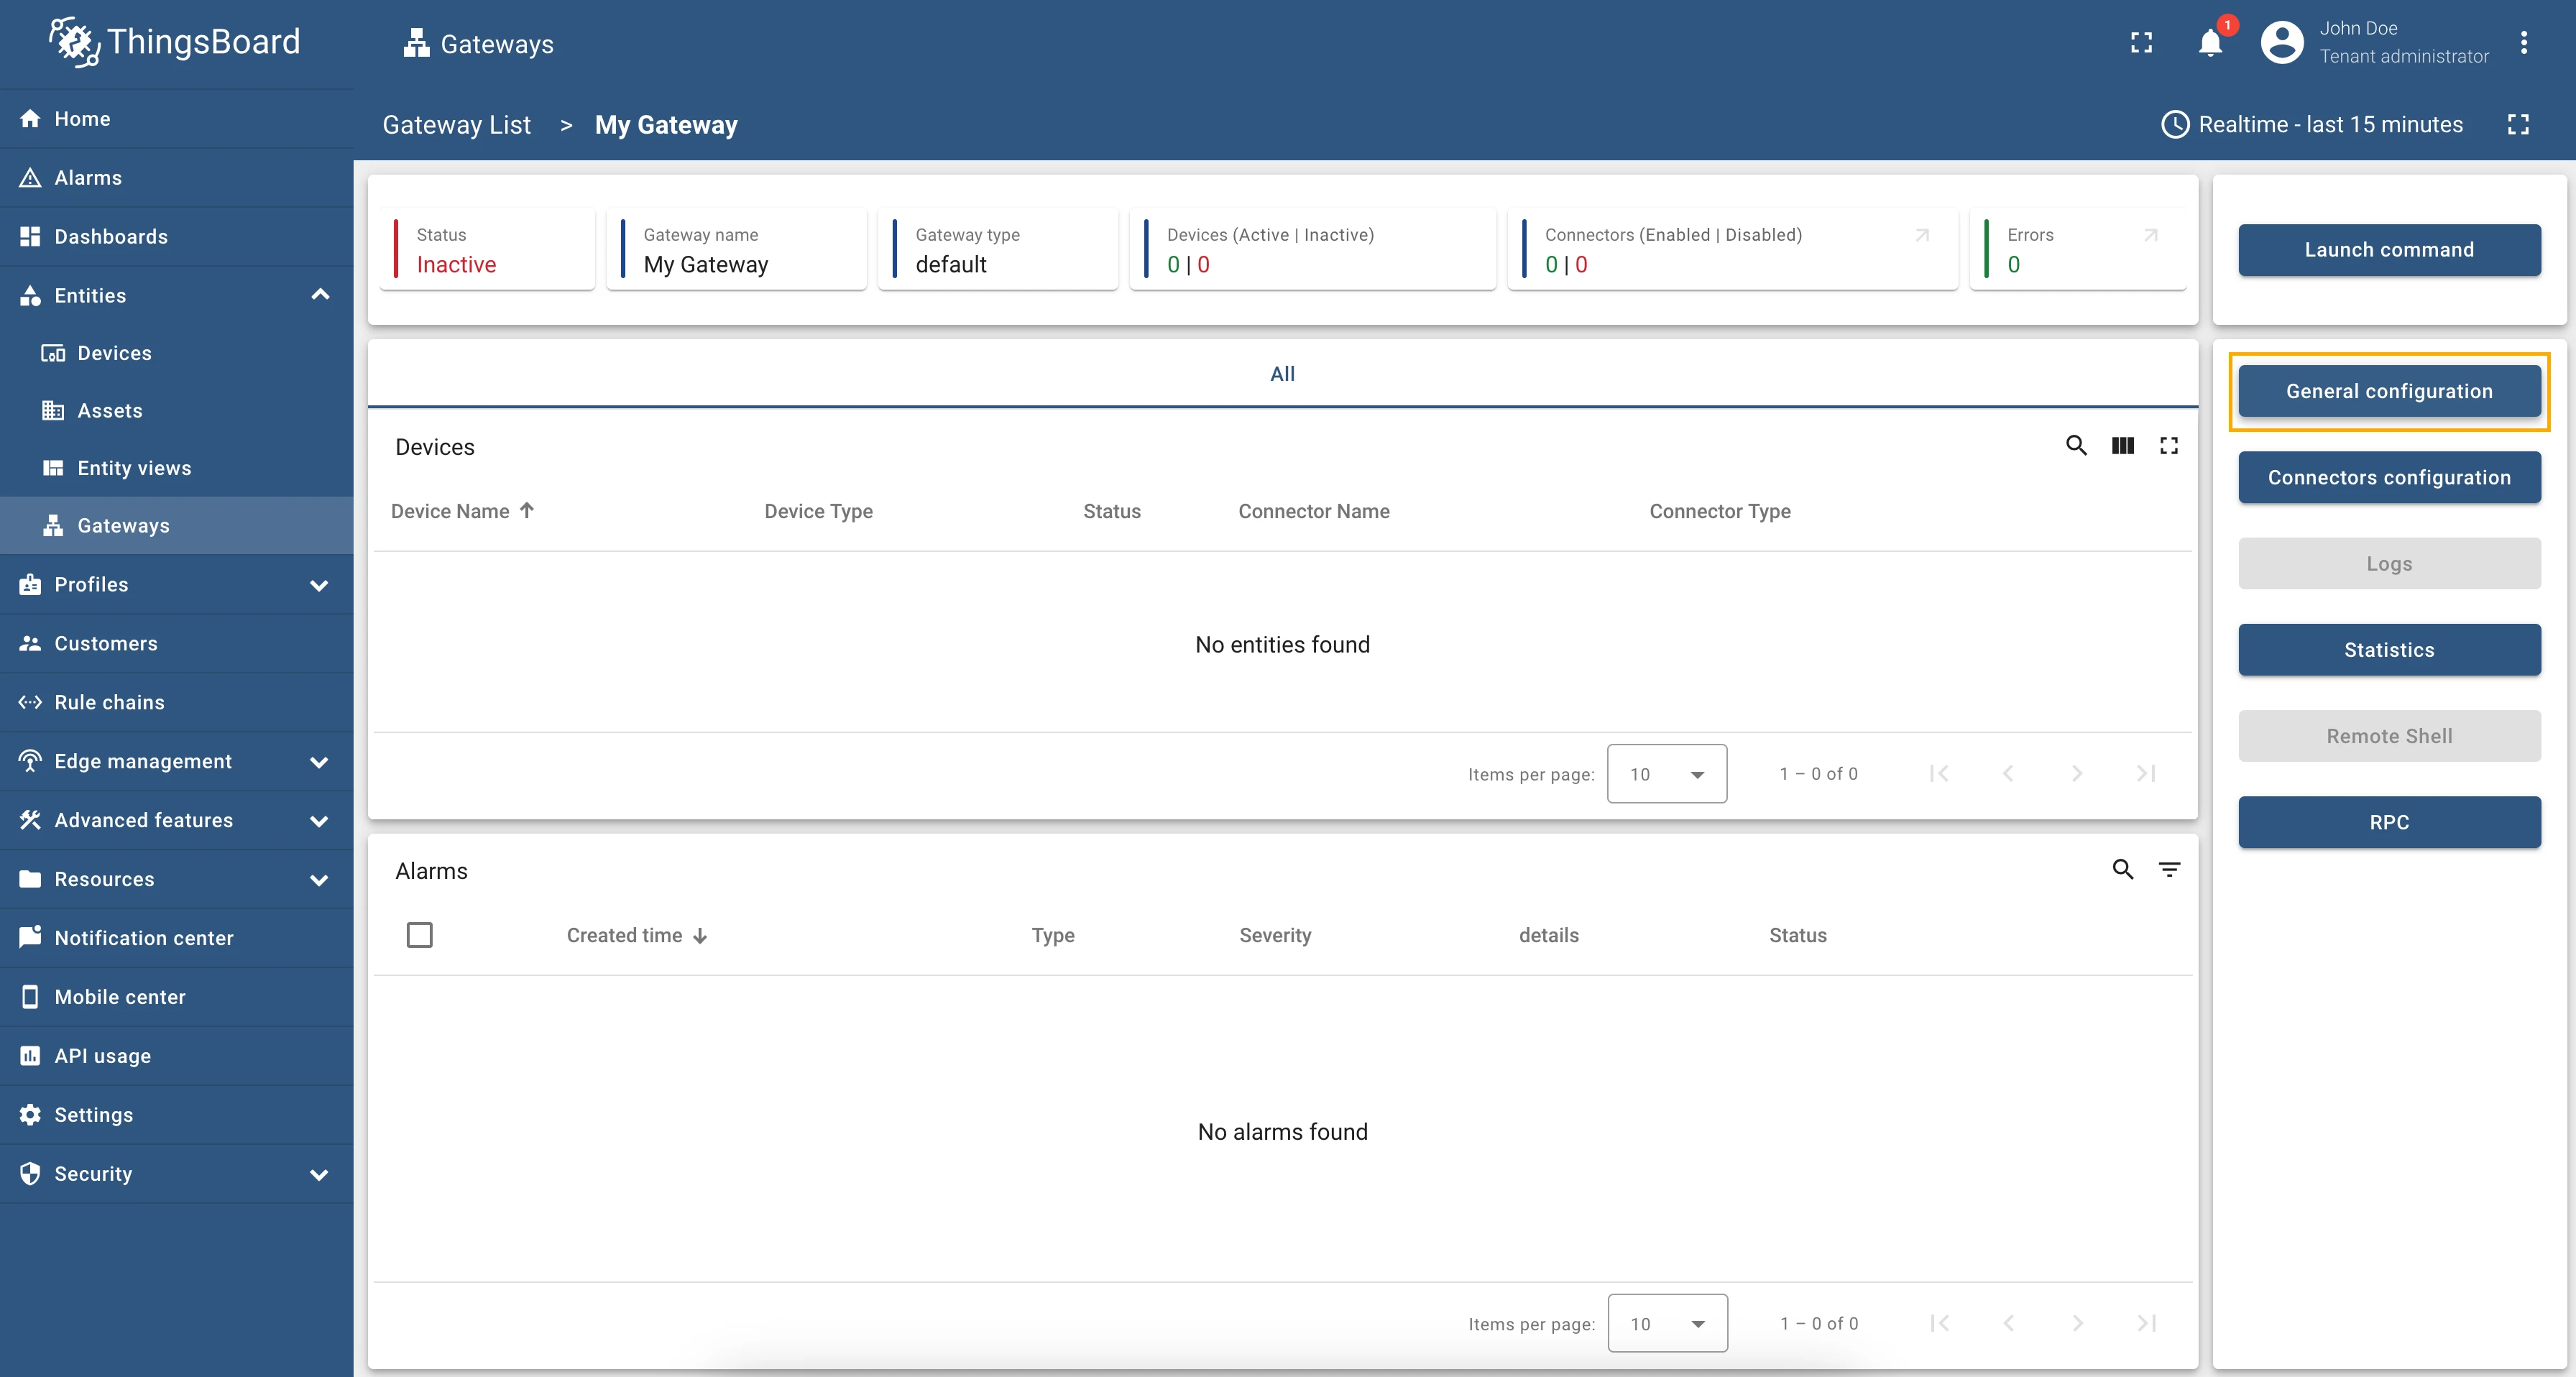
On selected gateway page, click on General configuration button on the right panel.

-
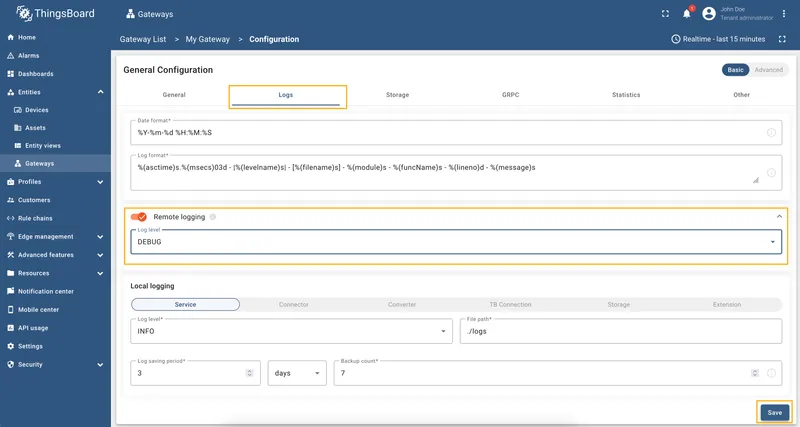
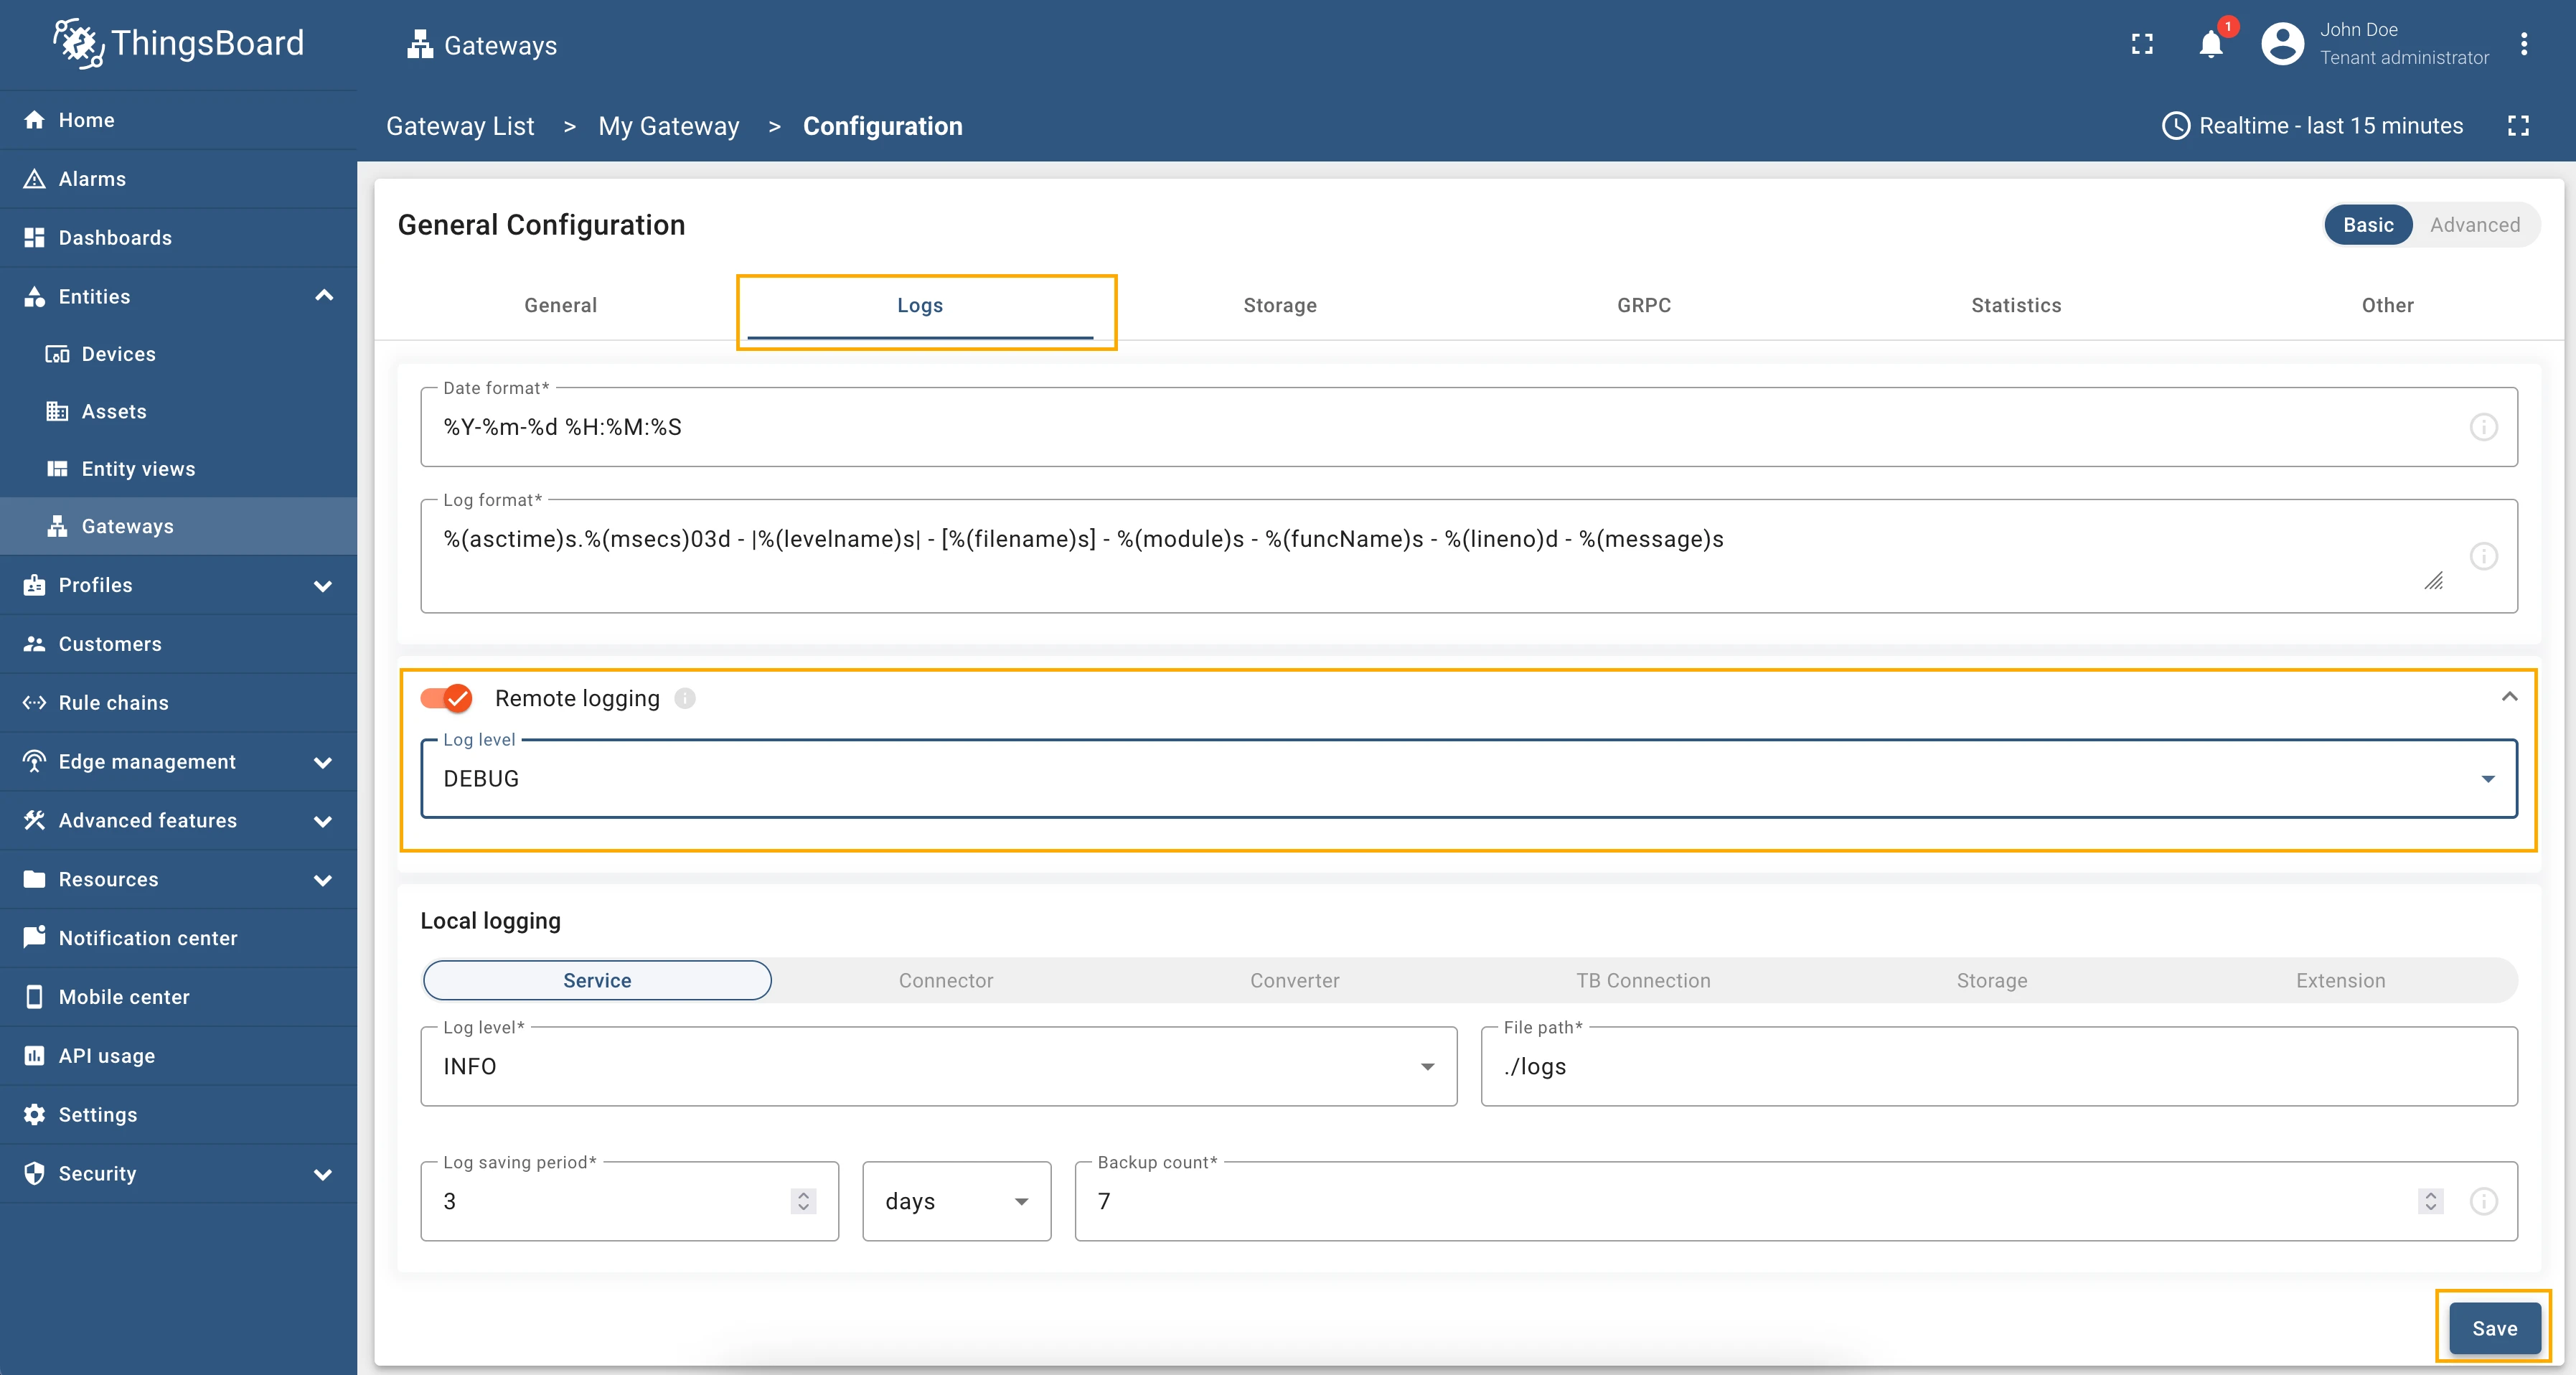
Navigate to the Logs tab. Enable the Remote logging toggle. Select DEBUG in the Log level drop-down menu. Click on the Save button to apply changes.
Step 3. Add new connector
Section titled “Step 3. Add new connector”By choosing the type of connector, you determine the specific method of connection you will use to ensure the interaction of your gateway with other systems or devices.
To see how the connector works, you can choose one of the following connectors:
Let’s add an MQTT connector, which will subscribe to some data topics using the demo broker with a built-in data generator and send data to the gateway.
Setup demo MQTT broker
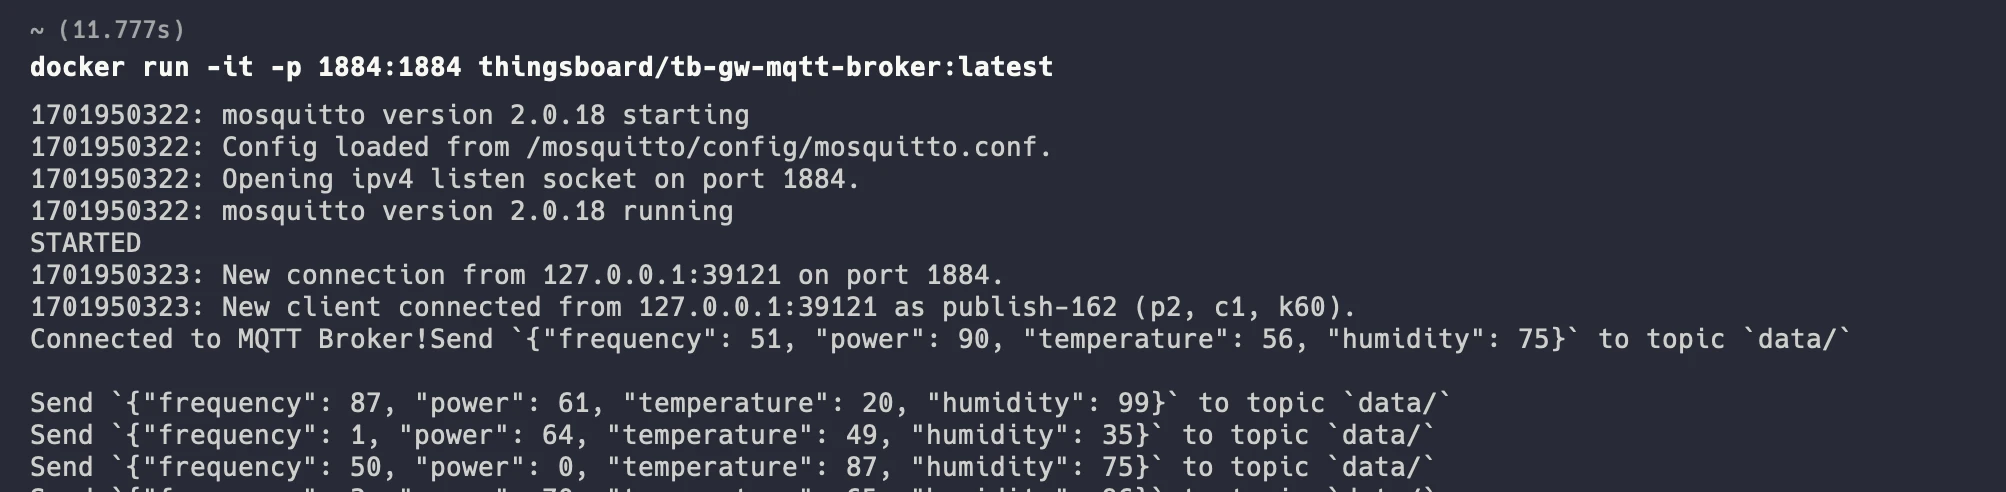
Section titled “Setup demo MQTT broker”As a demo MQTT broker, we will use docker image, that can be installed and run using the following command:
docker run -it -p 1884:1884 thingsboard/tb-gw-mqtt-broker:latestAfter running docker image, you can see the following logs in your terminal:
Setup connector
Section titled “Setup connector”MQTT connector will establish a connection to a broker named “Demo Broker” at “host.docker.internal” on port 1884, using an anonymous security type. It will include a data mapping for the “data/” topic, specifying a JSON converter and defining attribute and time series mappings for device data. Additionally, it will handle connect and disconnect requests for sensors with expressions to extract device names from topic filters.
To create a connector, follow these steps:
-
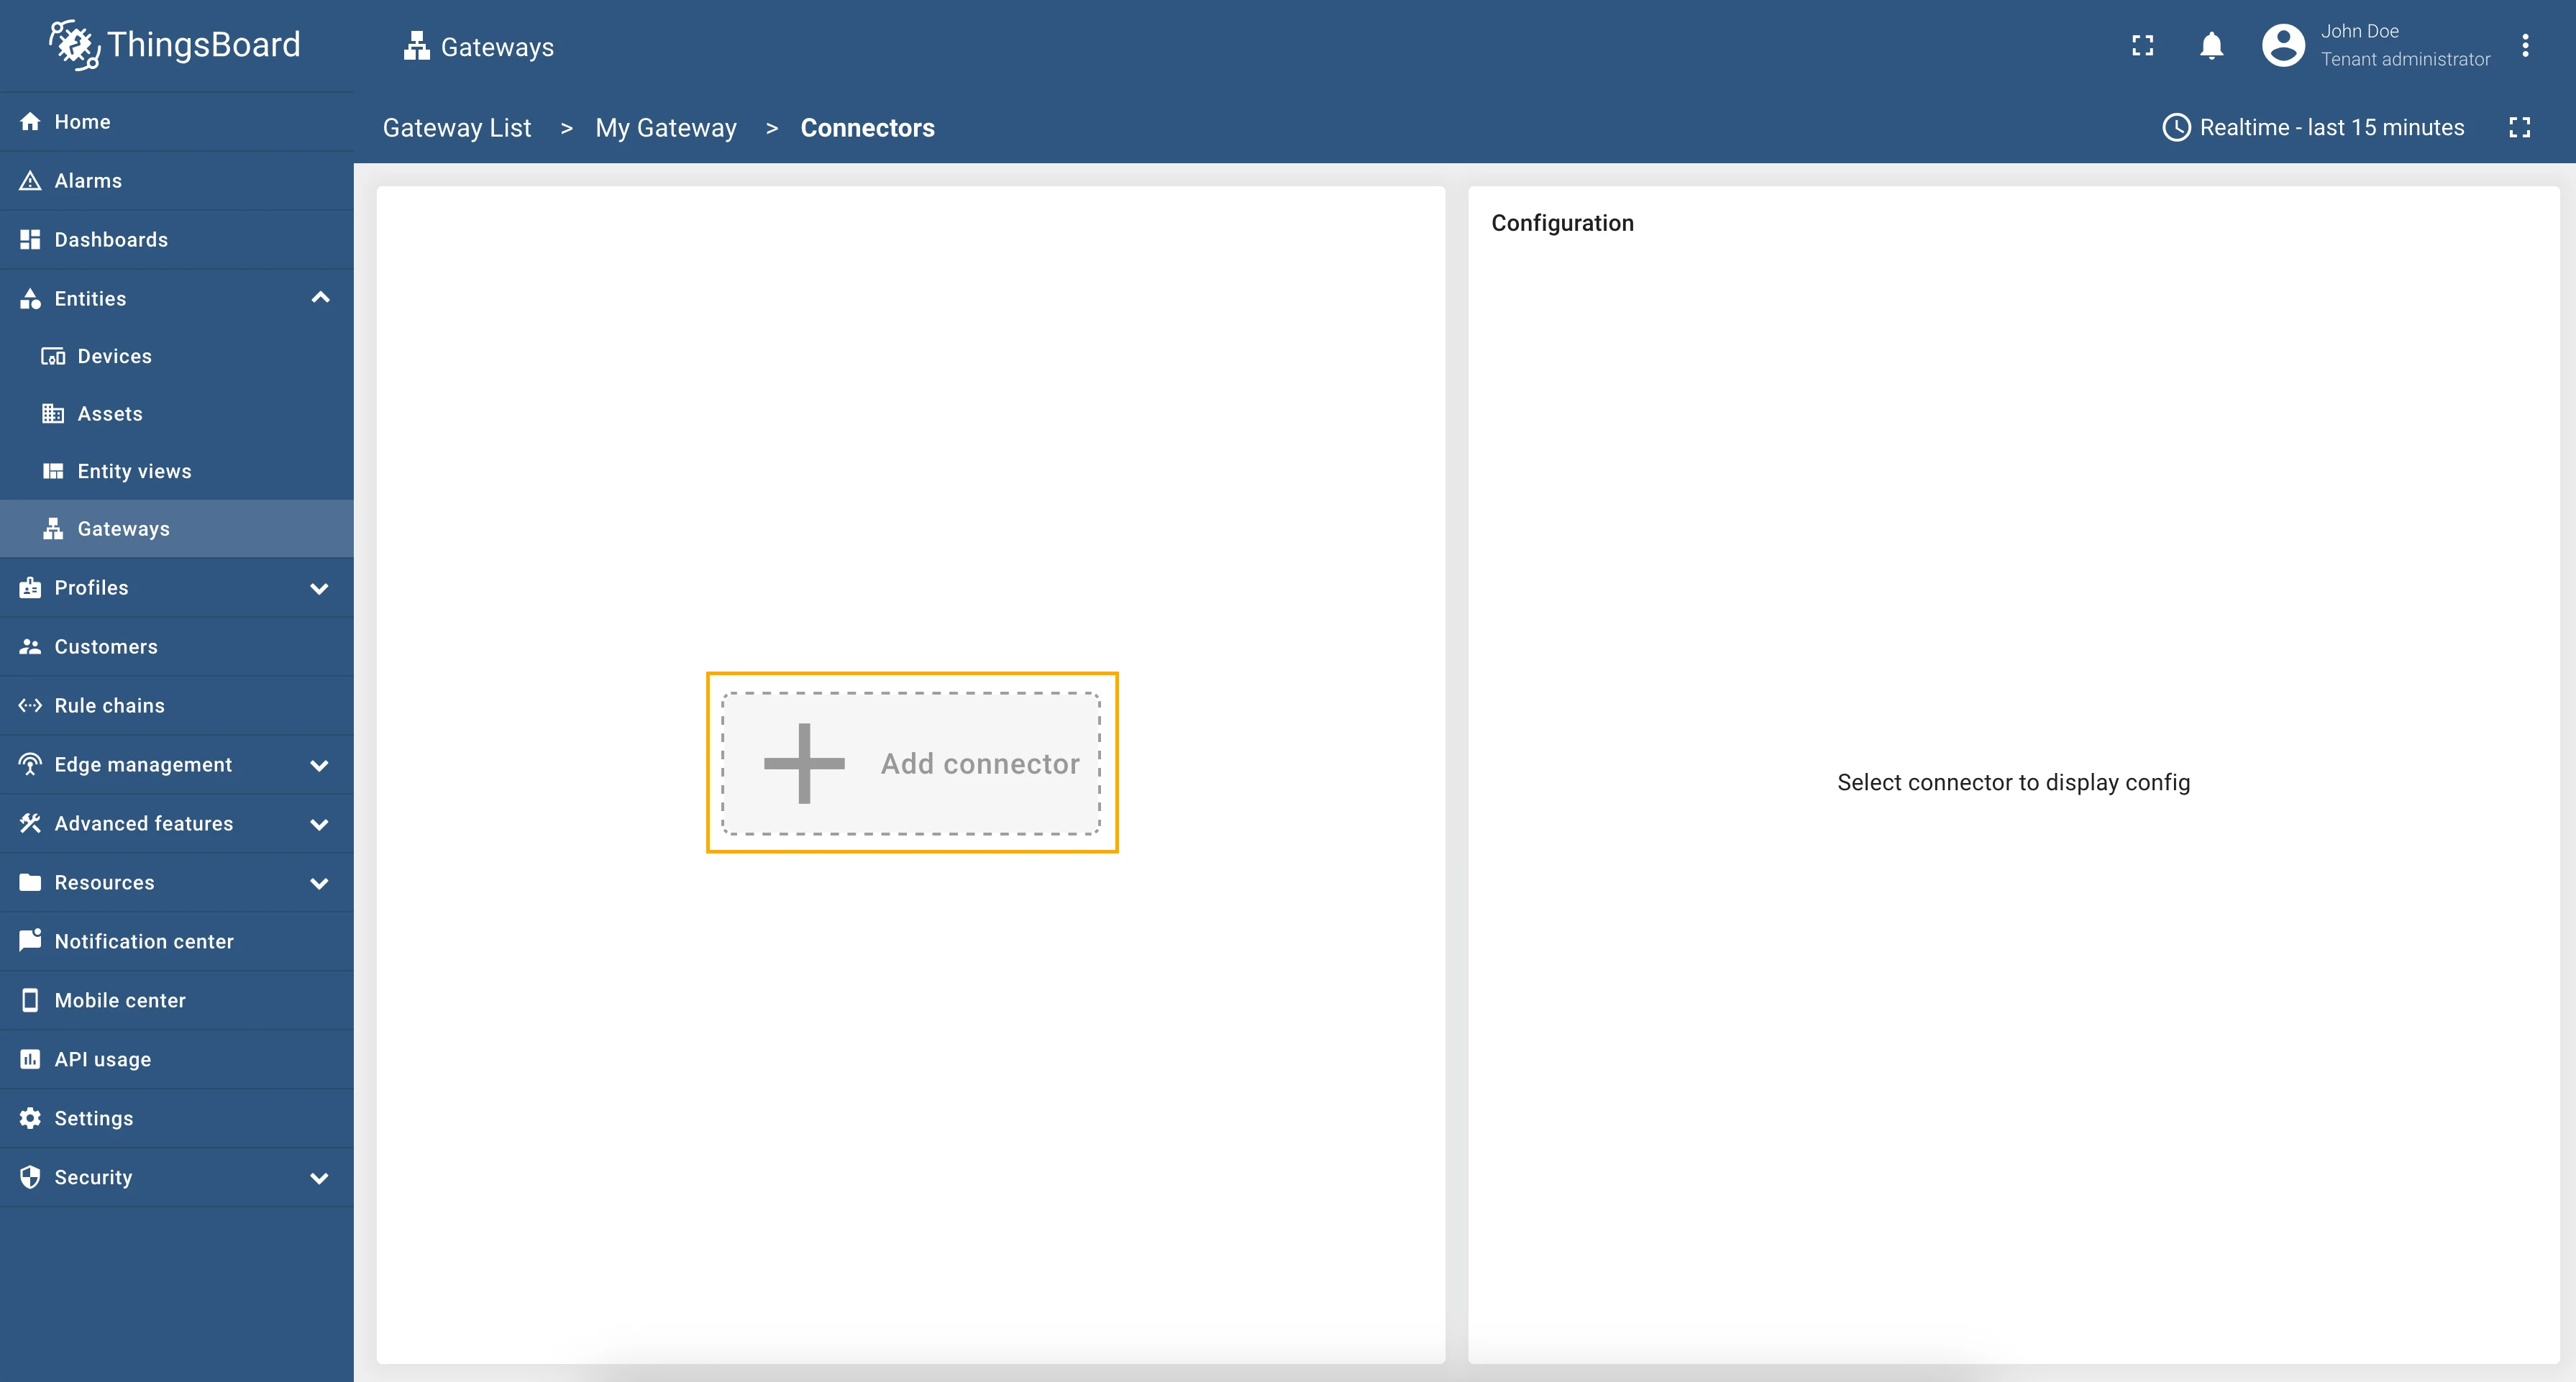
Click on Connectors configuration button on the right panel.

-
Click the + Add connector button.

-
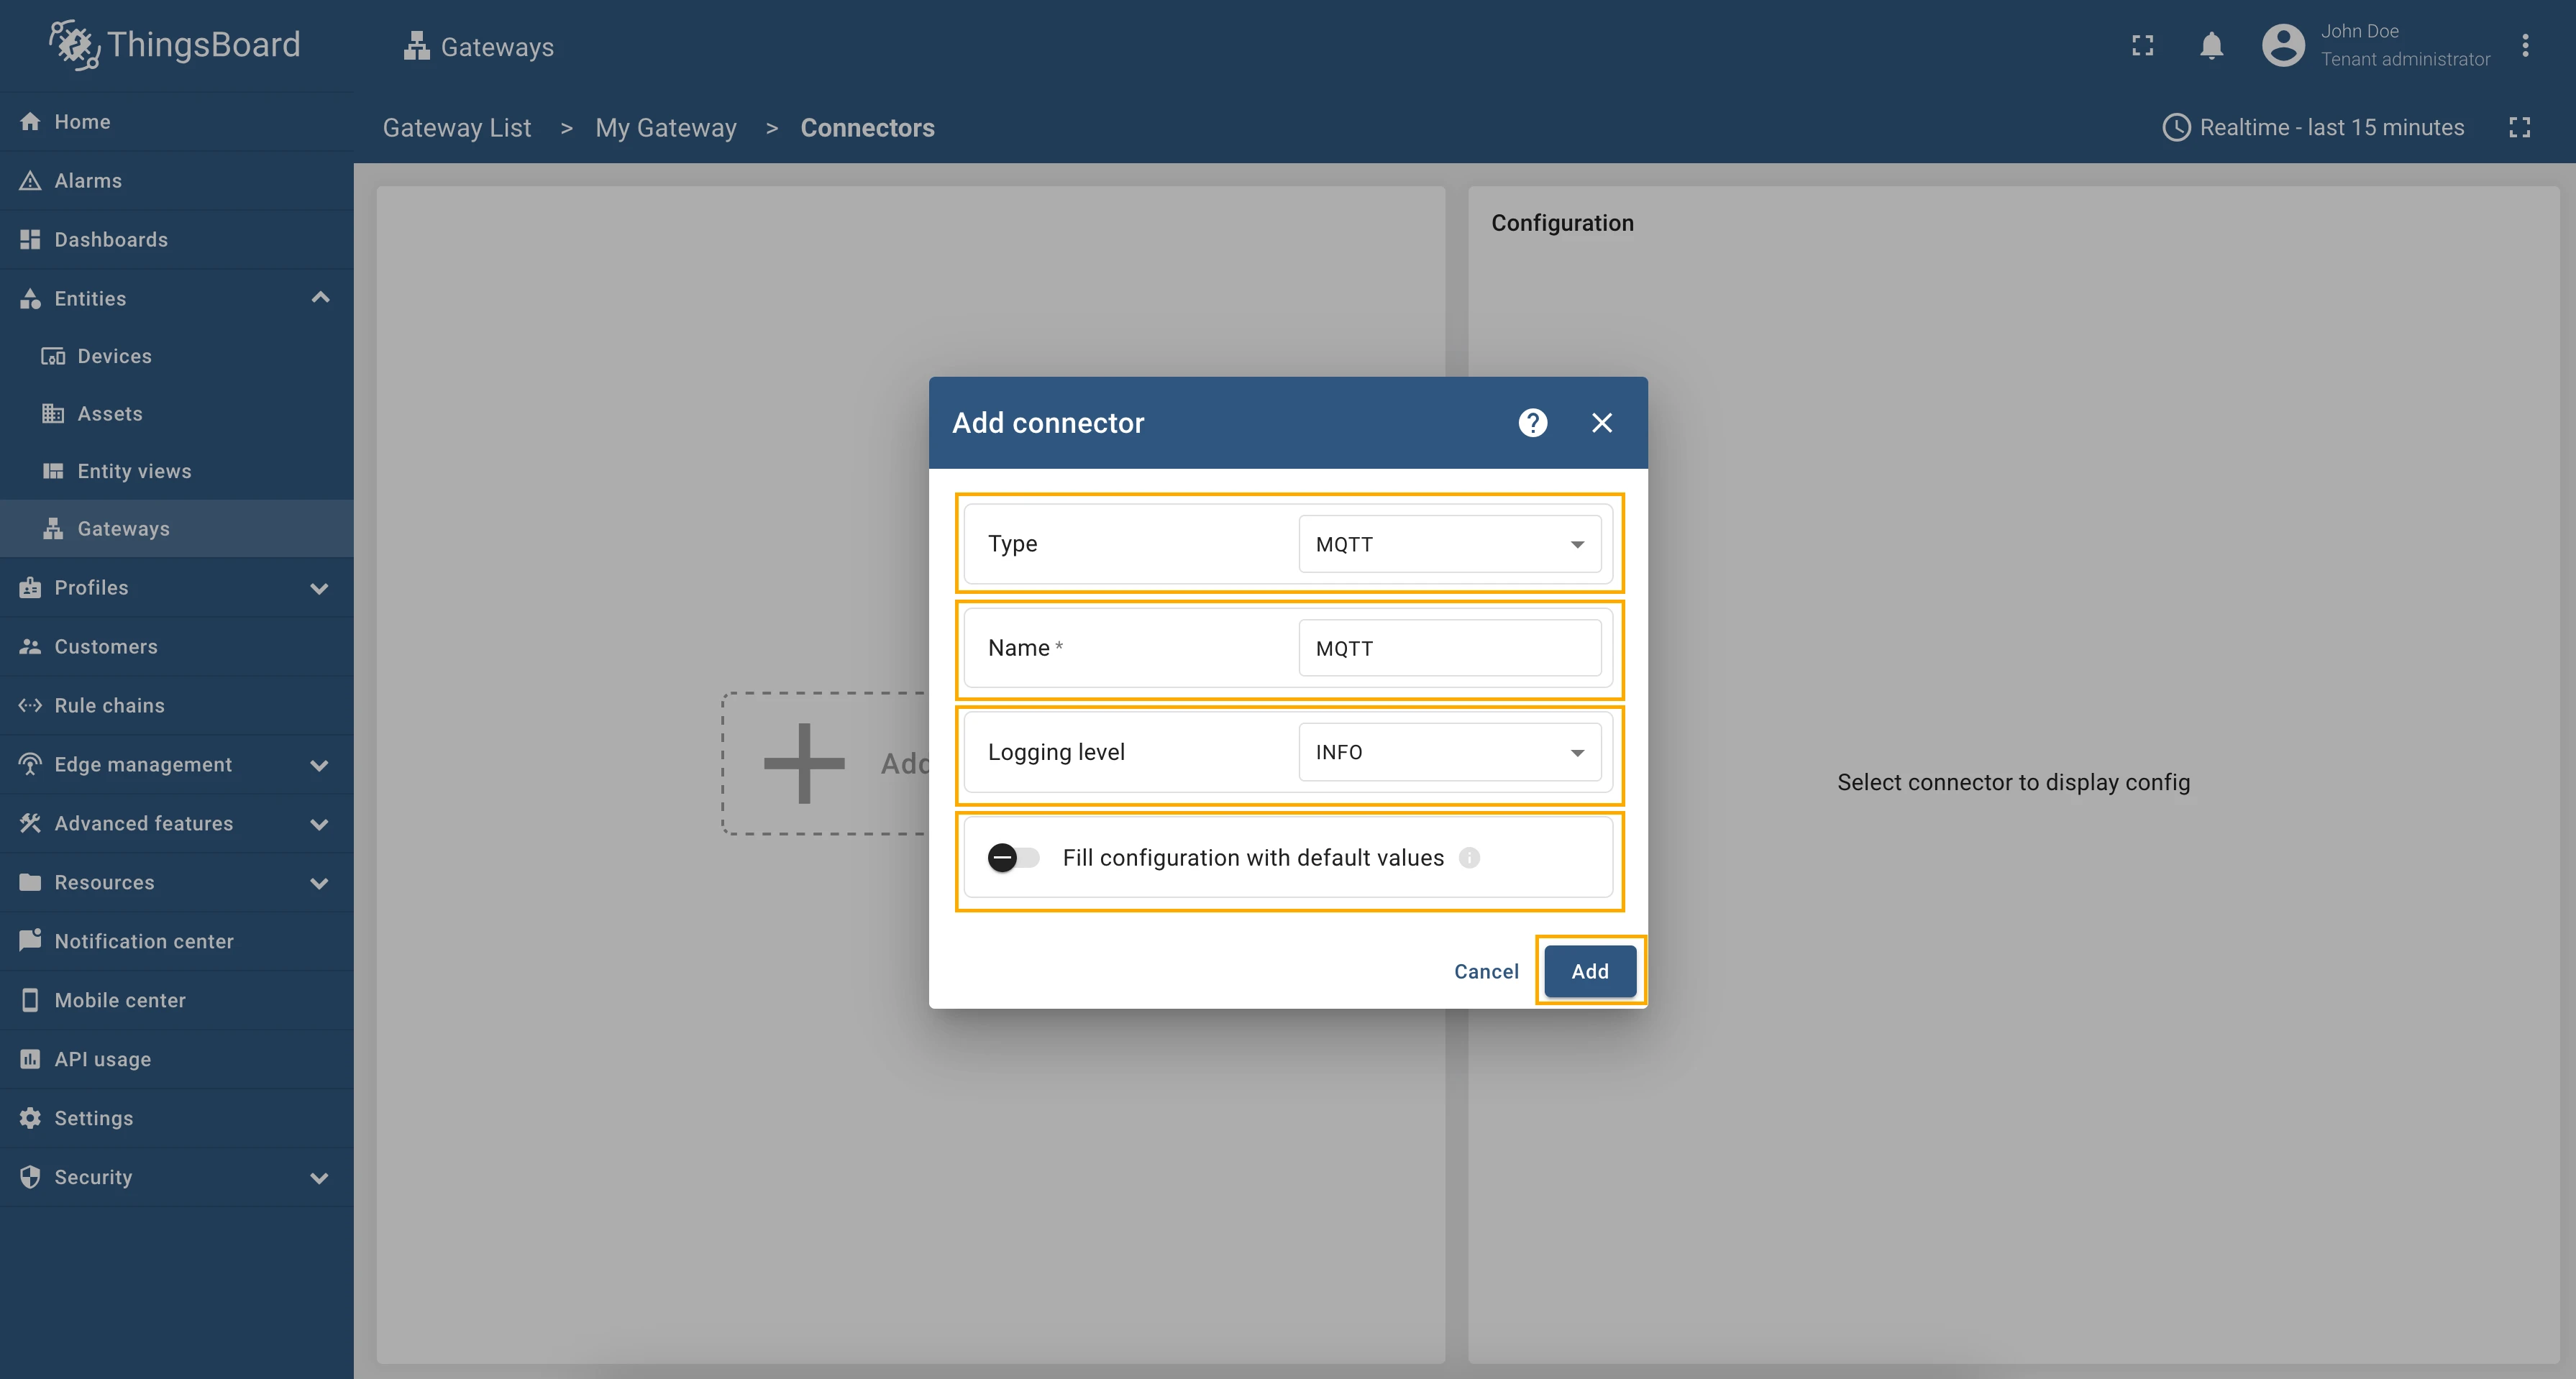
Choose MQTT connector type from the dropdown, fill in Name field, choose Logging level to INFO, disable Fill configuration with default values field and click on Add button.

-
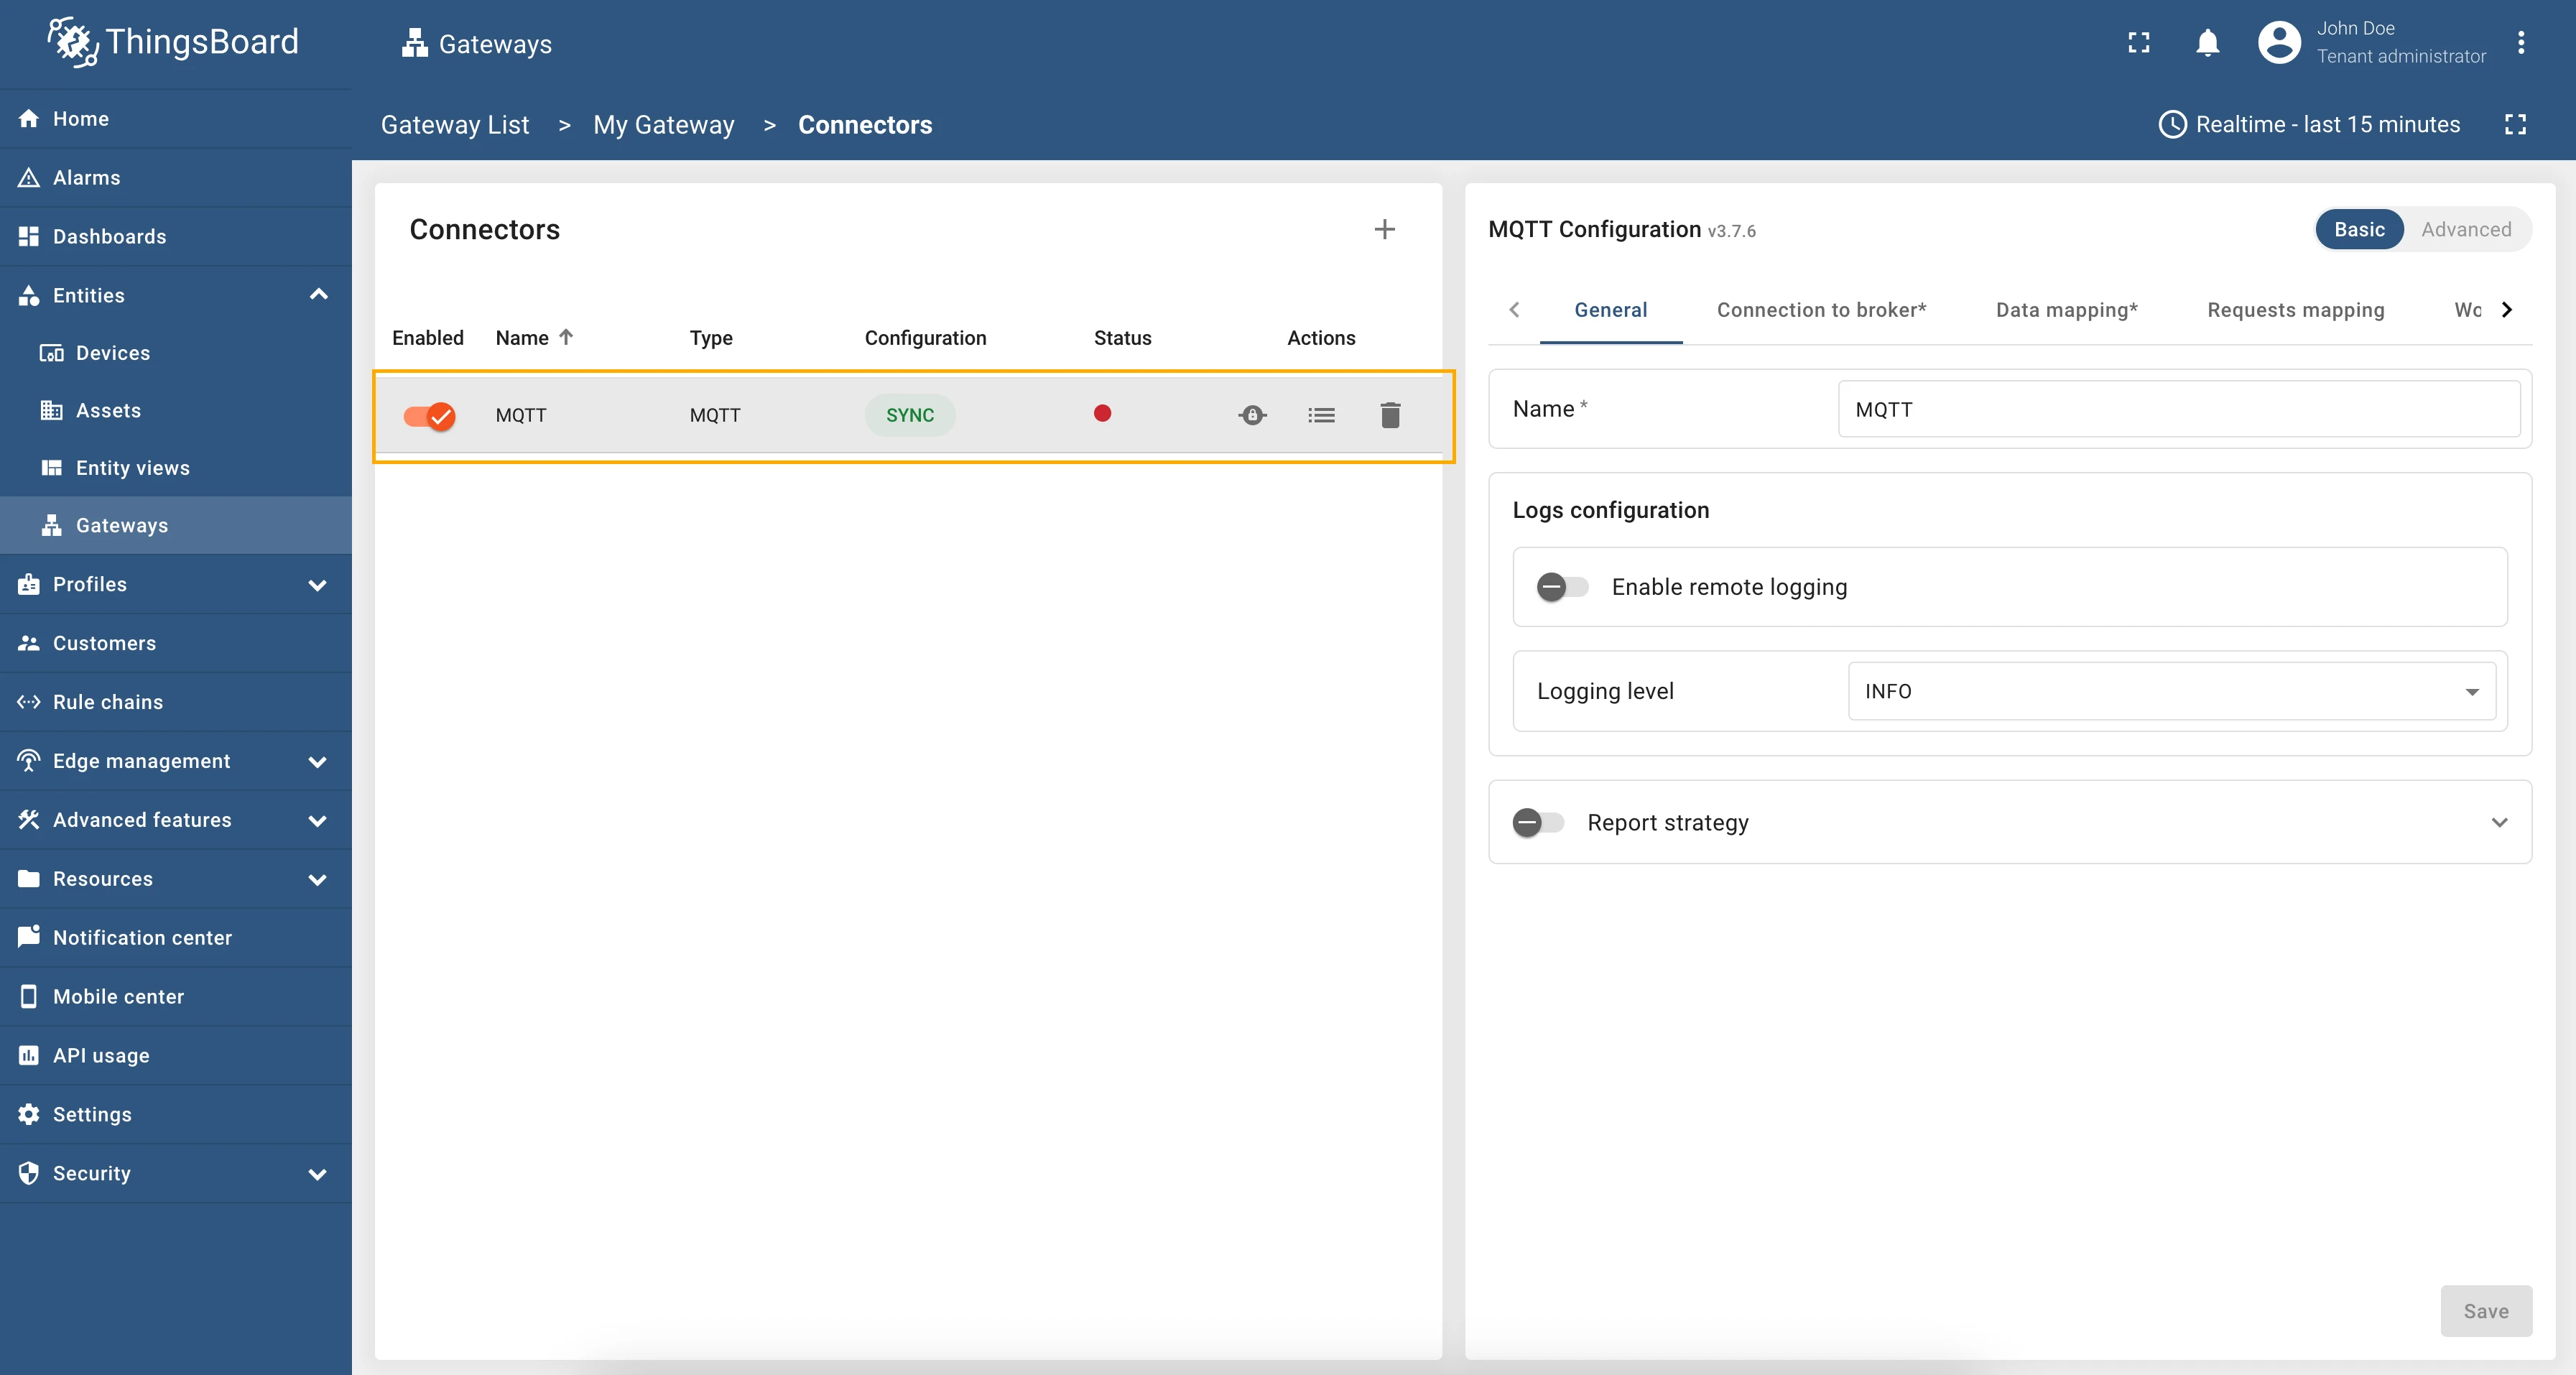
Connector created.


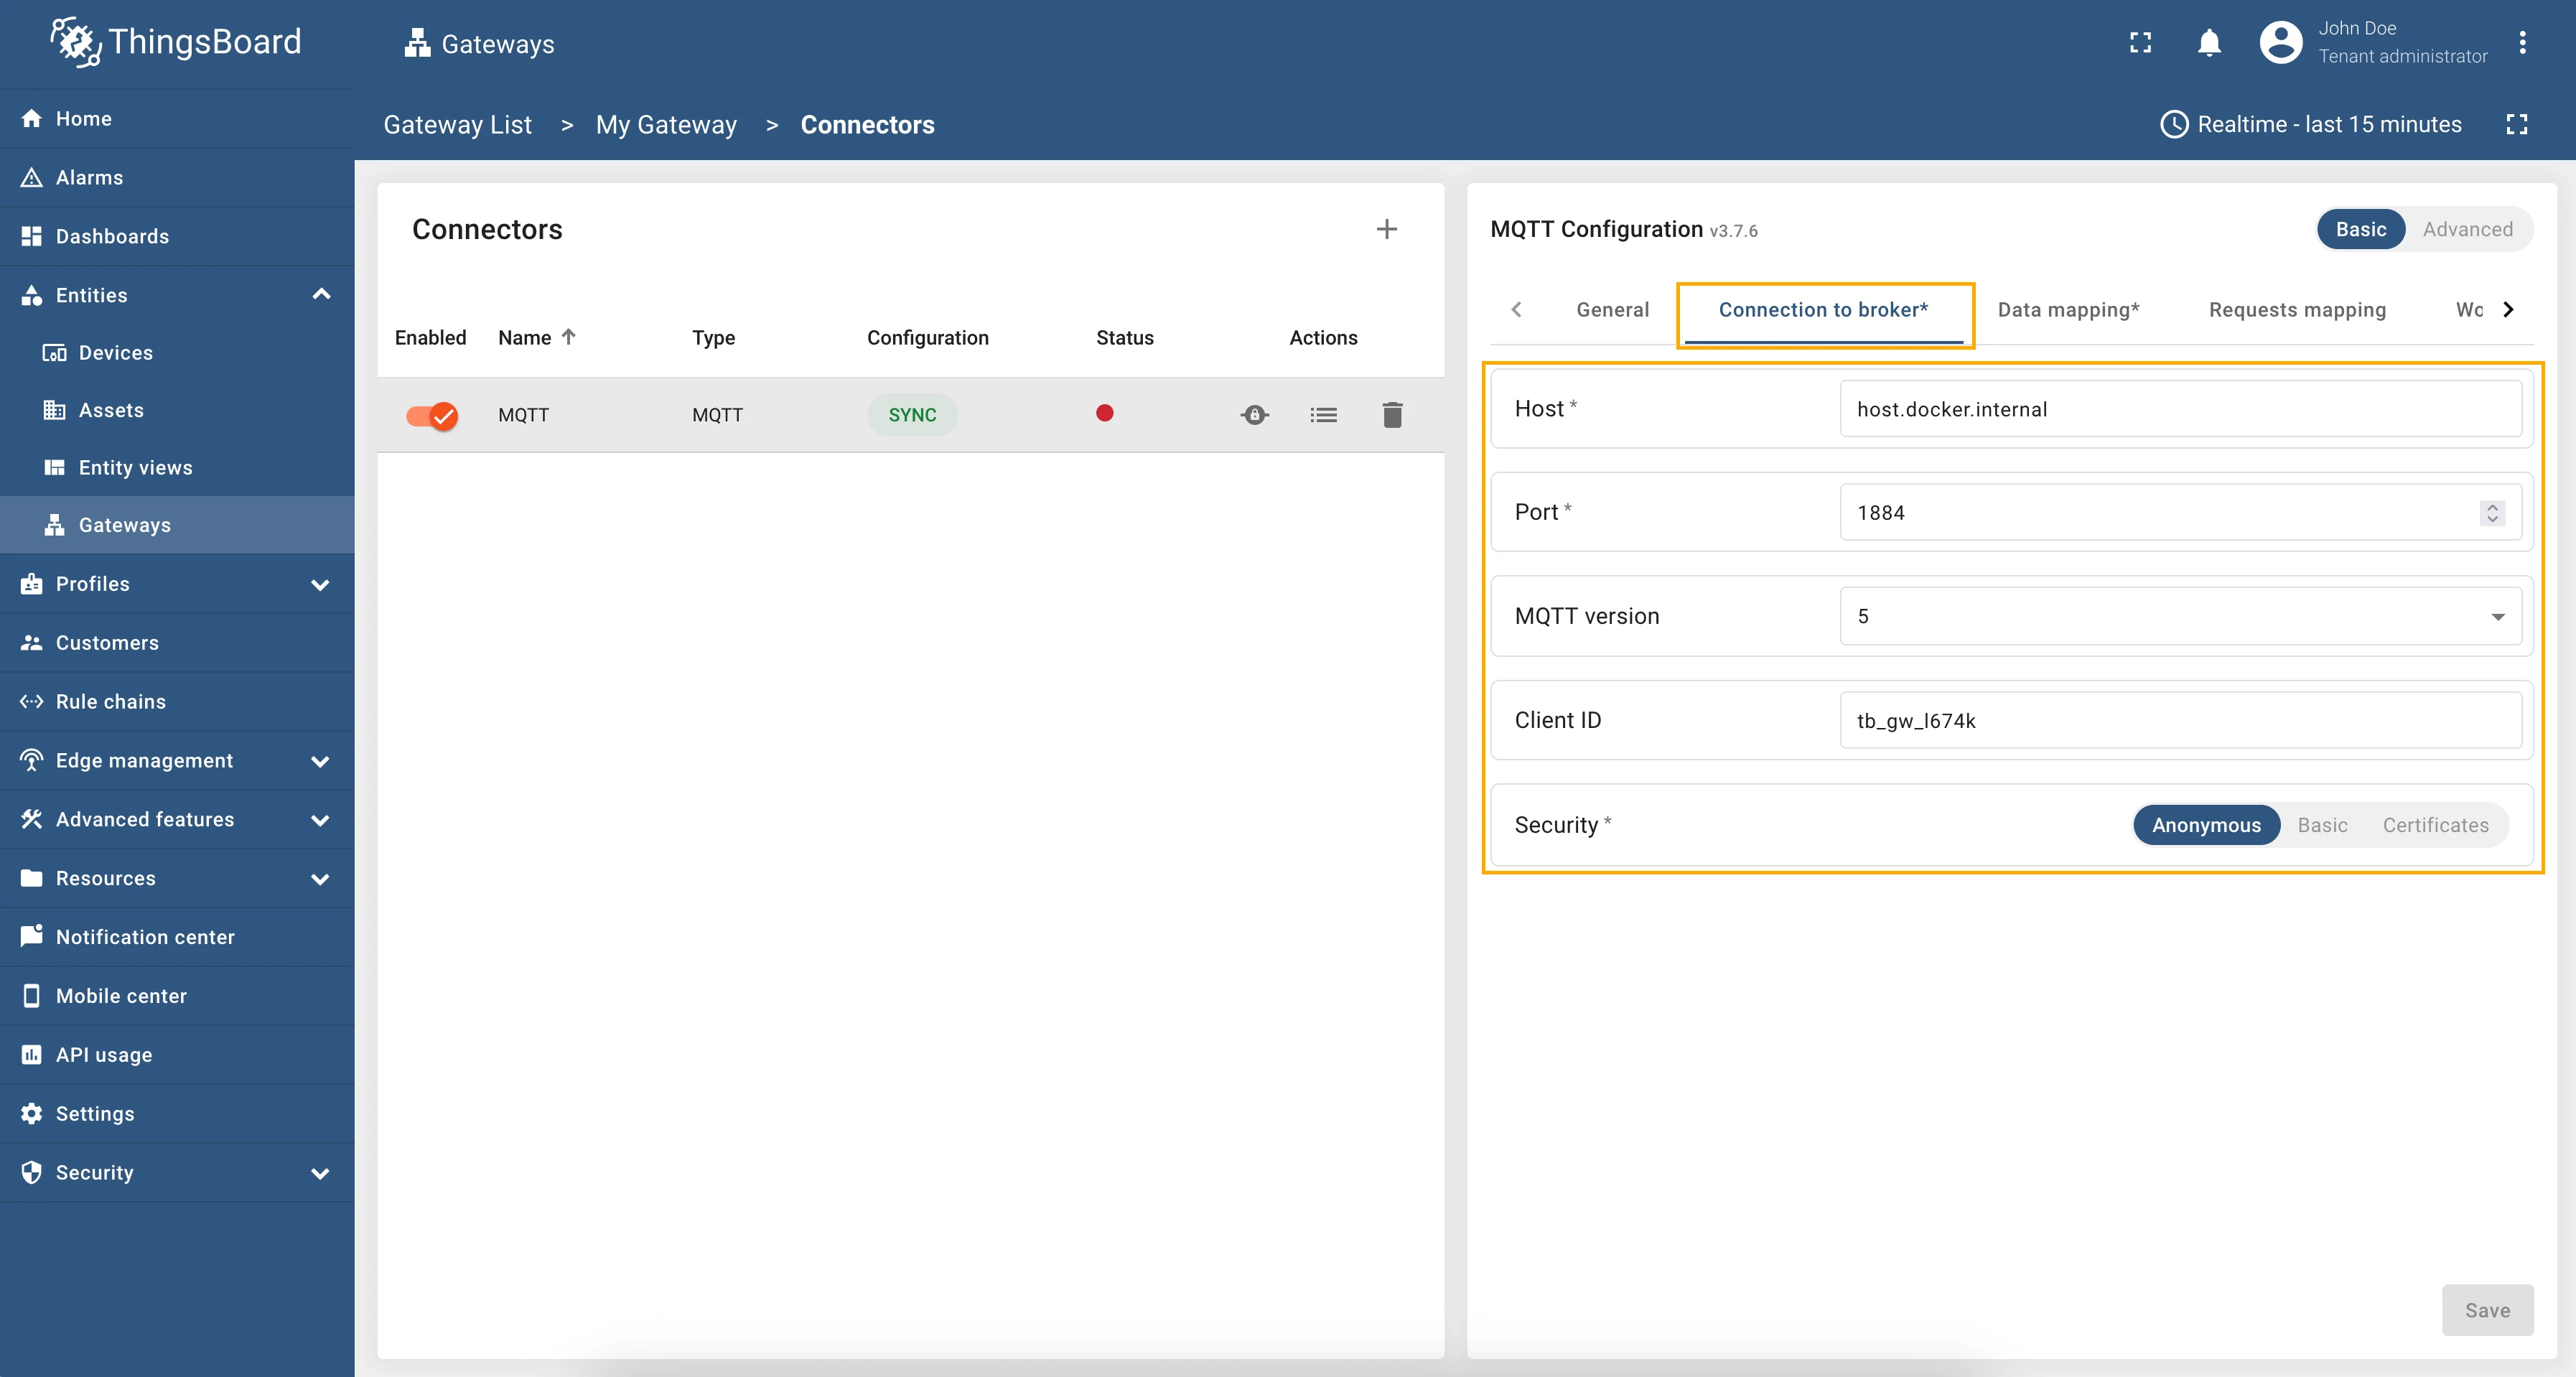
First, we need to configure the connection to the demo broker. Let’s start from the Connection to broker section. This section offers detailed connection configuration options and contains several important fields, including host, port, MQTT version, client ID, and security settings. The host field specifies the address of the broker, while the port field indicates the communication port. The MQTT version field ensures compatibility with the protocol version being used. The client ID uniquely identifies the client, and the security settings provides configuration for client authorization at MQTT Broker.
Fill in the following fields with values:
| Field name | Value |
|---|---|
| Host | host.docker.internal |
| Port | 1884 |
| MQTT version | 5 |
| Client ID | randomly generated |
| Security | Anonymous |
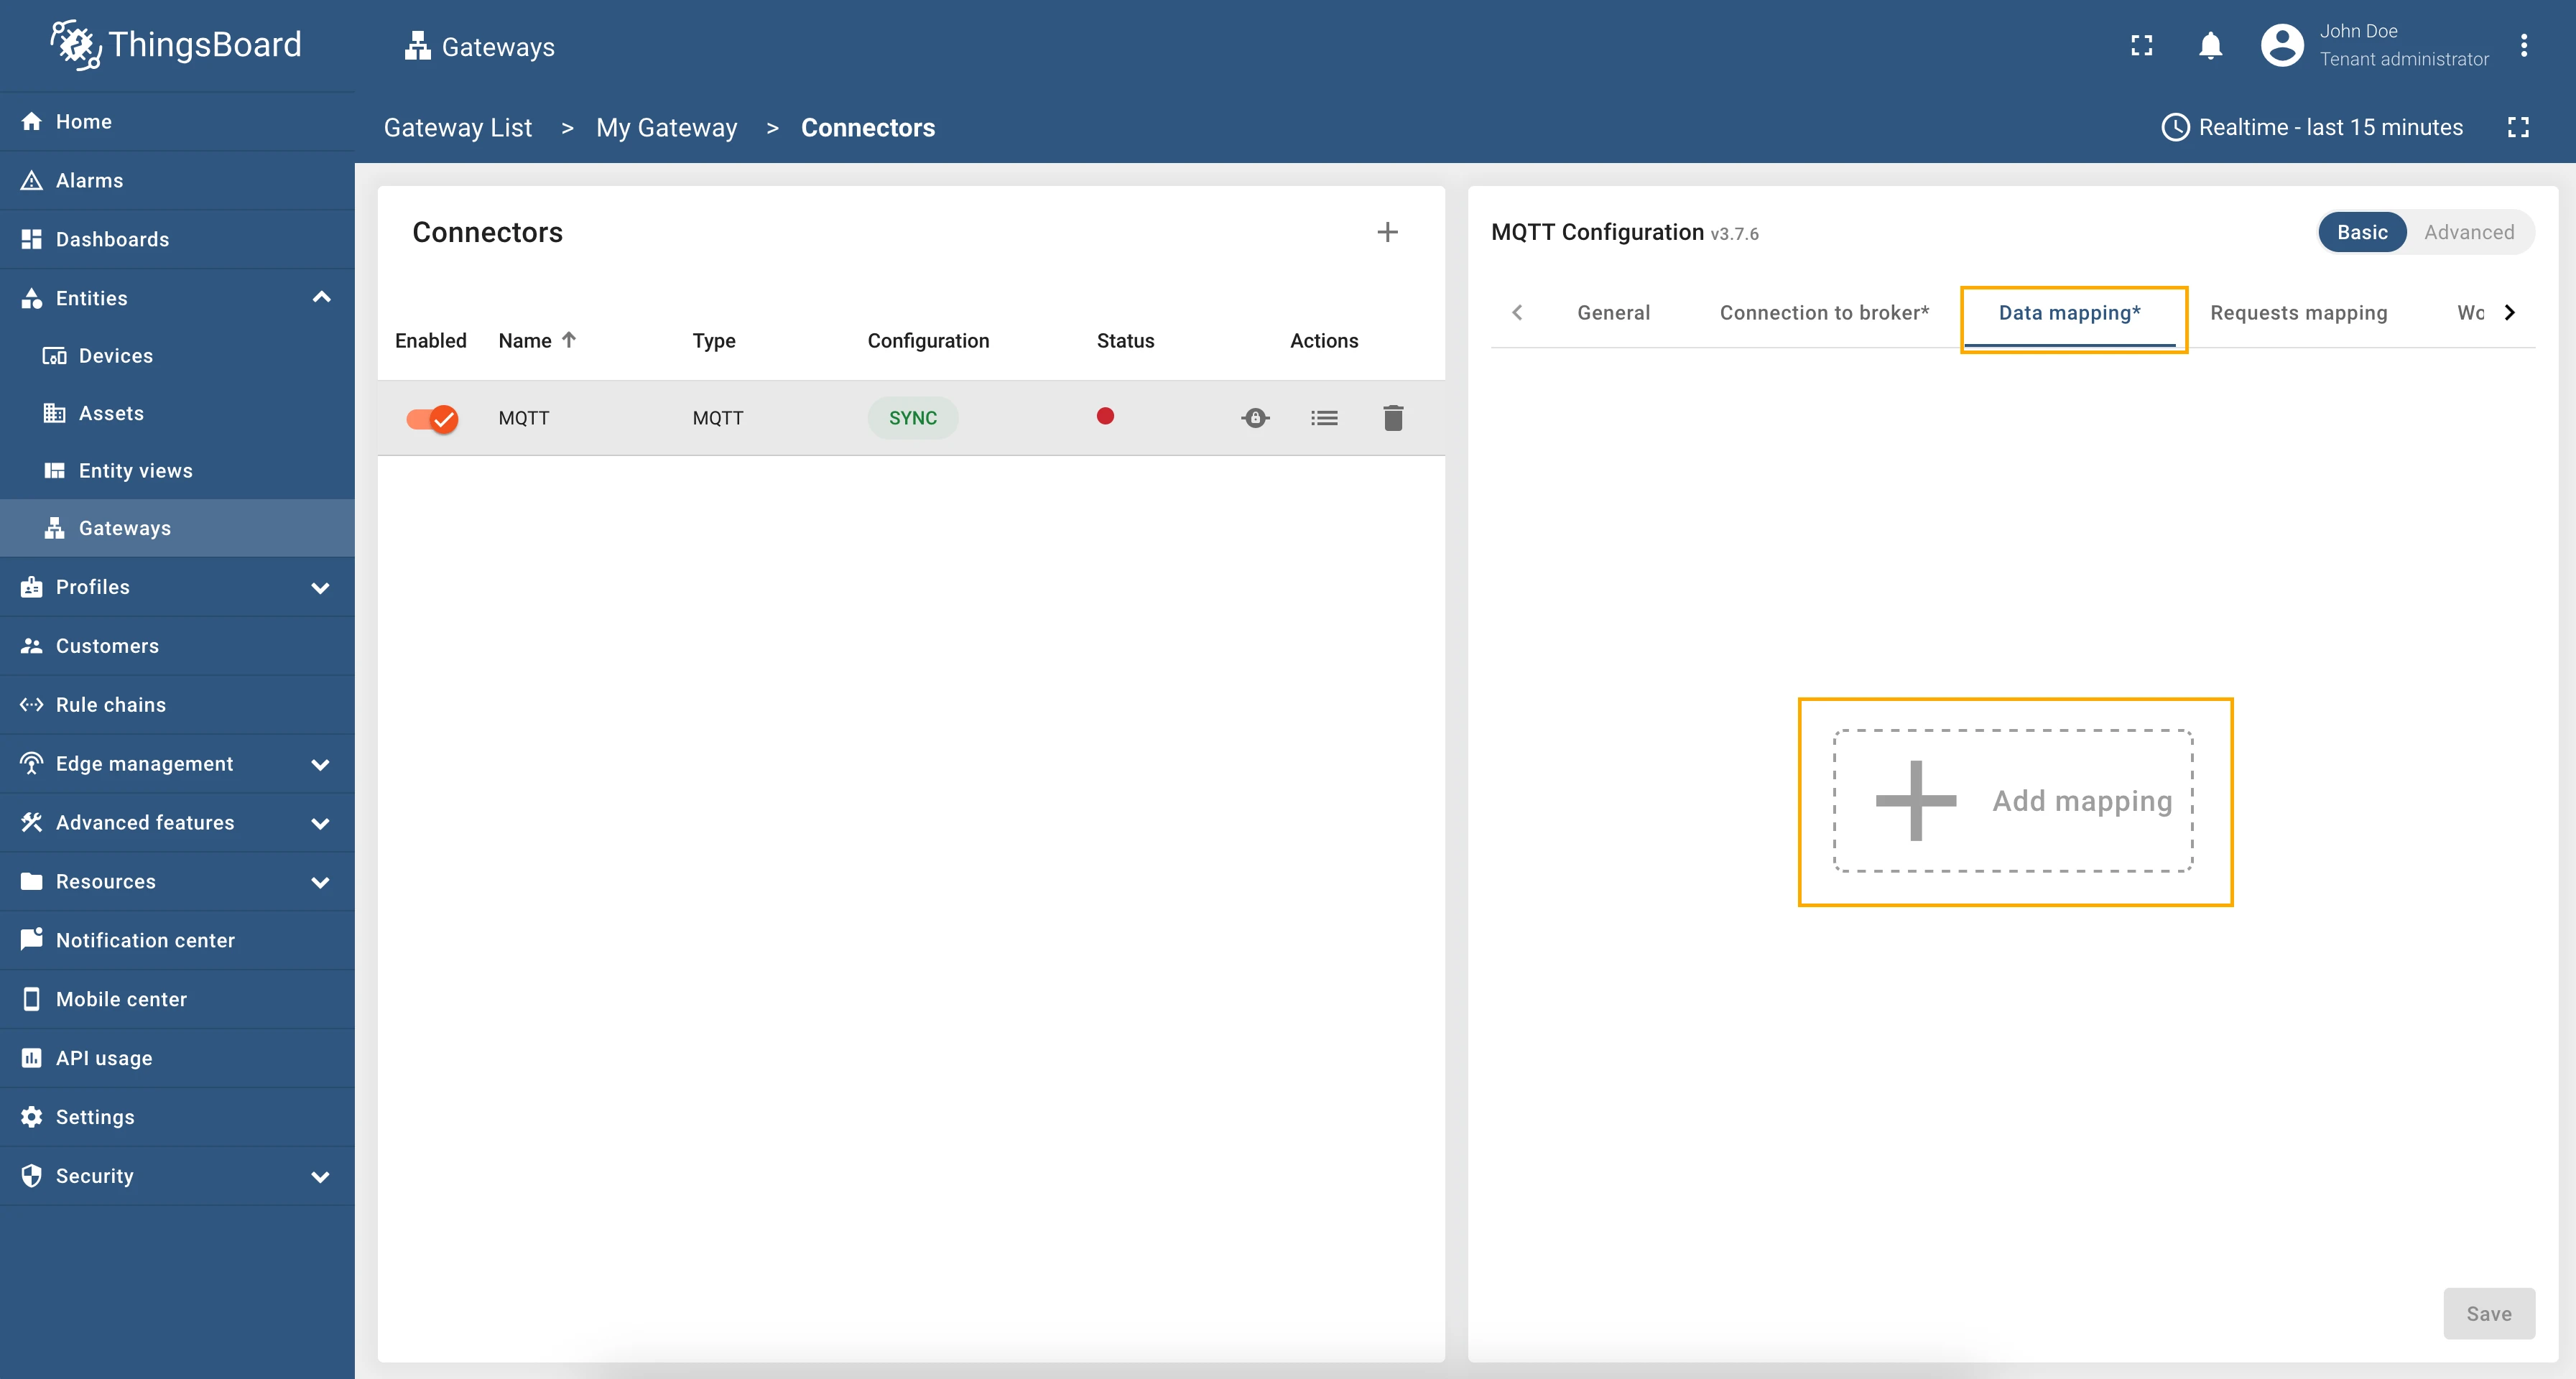
Now, we are ready to move to the Data mapping section. This configuration section contains an array of topics that the gateway will subscribe to after connecting to the broker, along with settings about processing incoming messages (converter).
Let’s configure data map using the following steps:
-
Click on Add mapping button
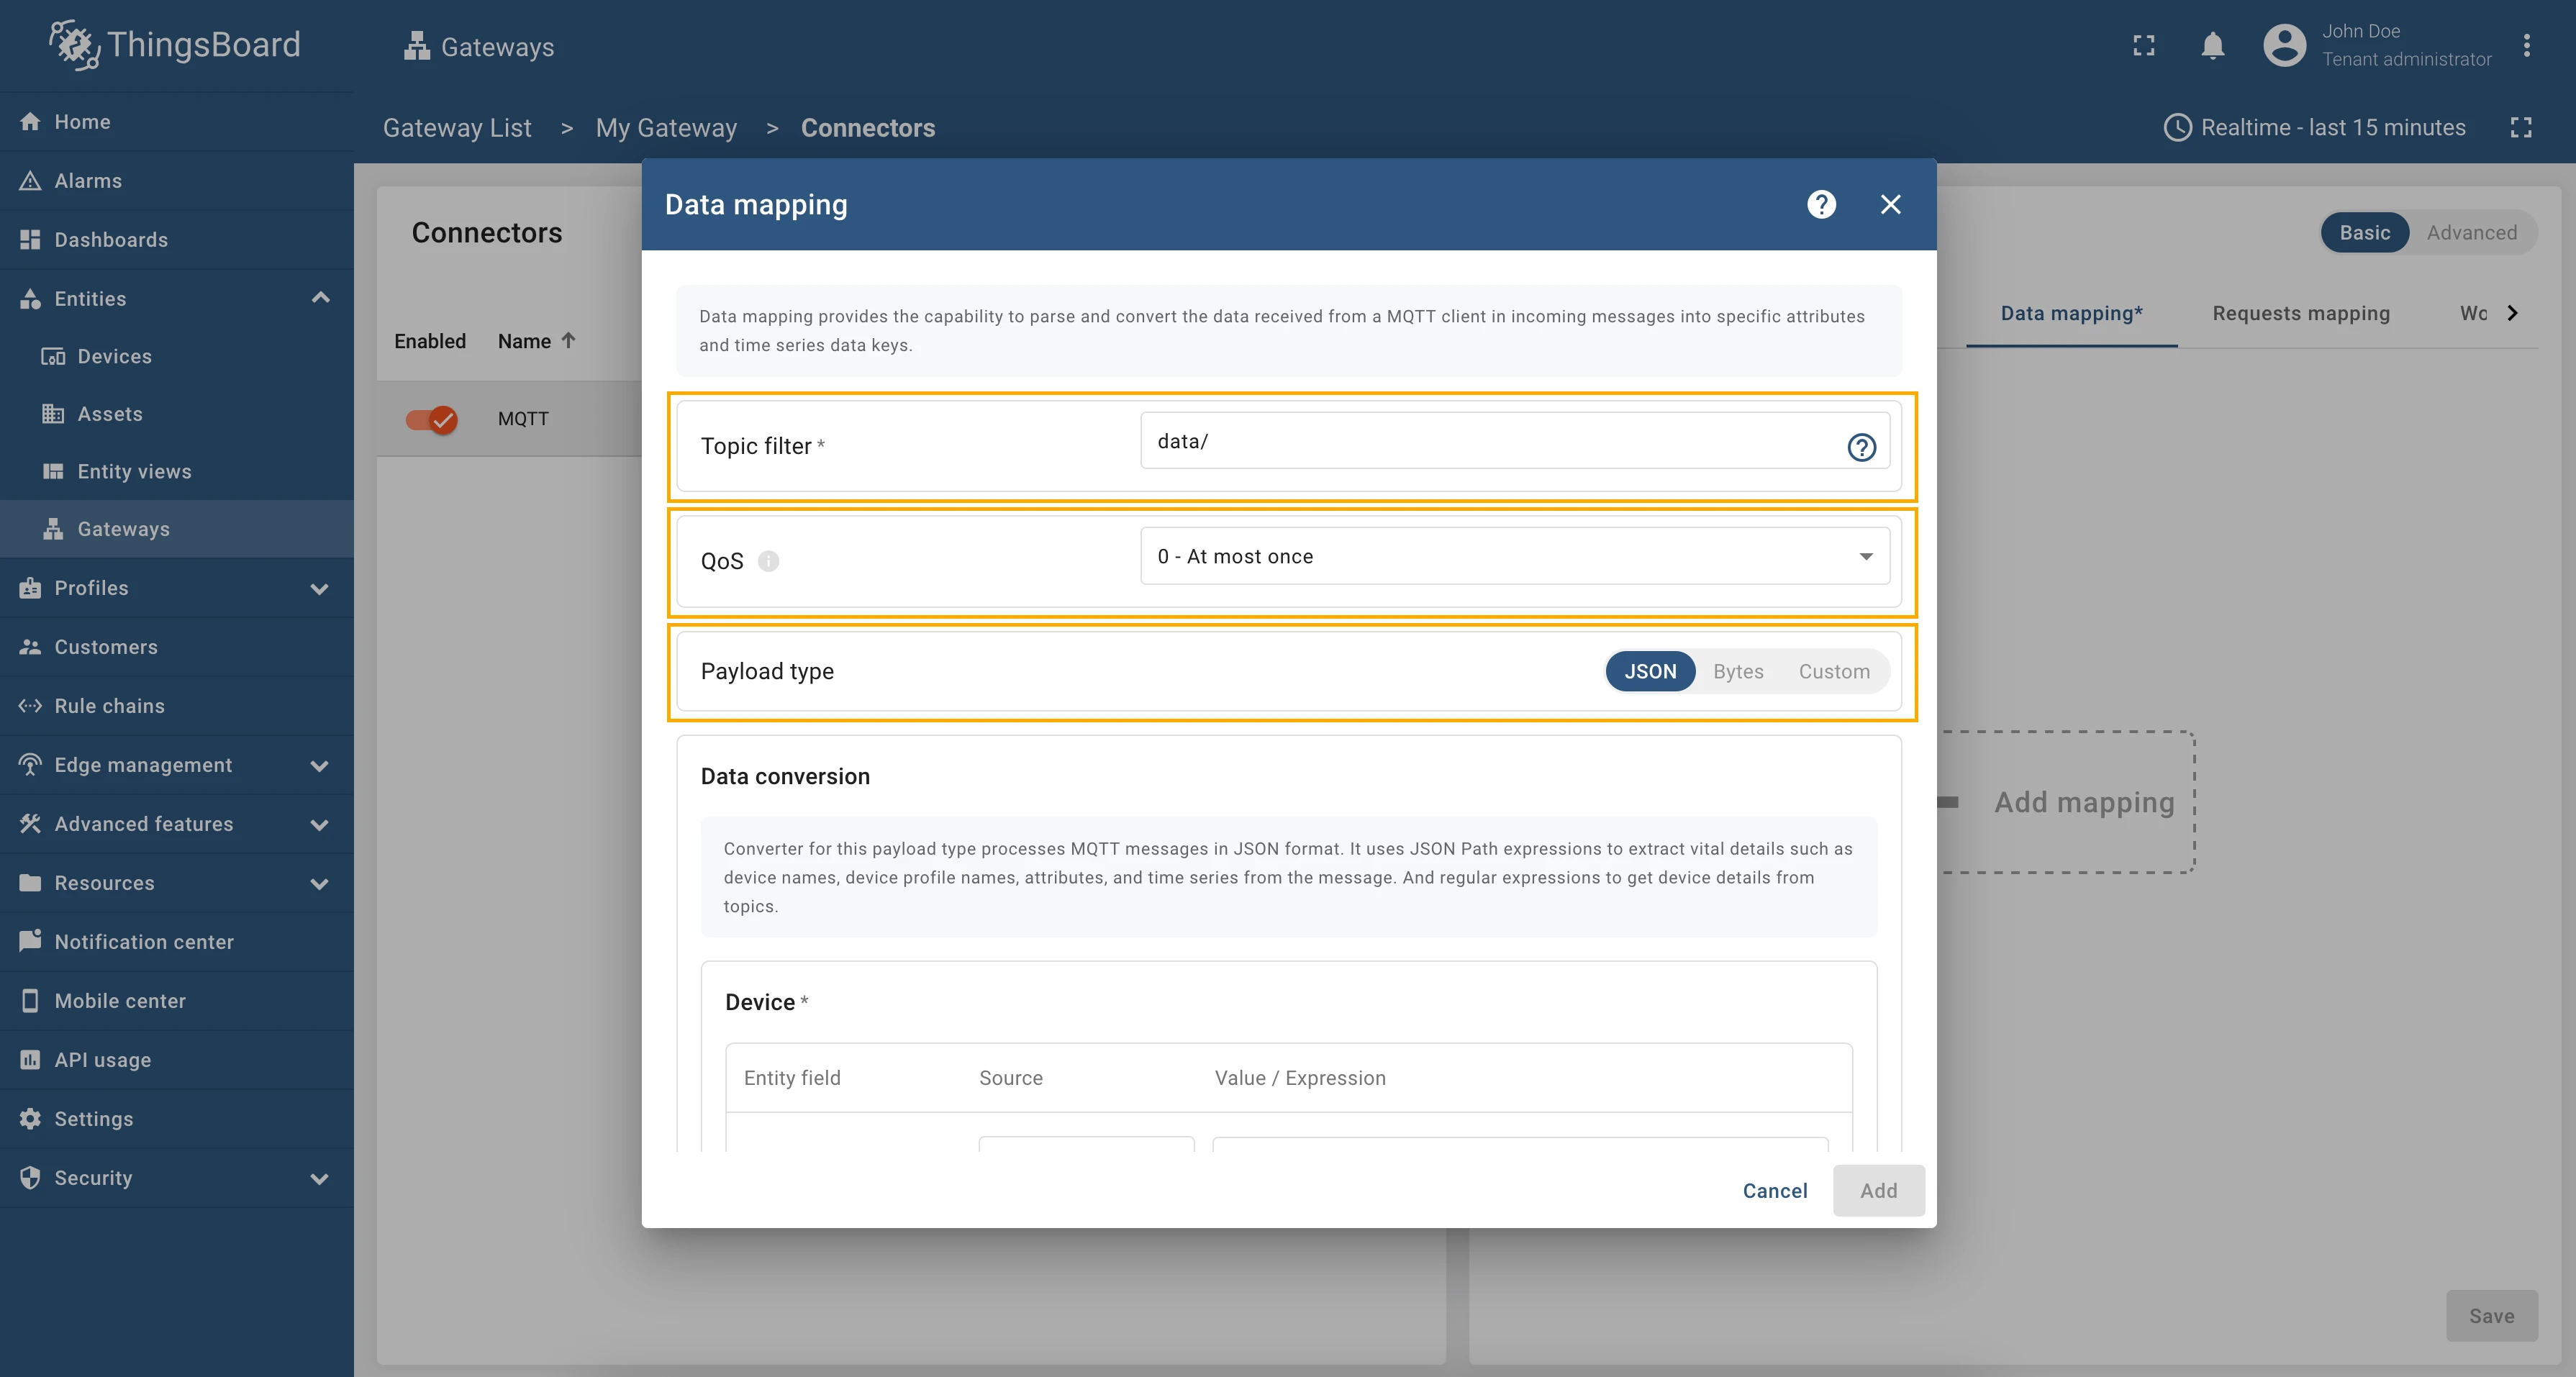
-
In the opened window, fill in the Topic filter field with “data/”, select the QoS field to 0 - At most once, and select the Payload type to JSON.
-
Scroll down to Data conversion section:
-
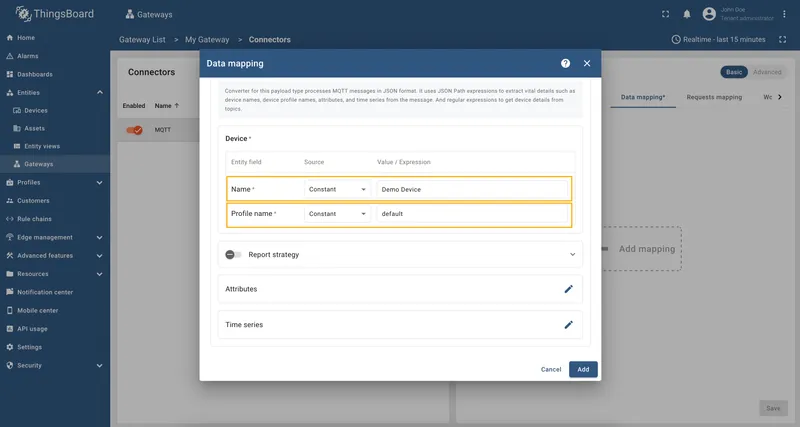
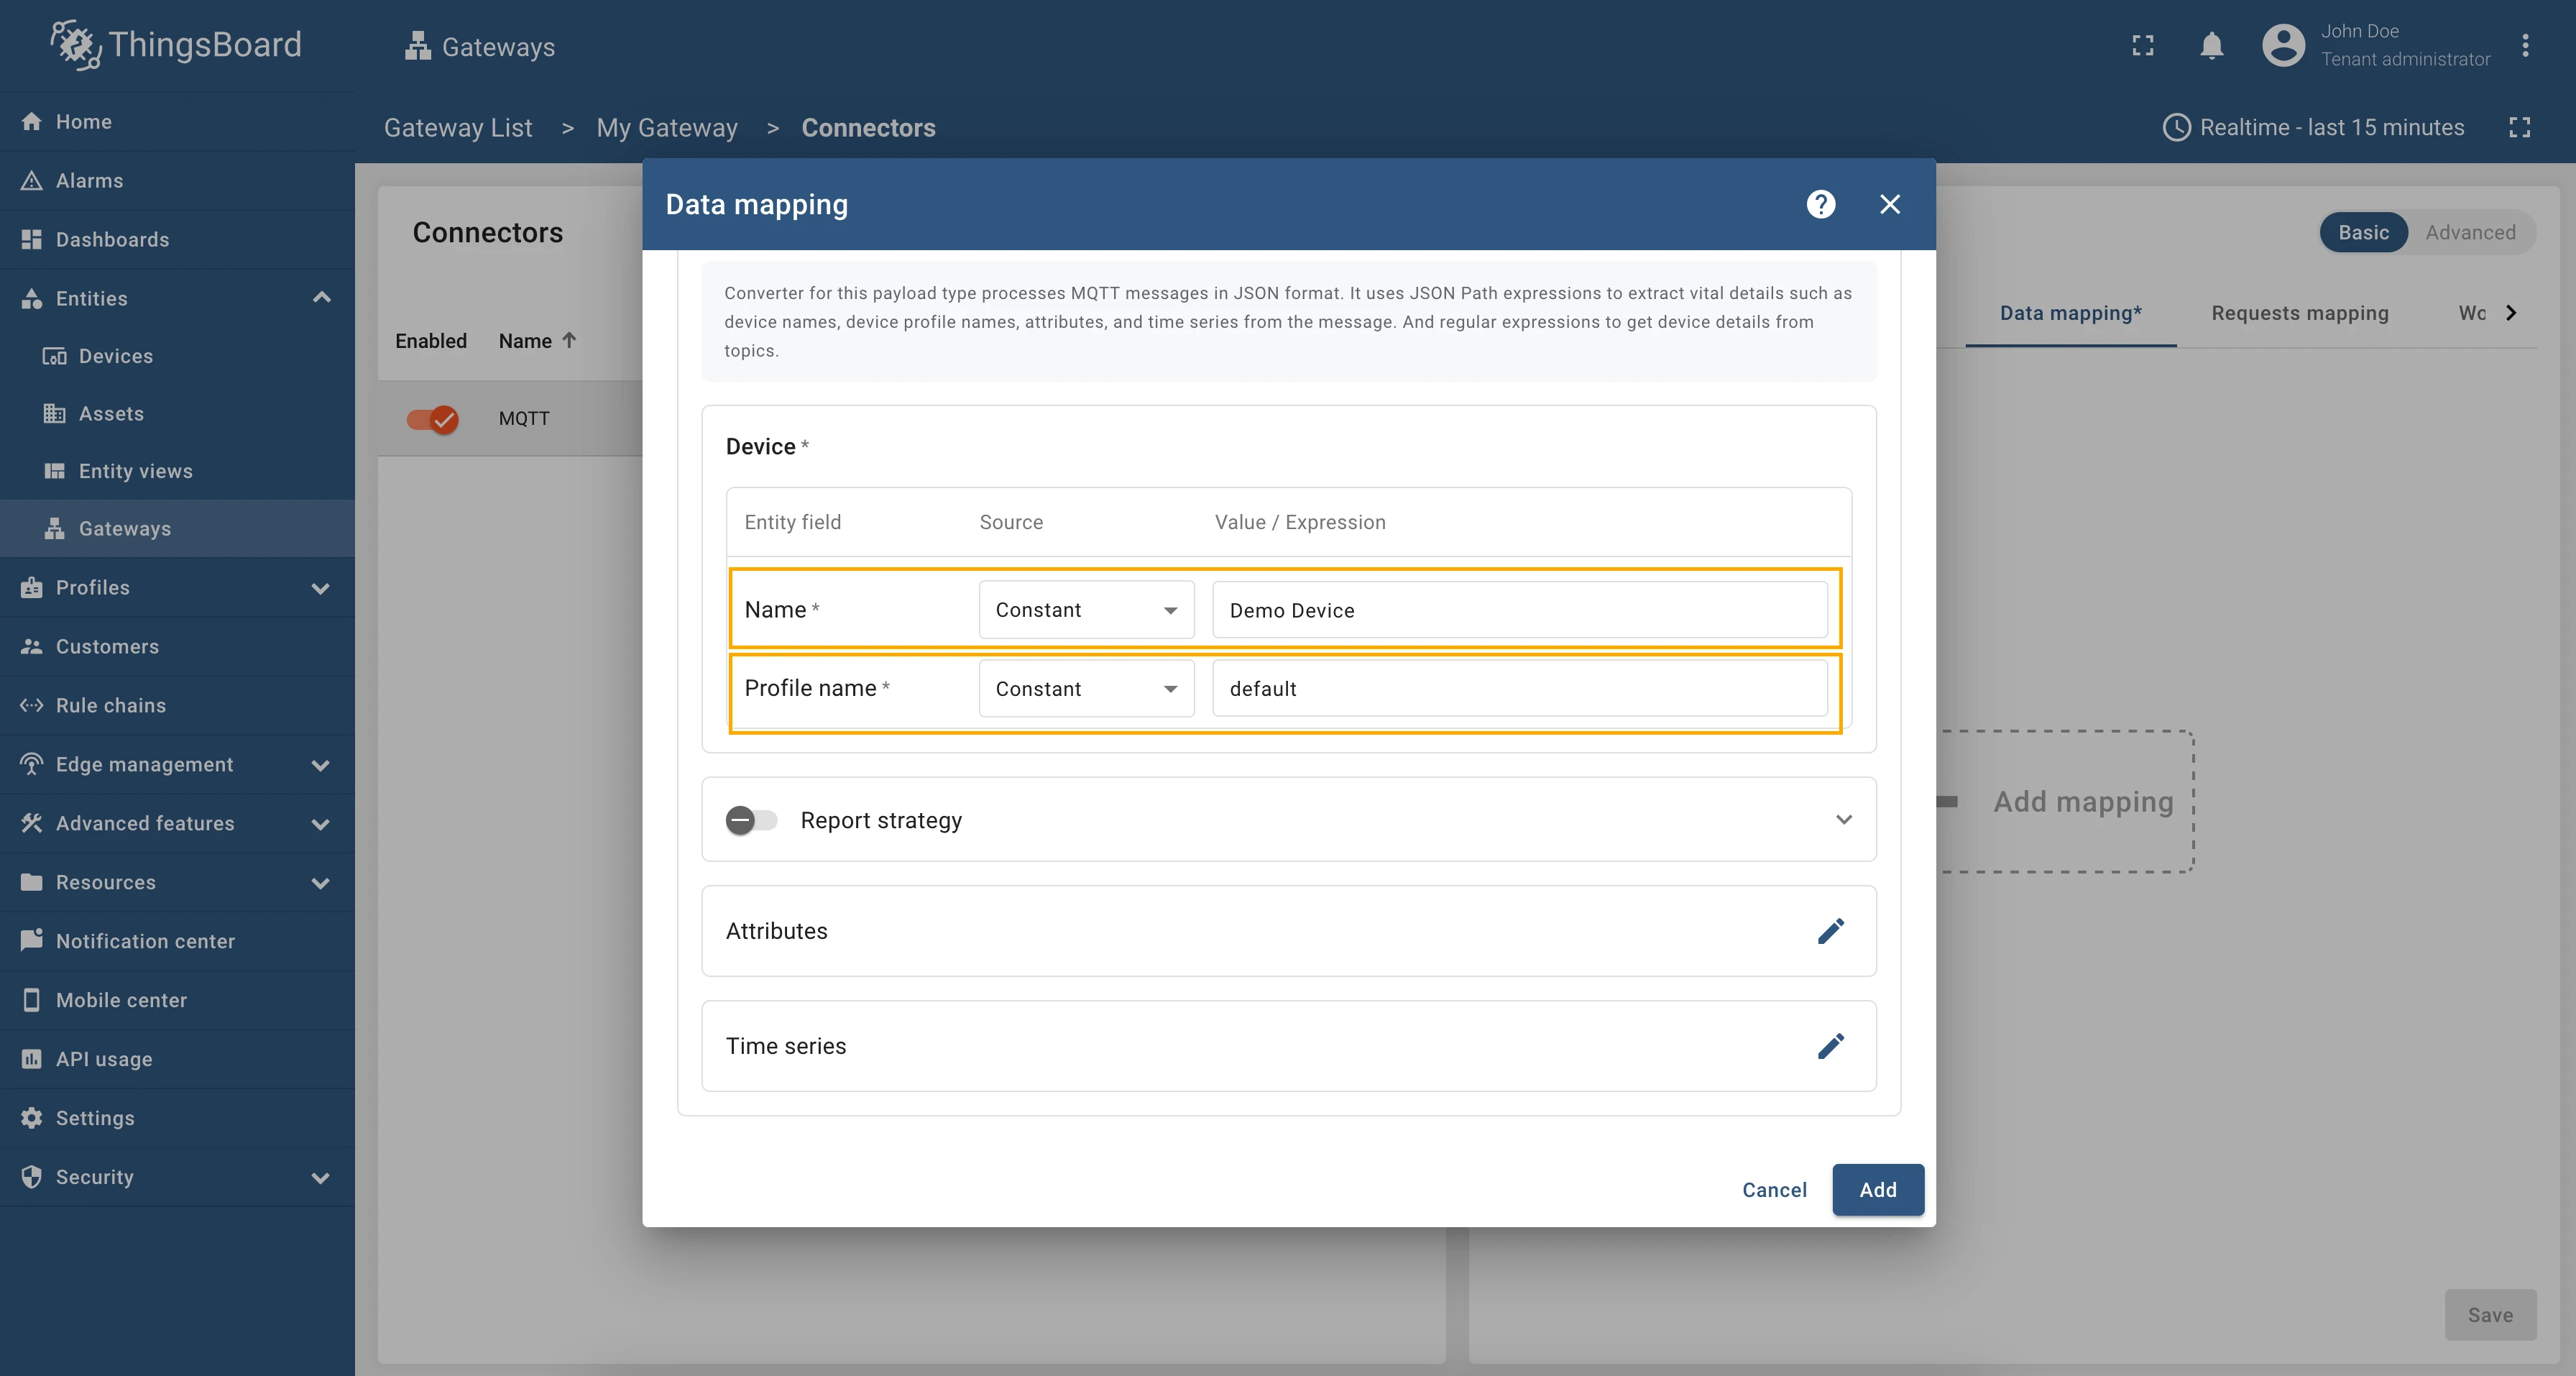
For Device subsection use the following options/values:
-
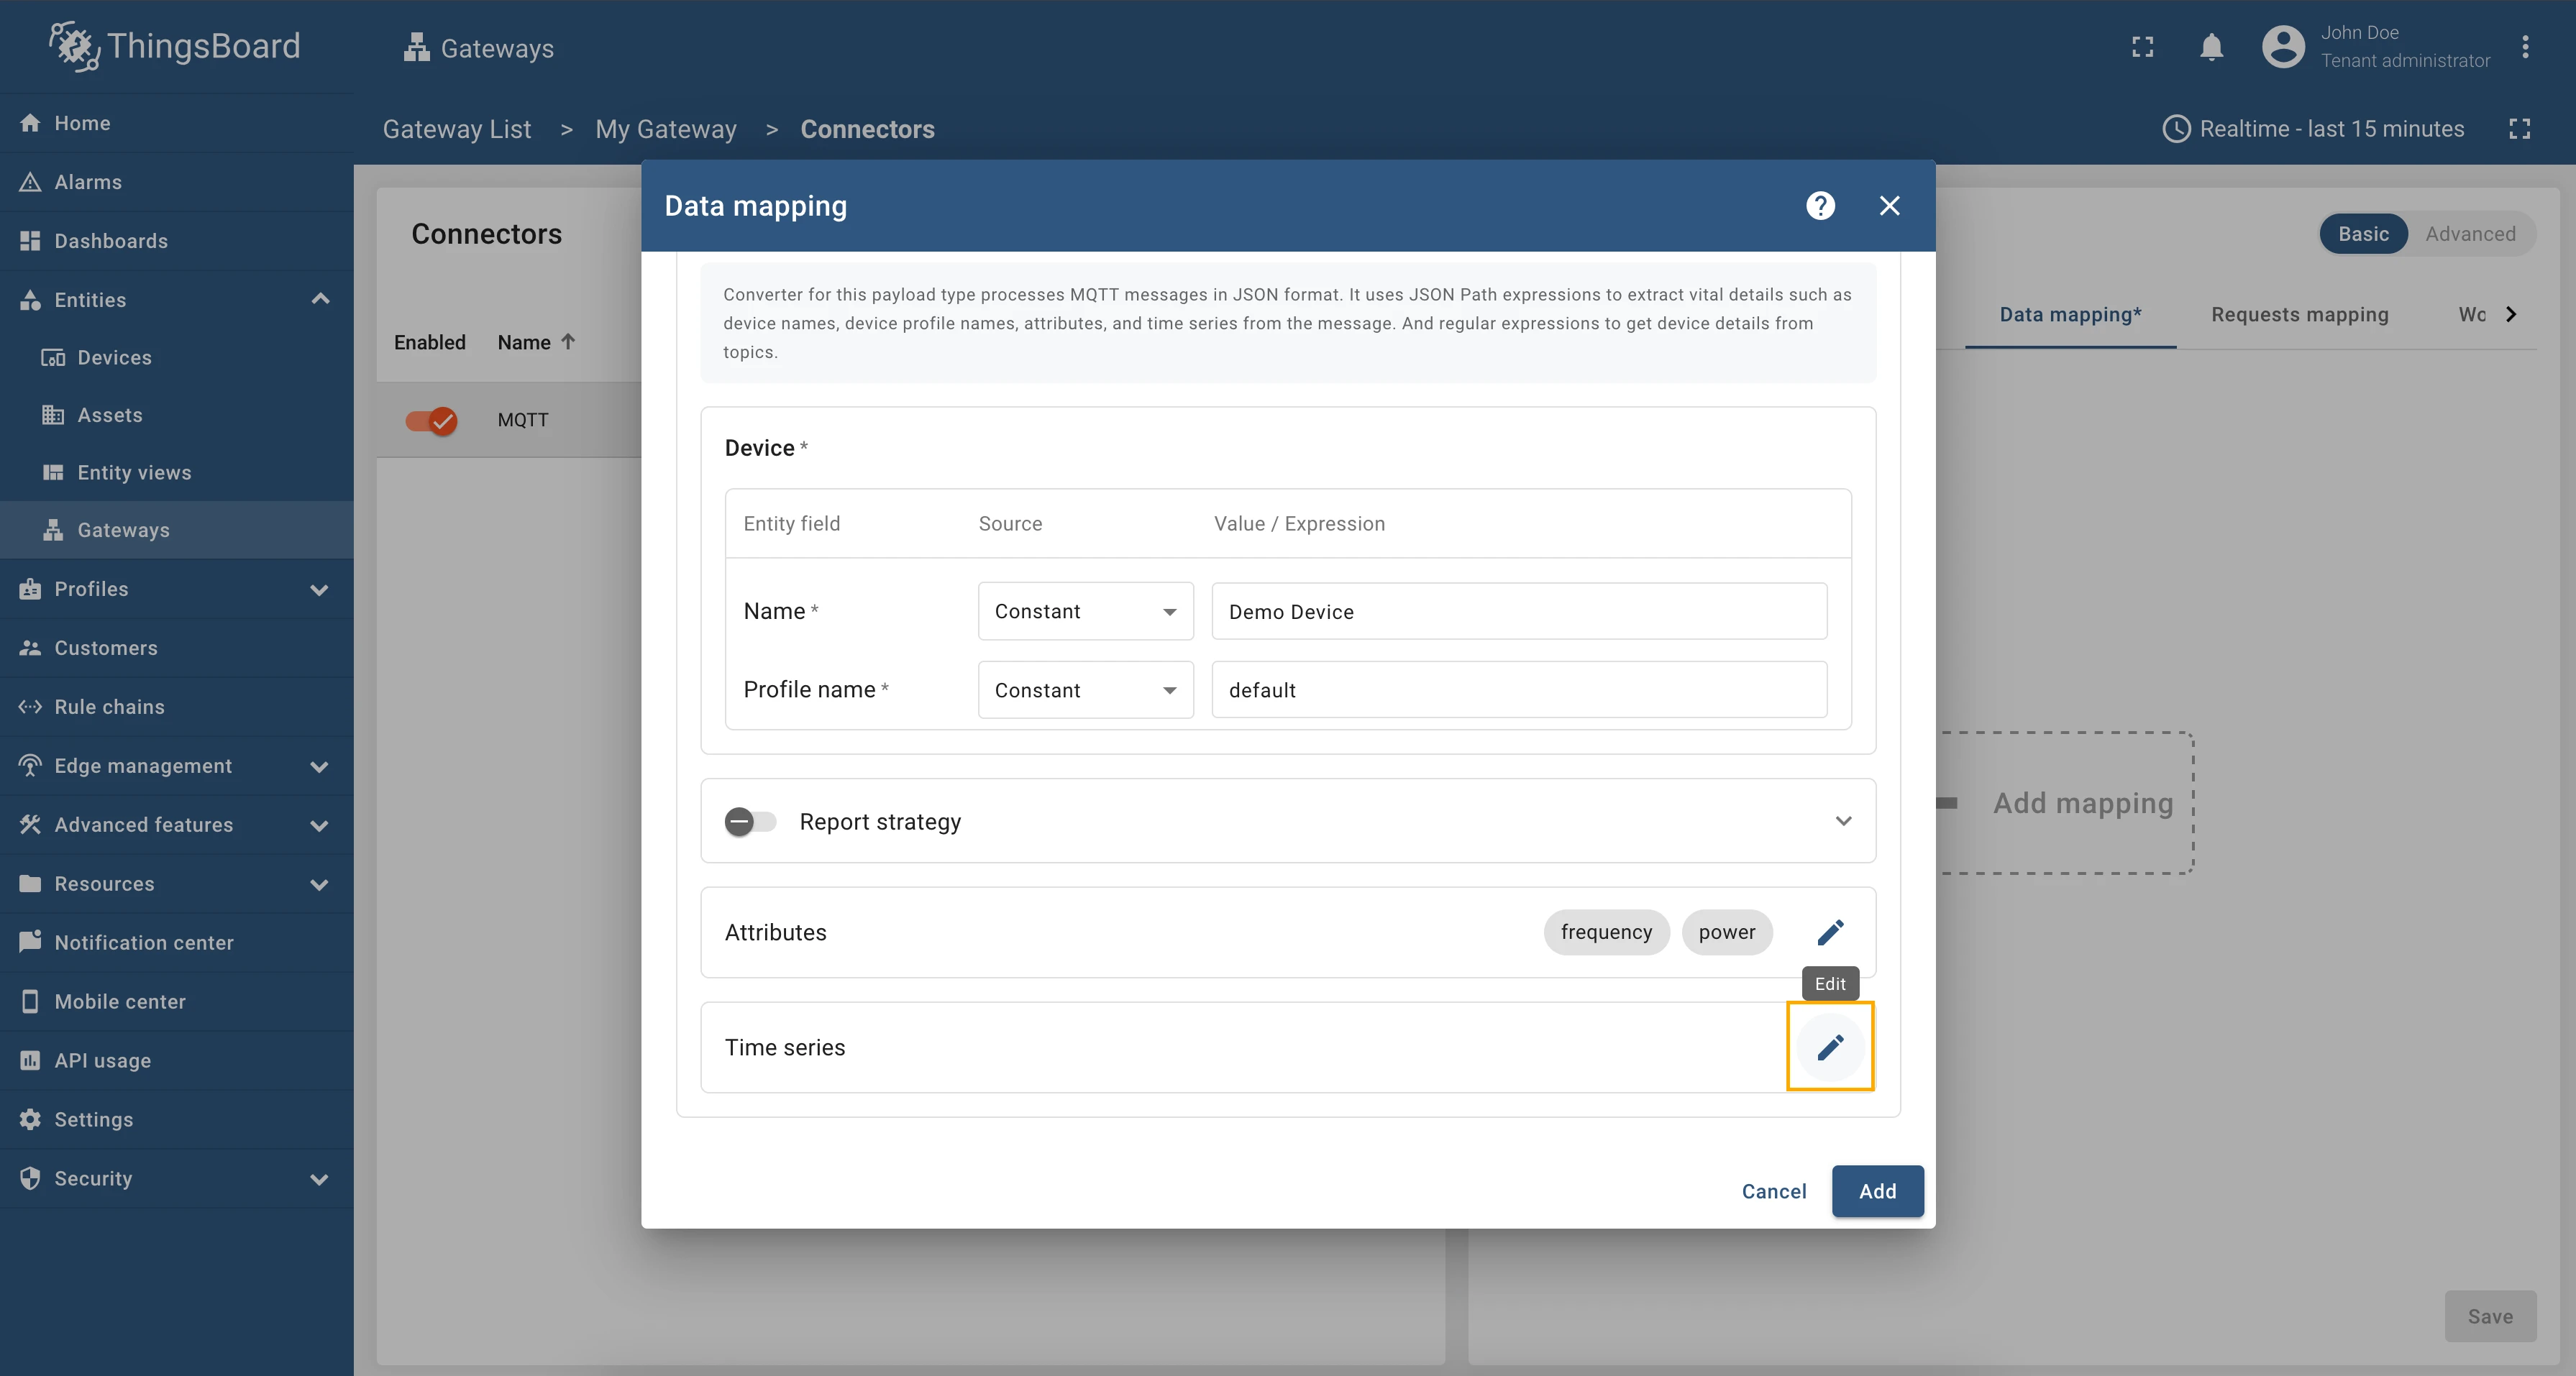
In the Name row, select Constant in the Source dropdown field, fill in the Value / Expression field with the “Device Demo” value.
-
In the Profile name row, select Constant in the Source dropdown field, fill in the Value / Expression field with the “default” value.
-
-
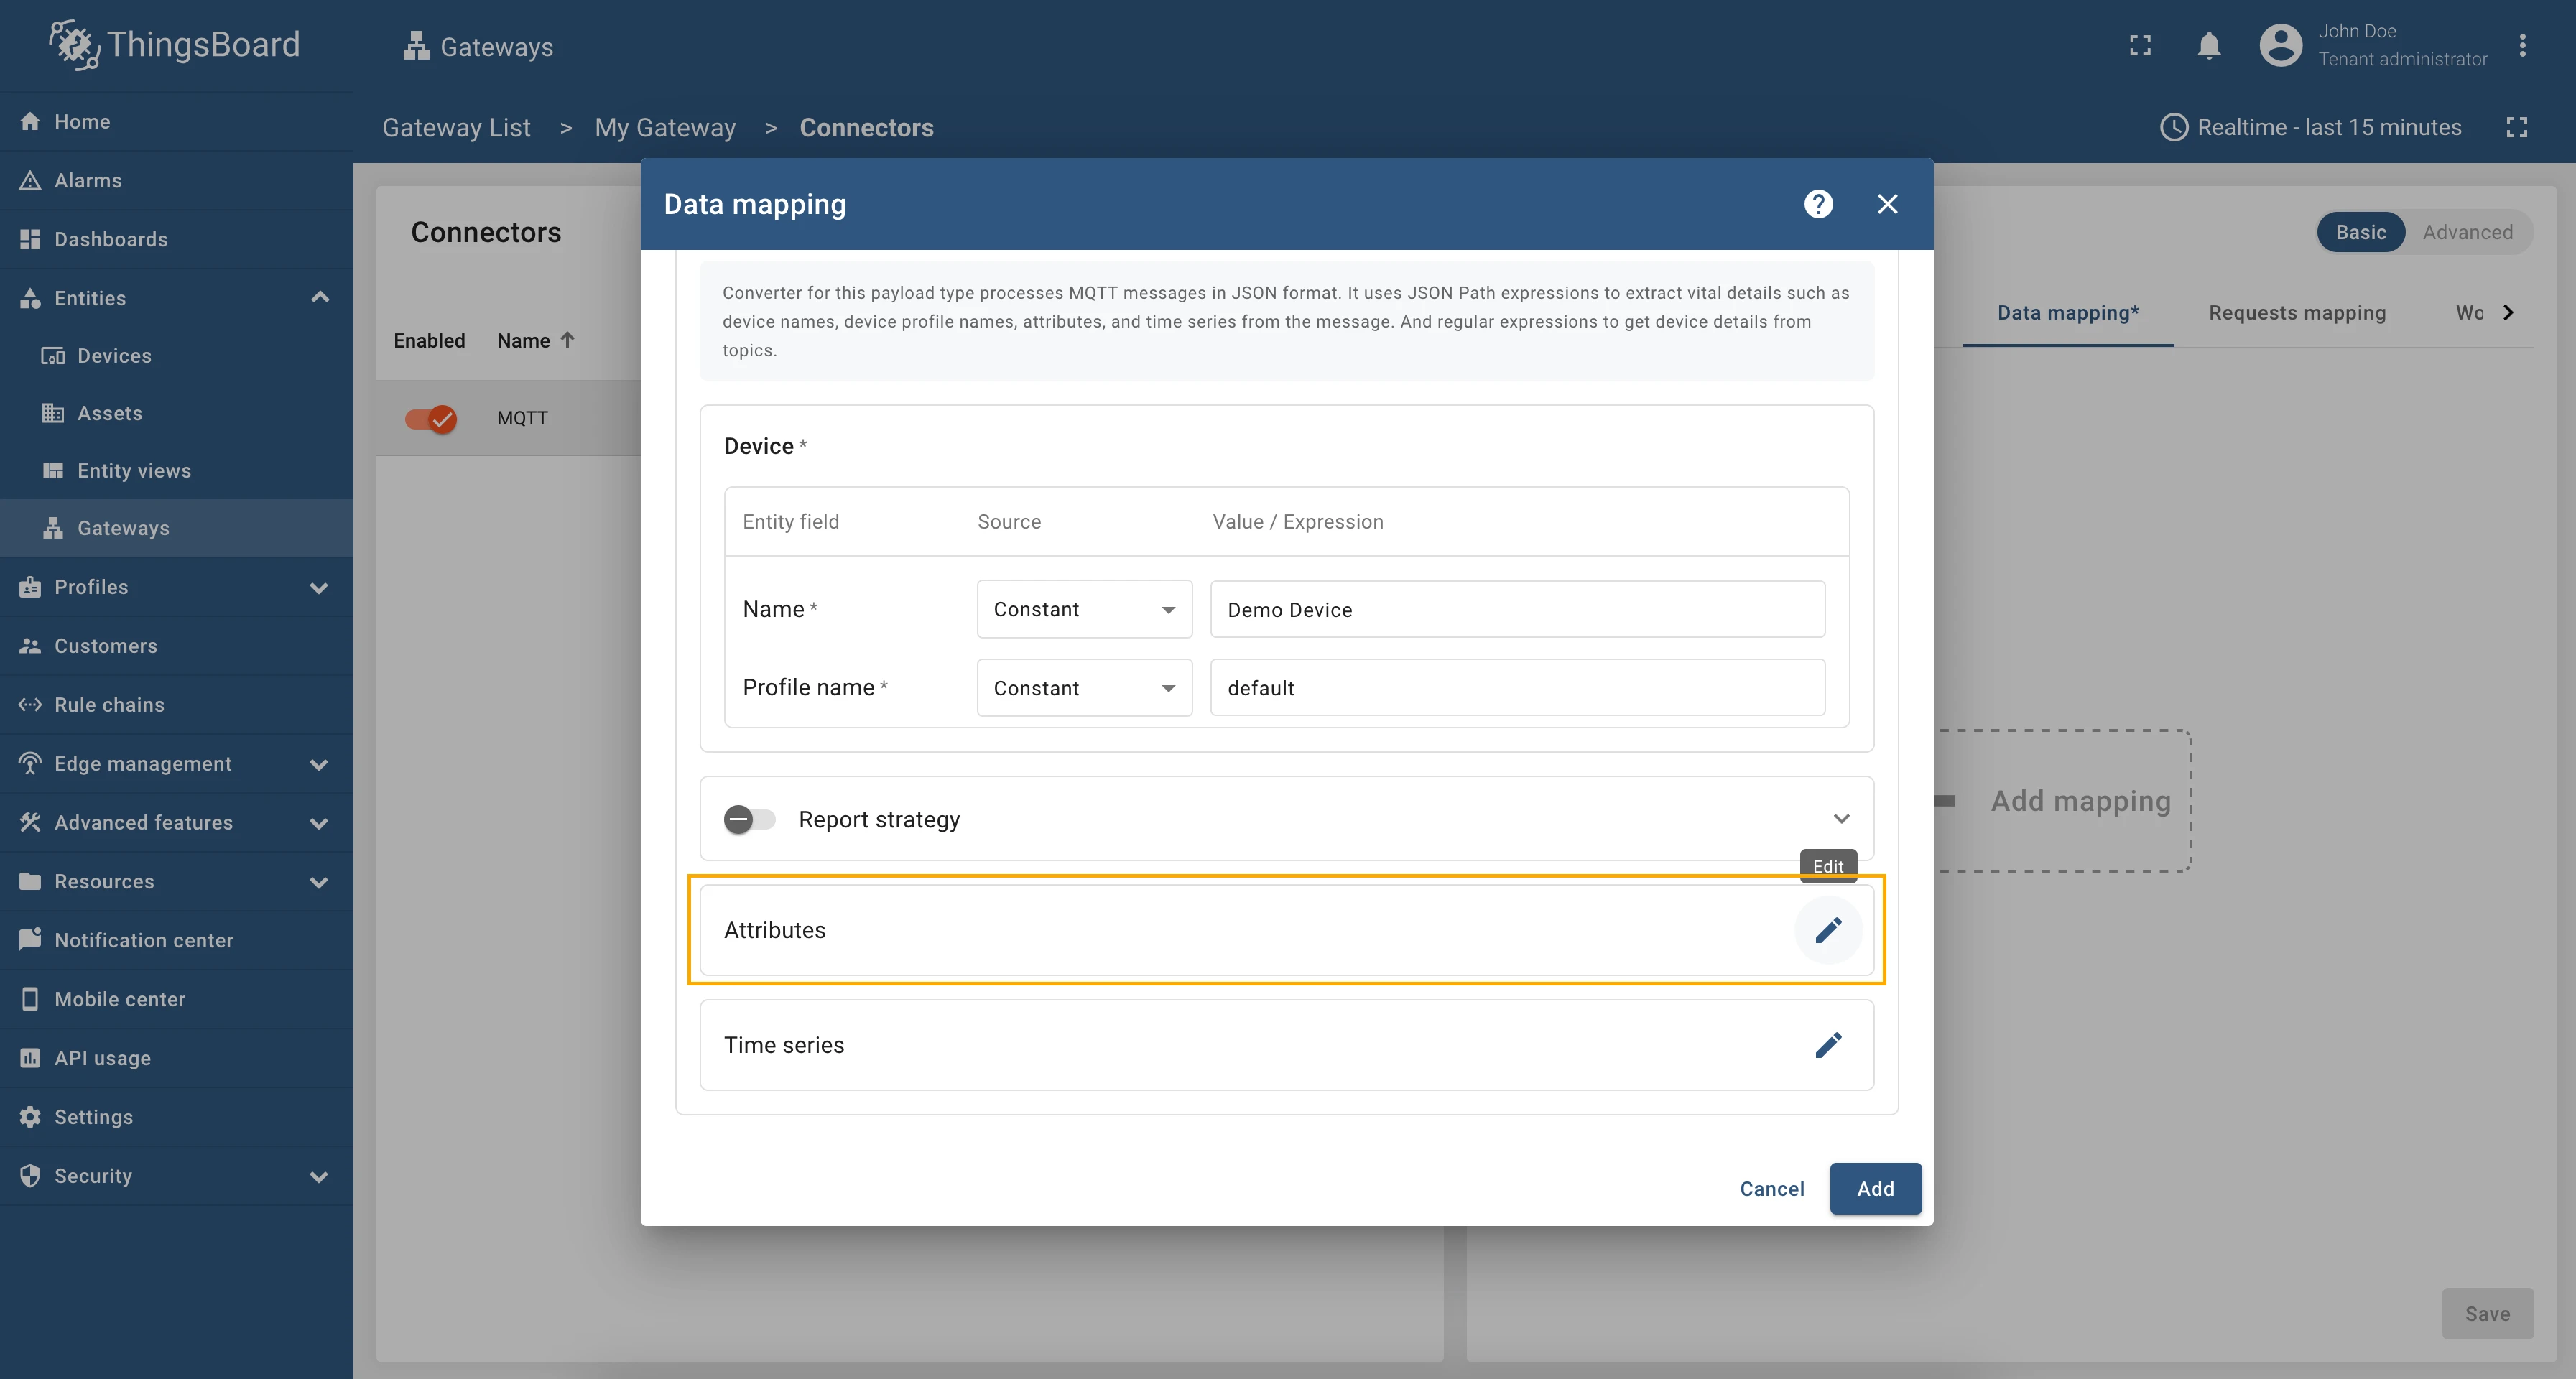
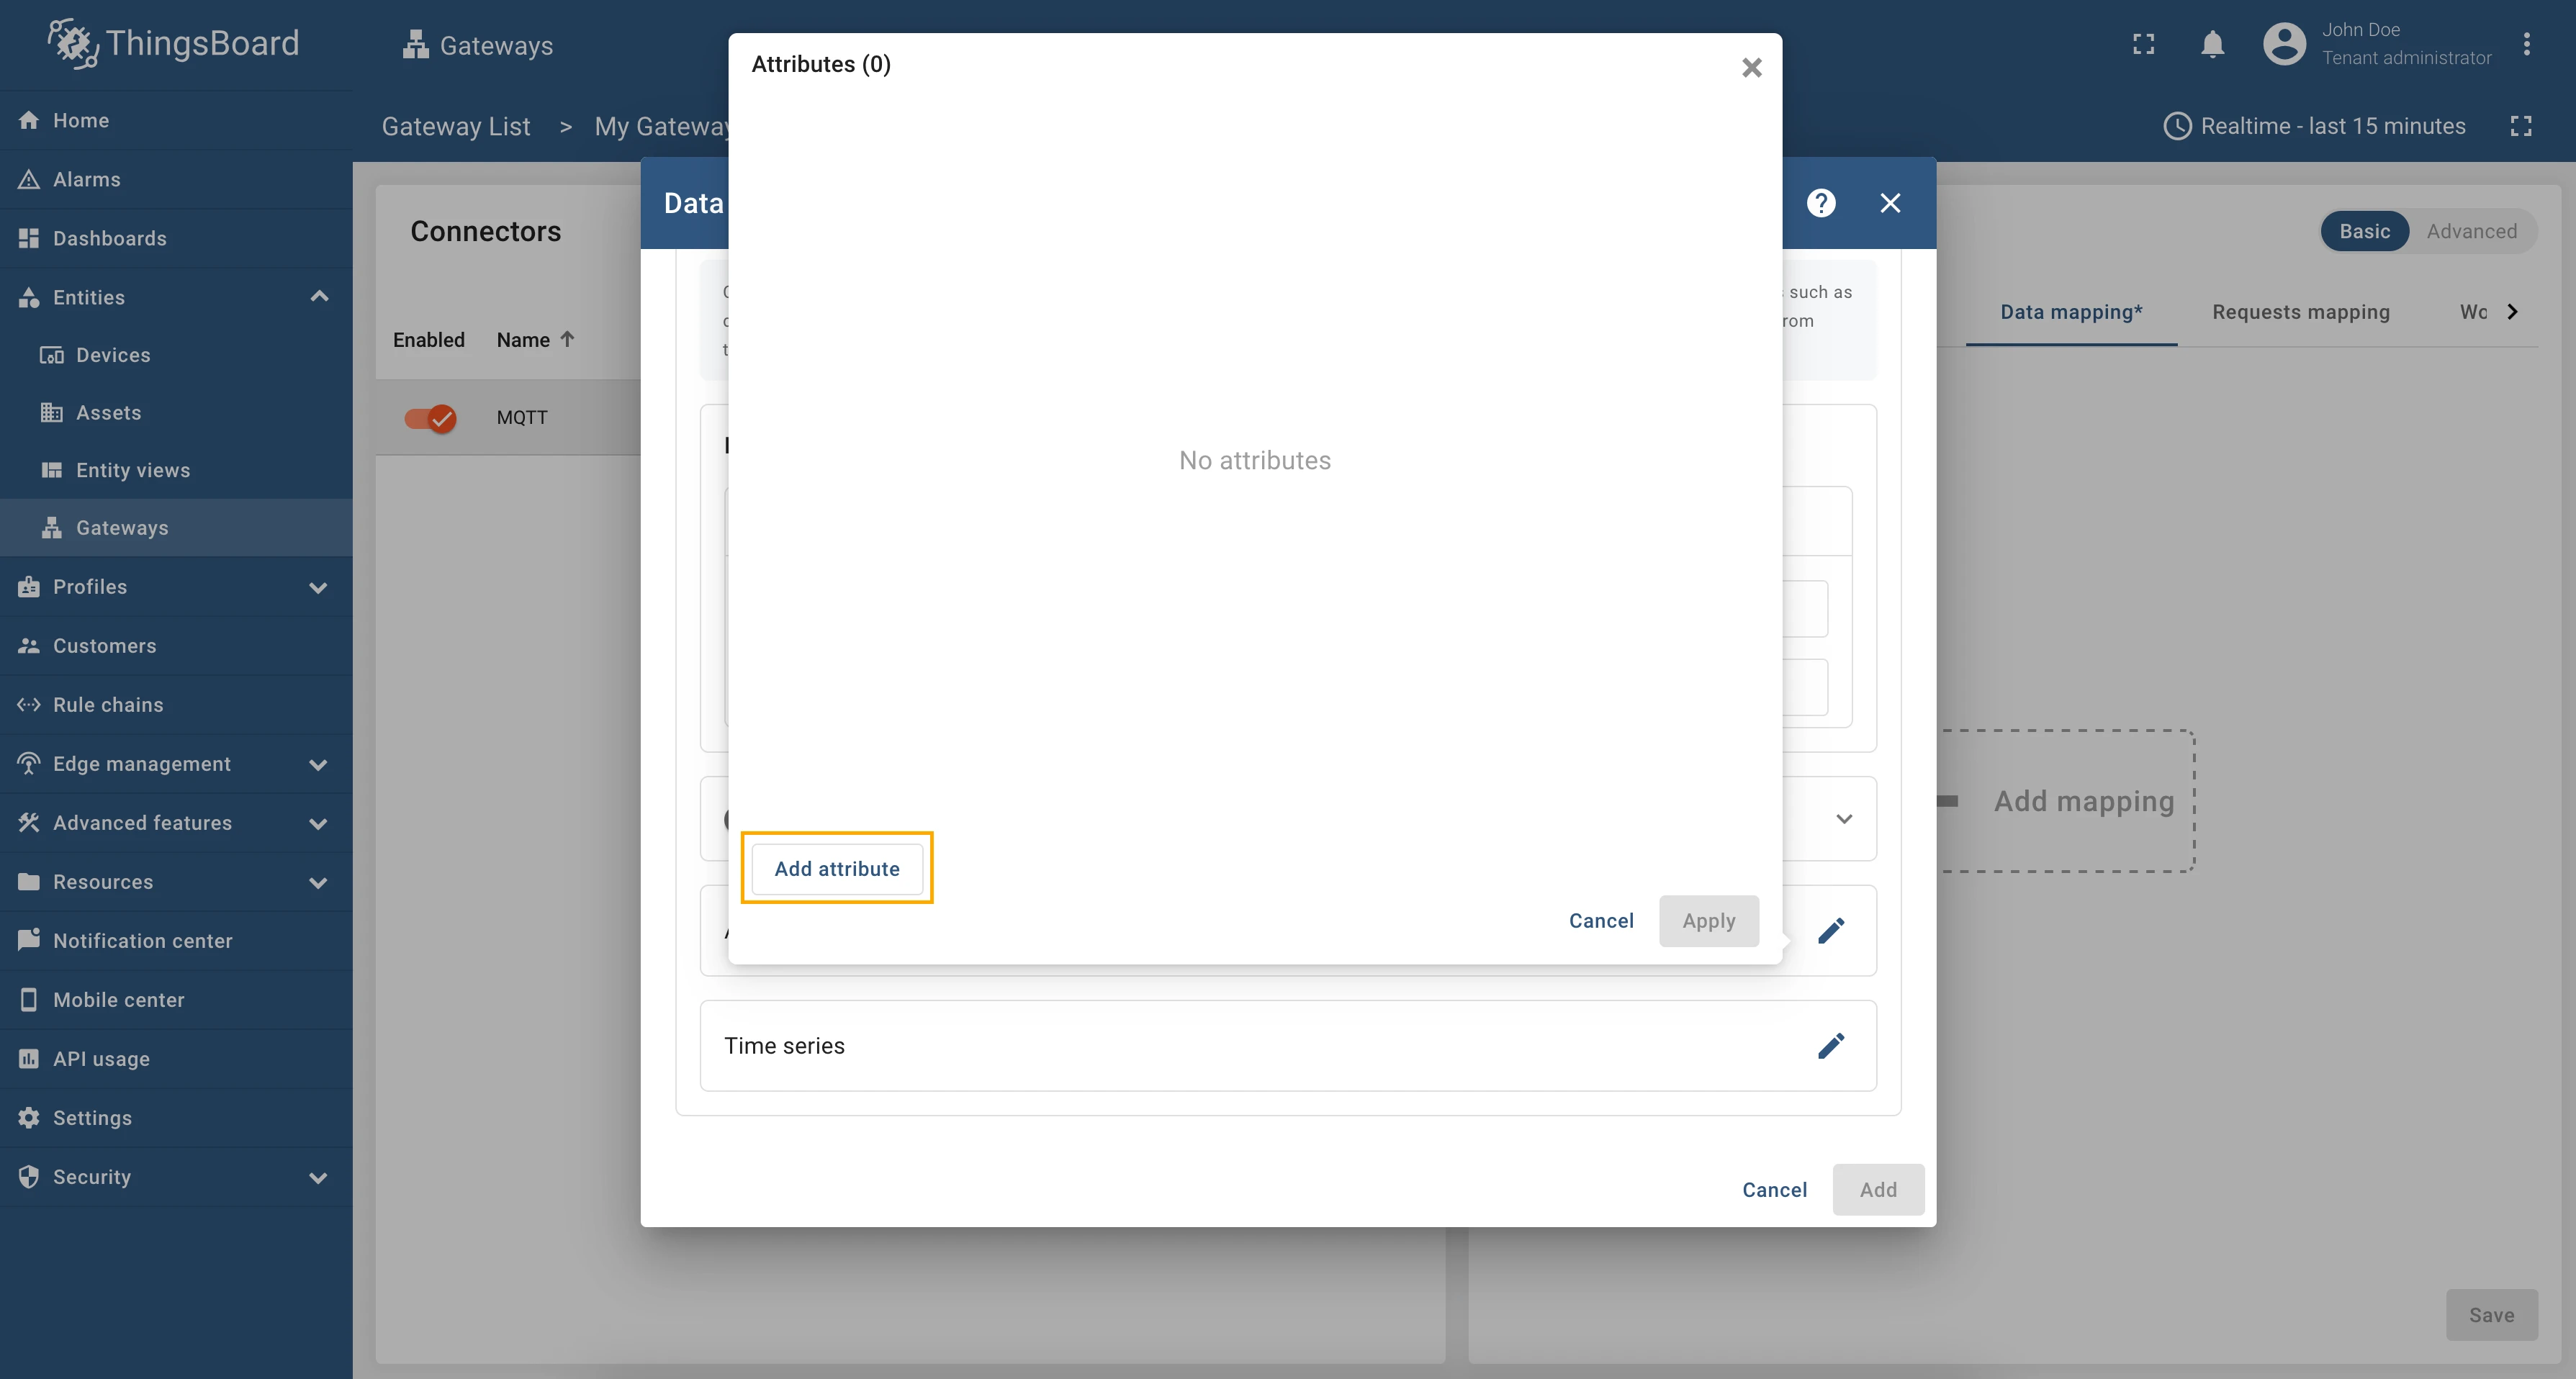
Click on pencil icon opposite to Attributes subsection and use the following options/values in the opened window:
-
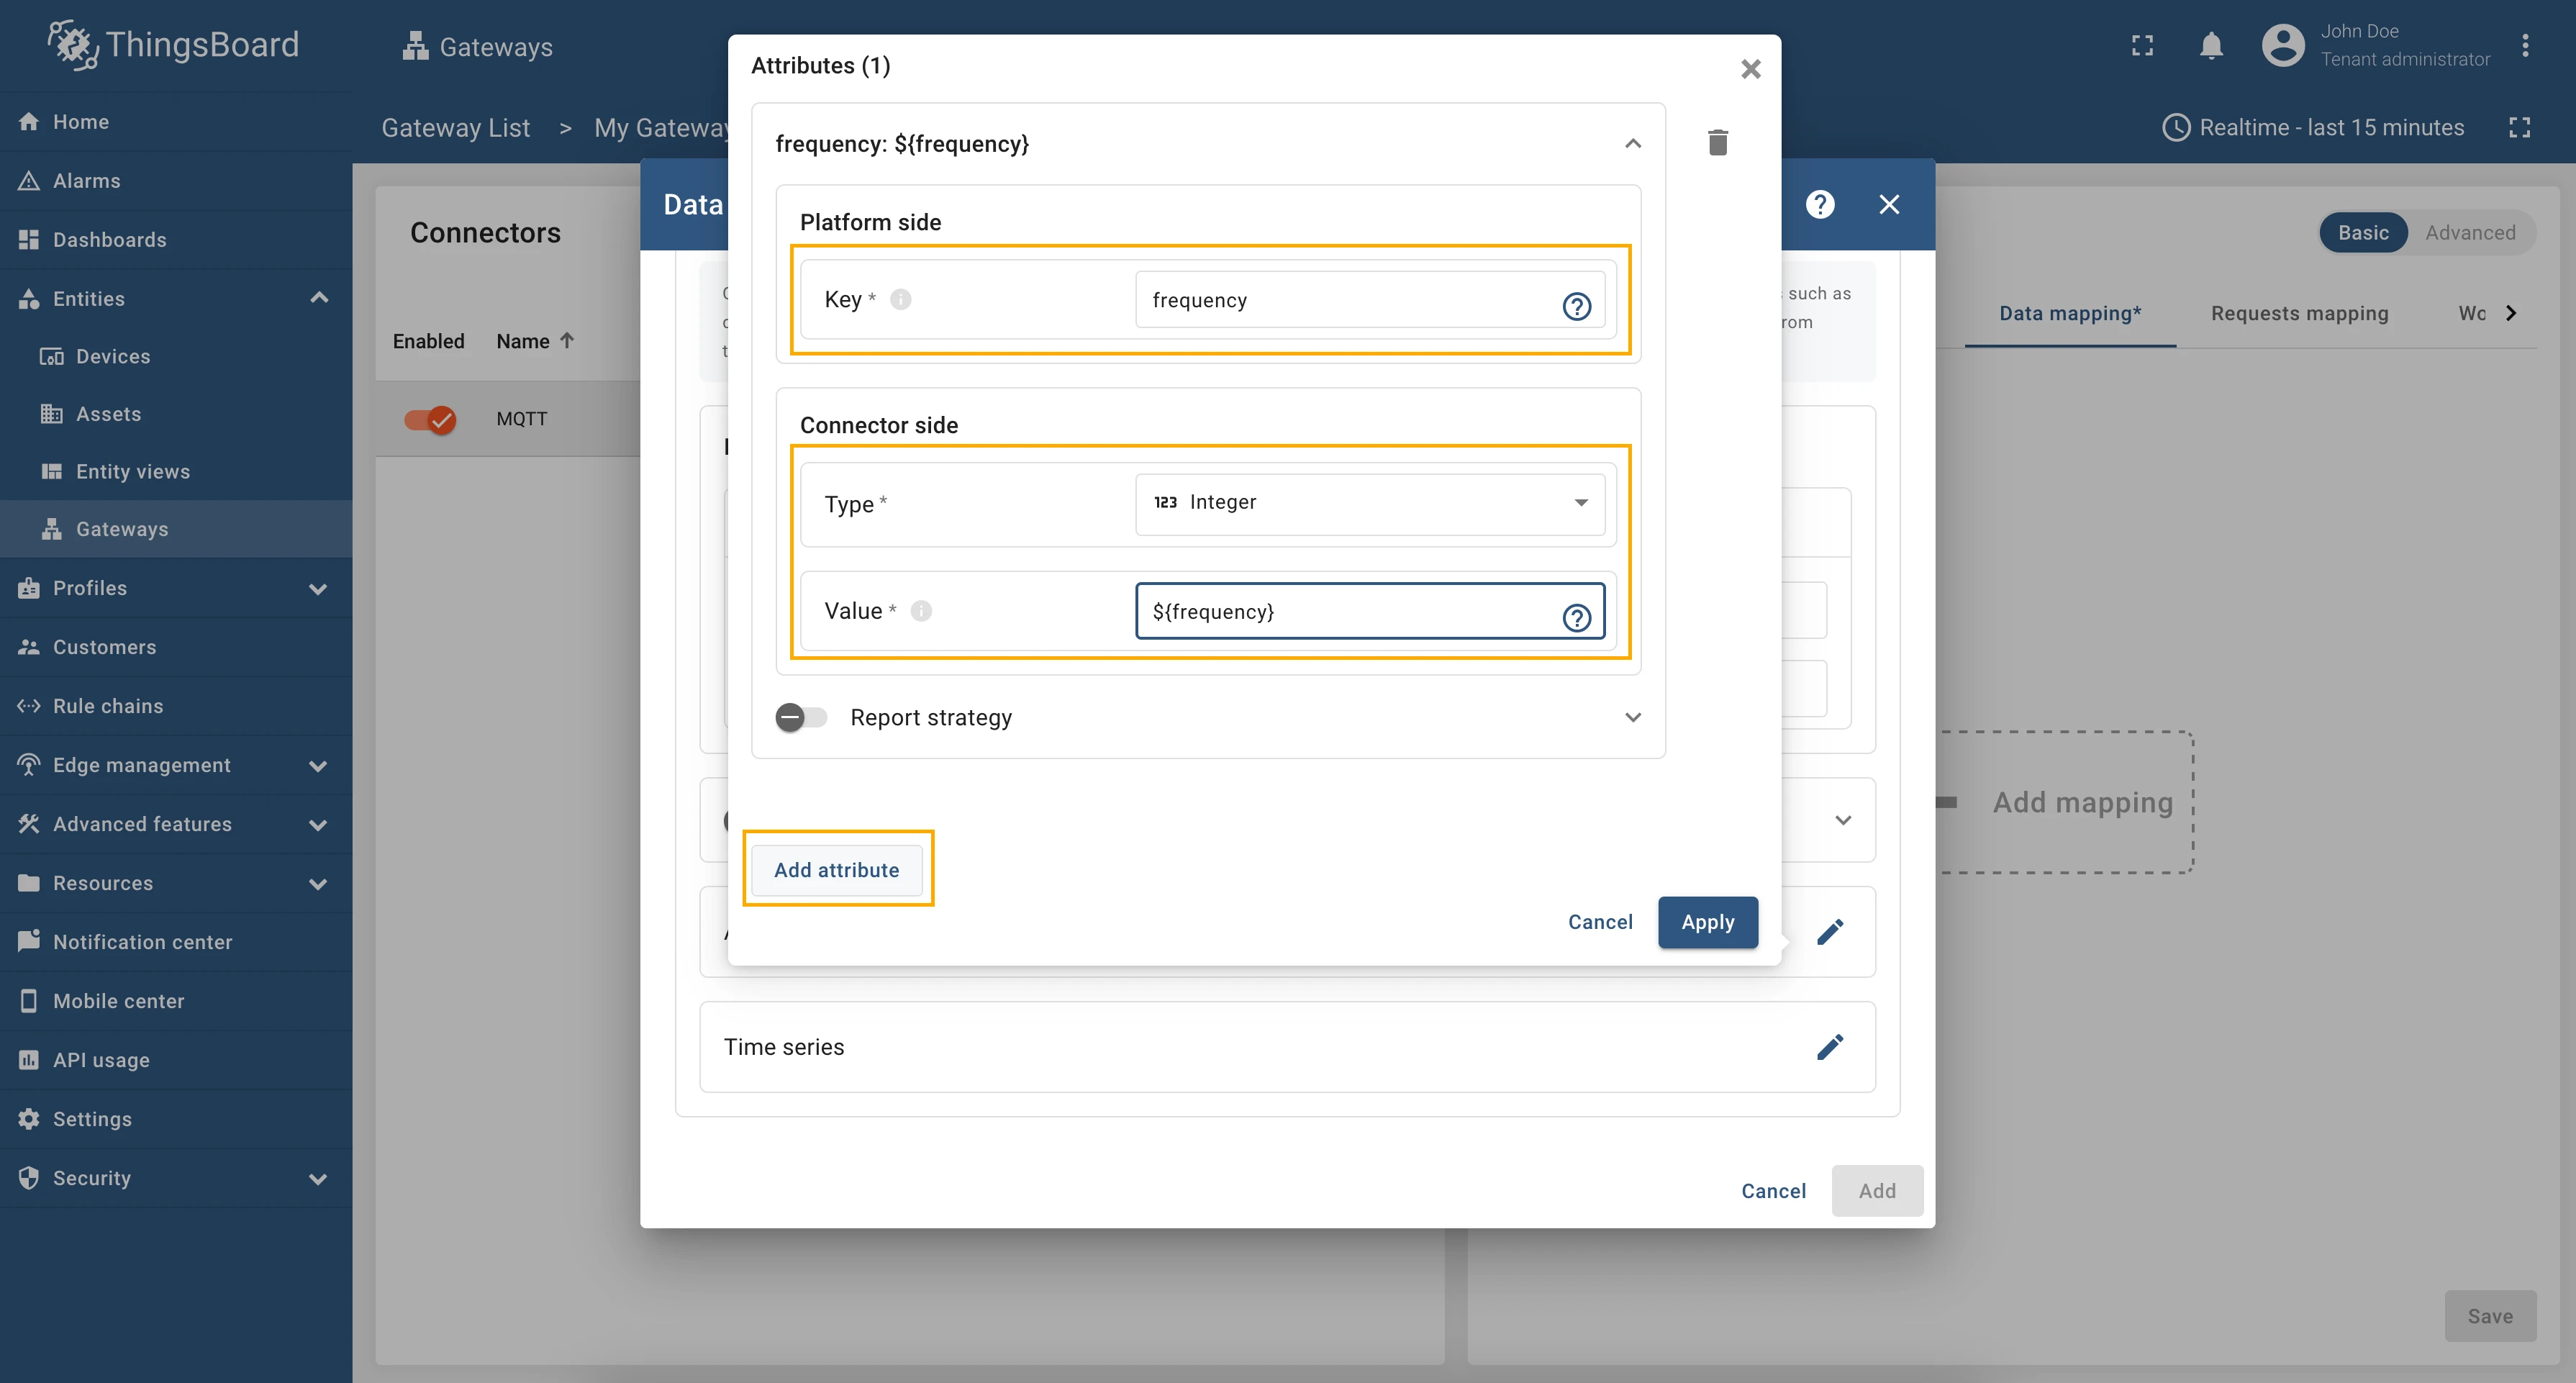
Click on Add attribute button and fill in Key field with “frequency” value, select Integer option in Type field and fill in Value field with ”${frequency}” value.
-
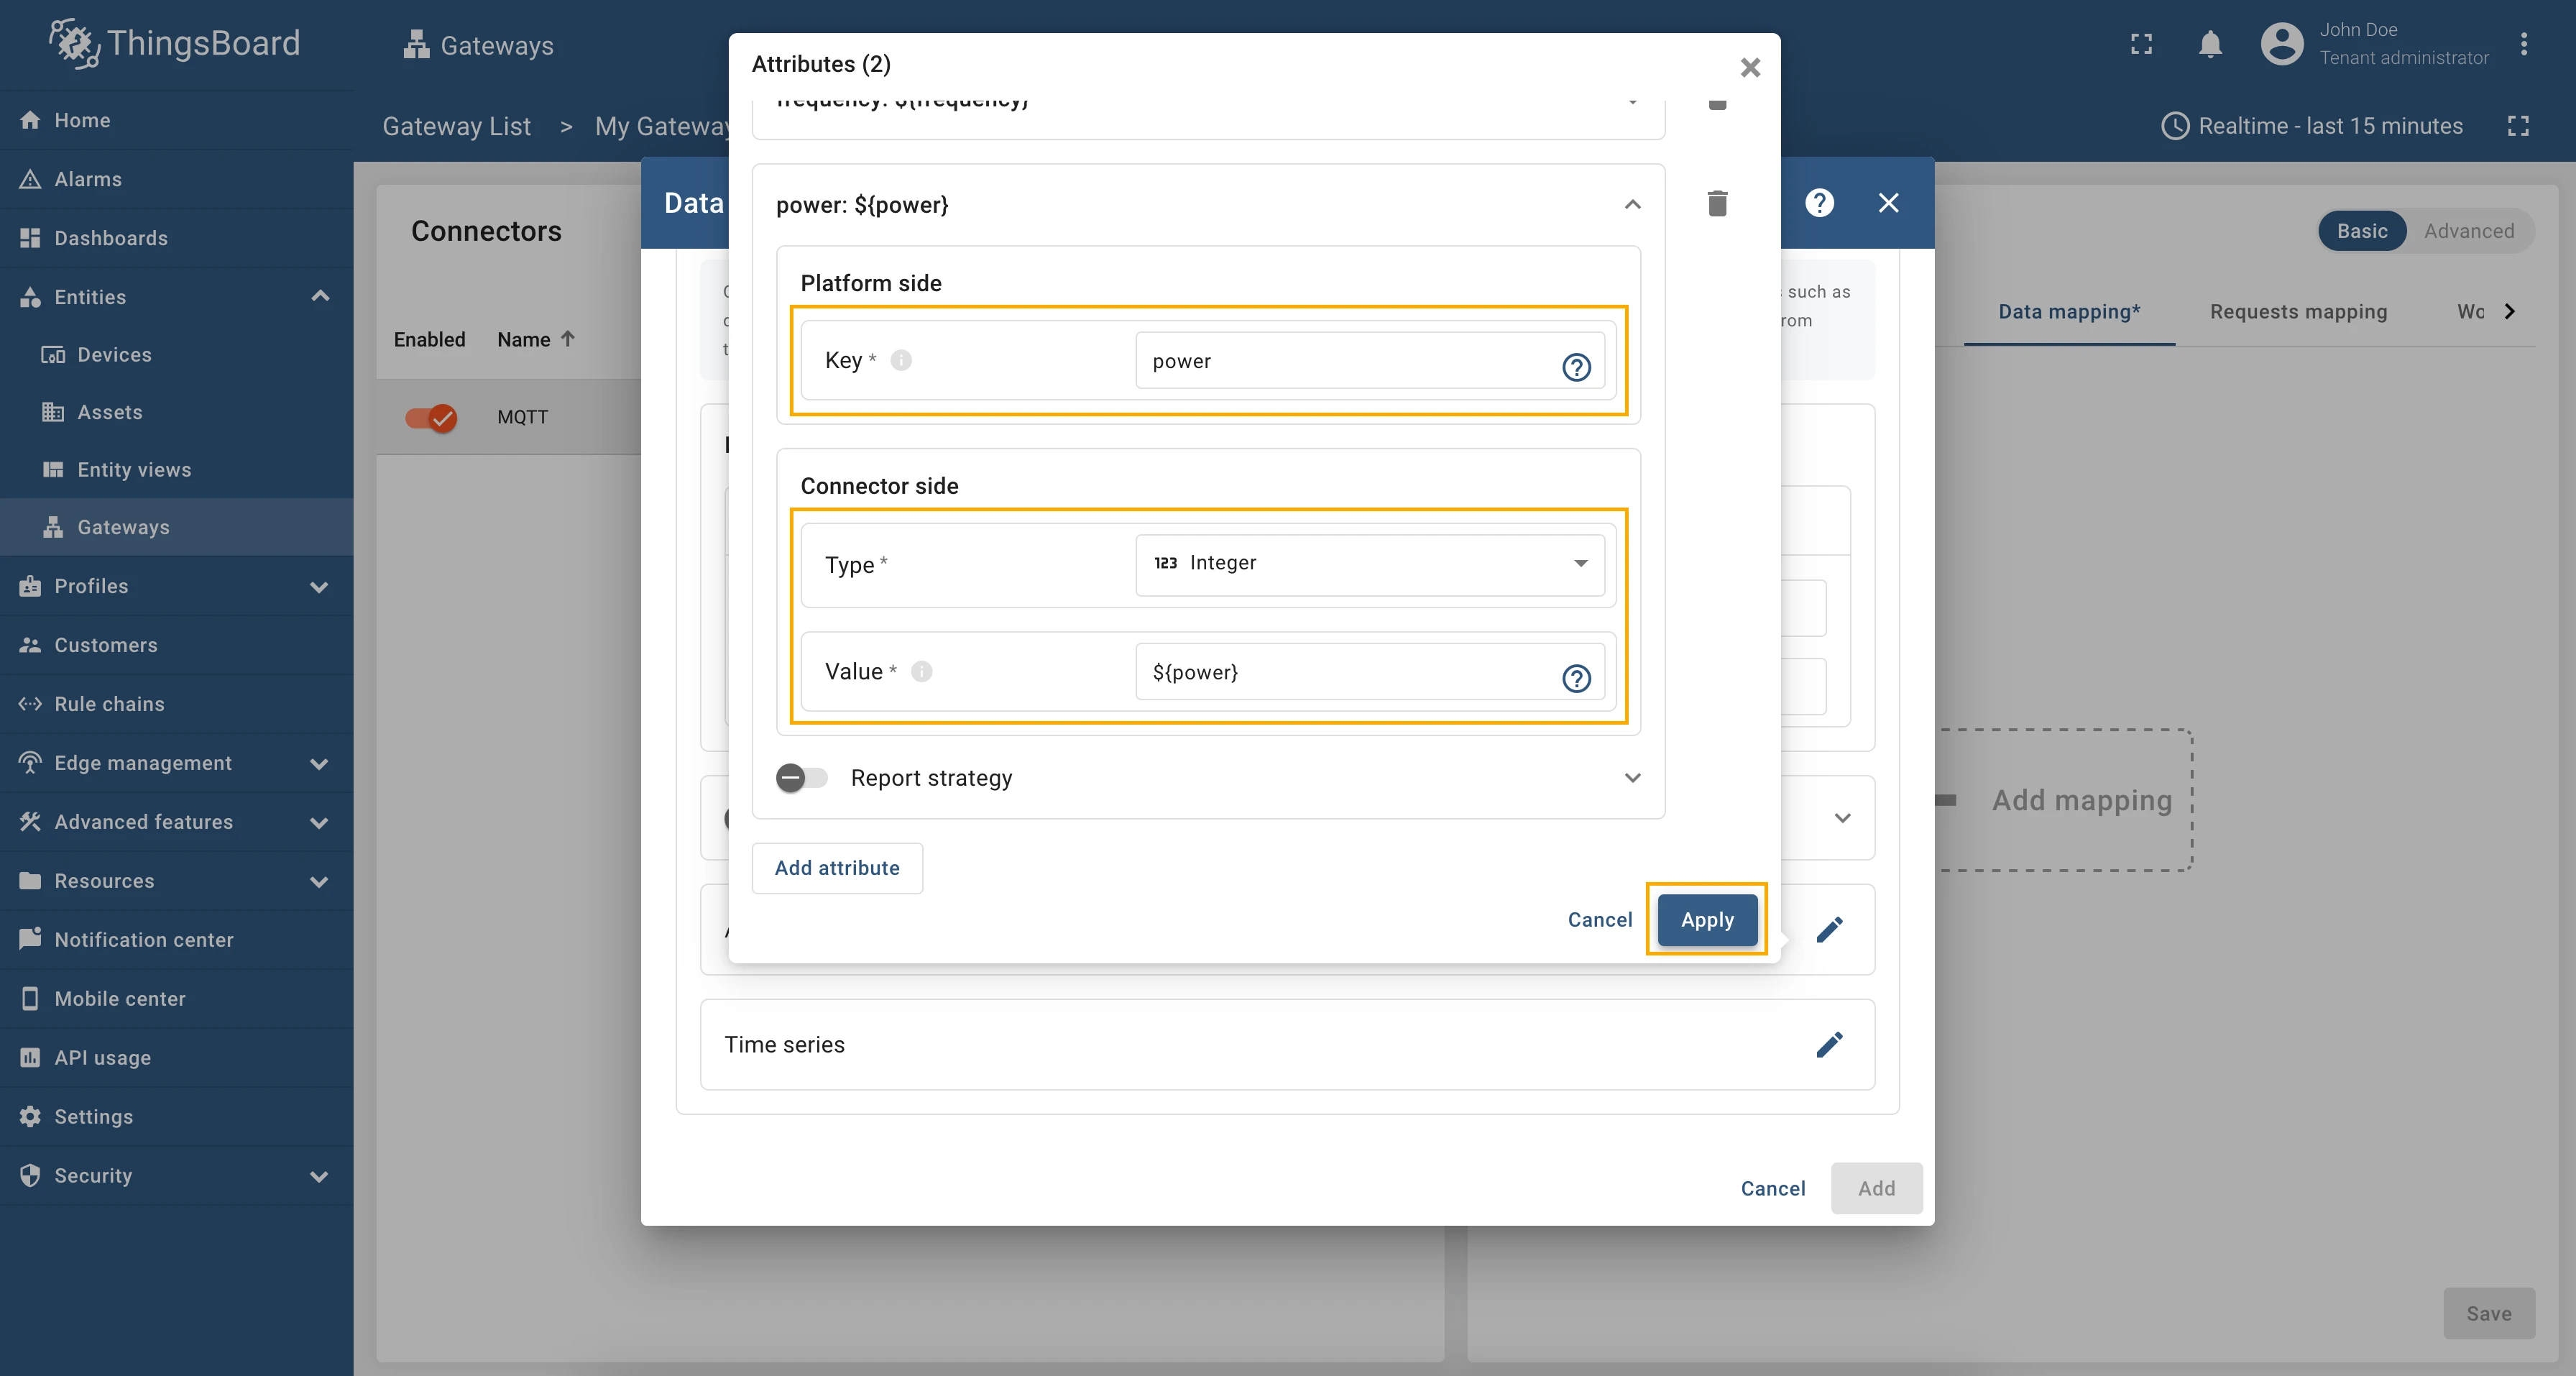
Click on Add attribute button and fill in Key field with “power” value, select Integer option in Type field and fill in Value field with ”${power}” value.
-
Click on Apply button.
-
-
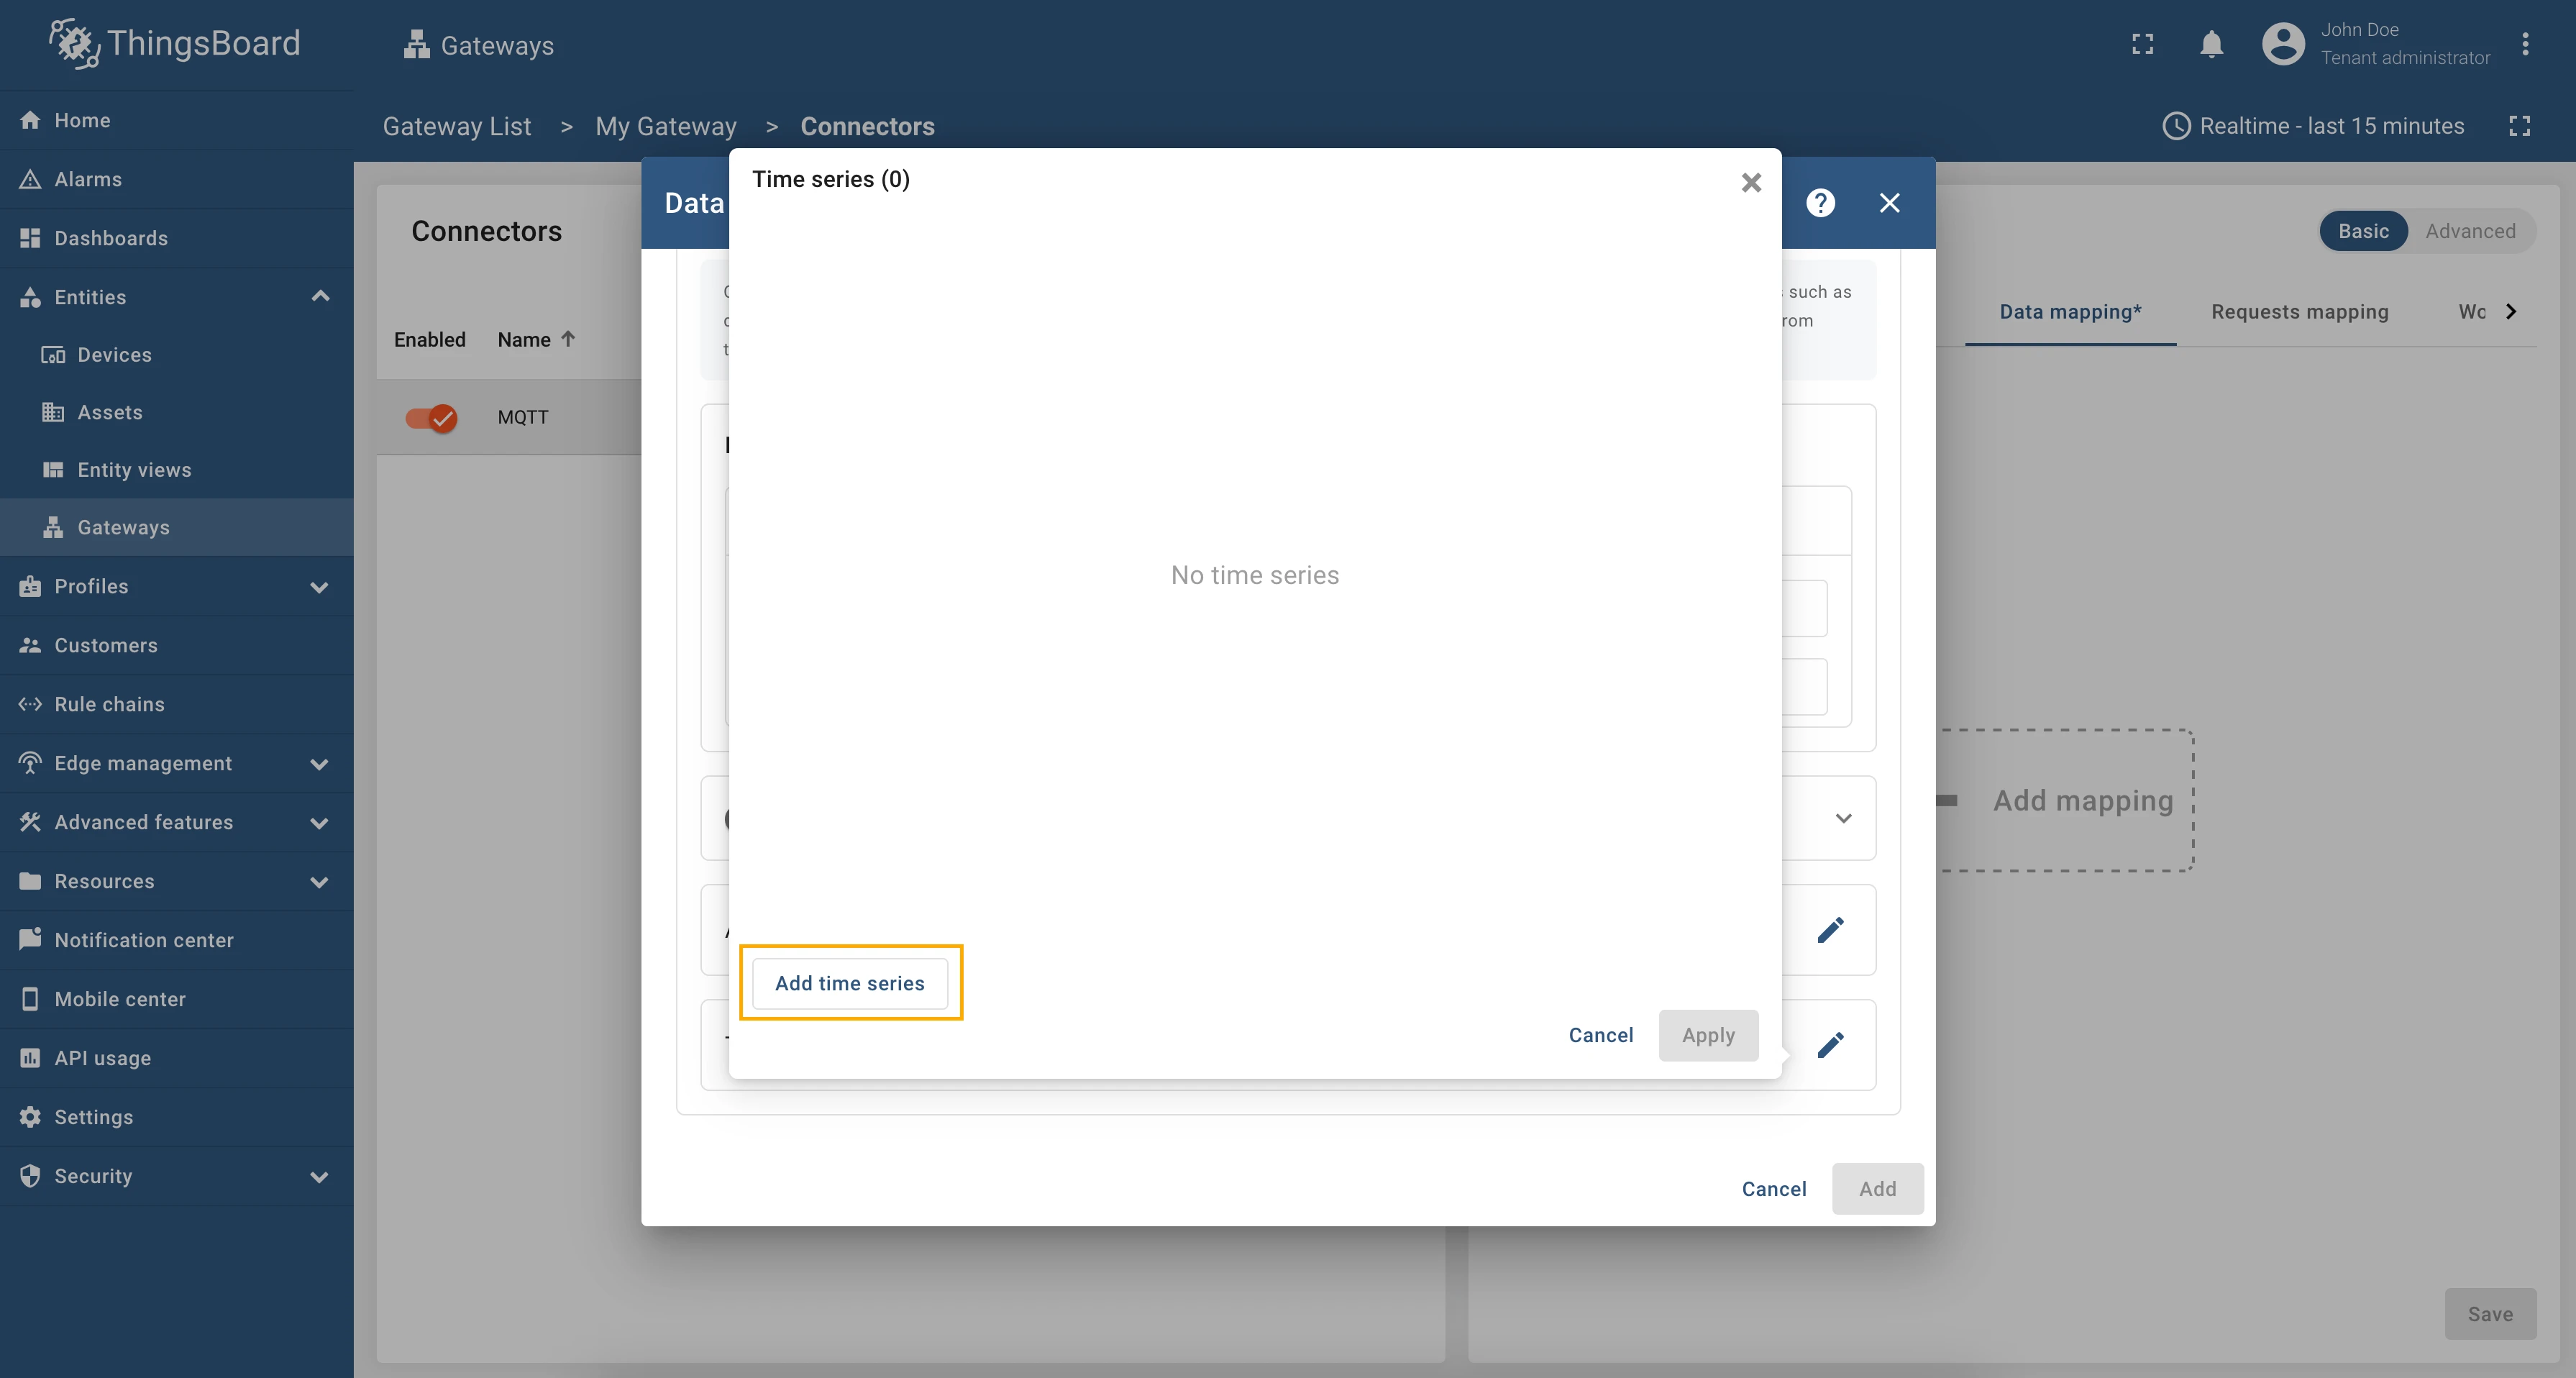
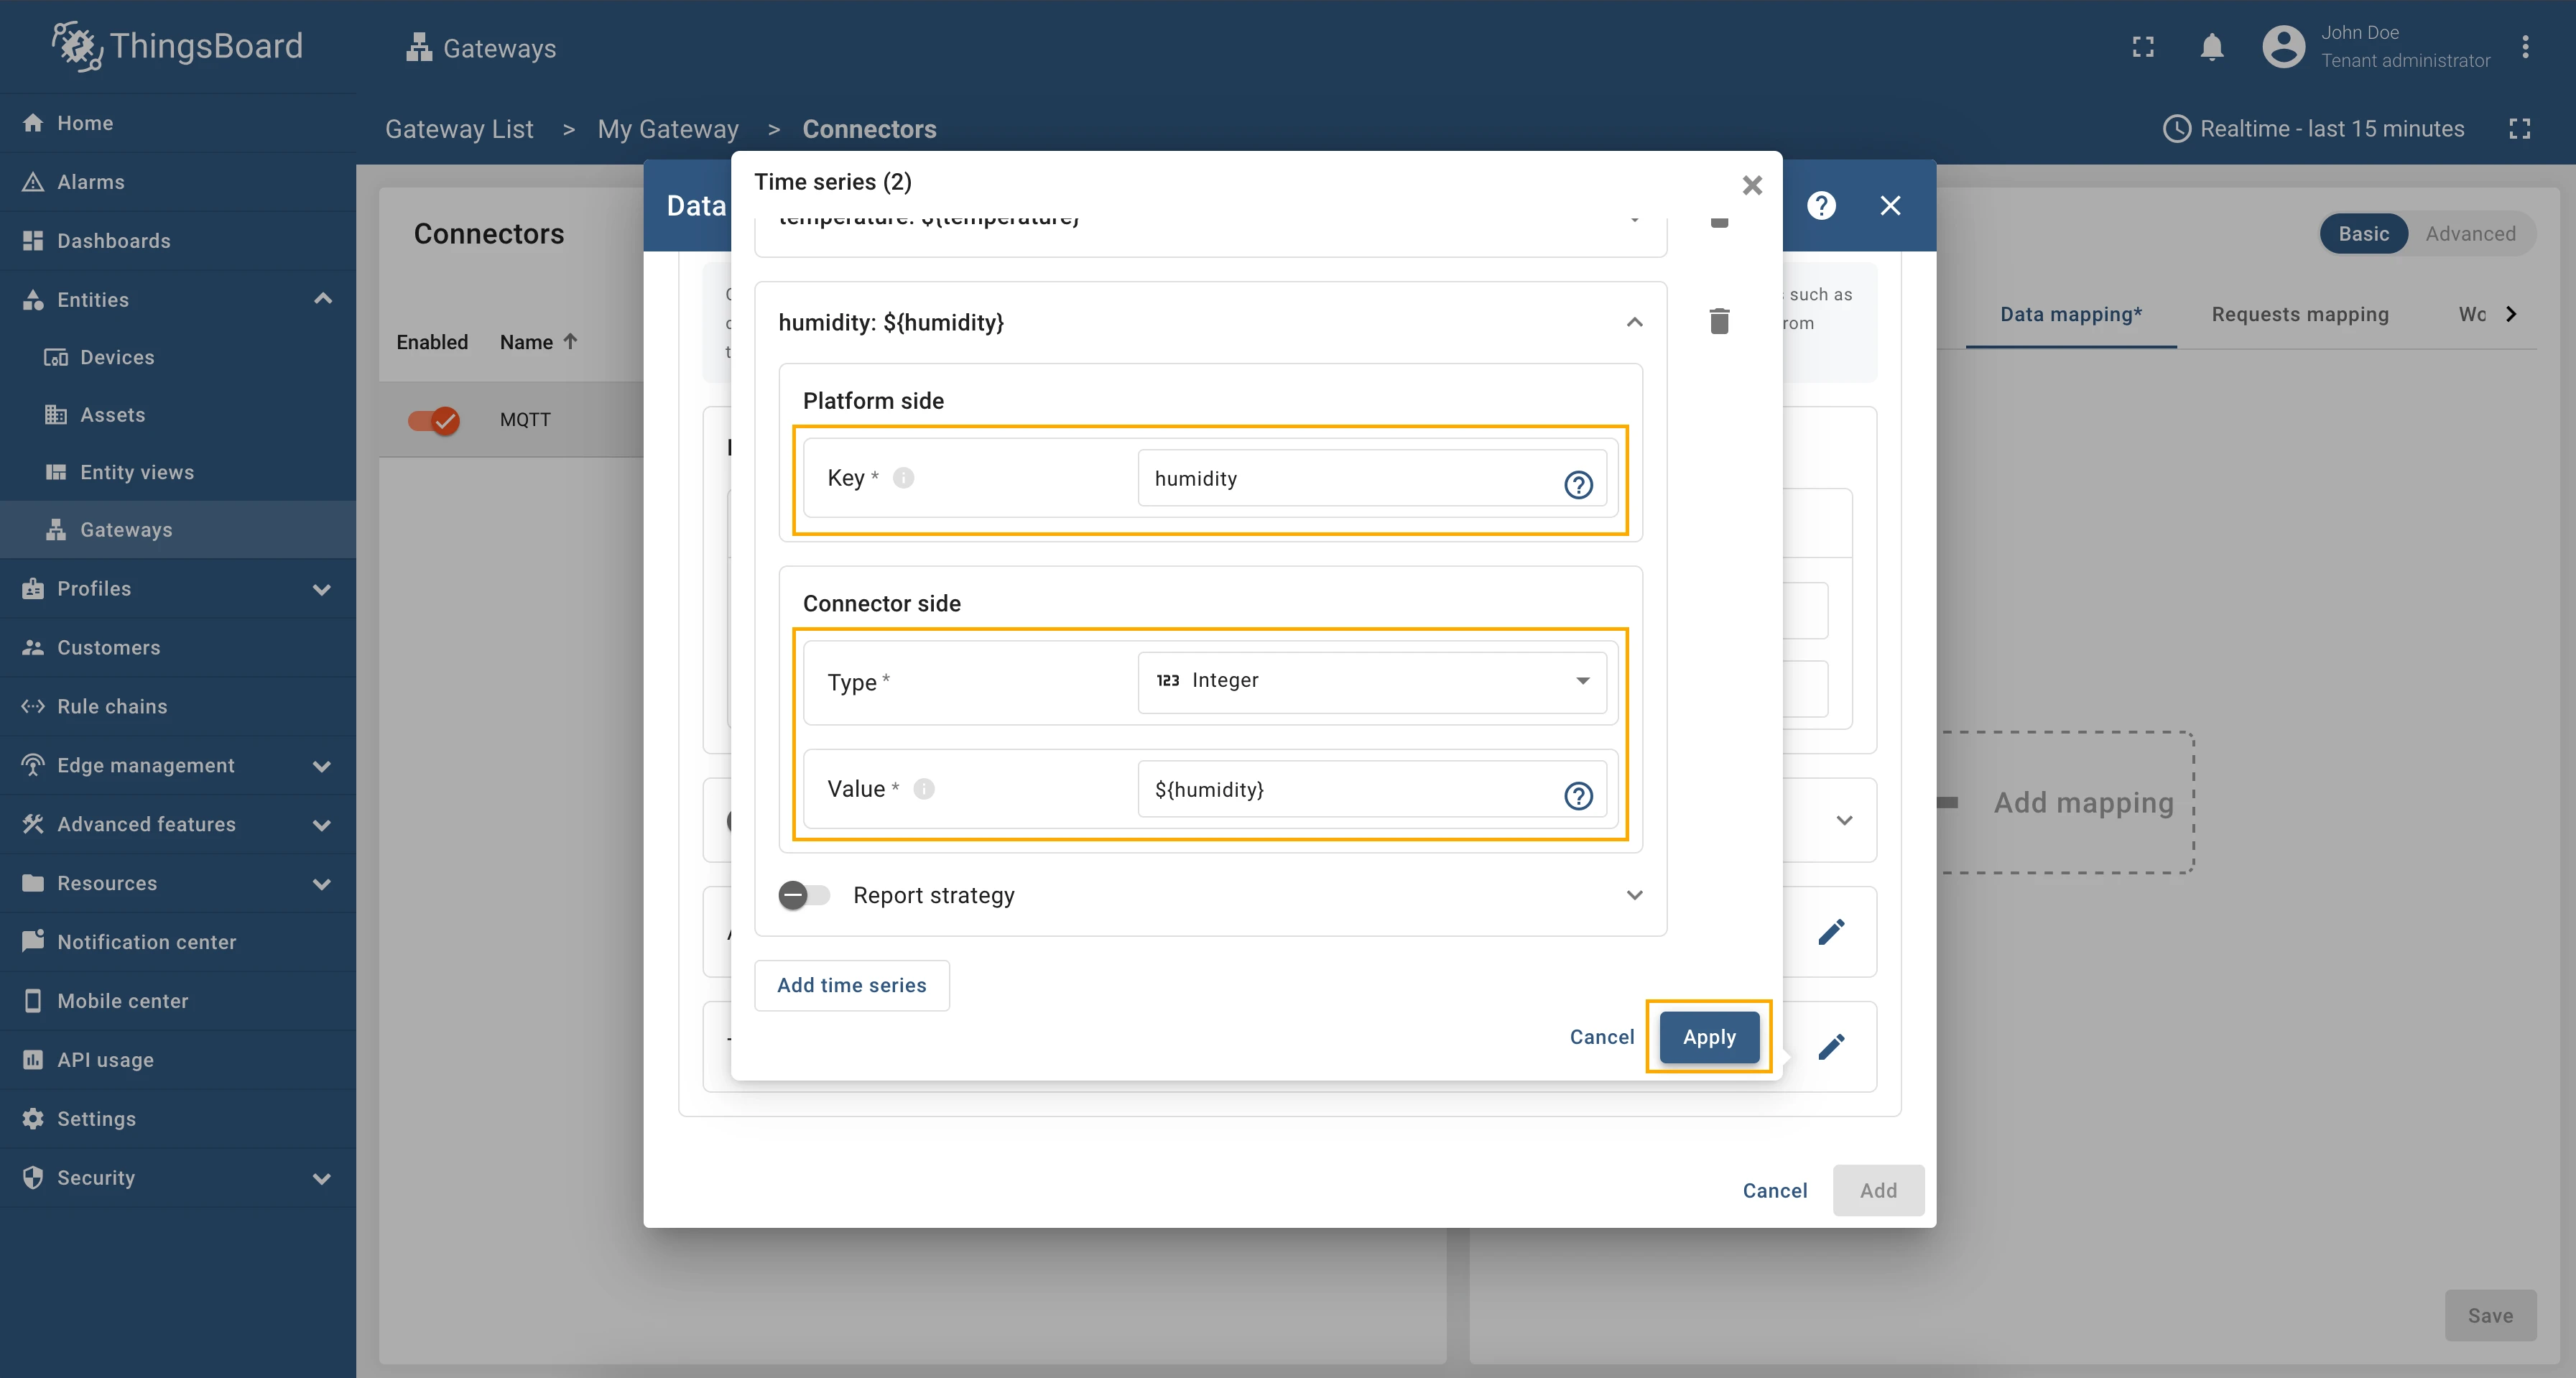
Click on pencil icon opposite to Time series subsection and use the following options/values in the opened window:
-
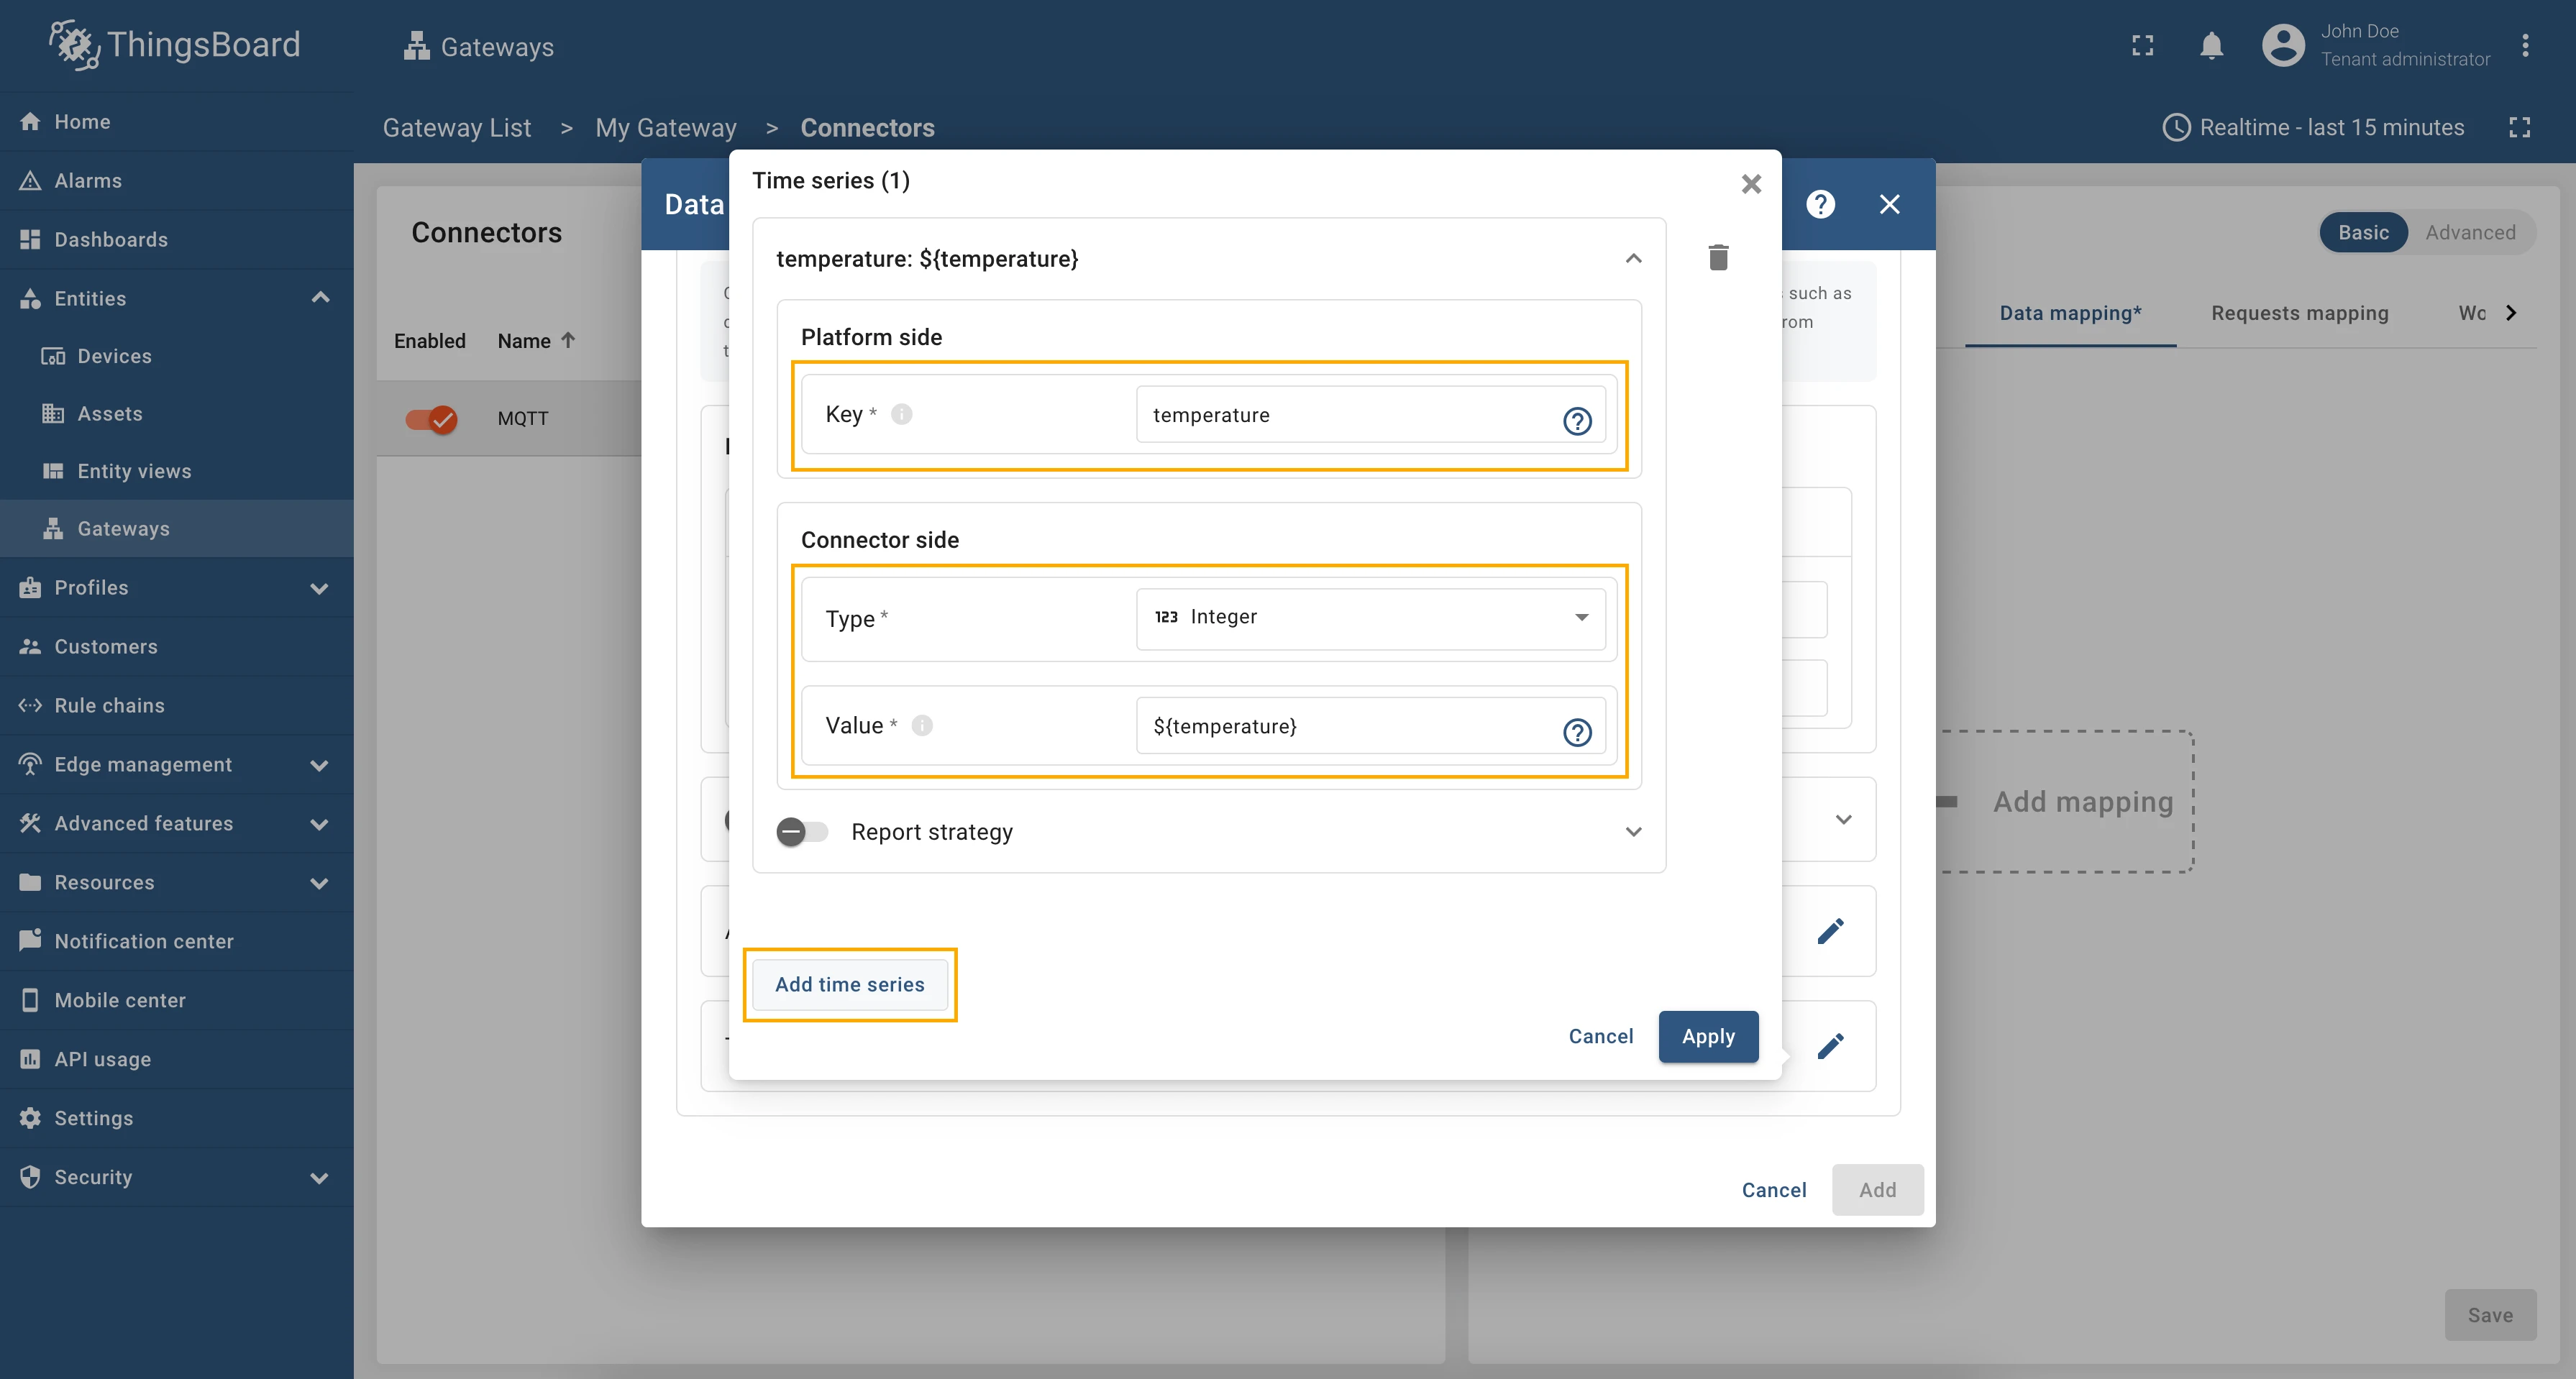
Click on Add time series button and fill in Key field with “temperature” value, select Integer option in Type field and fill in Value field with ”${temperature}” value.
-
Click on Add time series button and fill in Key field with “humidity” value, select Integer option in Type field and fill in Value field with ”${humidity}” value.
-
Click on Apply button.
-
Click Add button. Data mapping added.
-
-

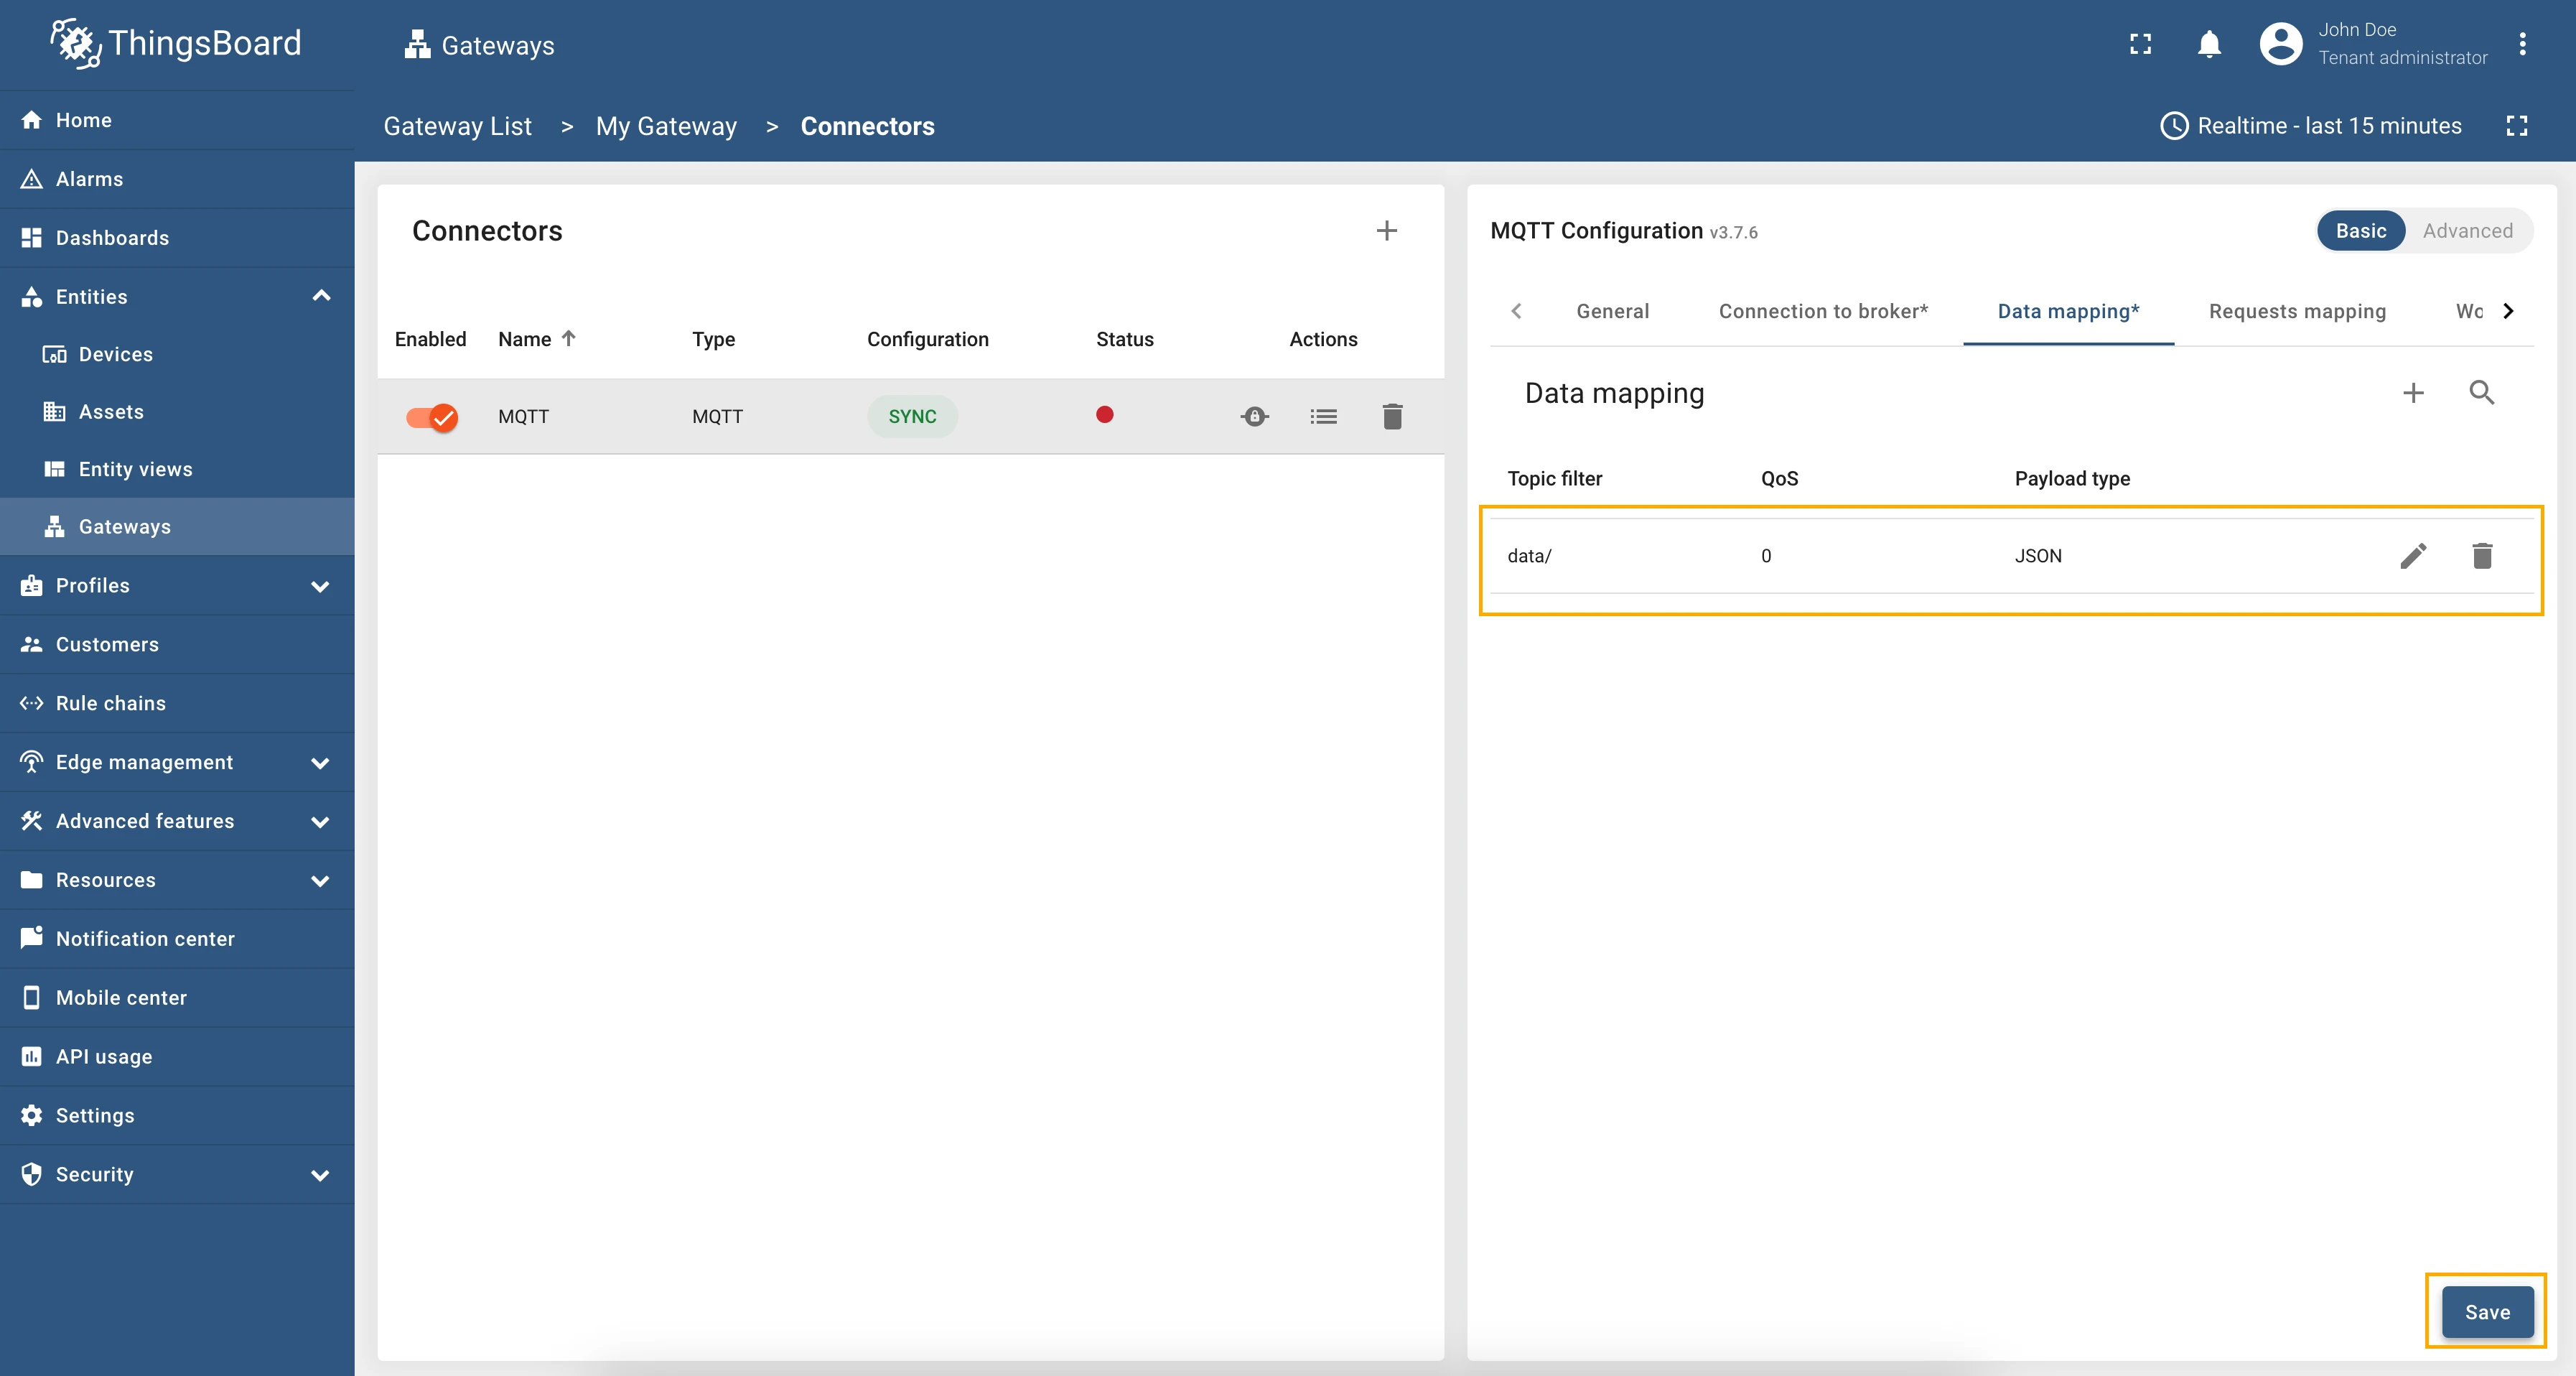
Following the steps outlined, your gateway will receive and apply the new configuration. It will then synchronize its state with the remote server. You can view the synchronization status of the connector configuration in the Configuration column, which will indicate whether the gateway is successfully aligned with the remote settings.
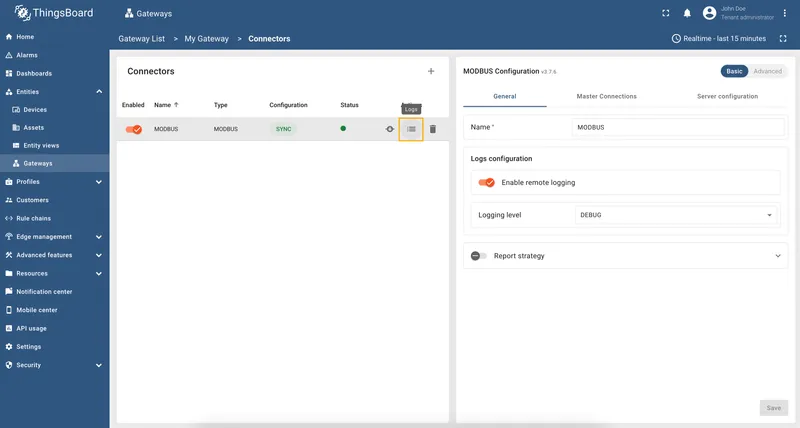
Also, you can see the connector logs to make sure that the connector works, for this purpose, follow these steps:
-
In the General connector tab enable remove logging by turning on the Enable remote logging toggle. Choose DEBUG in the Log level drop-down menu. Click on the Save button to apply changes.

-
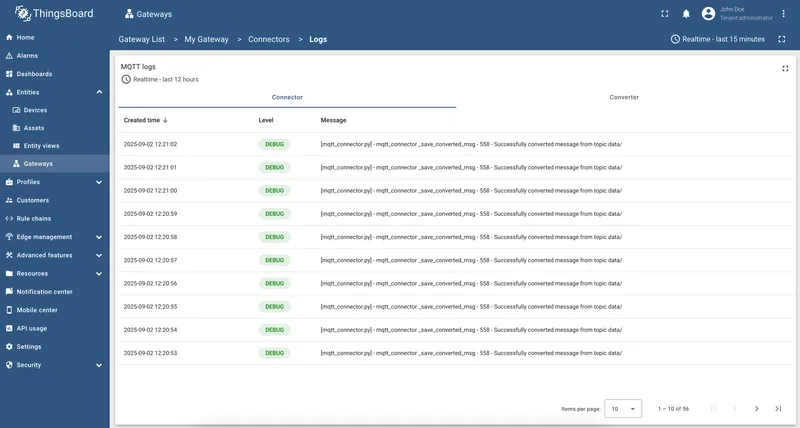
Click on logs icon to open connector logs page.

-
You can see the Logs table that consists of Created time, Status and Message columns.


For now, the gateway is ready to process data through the newly created and configured MQTT connector.
Let’s publish data to the MQTT Broker defined in the configuration above, you can follow these steps using a tool like mosquitto_pub or an MQTT client library in your preferred programming language. In this example, we’ll use the mosquitto_pub command-line tool.
- Ensure that the Mosquitto MQTT clients are installed on your system. Typically, you can install them using the package manager of your operating system:
-
For Ubuntu:
Terminal window sudo apt-get install mosquitto-clients -
For Windows:
Download the Mosquitto client tools from the official website.
Install the tools, ensuring that the installation directory is added to the system’s PATH.
-
For MacOS:
Terminal window brew install mosquitto
- Use the mosquitto_pub command to publish data to a specific MQTT topic. In this case, we’ll use the “data/” topic as defined in the configuration:
mosquitto_pub -h localhost -p 1884 -t data/ -m '{"frequency": 50, "power": 100, "temperature": 25, "humidity": 60}'Where:
-h- specifies the MQTT broker’s host address;-p- specifies the MQTT broker’s port;-t- specifies the MQTT topic to publish to (“data/” in our case);-m- specifies the payload or message to publish. It should be in JSON format, following the structure defined in the mapping section of your configuration.
Adjust the payload values as needed.
Let’s add a Modbus connector, which will read some data from the demo slave to the created gateway.
Setup demo server
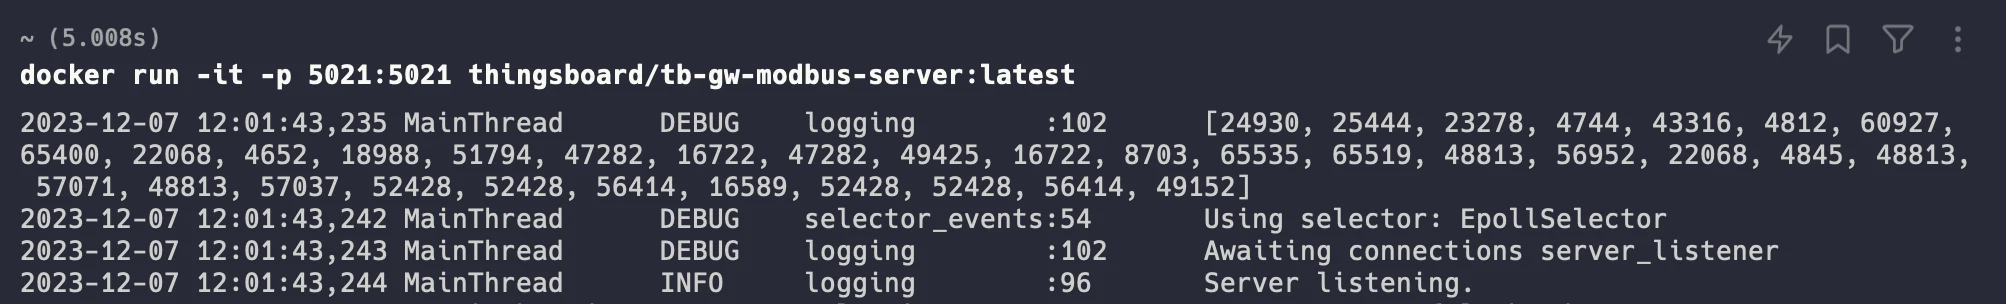
Section titled “Setup demo server”As a demo simulation slave, we will use docker image, that can be installed and run using the following command:
docker run -it -p 5021:5021 thingsboard/tb-gw-modbus-server:latestAfter running docker image, you can see the following logs in your terminal:
Setup connector
Section titled “Setup connector”This Modbus connector configuration sets up a master to communicate with a slave device located at “host.docker.internal” on port 5021 using TCP. The configuration includes specifications for data retrieval such as byte and word order, timeout, and polling period. The slave device, named “Demo Device” is configured to handle Modbus function code 4 requests. Attribute and time series mappings are defined for parameters like frequency, power, humidity, and temperature. Additionally, settings for connection attempts, retries, and wait times after failed attempts are provided.
To create a connector, follow these steps:
-
Click on Connectors configuration button on the right panel.
-
Click the + Add connector button.
-
Choose MODBUS connector type from the dropdown, fill in Name field, choose Logging level to INFO, turn off the Fill configuration with default values option and click on Add button.
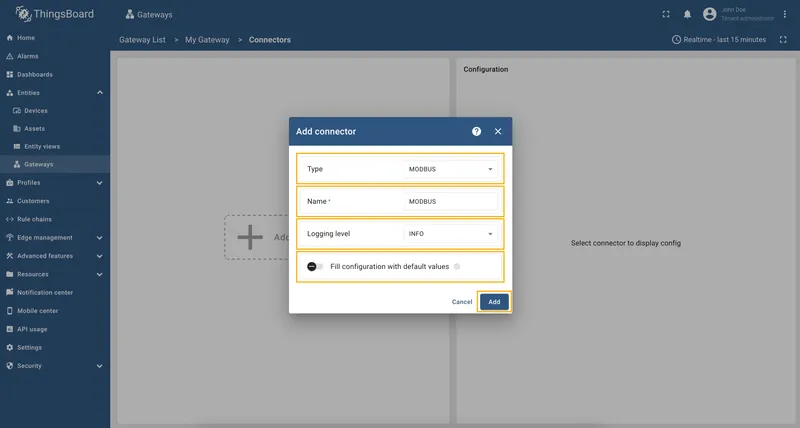
-
Connector created.
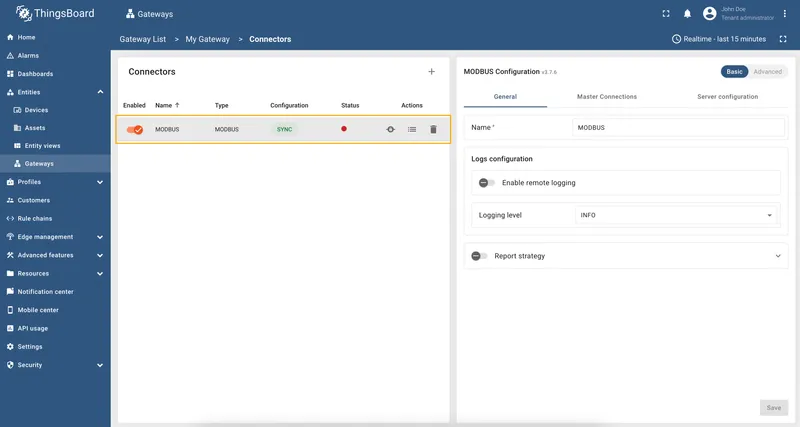

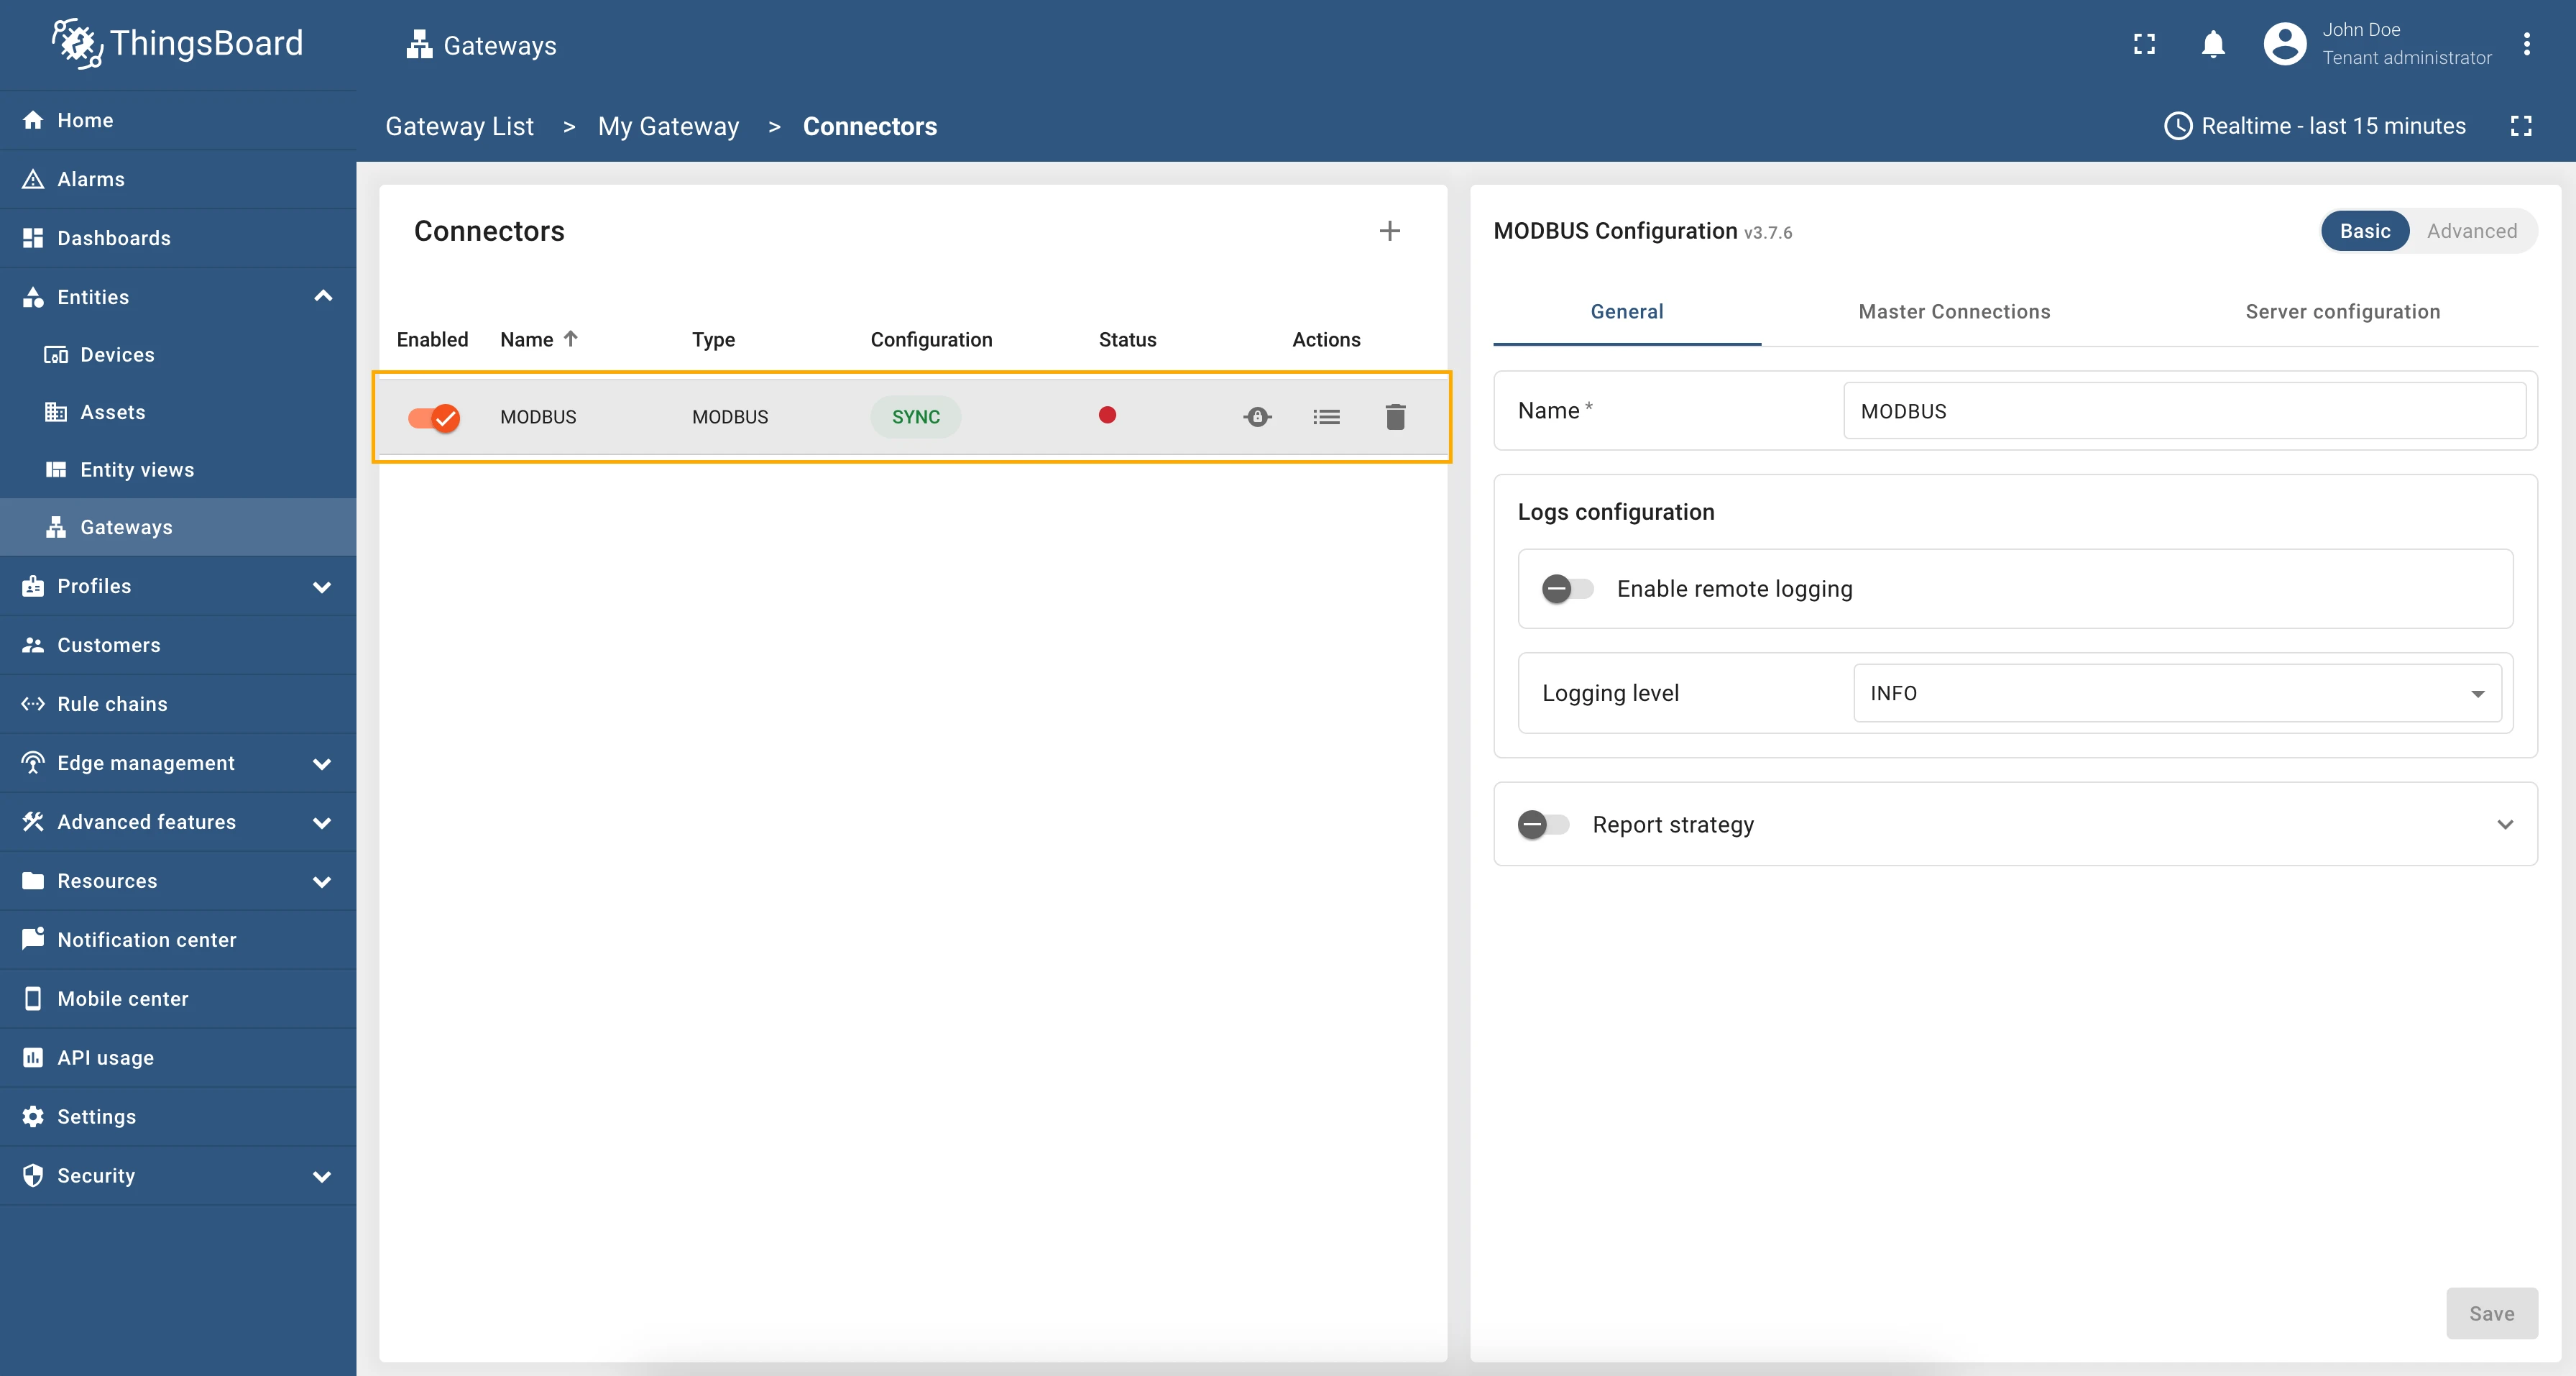
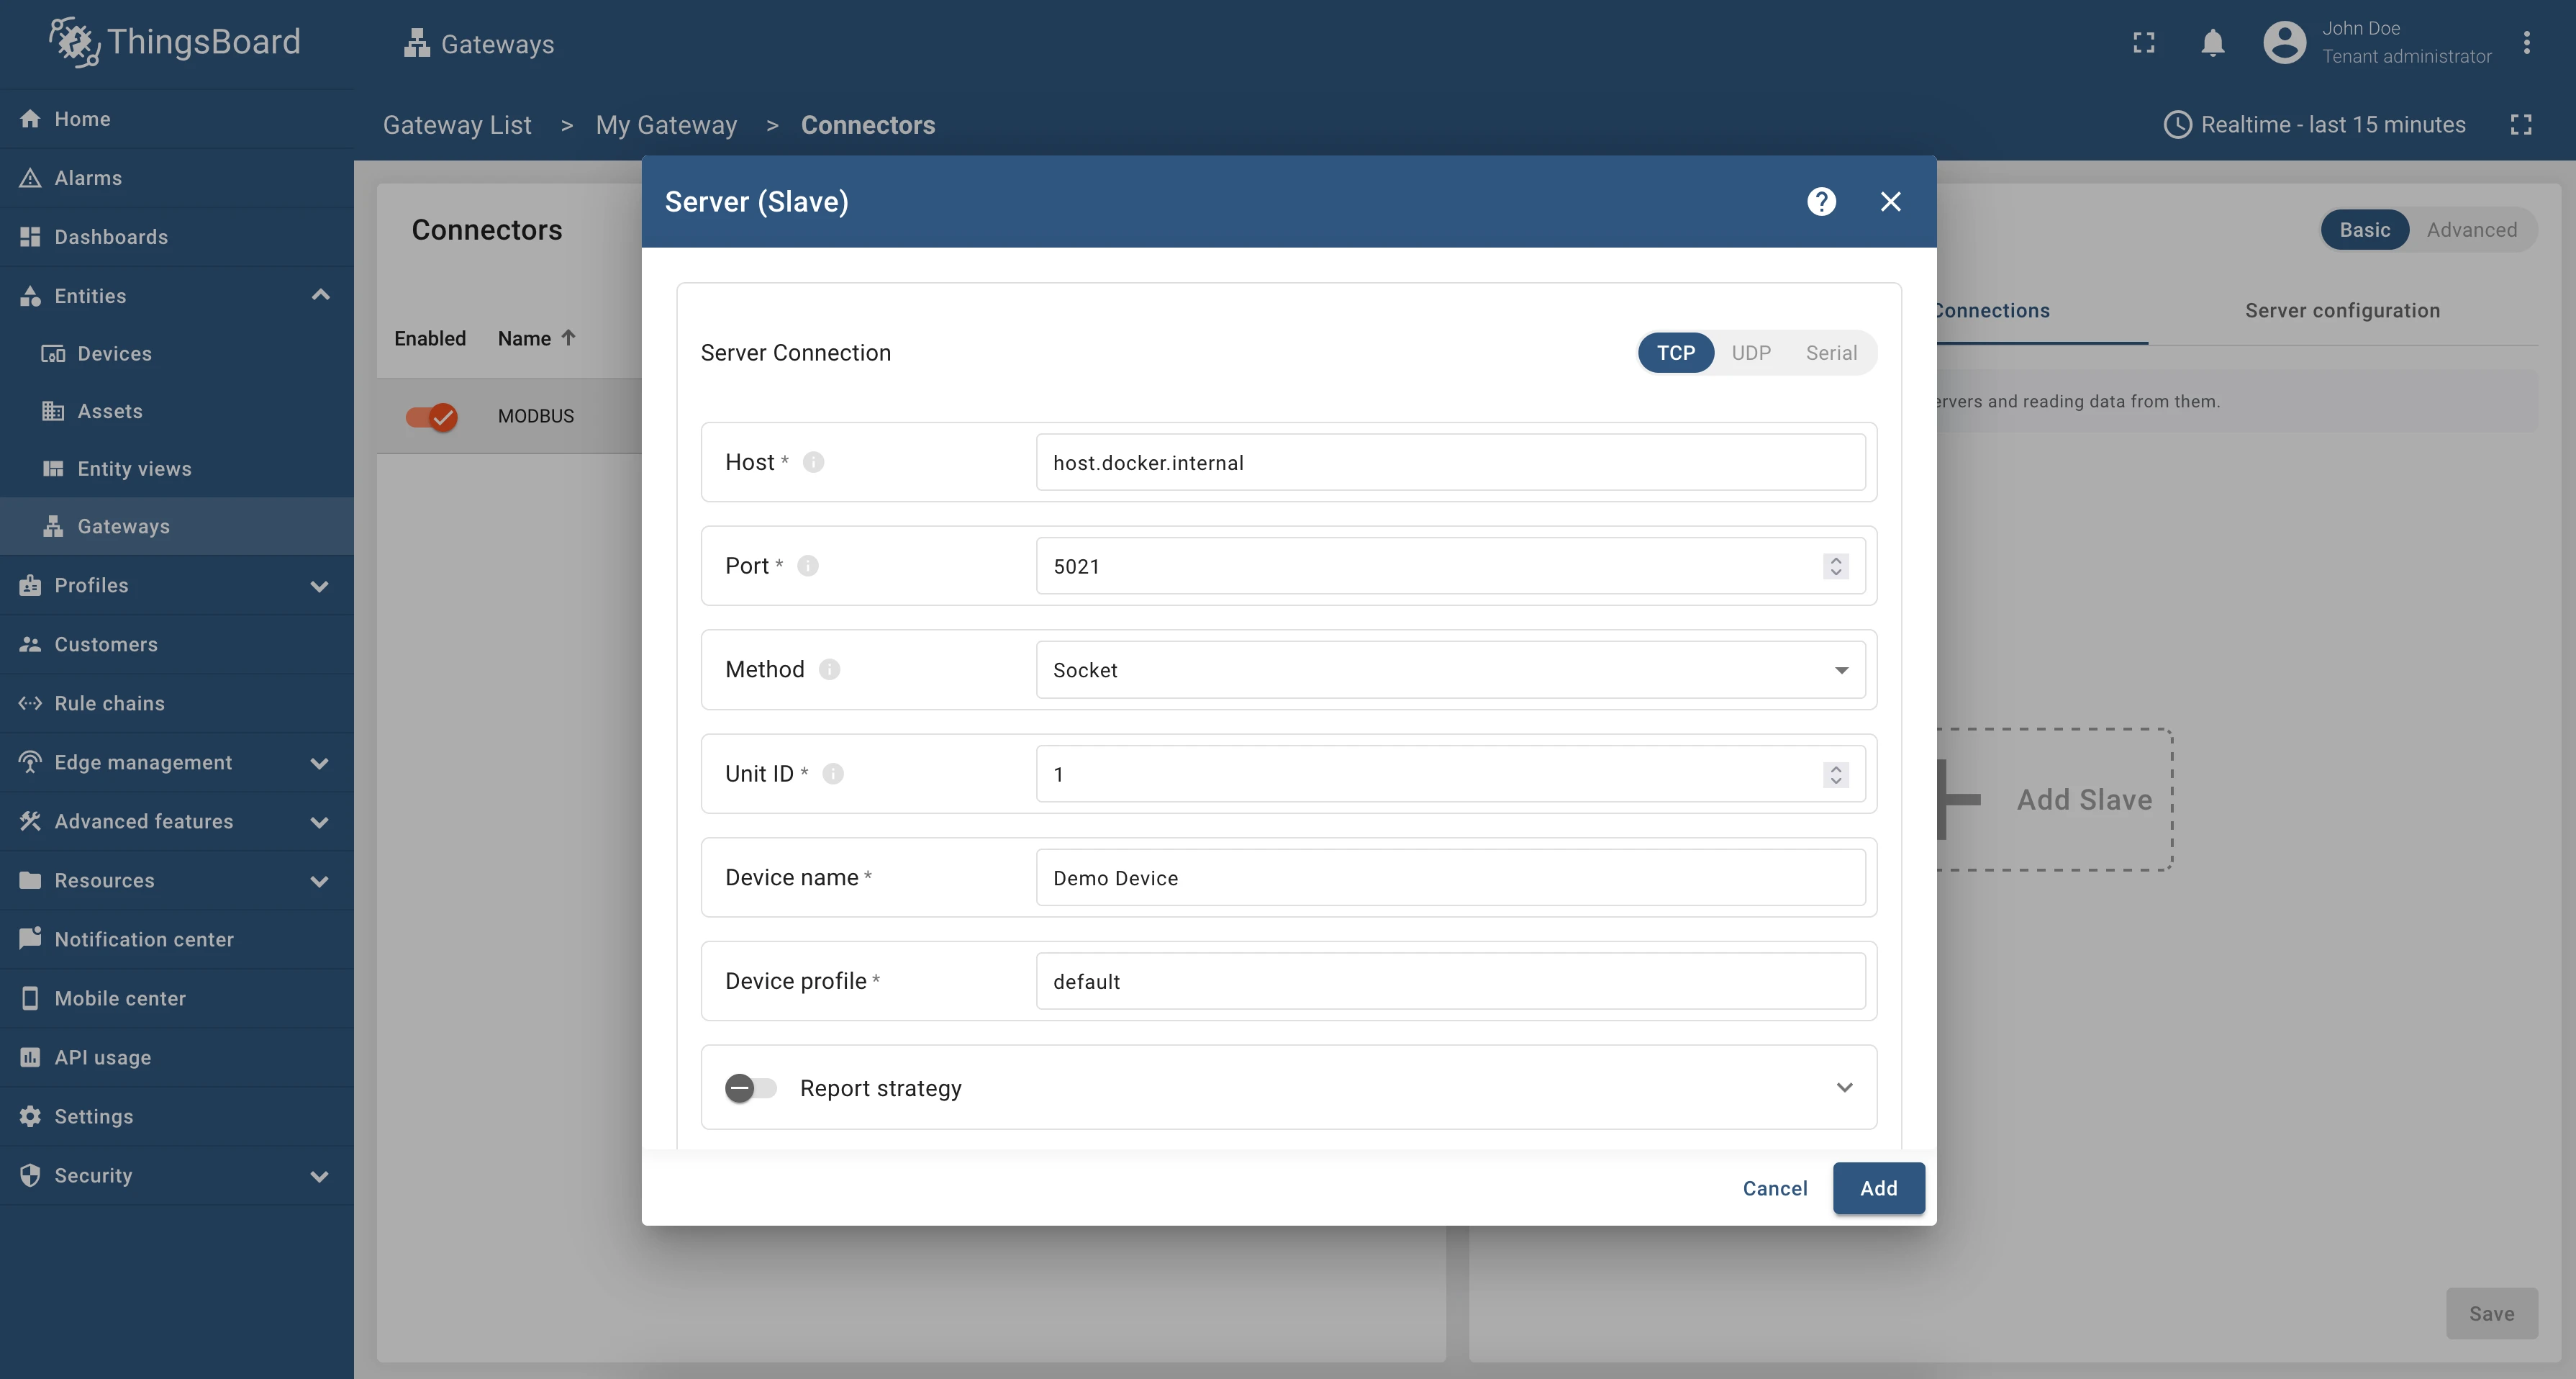
First, we need to add new slave and configure the connection to it. Let’s start from the Master Connections tab. This section offers slave adding and detailed connection configuration options that contains several important fields, including connection type, host, port, unit ID, method, and other.
- Go to the Master Connections tab, and click Add Slave button;
- Fill in fields with the following values:
| Field name | Value |
|---|---|
| Server Connection | TCP |
| Host | host.docker.internal |
| Port | 5021 |
| Method | Socket |
| Unit ID | 1 |
| Device name | Demo Device |
| Device profile | default |

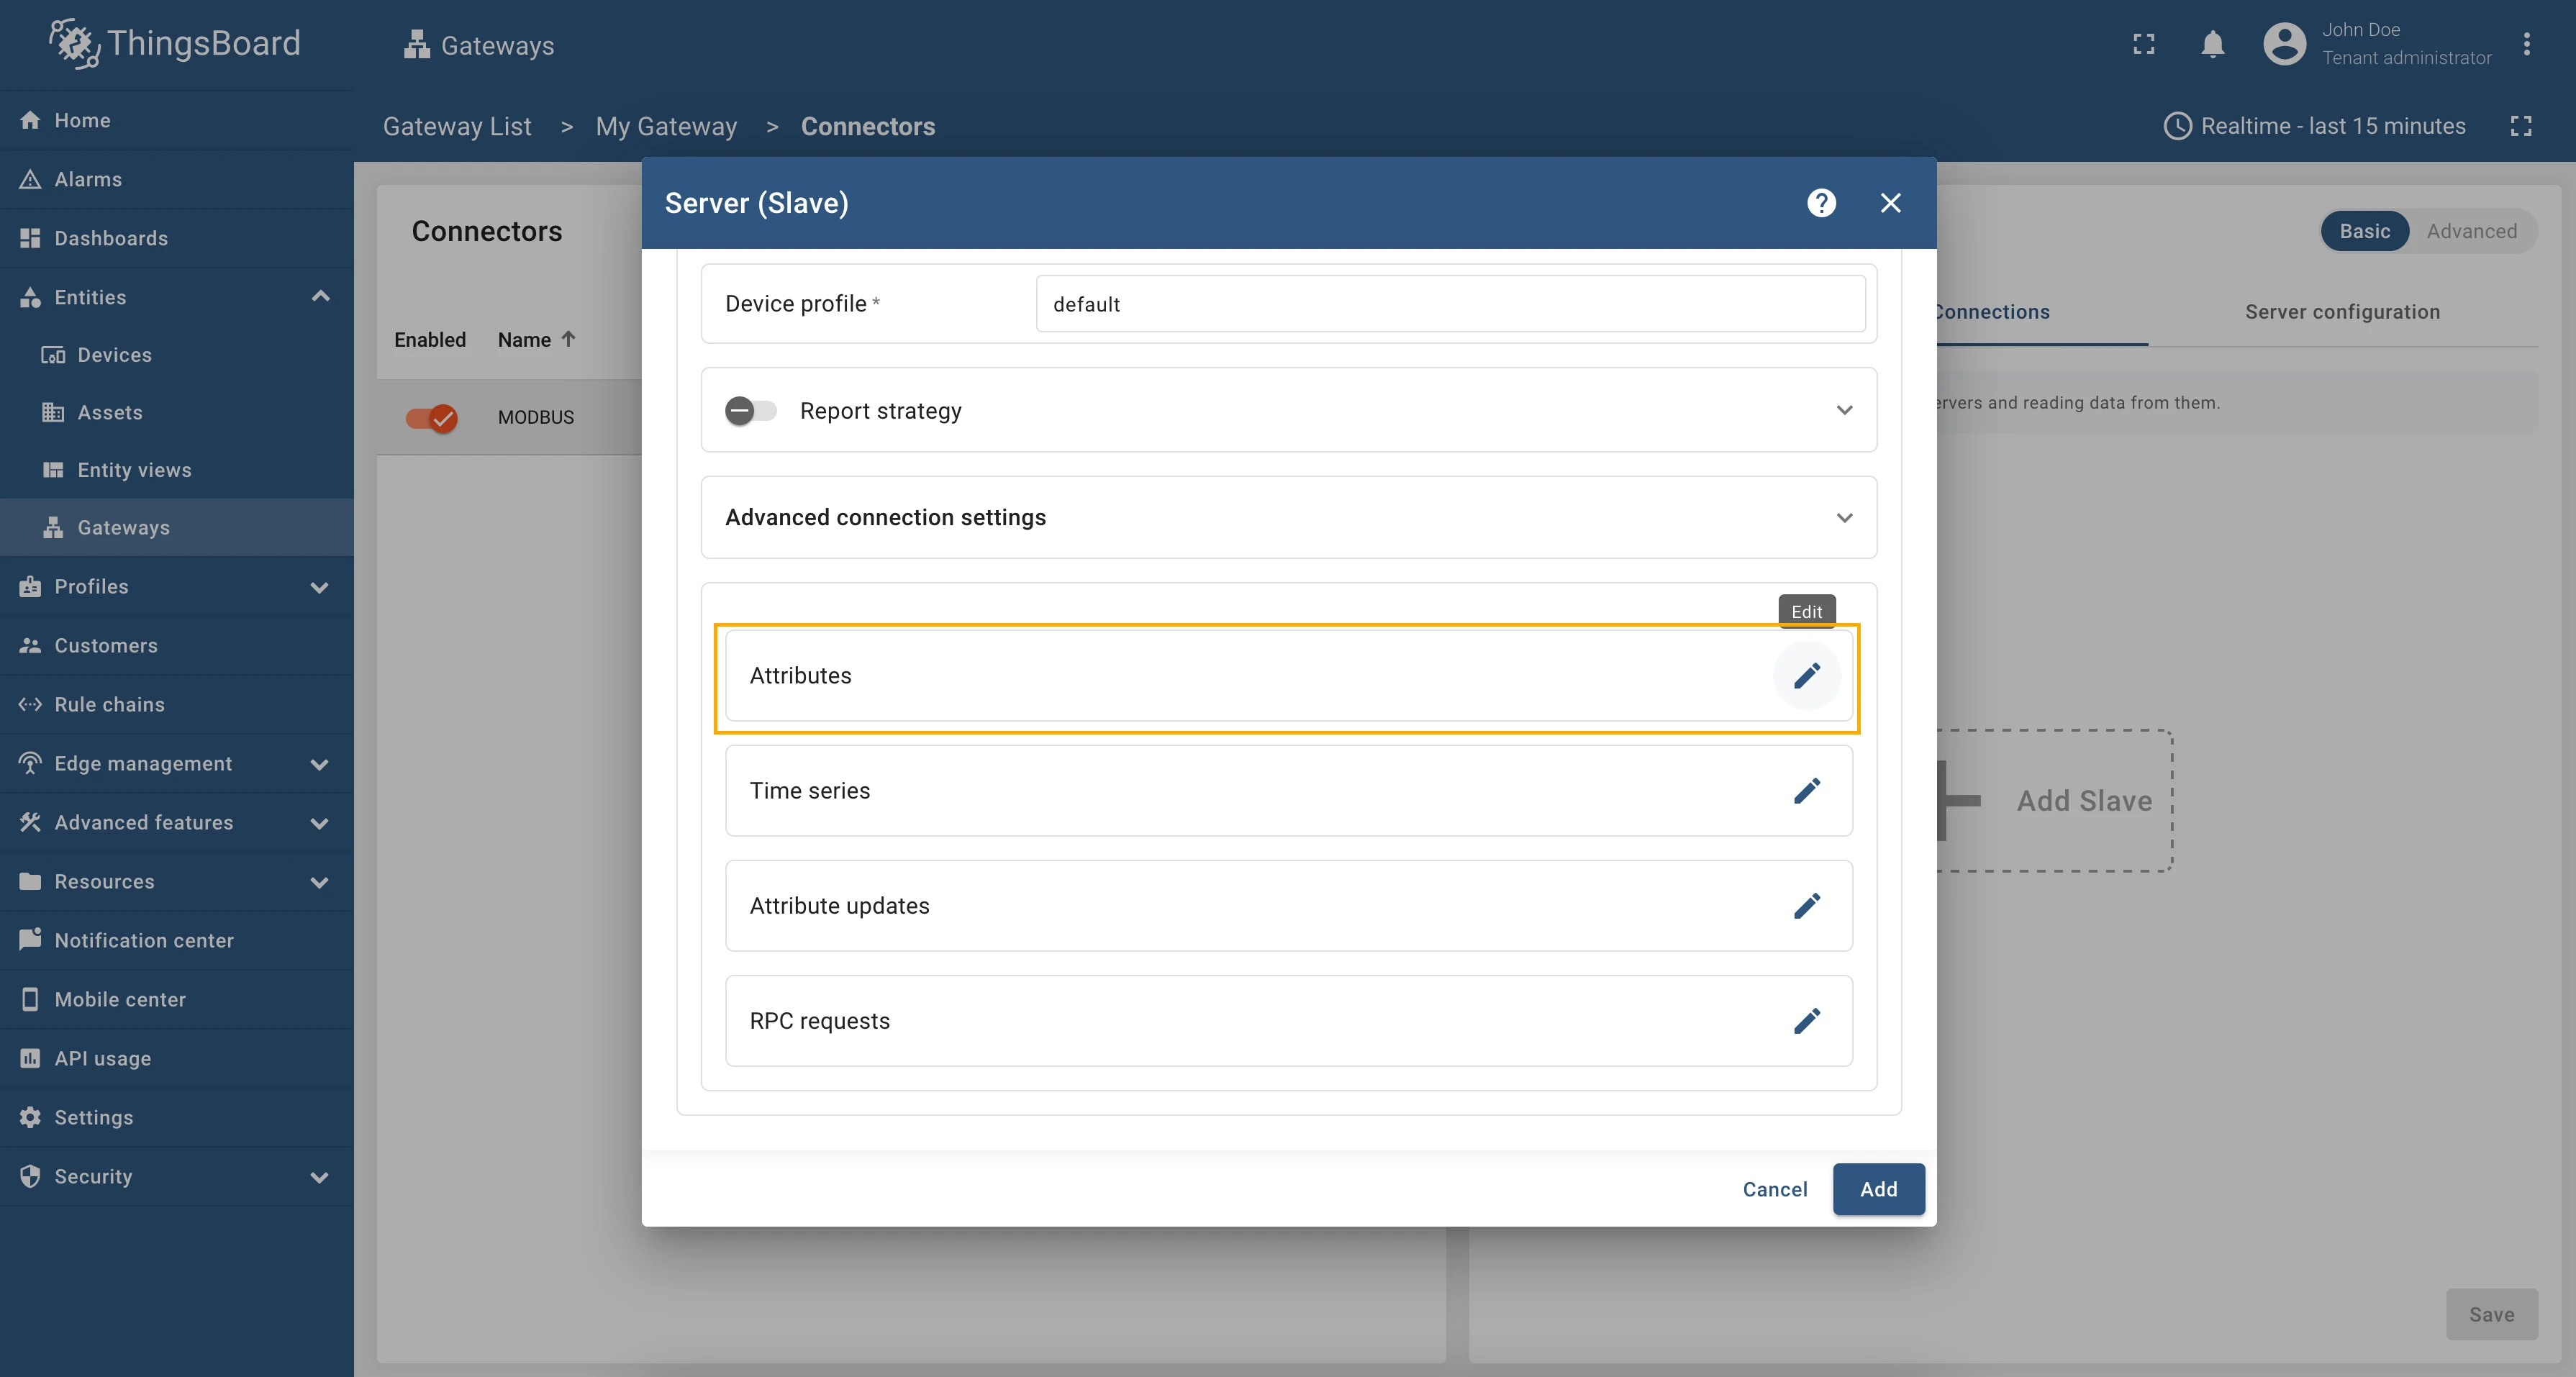
Now, we are ready to move to the Attributes section. The configuration in this unit provides settings for processing data on Modbus server. These settings will be interpreted in the ThingsBoard platform instance as attributes of the device.
Let’s configure attribute section using the following steps:
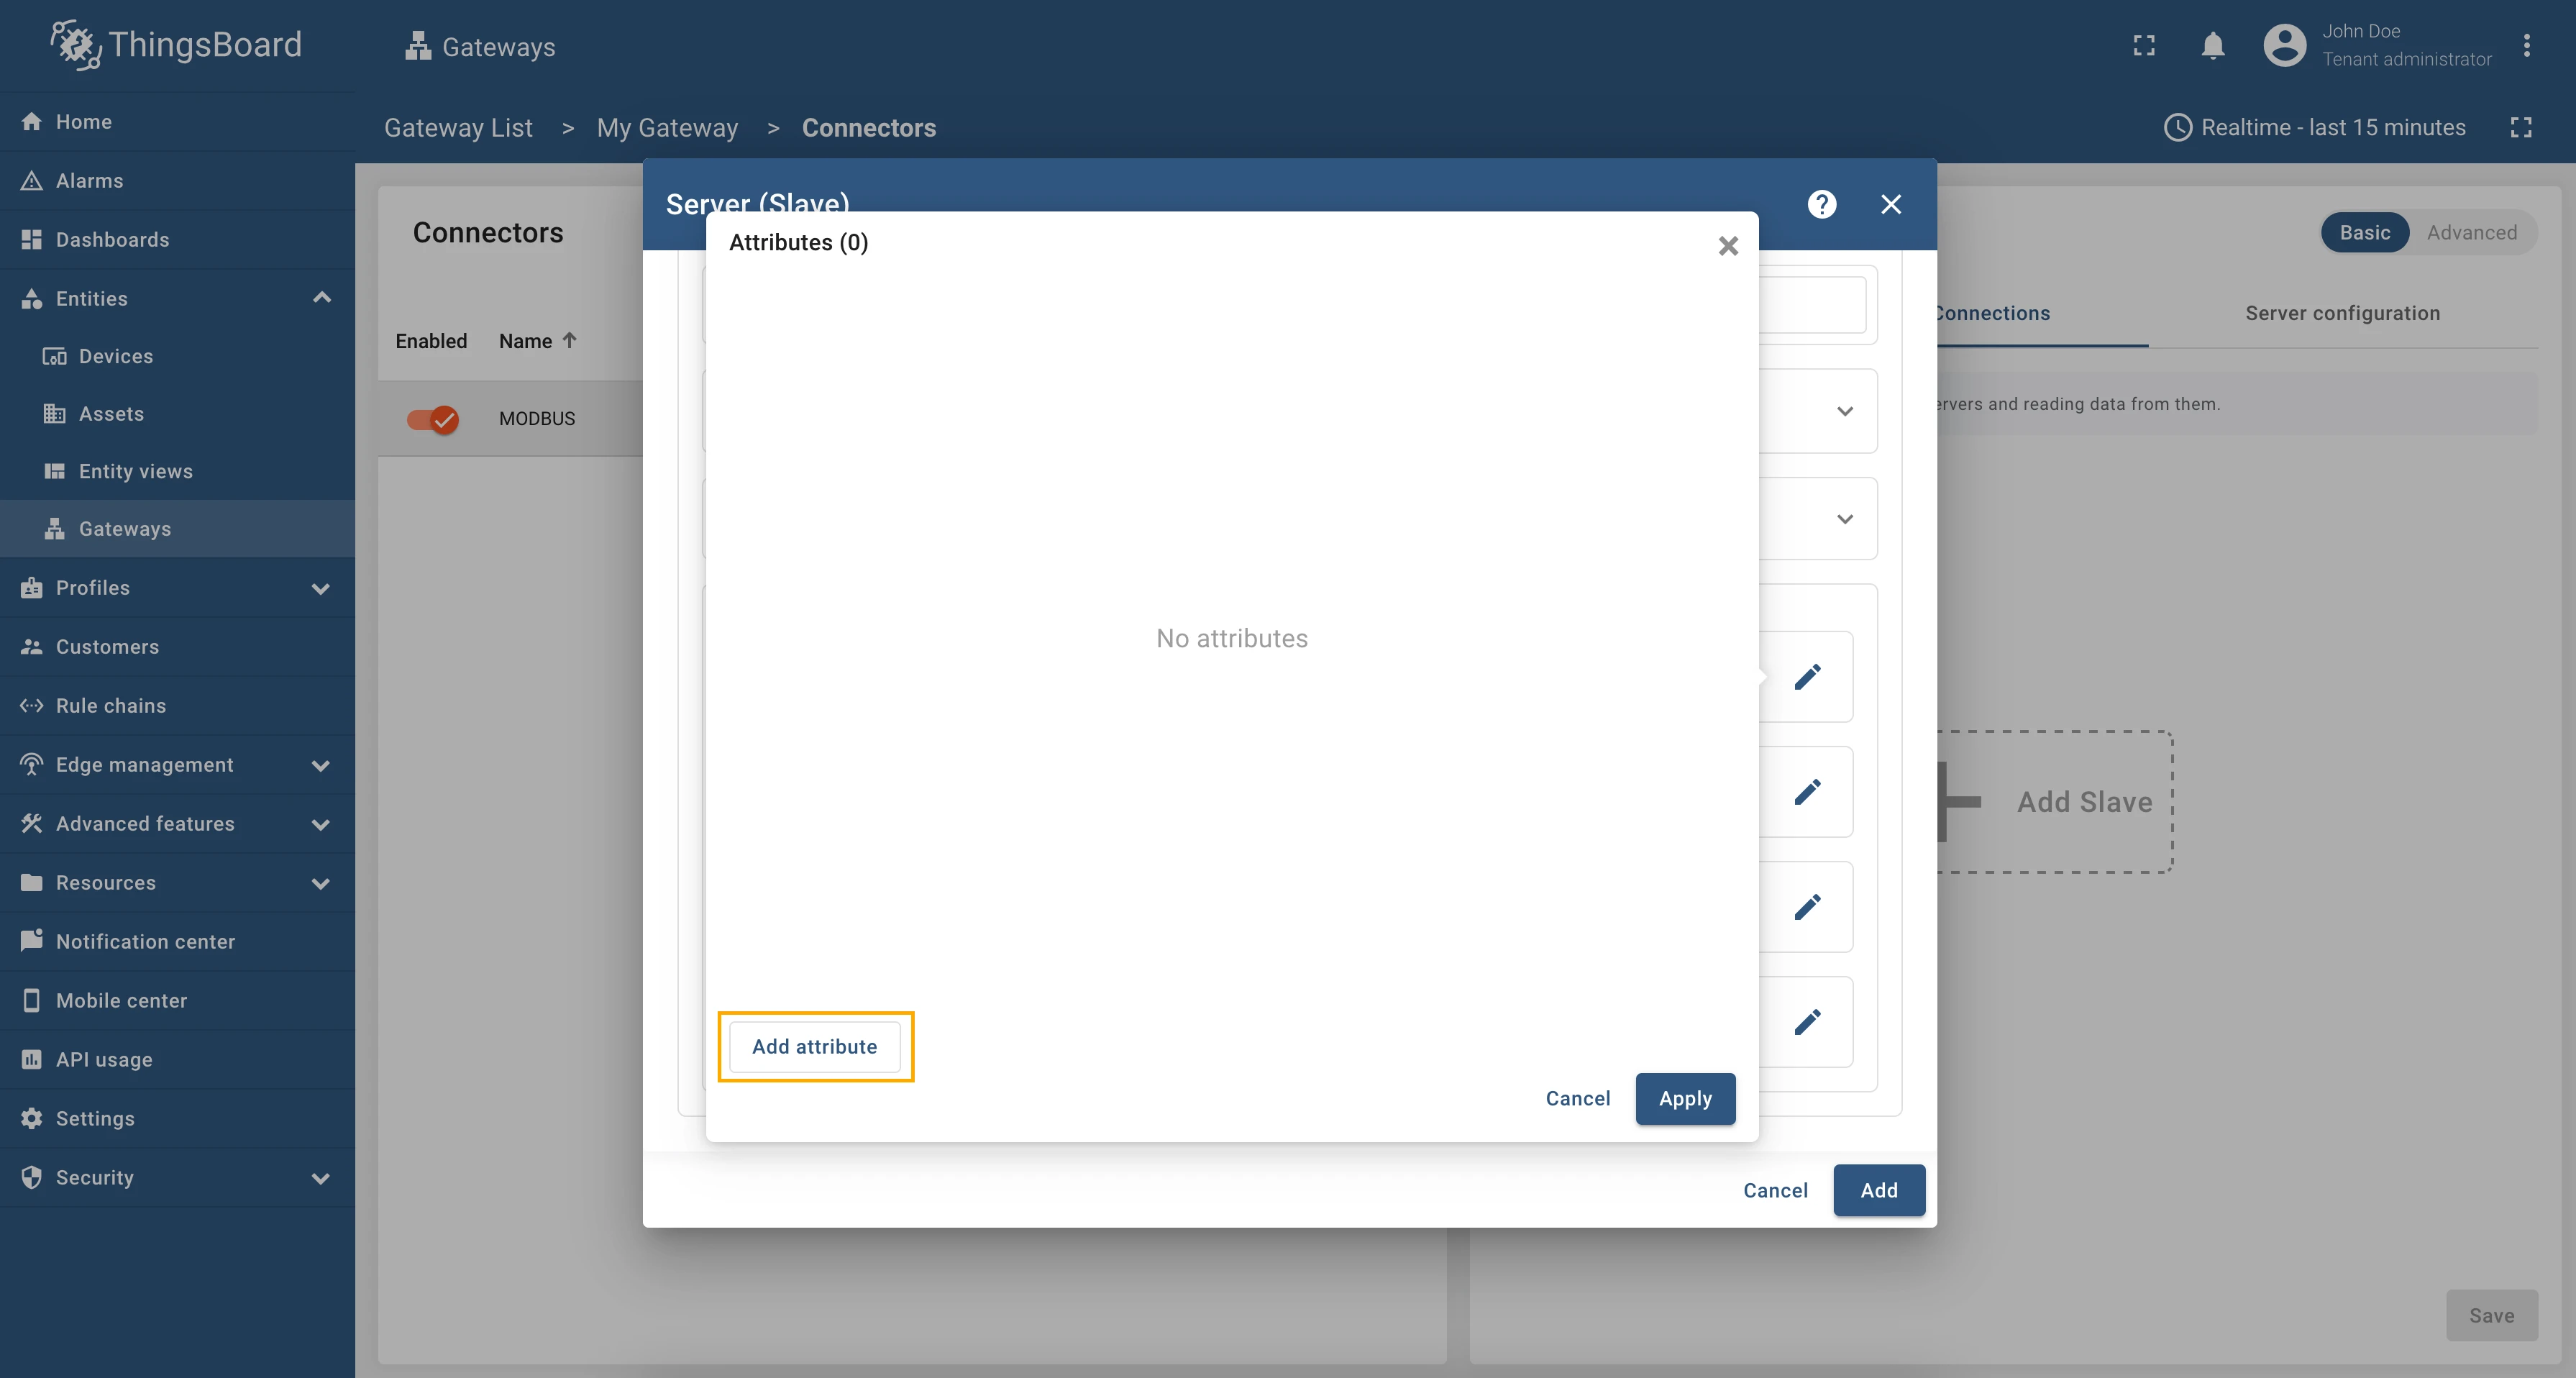
- Click on pencil icon in the Attributes section;
- In the opened window, click on Add attribute button;
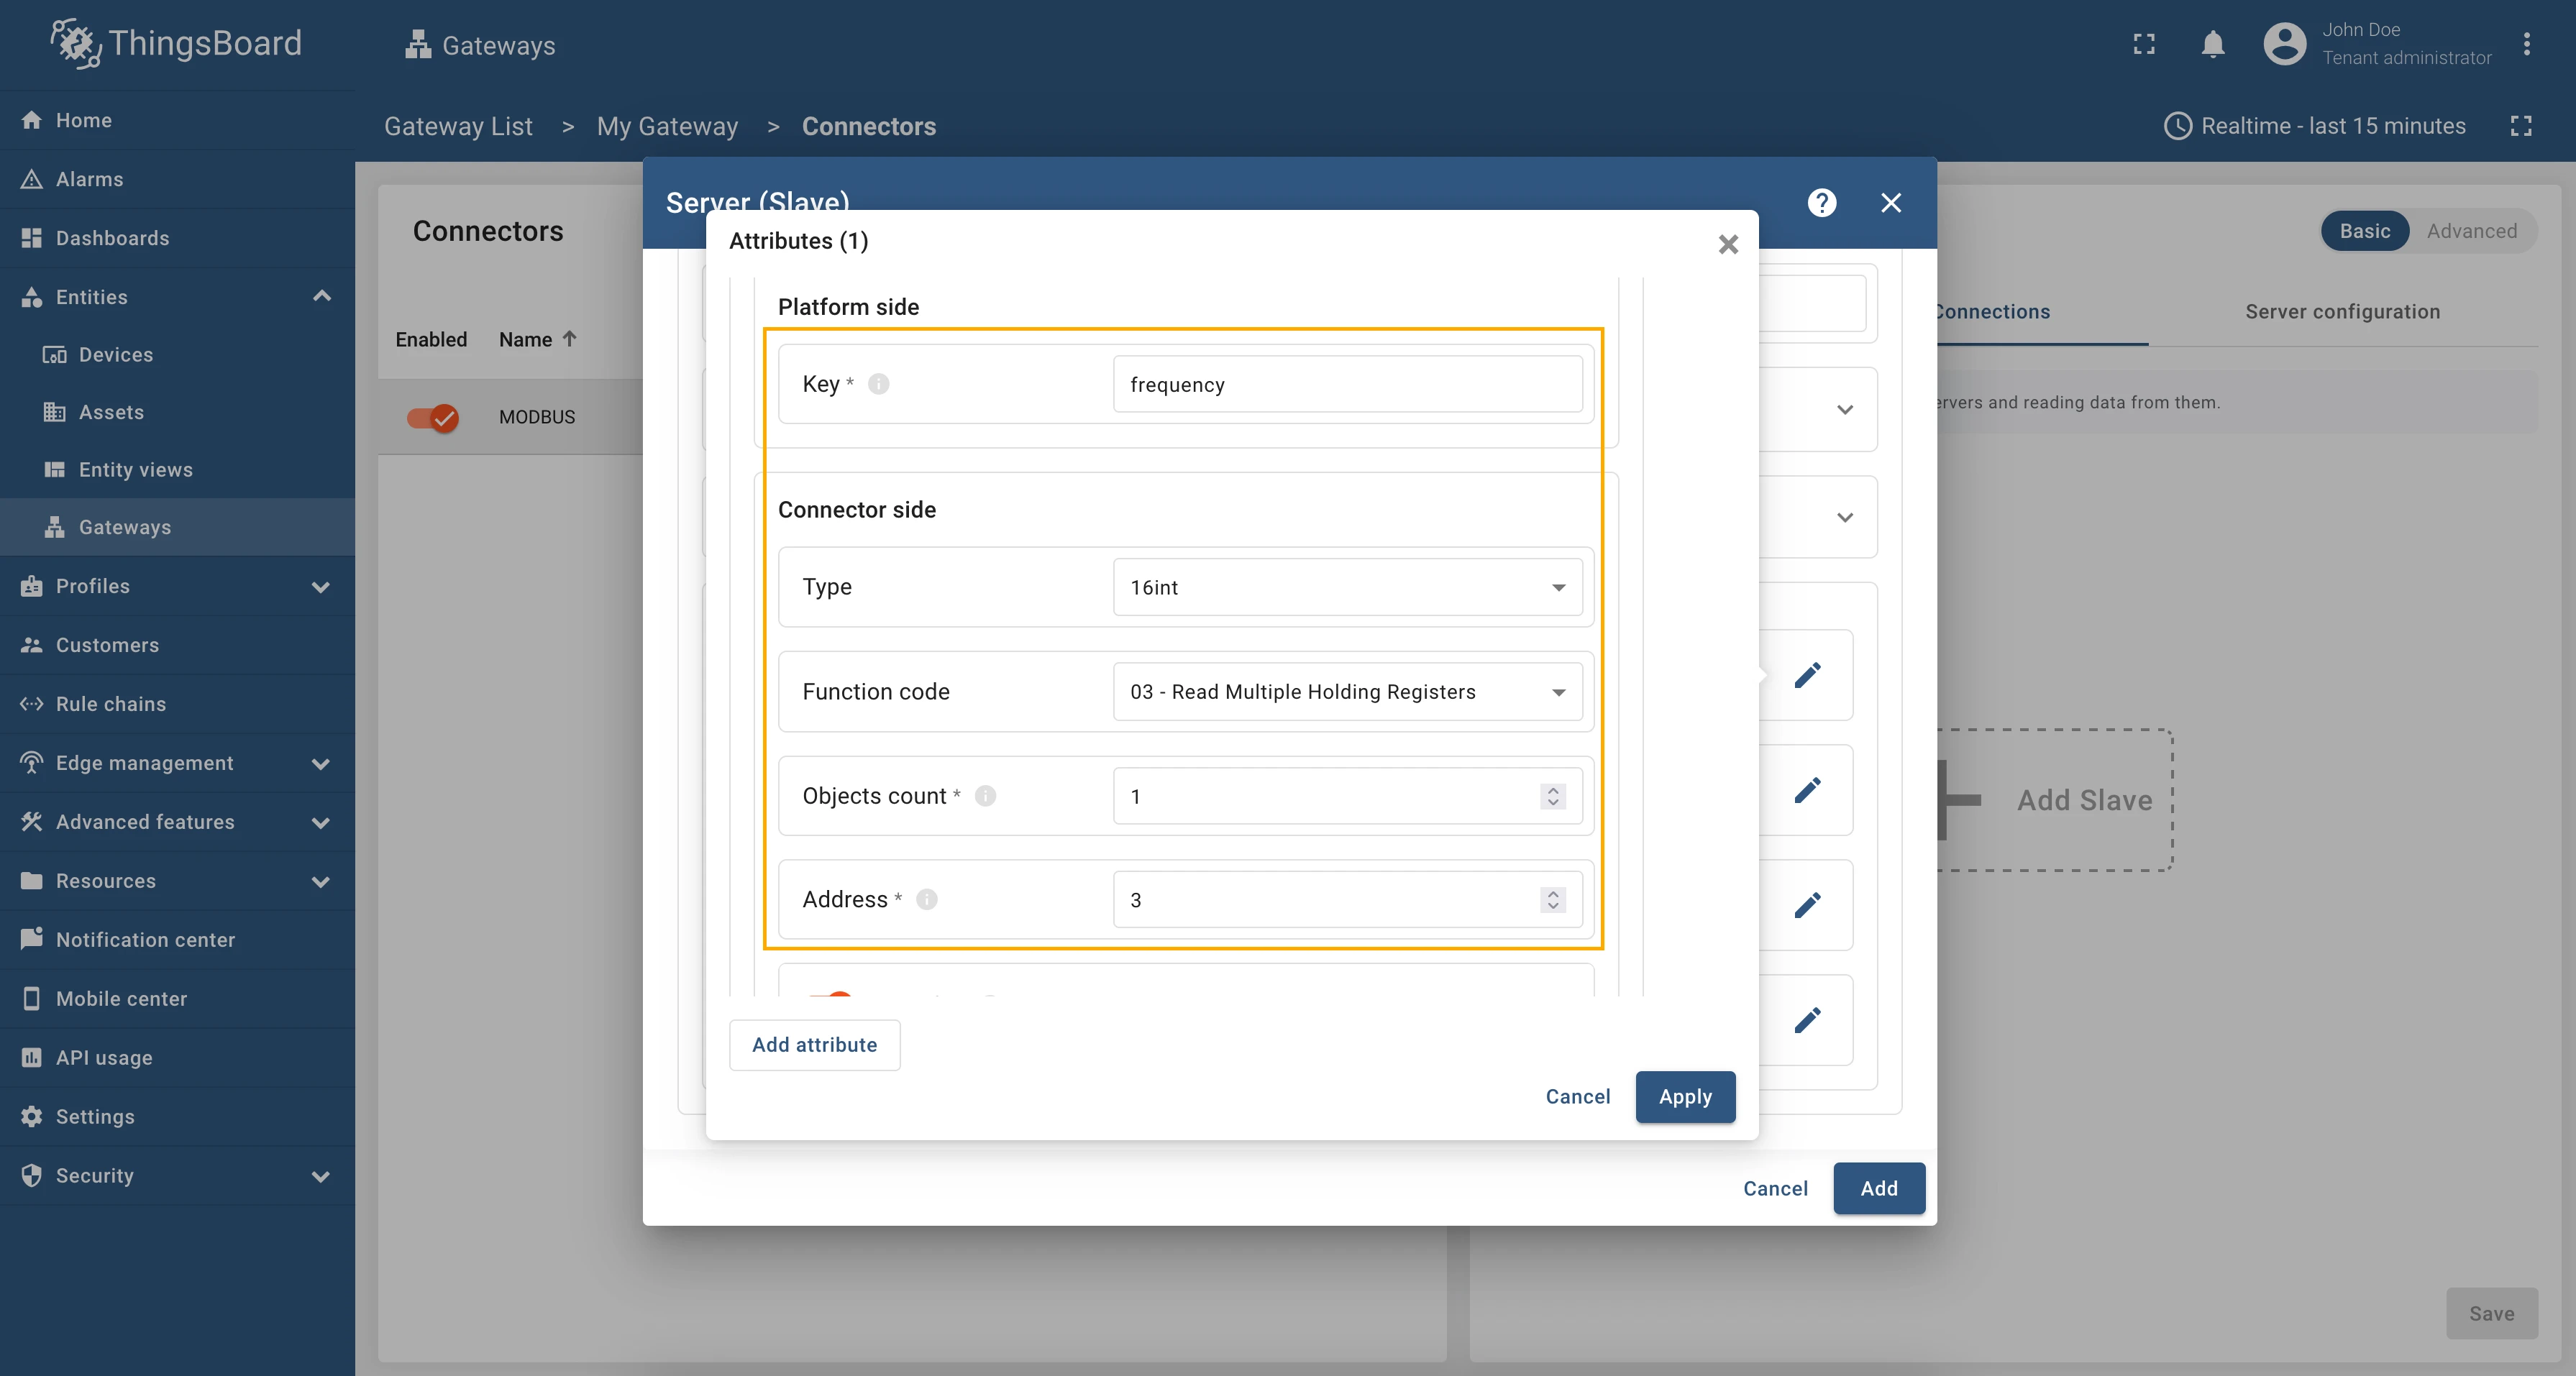
- Fill in the fields:
- Fill the Key field with “frequency”;
- Select the Type field to “16int”;
- Select the Function code to “03 - Read Multiple Holding Registers”;
- Set Objects count to “1”;
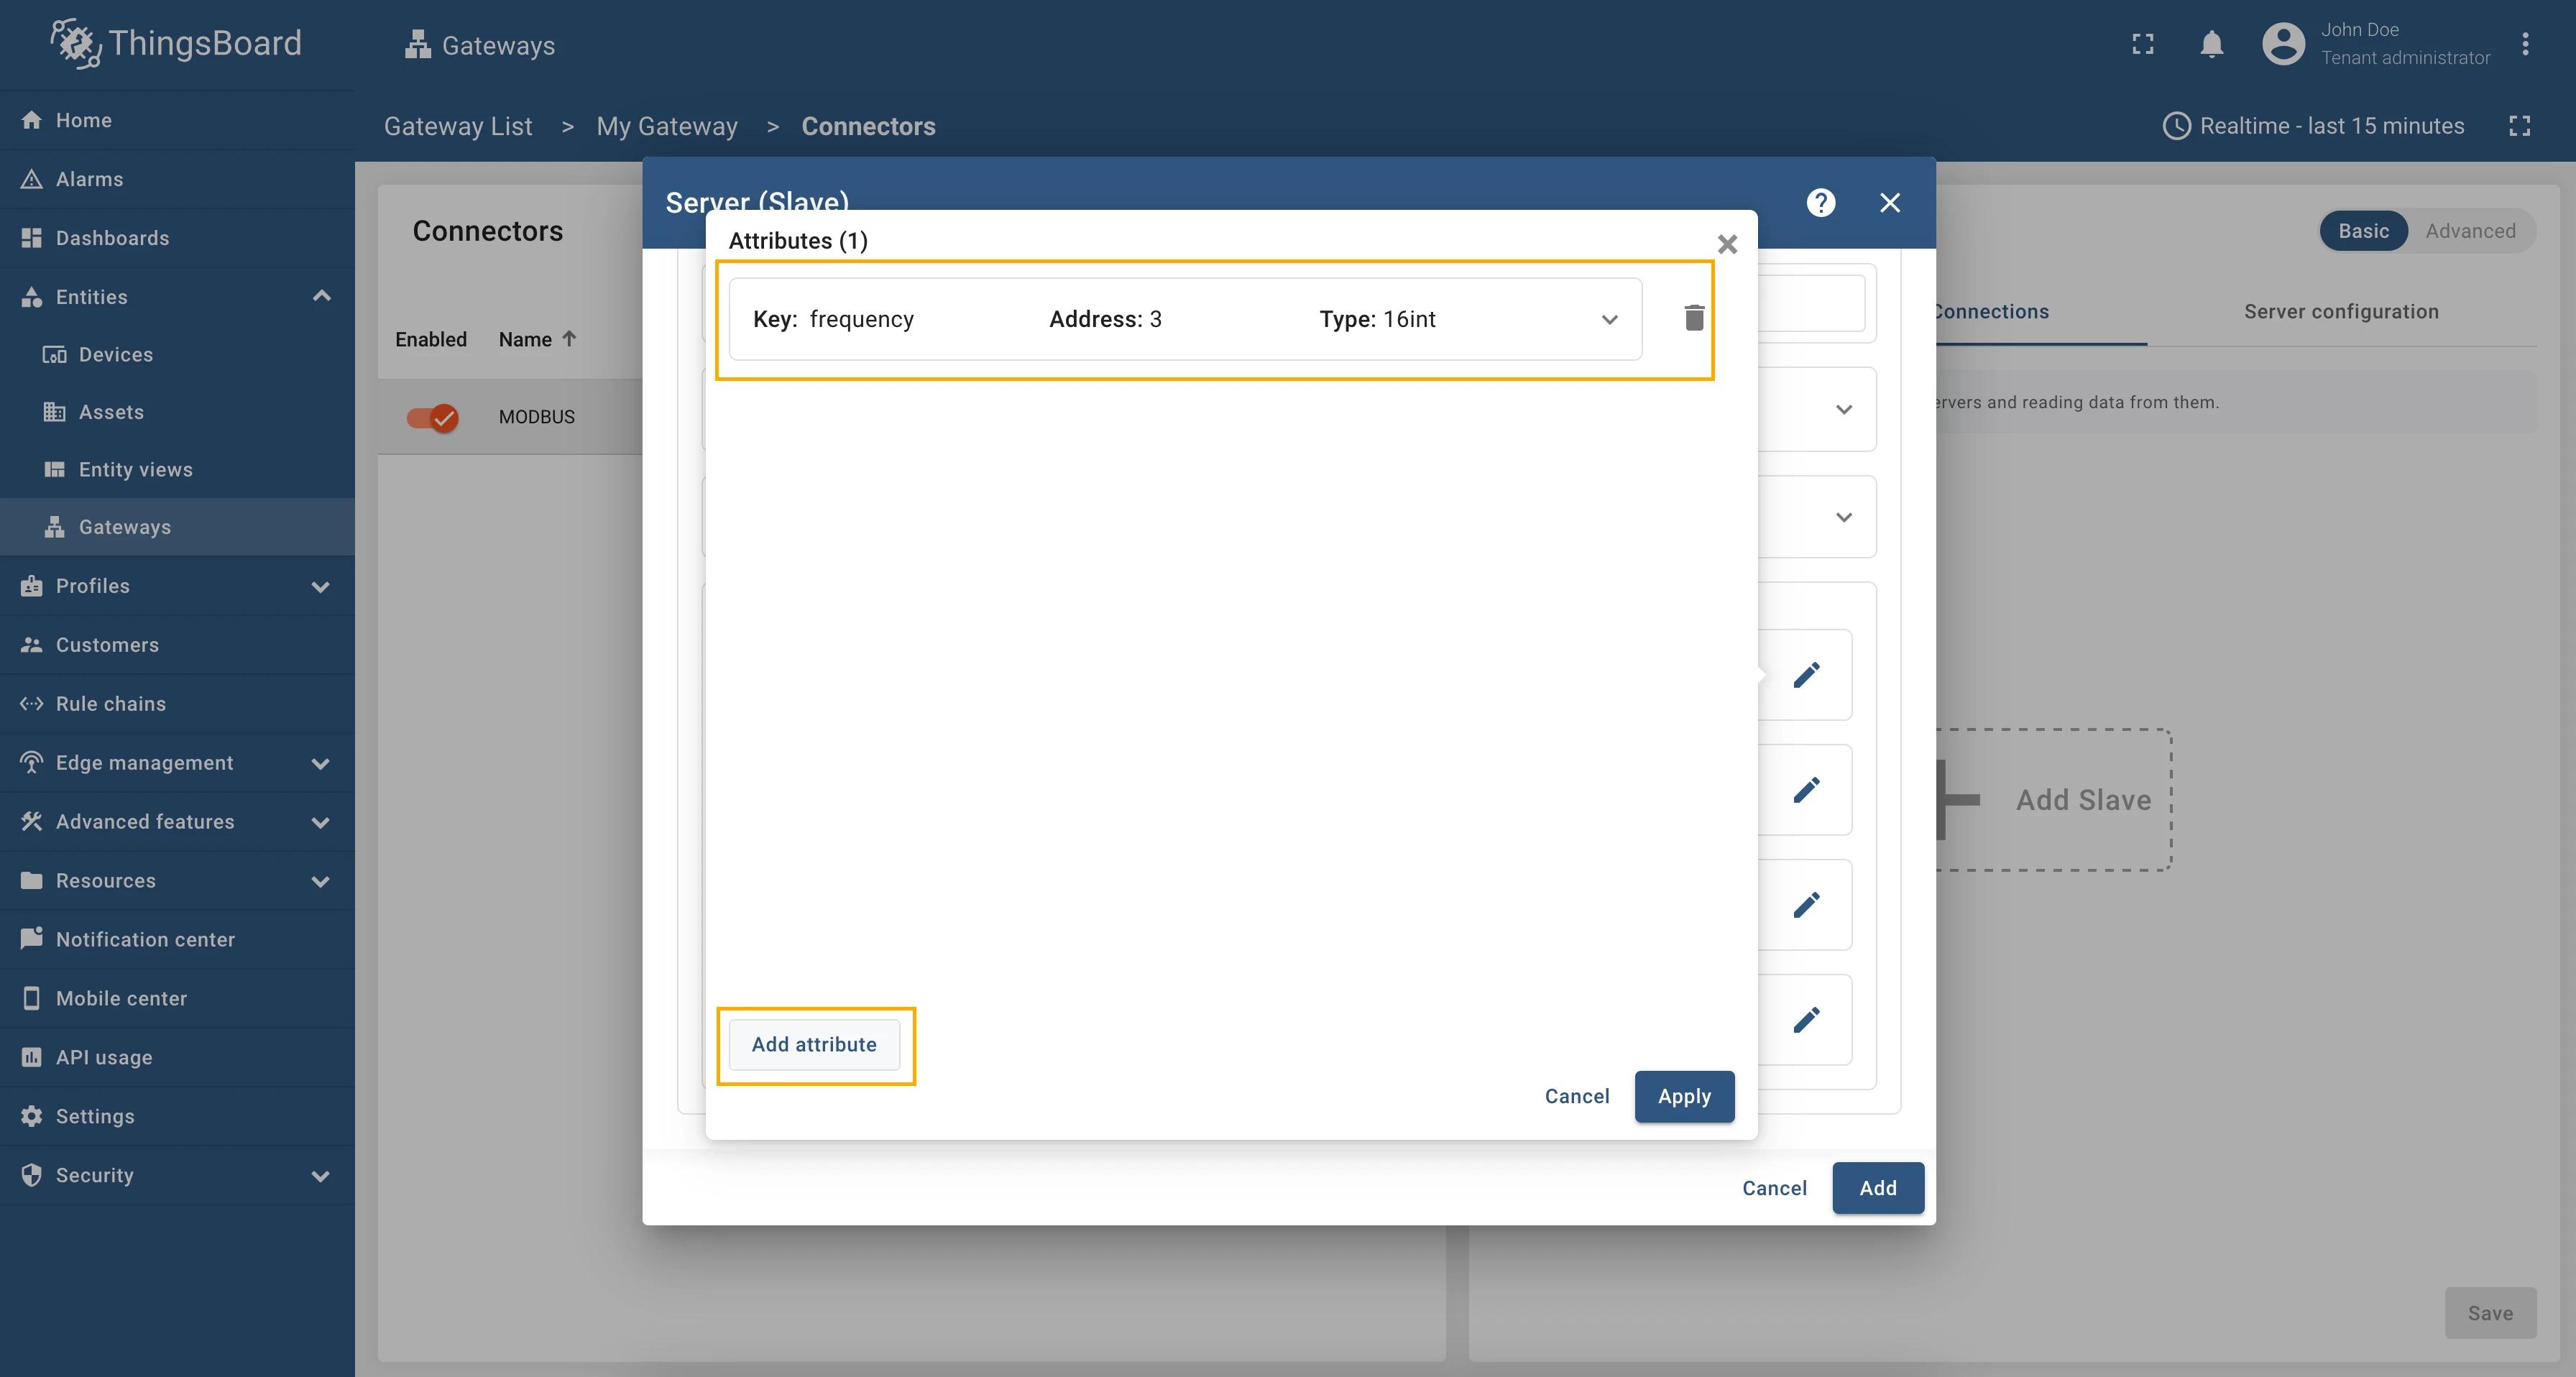
- Set Address field to “3”.
- Enable the Modifier toggle;
- In the Modifier section, set the Type field to “divider”;
- In the Modifier section, set the Value field to “10”.
Let’s add another attribute. Collapse the recently added “frequency” attribute, click the Add attribute button, and fill in the fields with the following values, using the same process as before:
| Field name | Value |
|---|---|
| Key | power |
| Type | 16int |
| Function code | 3 |
| Objects count | 1 |
| Address | 2 |
| Modifier | Divider |
| Modifier Value | 10 |
Click the Apply button after you’ve completed the Attributes section configuration.

We finish with the Attributes section, so let’s move to the Time series section. The configuration in this unit provides settings for processing data on Modbus server. These settings will be interpreted in ThingsBoard platform instance as time series of the device.
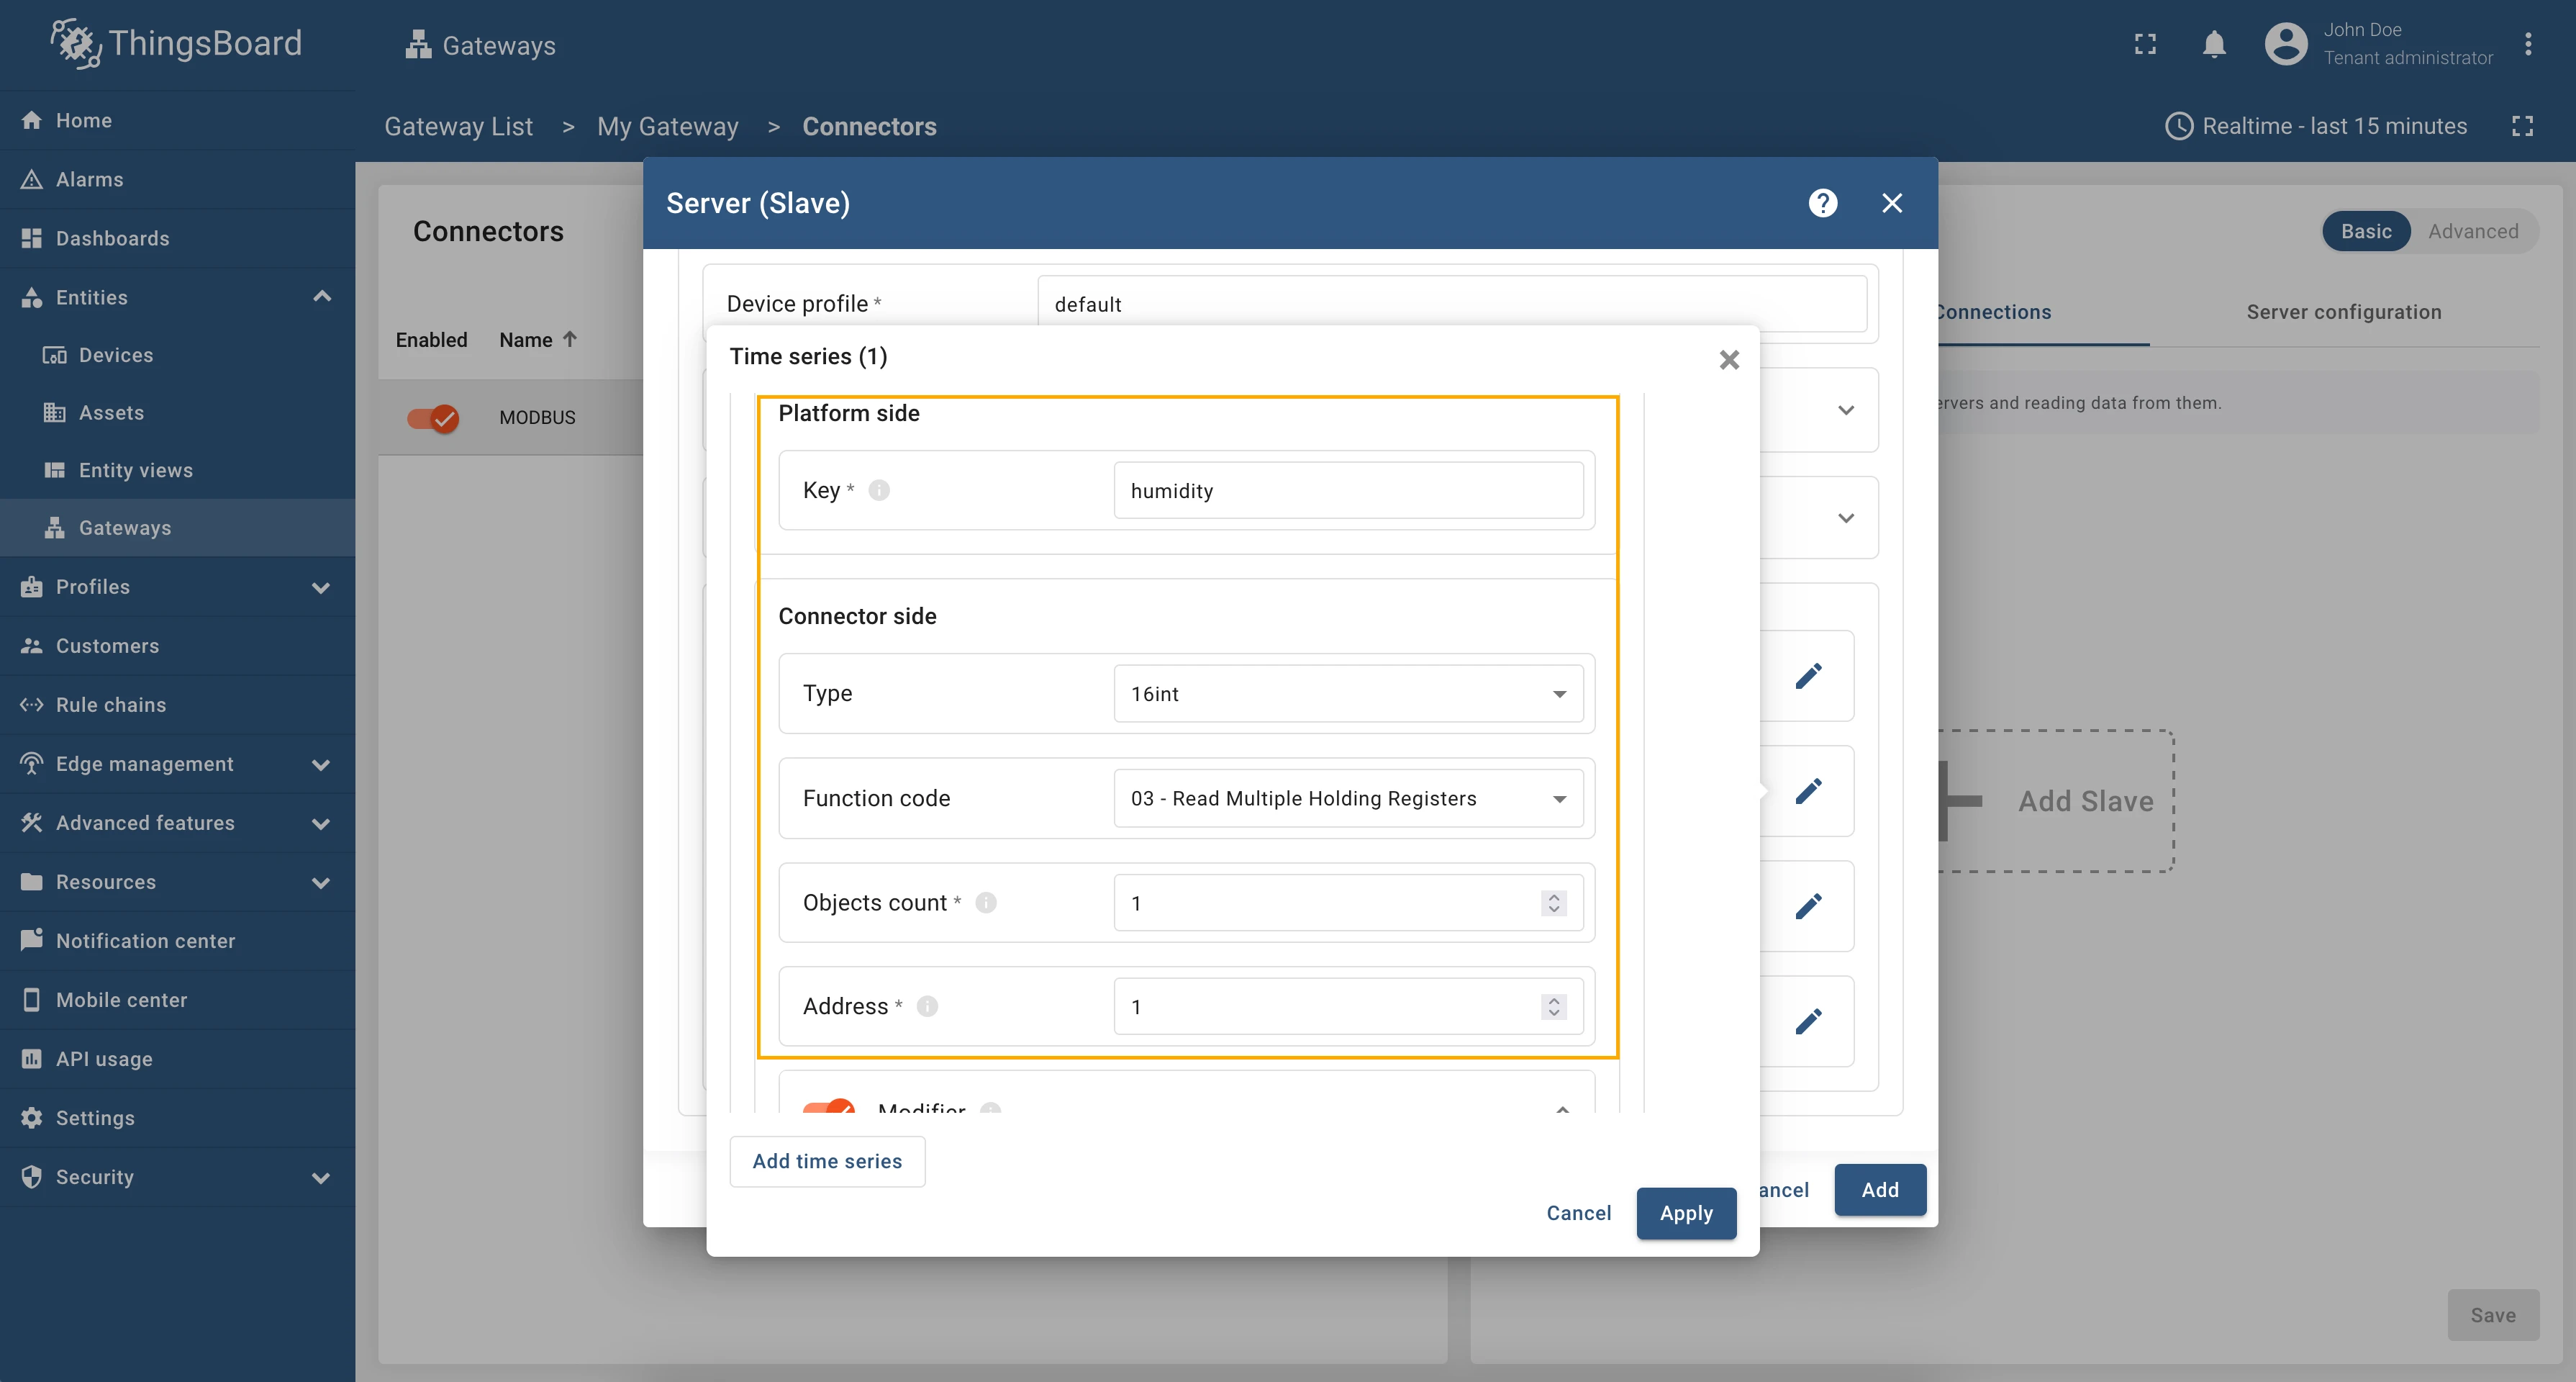
Let’s configure time series section using the following steps:
- Click on pencil icon on Time series section.
- In the opened window, click on Add time series button;
- Fill in the fields:
- Fill the Key field with “humidity”;
- Select the Type field to “16int”;
- Select the Function code to “03 - Read Multiple Holding Registers”;
- Set Objects count to “1”;
- Set Address field to “1”;
- Enable the Modifier toggle;
- In the Modifier section, set the Type field to “divider”;
- In the Modifier section, set the Value field to “10”.


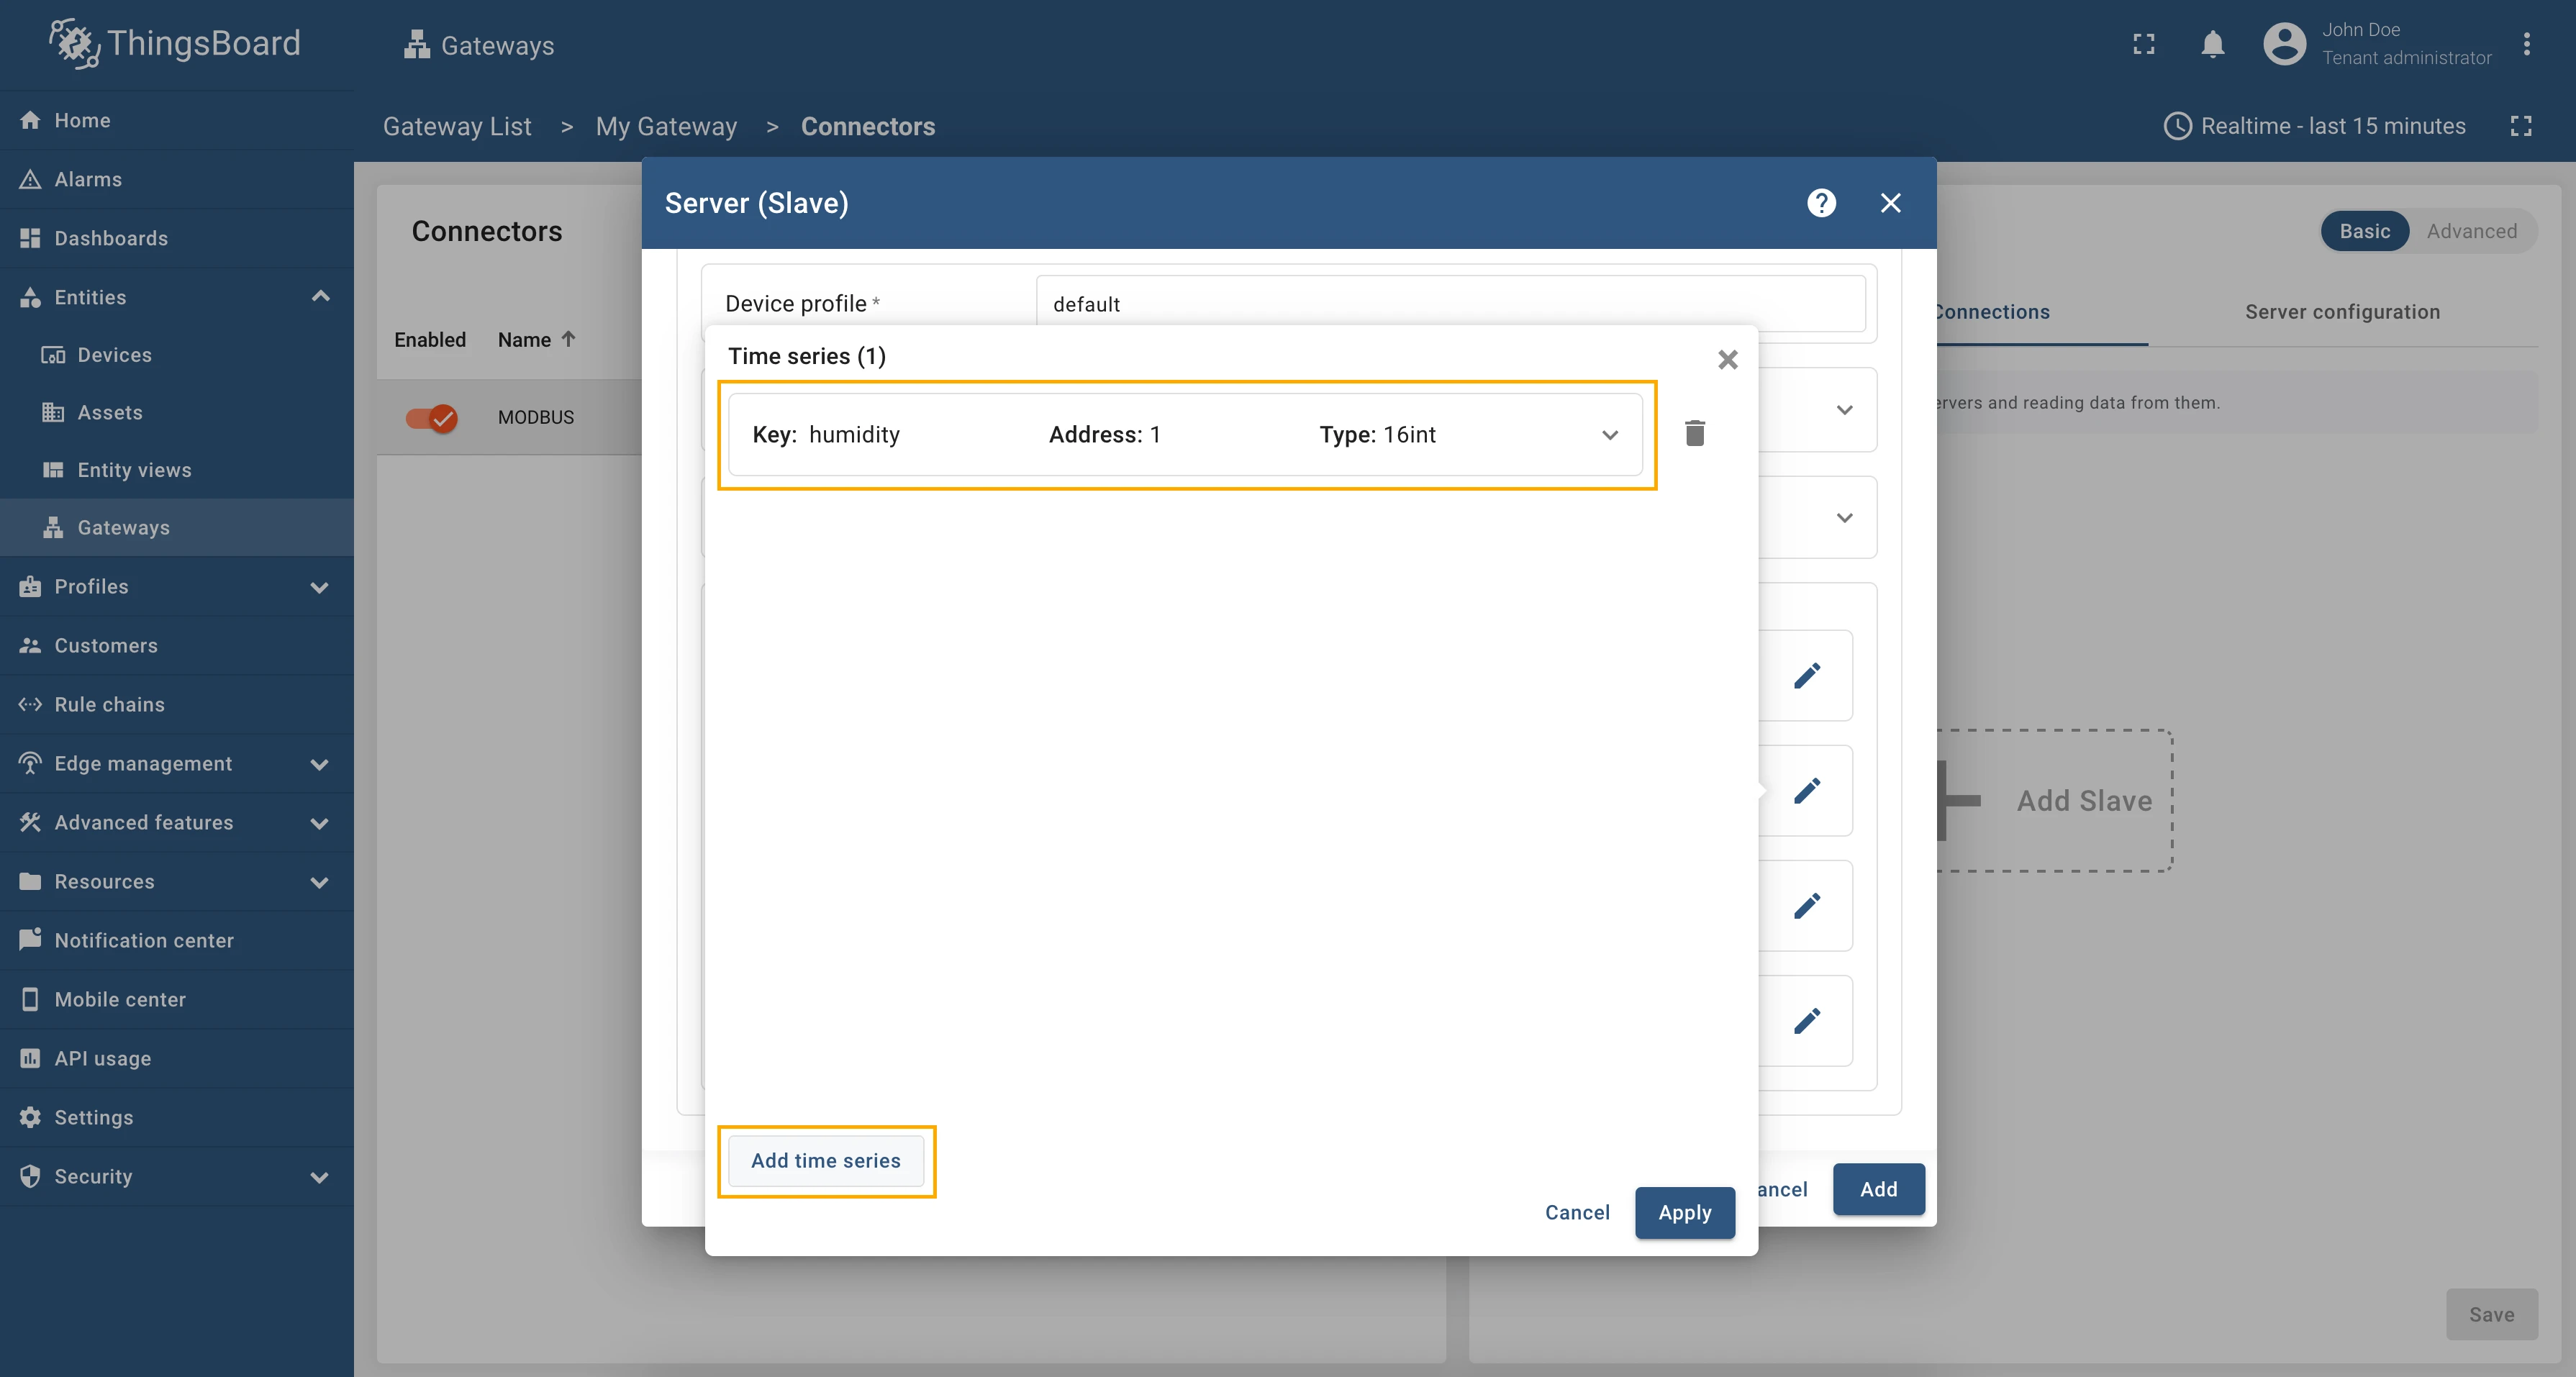
Let’s add another time series. Collapse the recently added “humidity” time series, click the Add time series button, and fill in the fields with the following values, using the same process as before:
| Field name | Value |
|---|---|
| Key | temperature |
| Type | 16int |
| Function code | 3 |
| Objects count | 1 |
| Address | 0 |
| Modifier | Divider |
| Modifier Value | 10 |

The final view of your configured connector will look like on the following image. Click the Add button after you’ve completed the configuration.
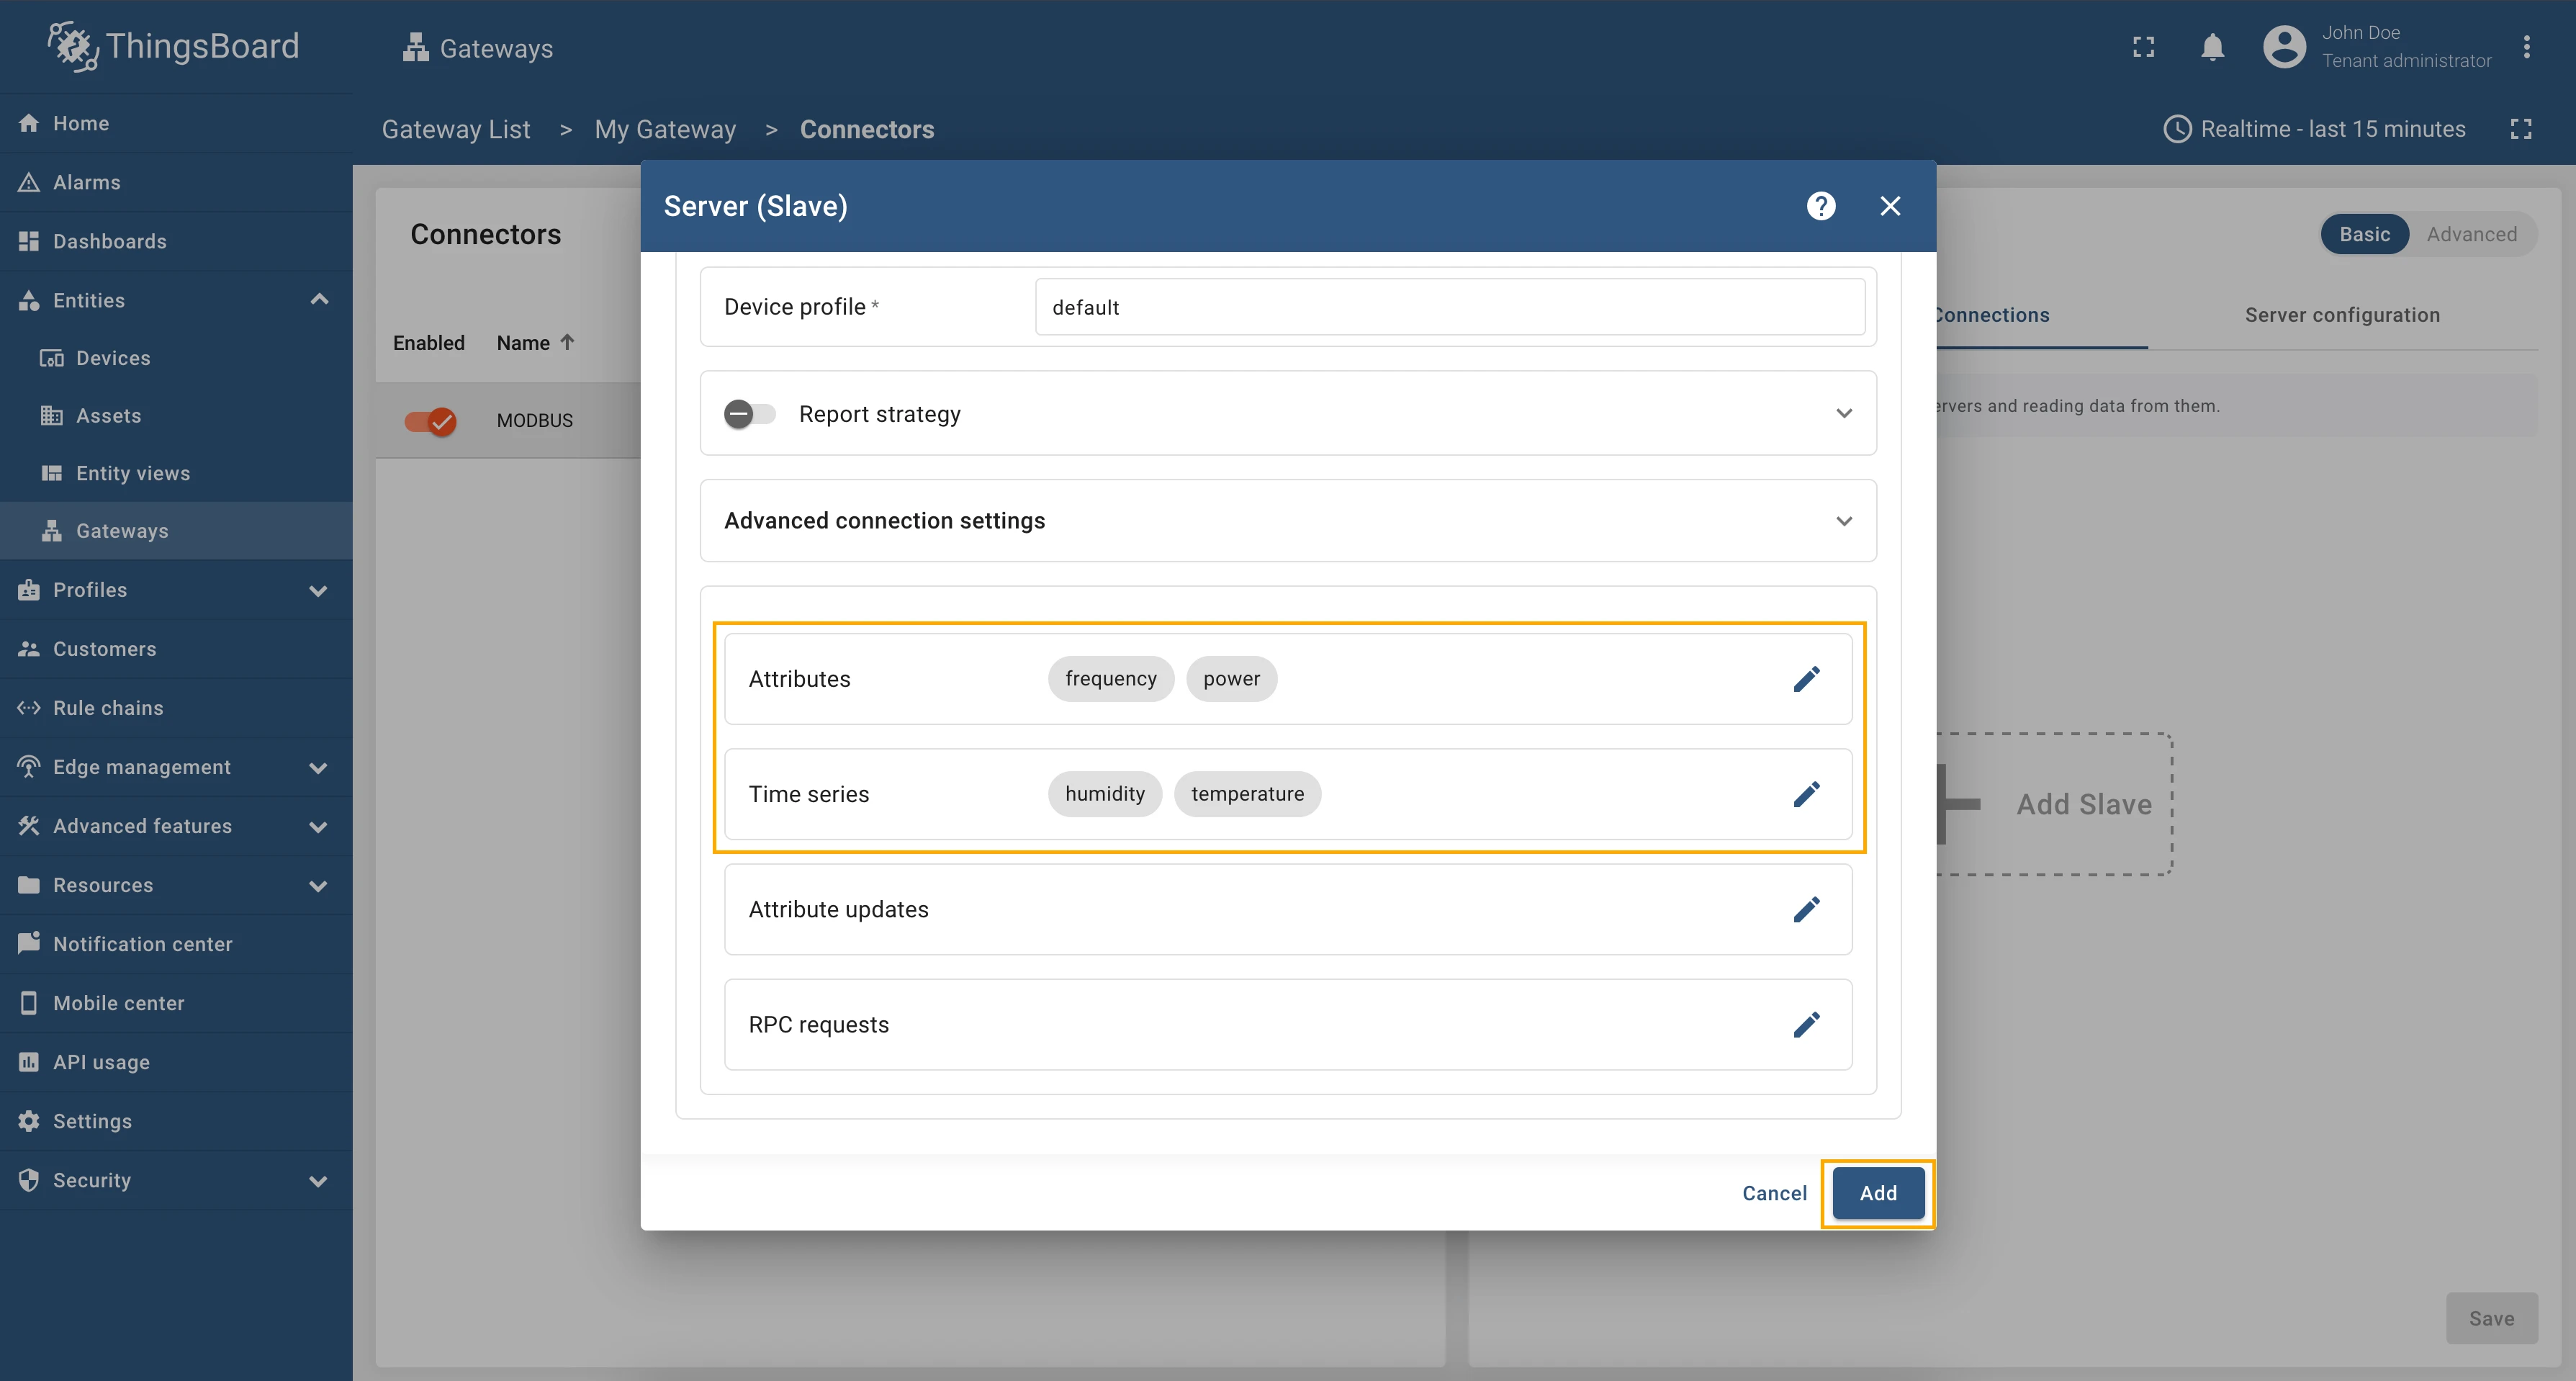
Finally, save the Modbus configuration by clicking the Save button.

Following the steps outlined, your gateway will receive and apply the new configuration. It will then synchronize its state with the remote server. You can view the synchronization status of the connector configuration in the Configuration column, which will indicate whether the gateway is successfully aligned with the remote settings.

Also, you can see the connector logs to make sure that the connector works, for this purpose, follow these steps:
-
In the General connector tab enable remove logging by turning on the Enable remote logging toggle. Choose DEBUG in the Log level drop-down menu. Click on the Save button to apply changes.

-
Click on logs icon to open connector logs page.
-
You can see the Logs table that consists of Created time, Status and Message columns.
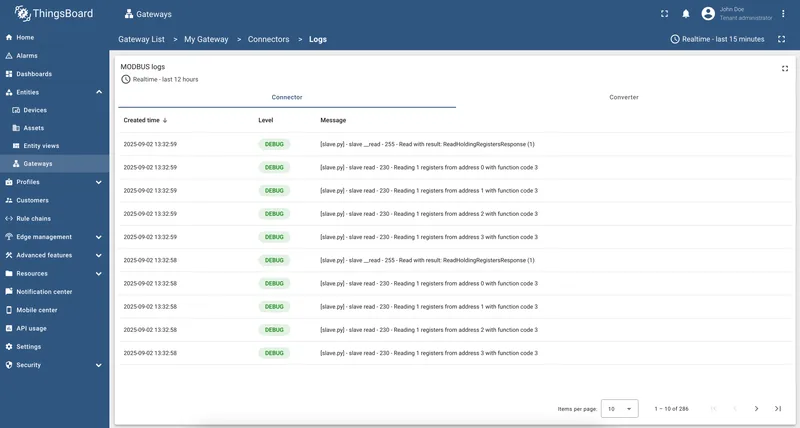


For now, the gateway is ready to process data through the newly created and configured Modbus connector.
Let’s add an OPC-UA connector, which will read some data from the demo server to the created gateway.
Setup demo server
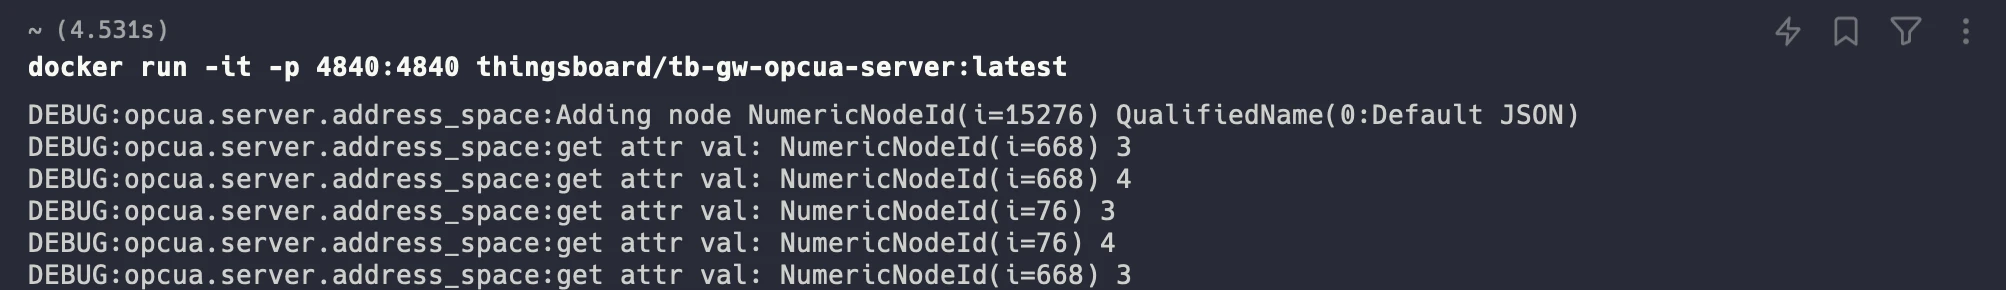
Section titled “Setup demo server”As a demo simulation server, we will use docker image, that can be installed and run using the following command:
docker run -it -p 4840:4840 thingsboard/tb-gw-opcua-server:latestAfter running docker image, you can see the following logs in your terminal:
Setup connector
Section titled “Setup connector”This OPC-UA connector configuration establishes a connection to a server named “OPC-UA Demo Server” at “opc.tcp://host.docker.internal:4840/freeopcua/server/”. The configuration specifies various settings, including timeouts, scan periods, and security mechanisms such as “Basic128Rsa15” with anonymous identity.
The mapping section defines how OPC-UA nodes are mapped to devices and their attributes and time series. In this case, a device with the name “Demo Device” and type “default” is mapped to nodes under “Root\.Objects\.MyObject”.
Attributes such as frequency and power, as well as time series like temperature and humidity, are mapped to specific paths in the OPC-UA server.
Additionally, the configuration supports RPC methods and attribute updates.
To create a connector, follow these steps:
-
Click on Connectors configuration button on the right panel.
-
Click the + Add connector button.
-
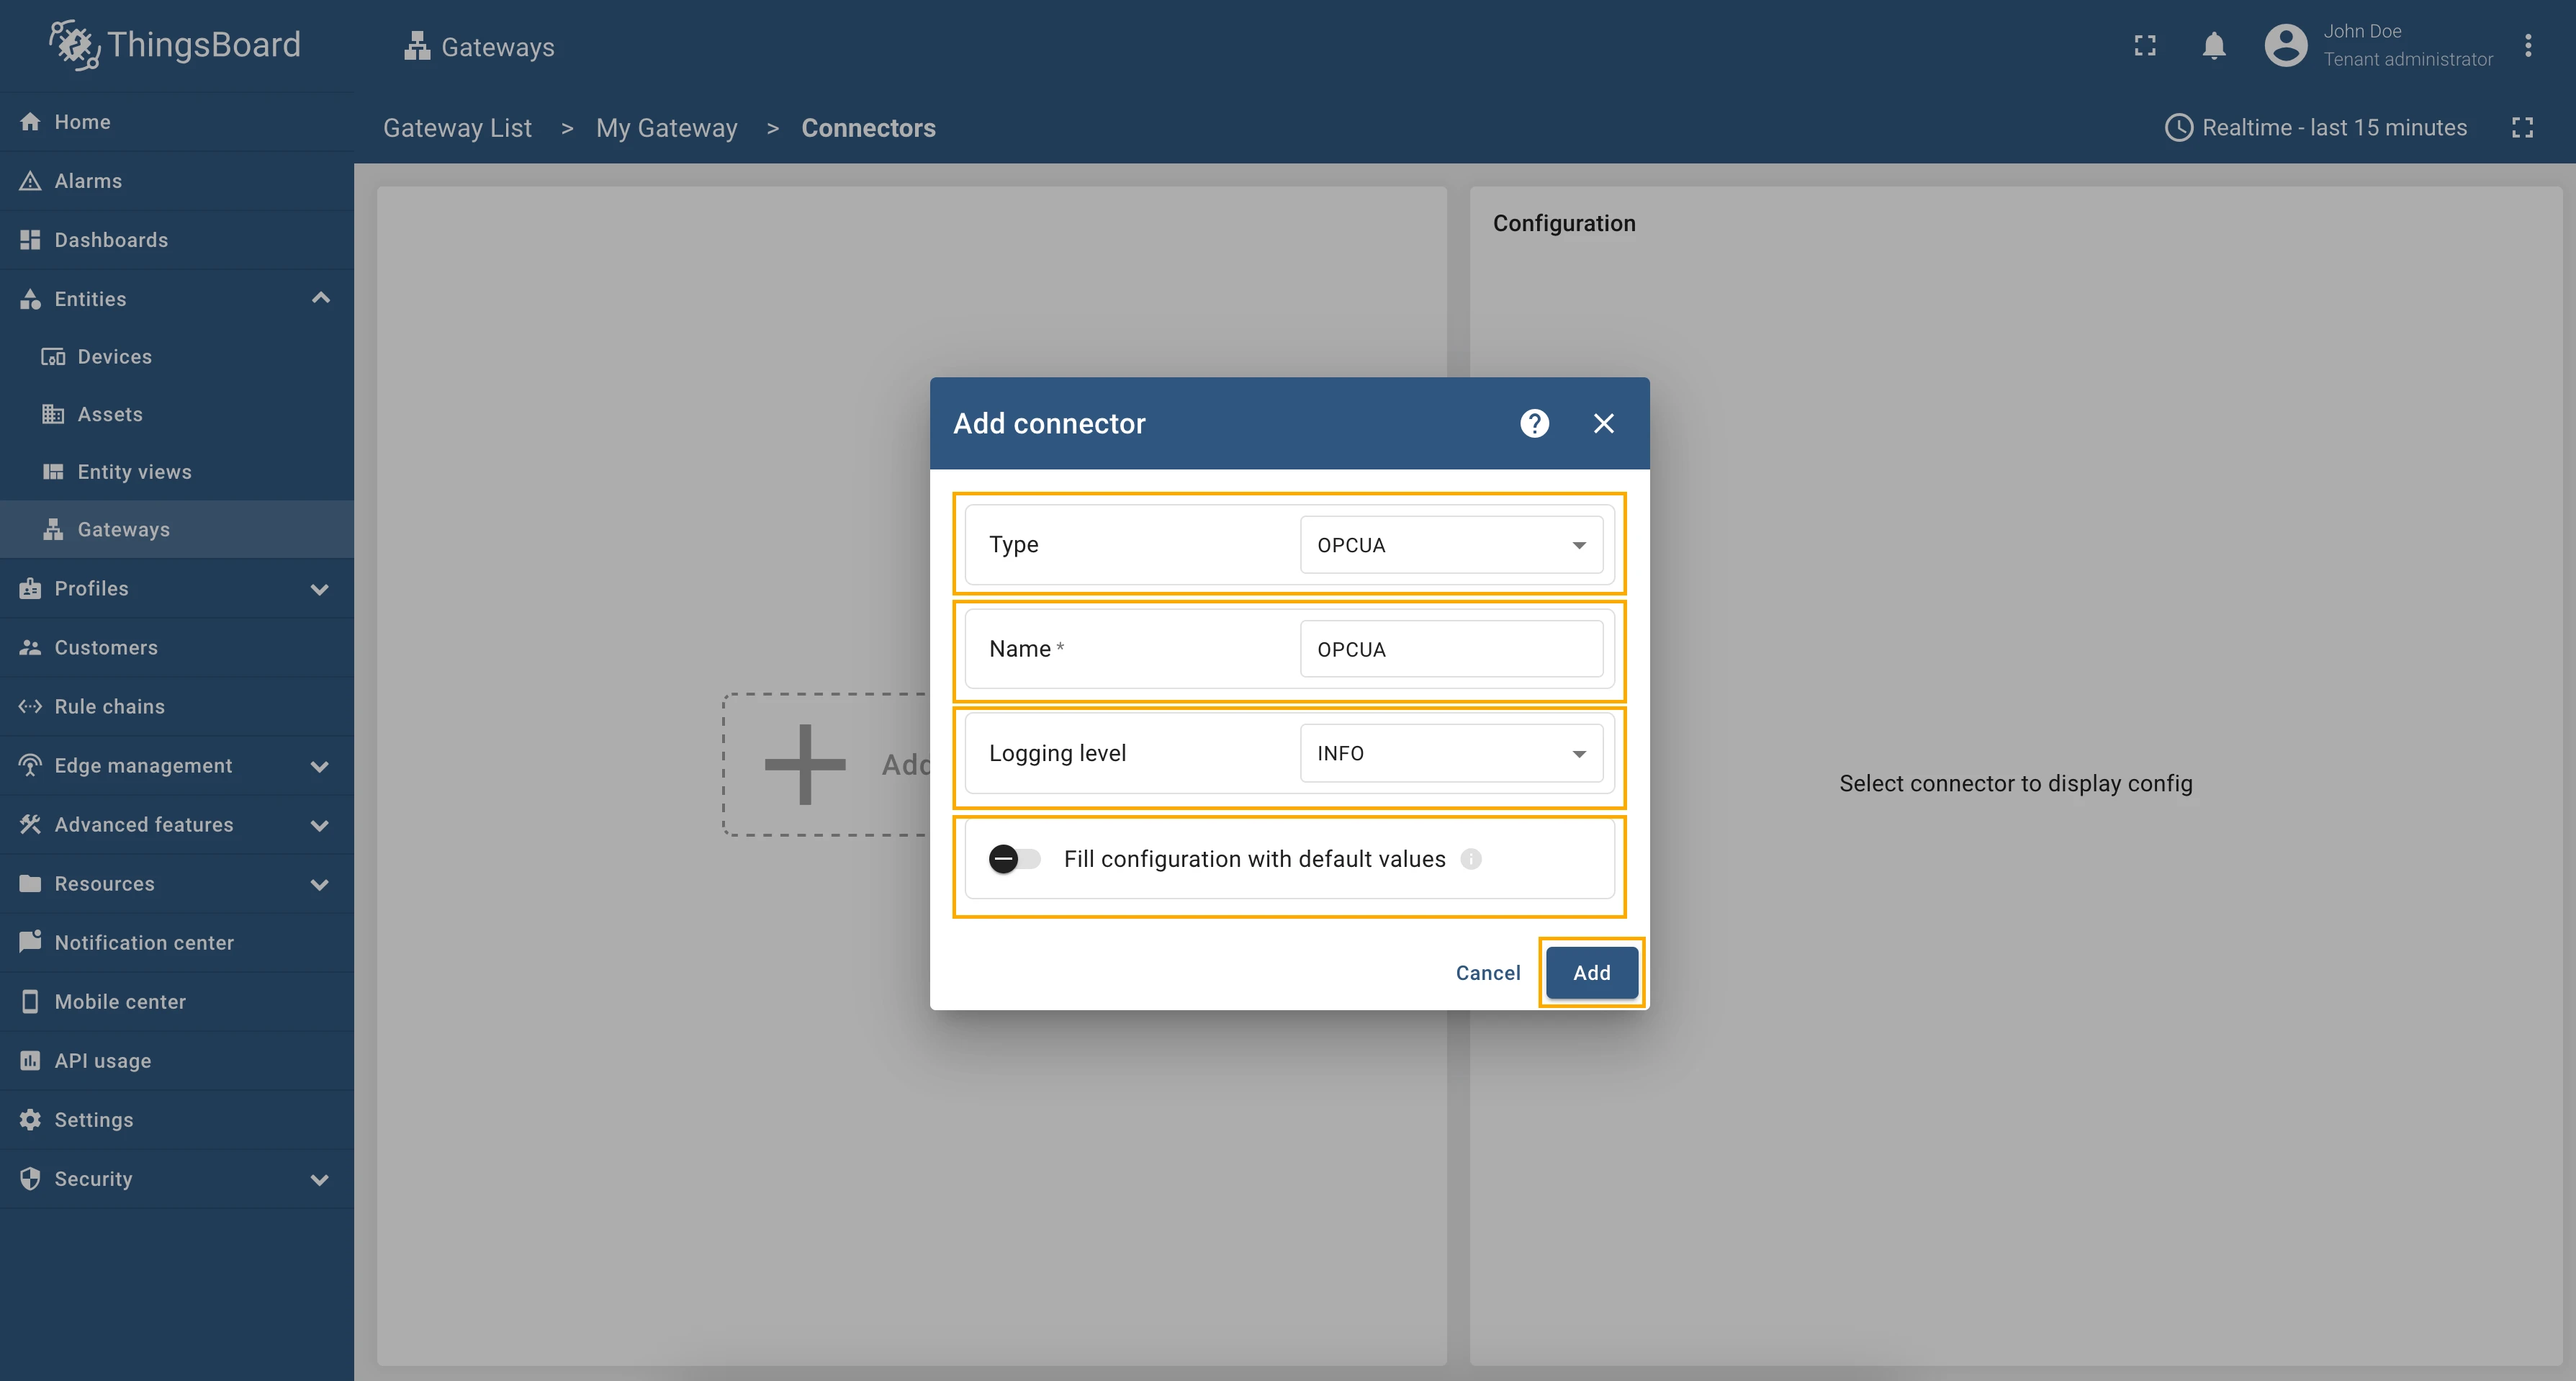
Choose OPCUA connector type from the dropdown, fill in Name field, choose Logging level to INFO, turn off the Fill configuration with default values option and click on Add button.

-
Connector created.

First, we need to configure the connection to the demo OPC-UA server. Let’s start from the Server tab. This section offers detailed connection configuration options and contains several important fields, including server endpoint url, security settings, scan period, poll period, subscriptions settings and other.
- Go to the Server tab, and fill in the fields with following values:
| Field name | Value |
|---|---|
| Server endpoint url | opc.tcp://host.docker.internal:4840/freeopcua/server/ |
| Enable subscription | false |
| Security | Anonymous |
| Poll period | 5000 |
| Security policy | Basic128RSA15 |

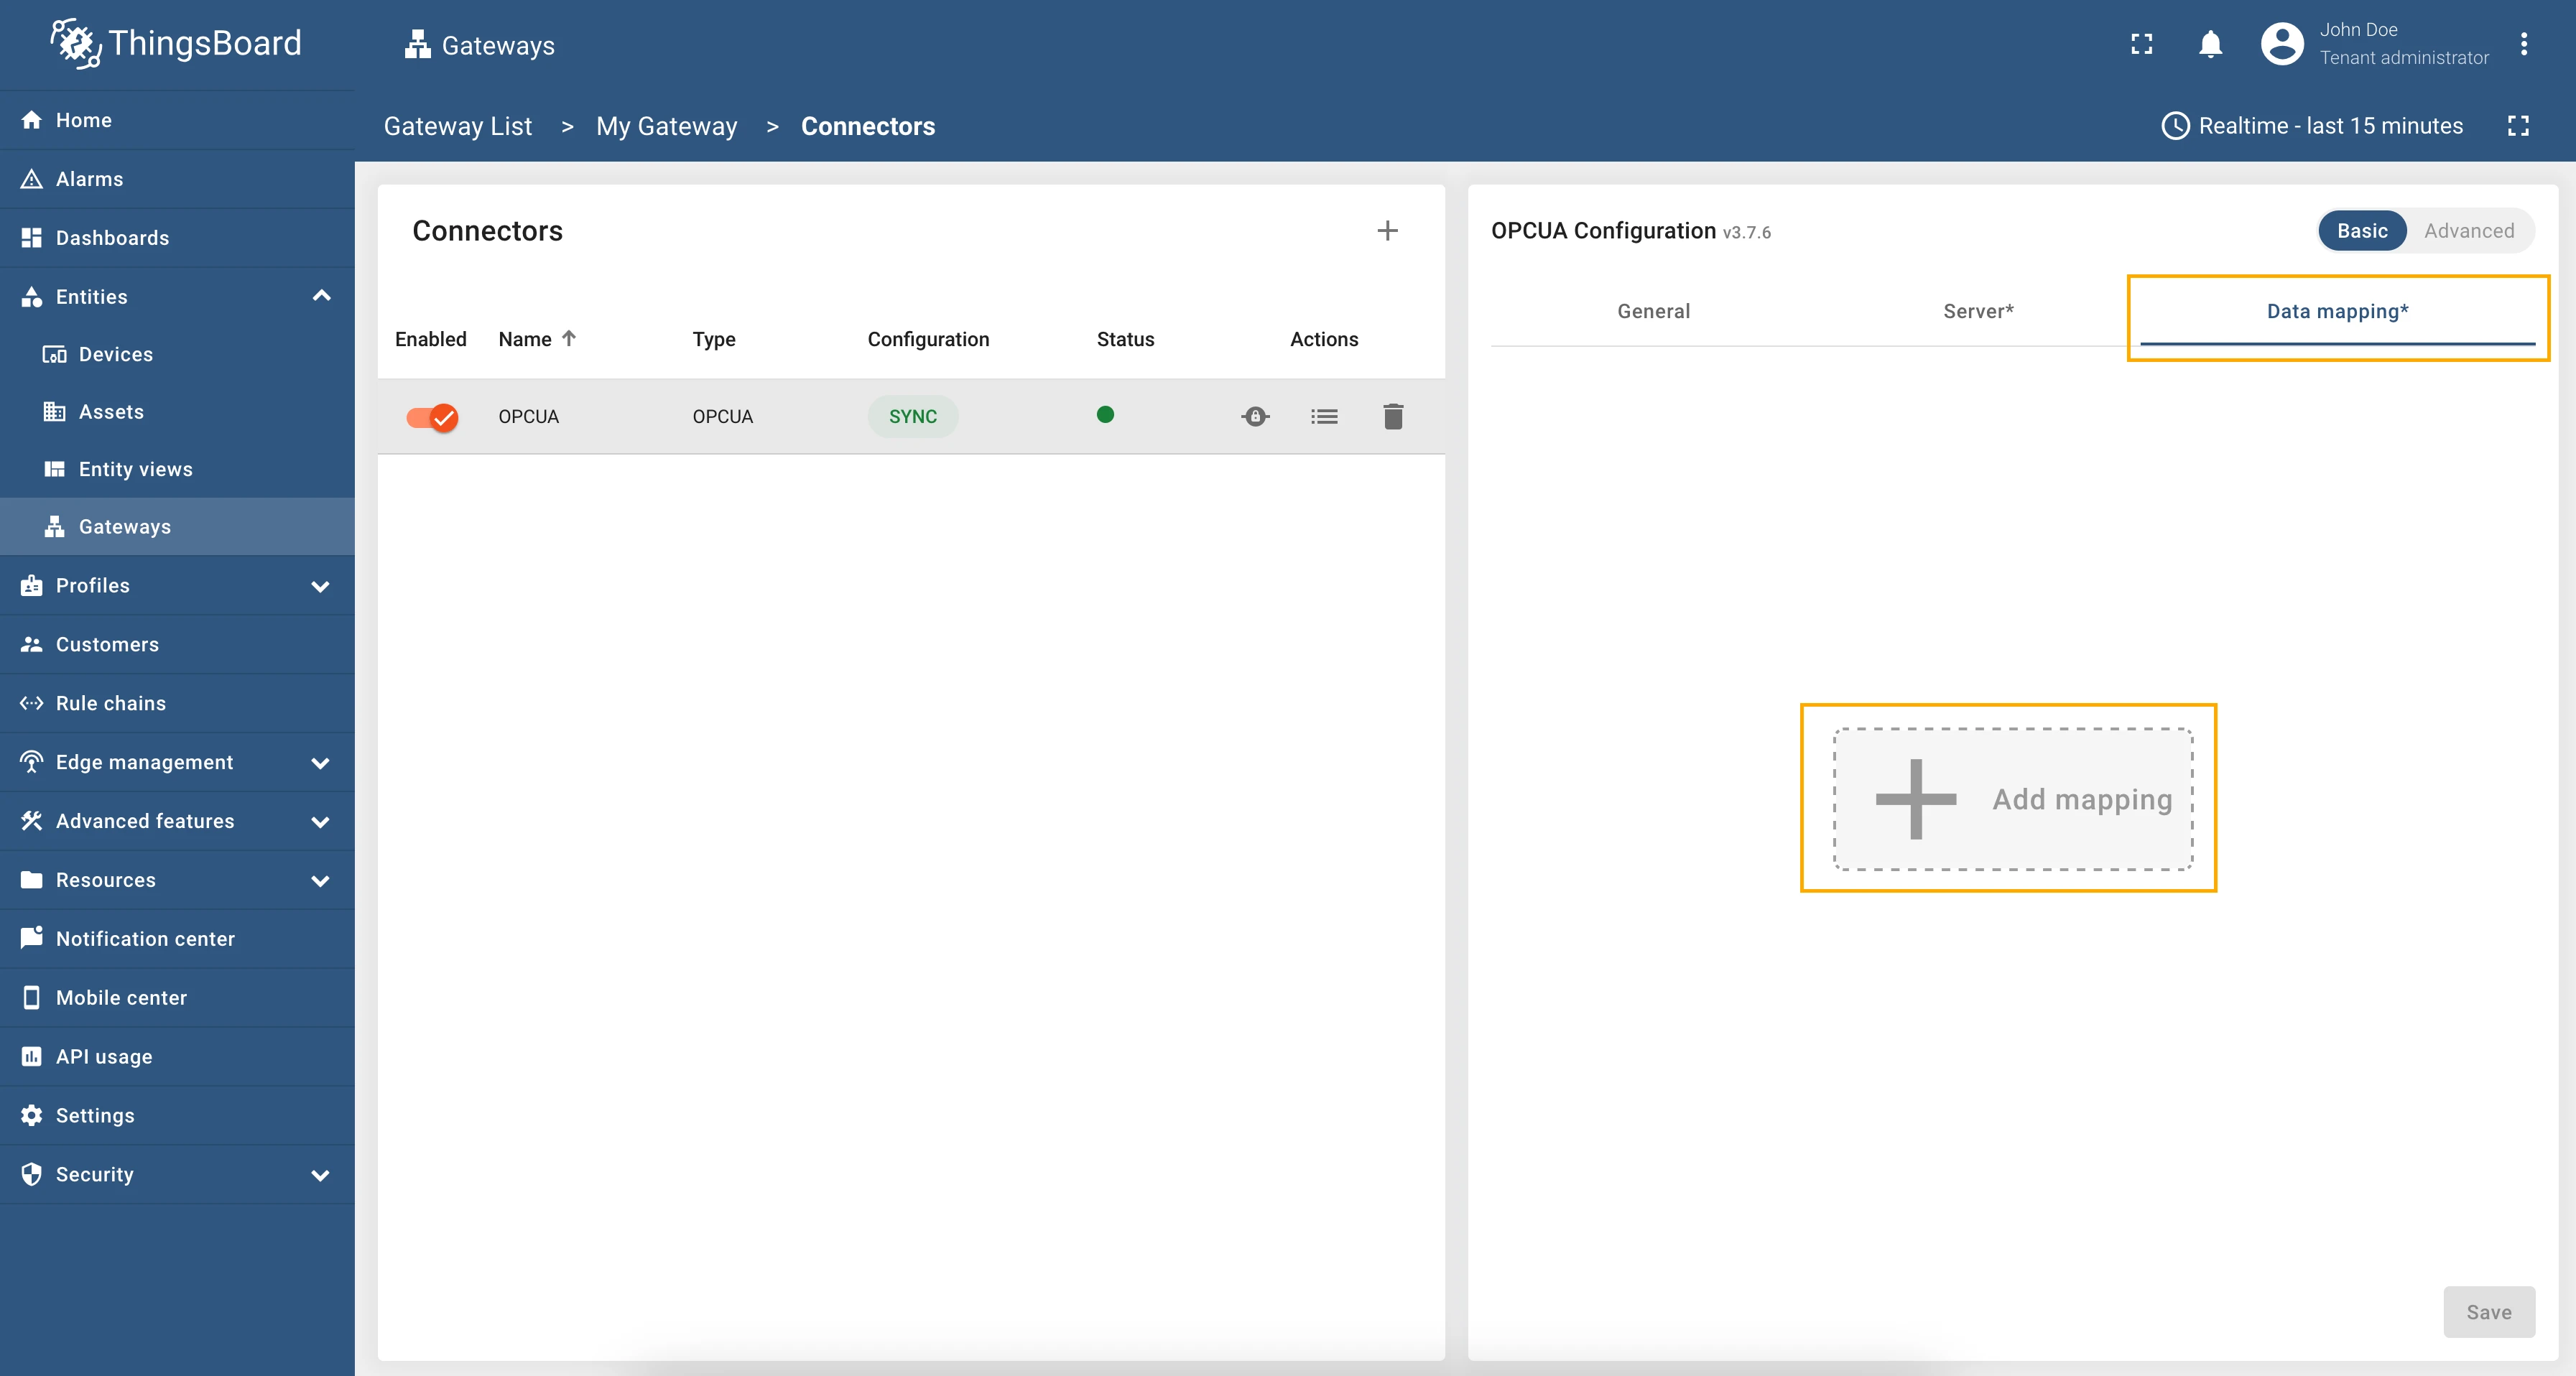
Now, we are ready to move to the Data mapping section. This configuration section contains list of nodes that the gateway will subscribe to after connecting to the OPC-UA server, along with settings for processing data from these nodes.
Let’s add new node using the following steps:
- Go to the Data mapping tab, and click on Add mapping button.
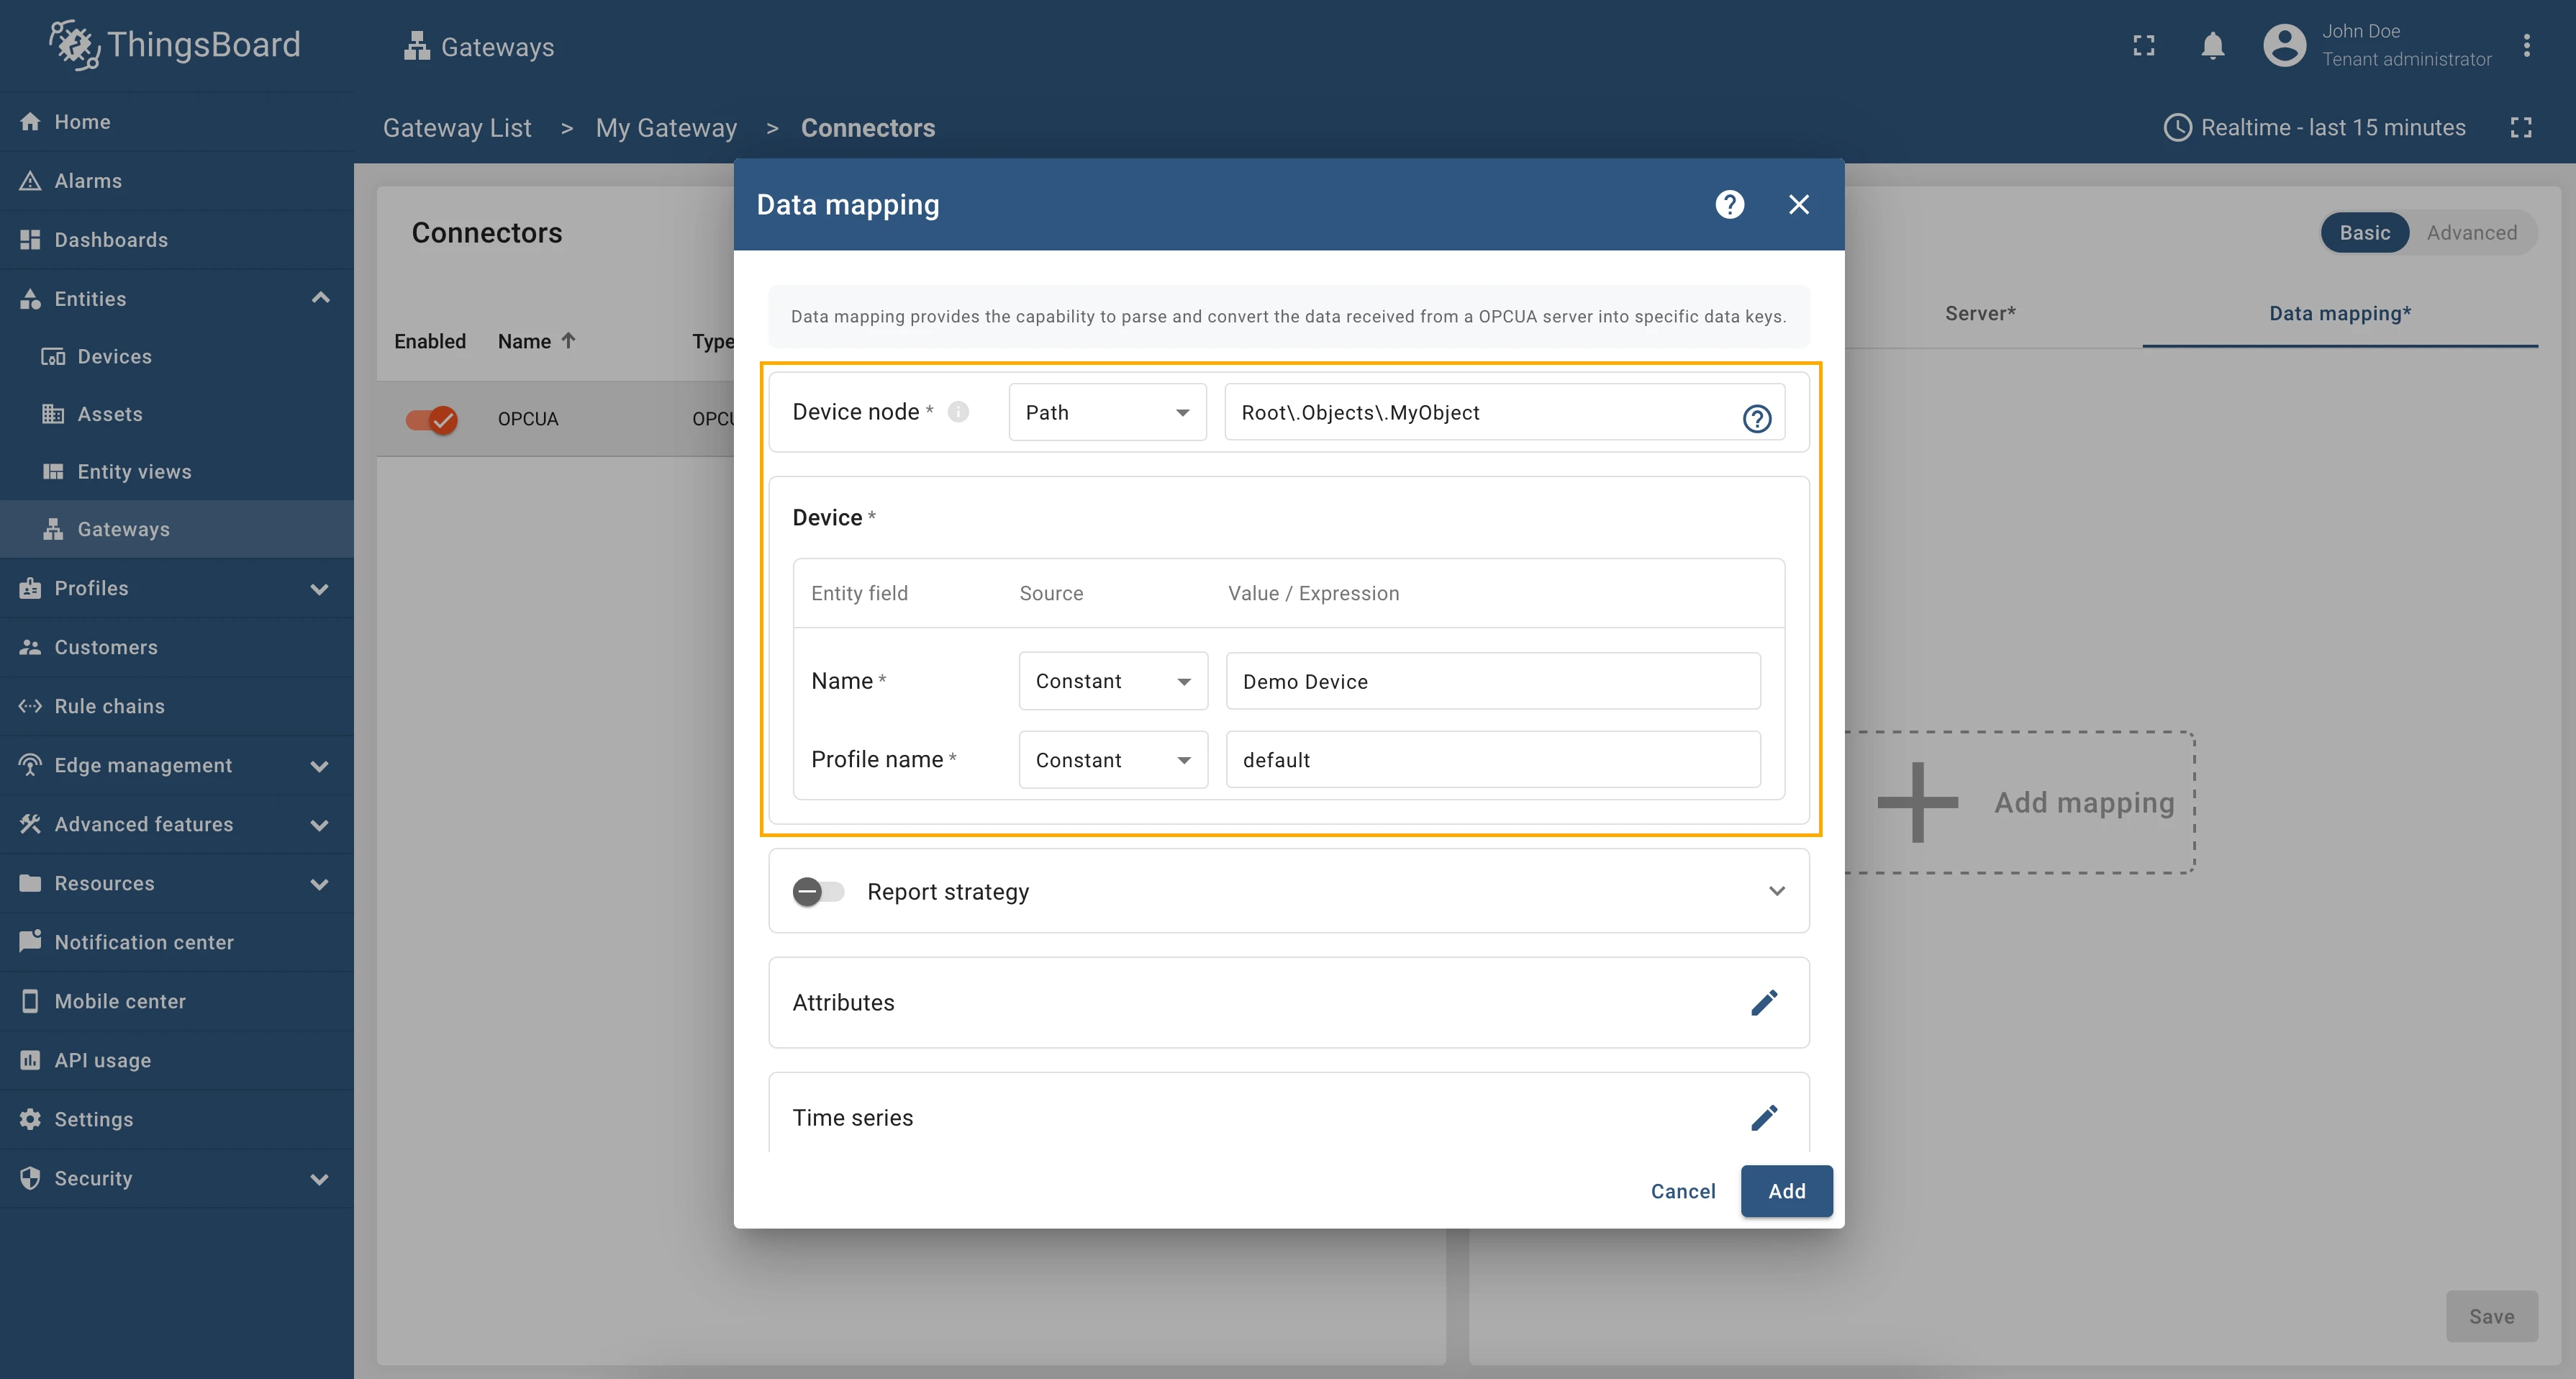
- In the opened window, fill in the Device node with Path type and “
Root\.Objects\.MyObject” value; - For Device subsection use the following options/values:
- The Name row: select Constant in the Source dropdown field, fill in the Value / Expression field with the “Device Demo” value;
- The Profile name row: select Constant in the Source dropdown field, fill in the Value / Expression field with the “default” value.
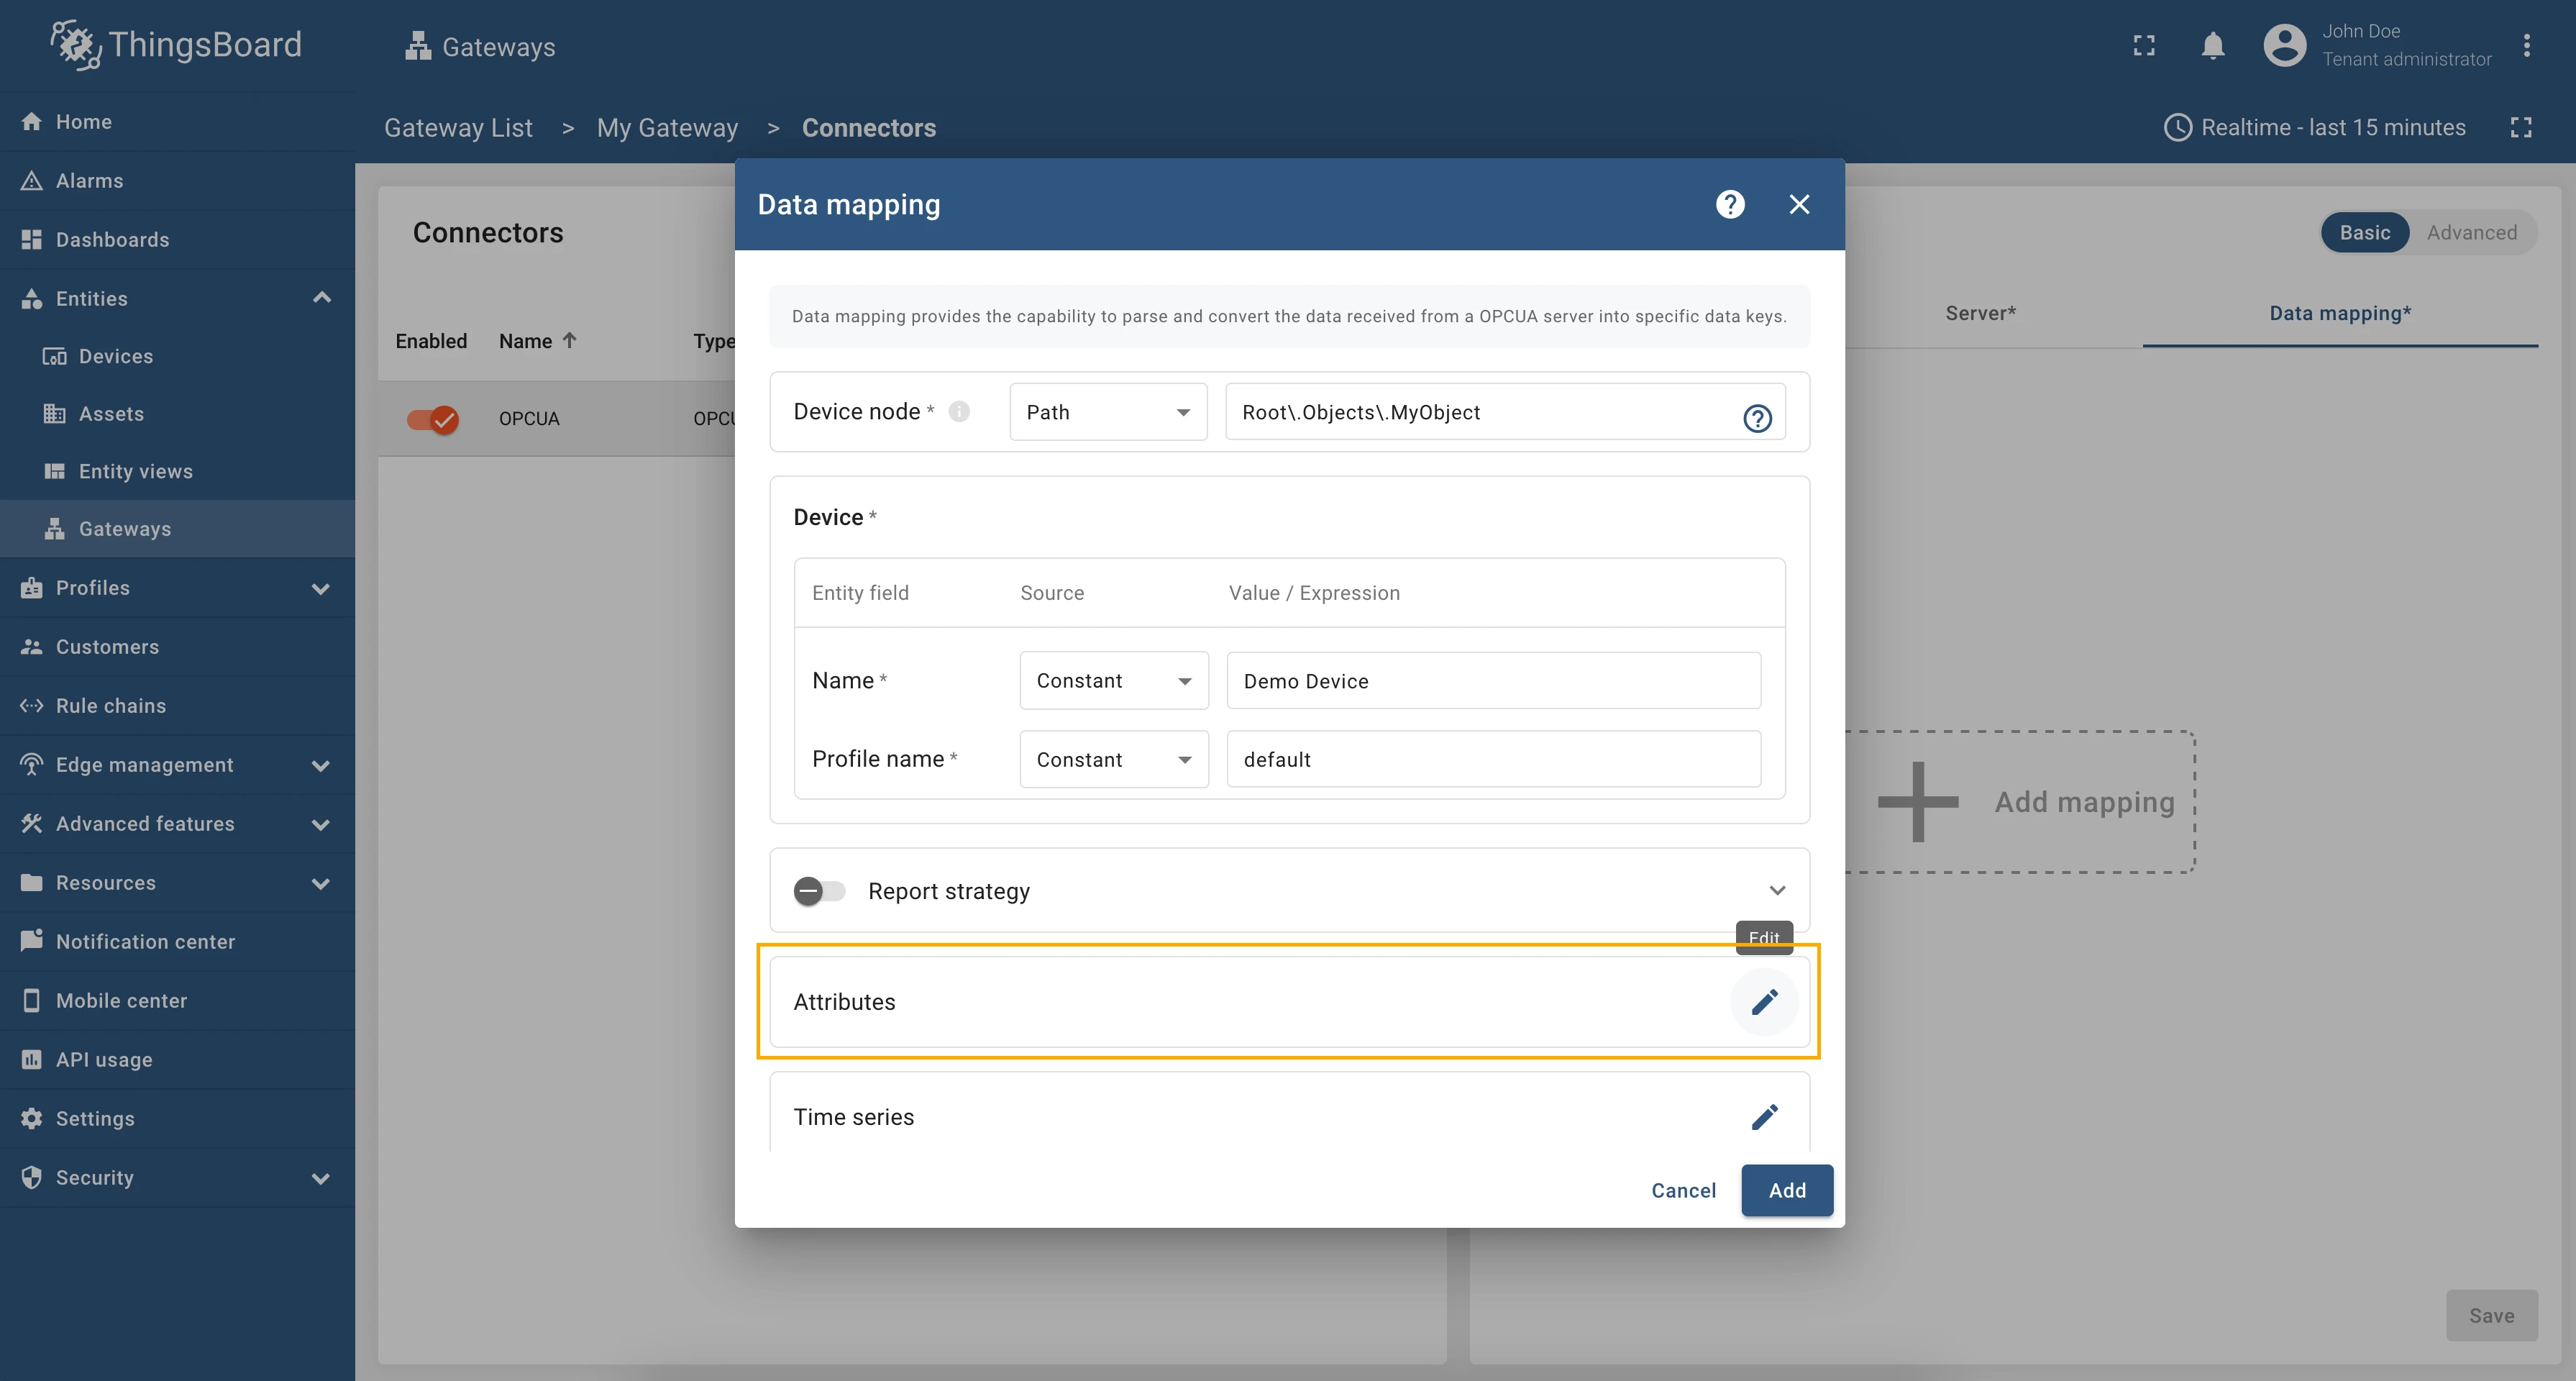
Let’s move to Attributes section to add “frequency” and “power” attributes. The configuration in this unit provides settings for processing data from OPC-UA server. These settings will be interpreted in ThingsBoard platform instance as attributes of the device. Also we will use path for finding corresponding node.
Let’s configure attribute section using the following steps:
- Click on the pencil icon in the Attributes section;
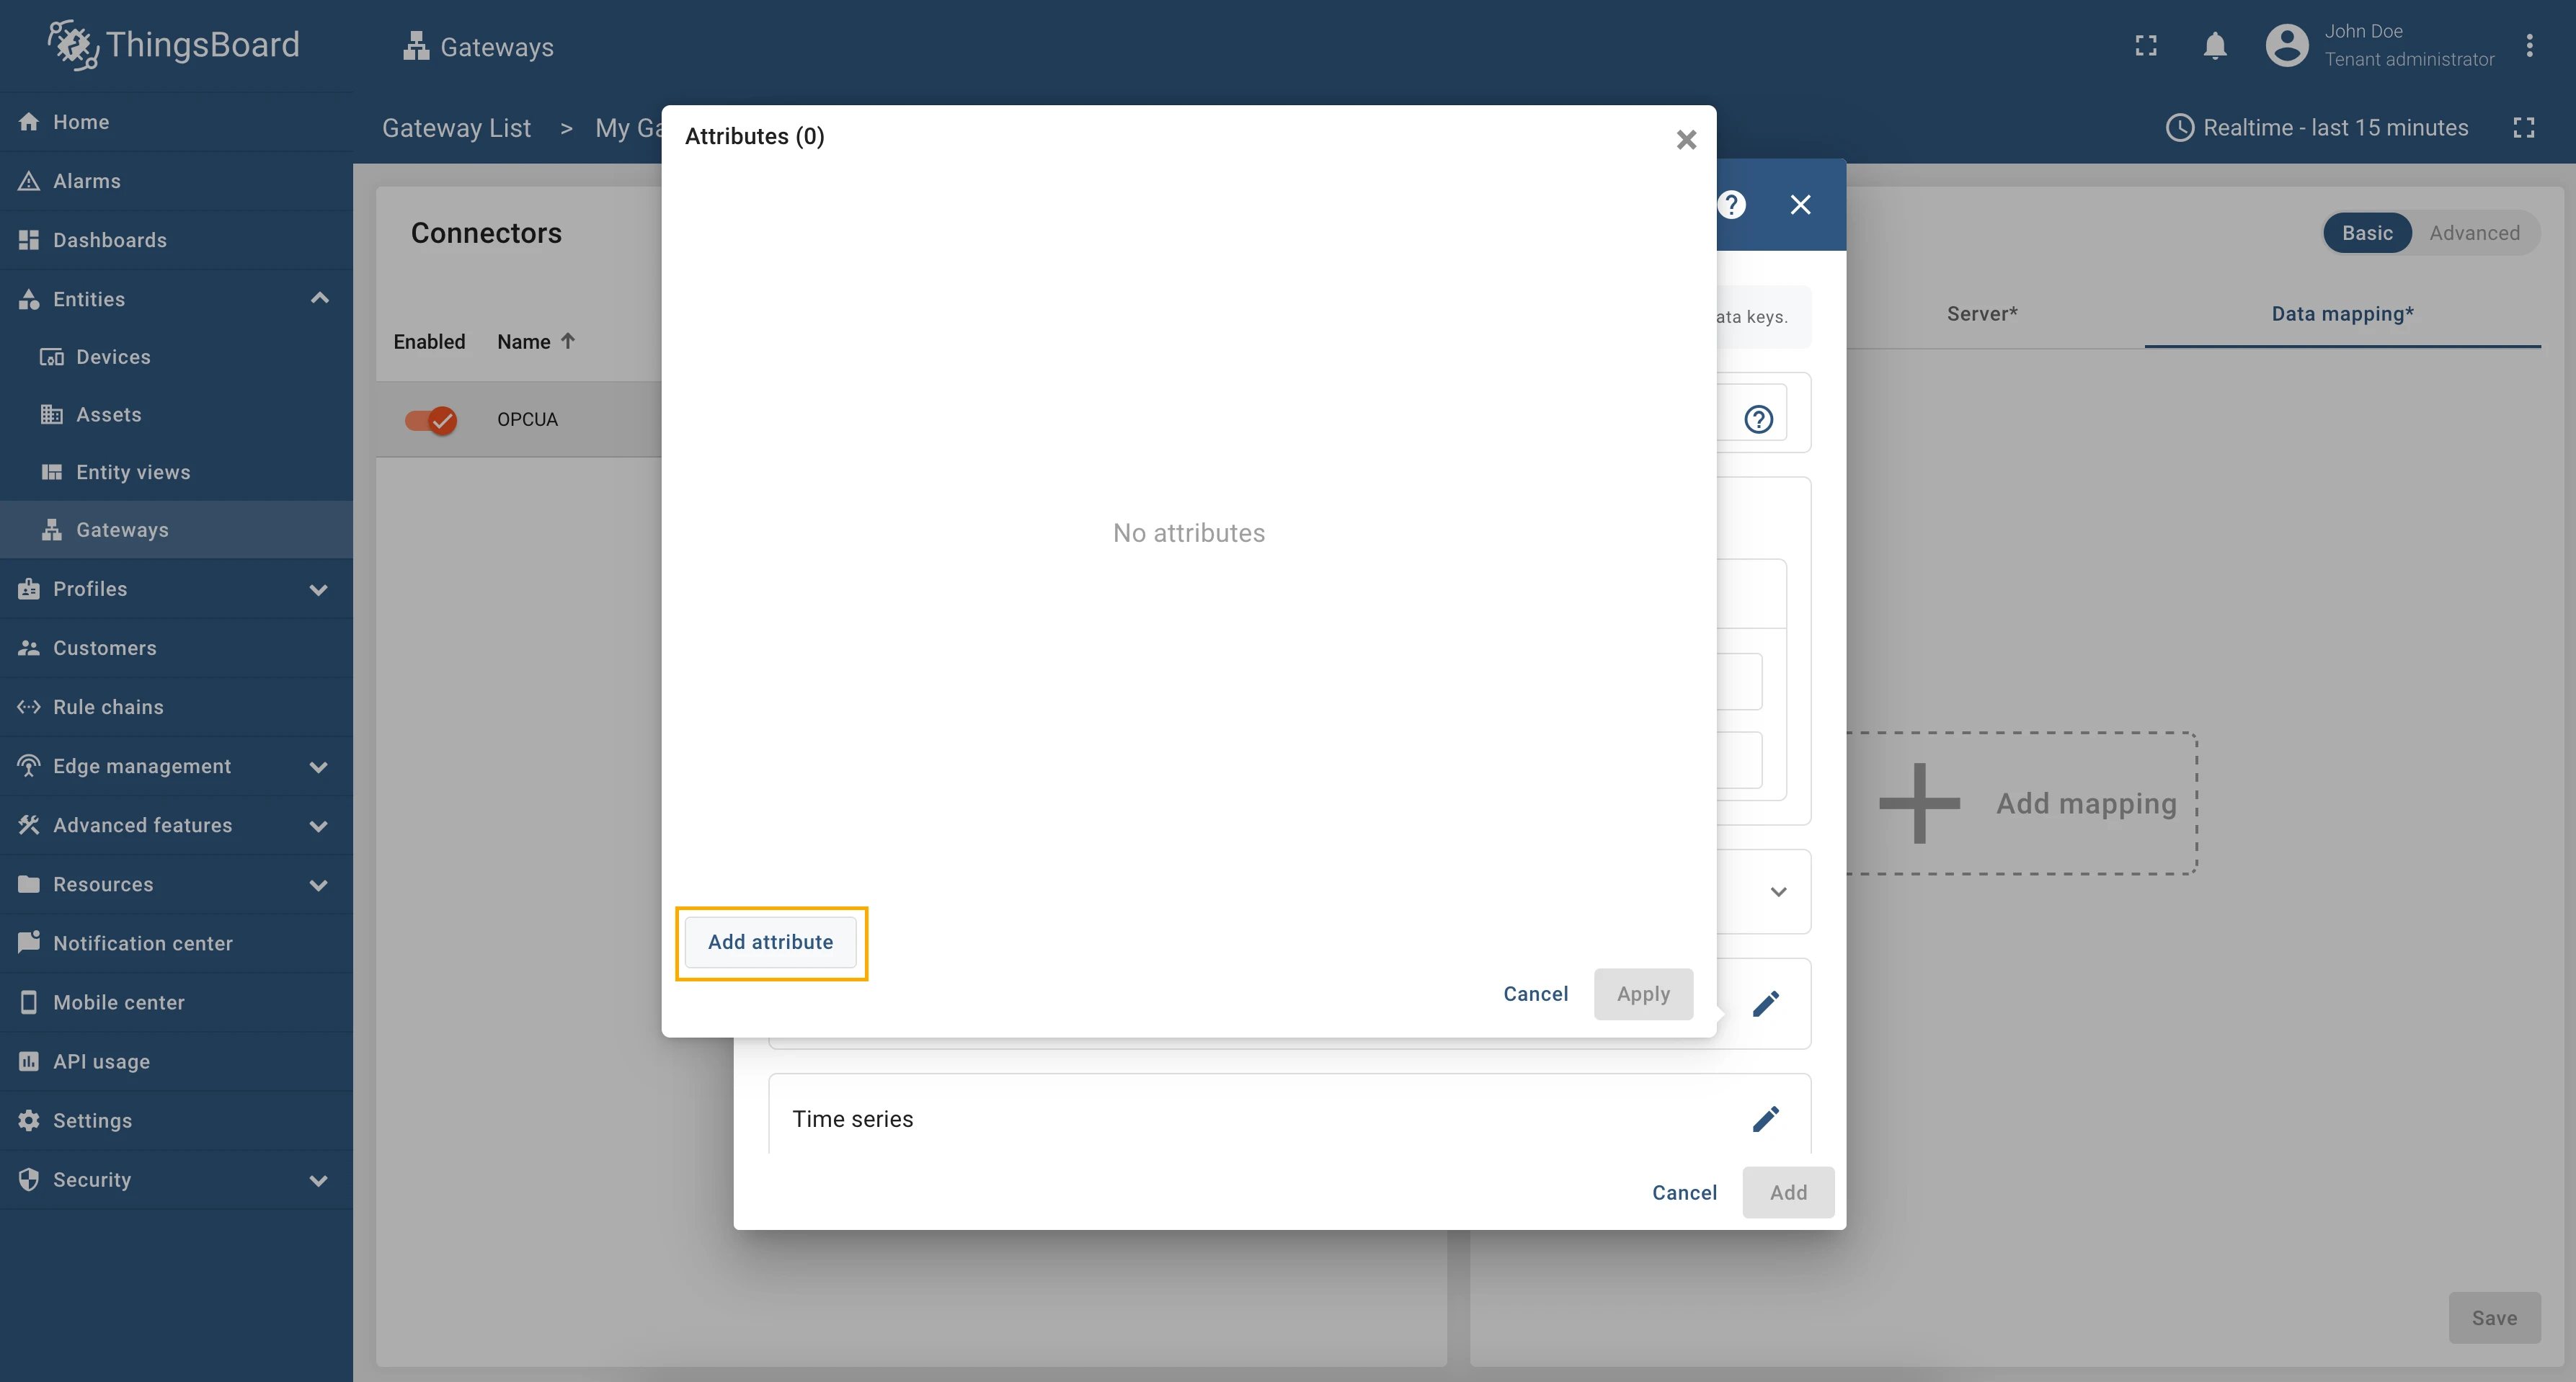
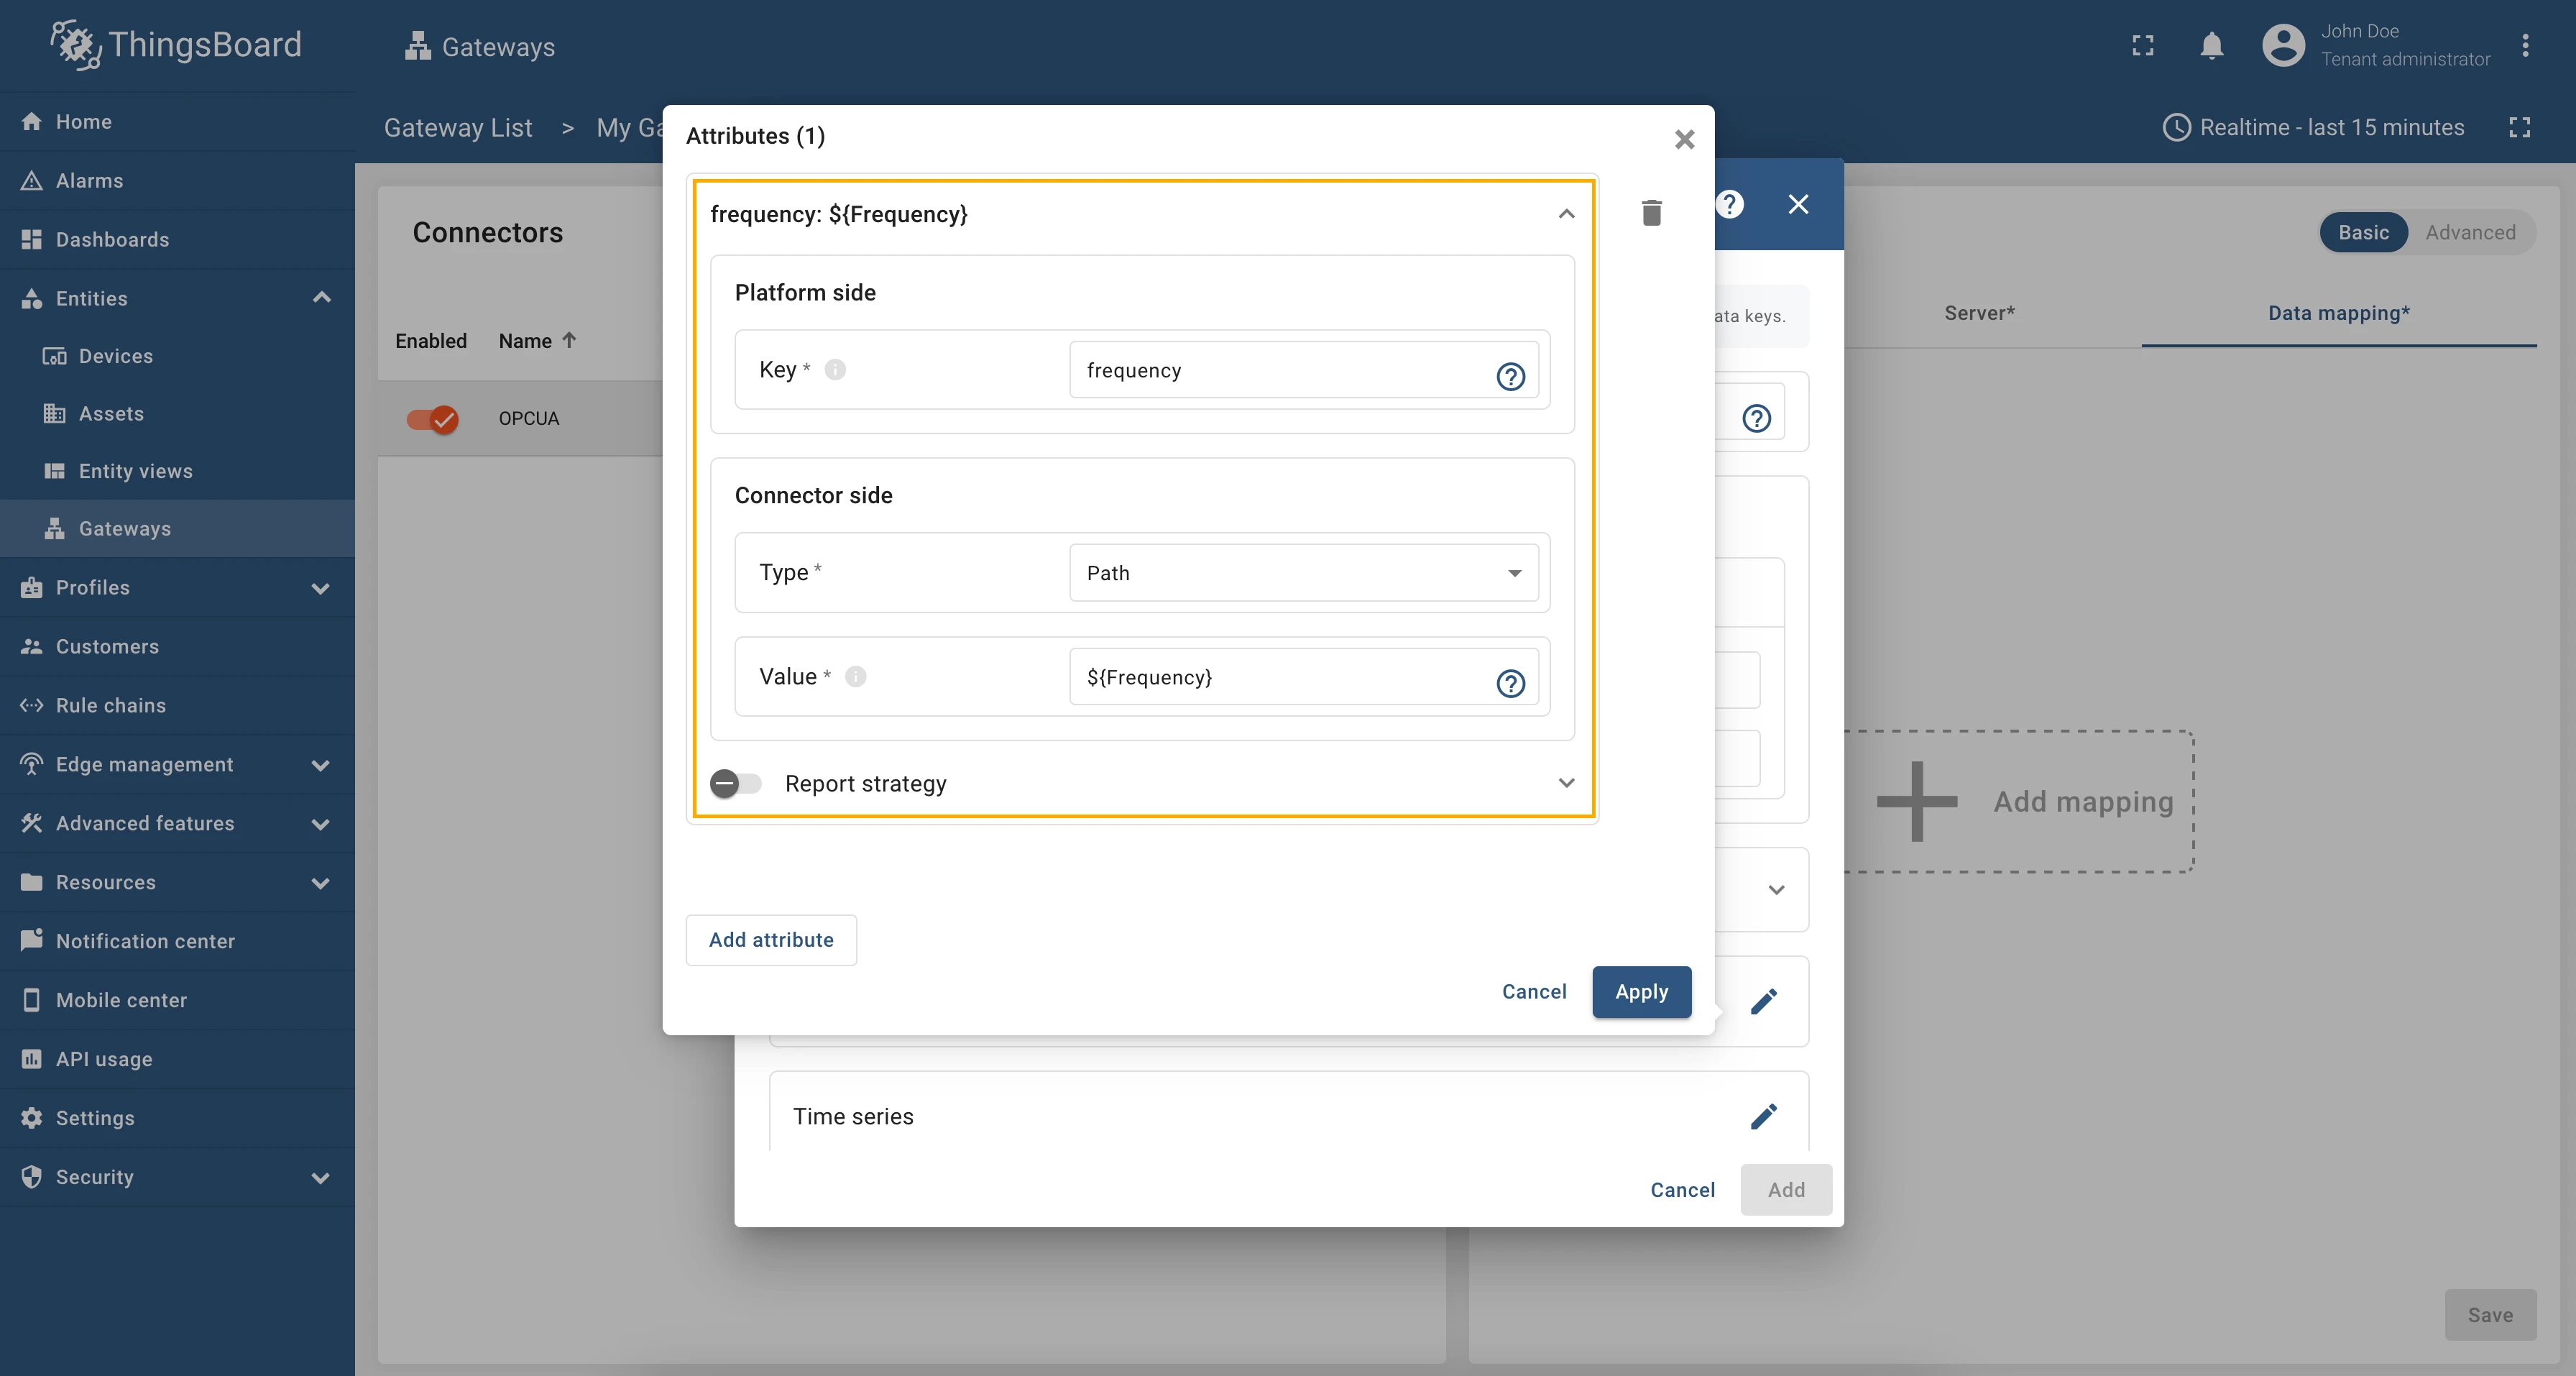
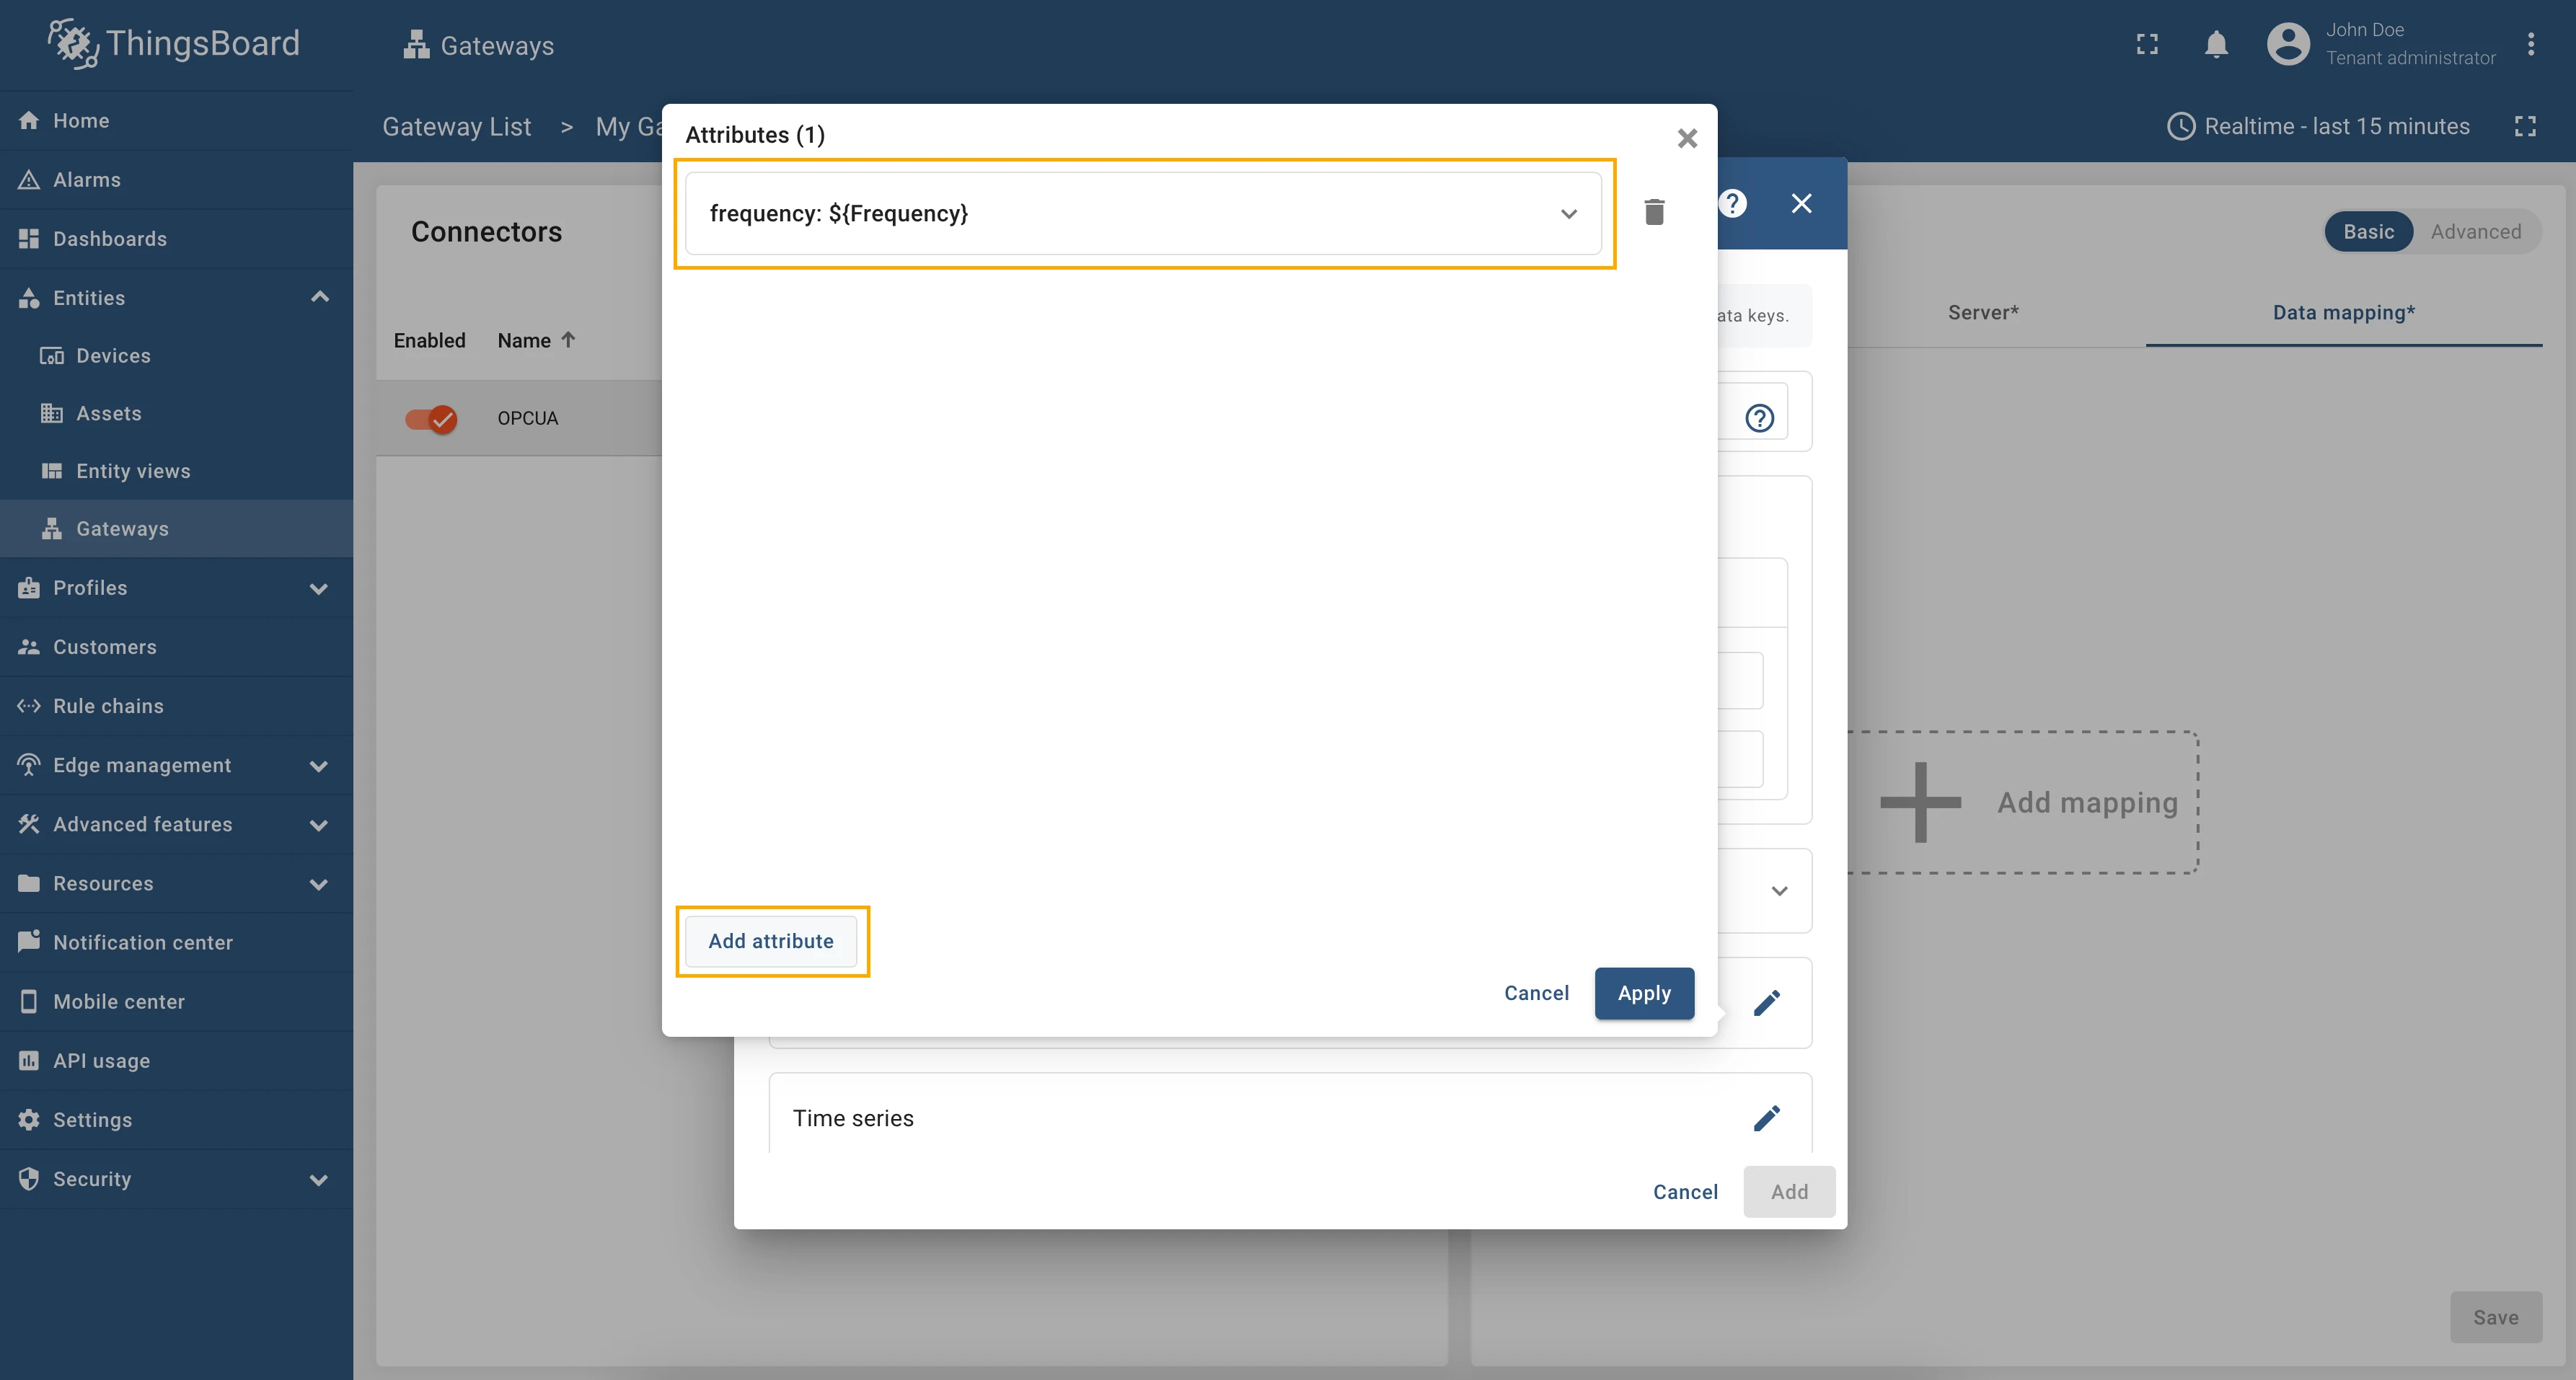
- In the opened window, click on the Add attribute button;
- Fill in the Key field with the “frequency”, select the Type field to the Path, and fill in the Value with the ”${Frequency}”.
Let’s add another attribute. Collapse the recently added “frequency” attribute, click the Add attribute button, and fill in the fields with the following values, using the same process as before:
| Field name | Value |
|---|---|
| Key | power |
| Type | Path |
| Value | ${Power} |
Click the Apply button after you’ve completed the configuration.

We finish with the Attributes section, so let’s move to the Time series section. The configuration in this unit provides settings for processing data from the OPC-UA server. These settings will be interpreted in ThingsBoard platform instance as time series of the device.
Let’s configure time series section using the following steps:
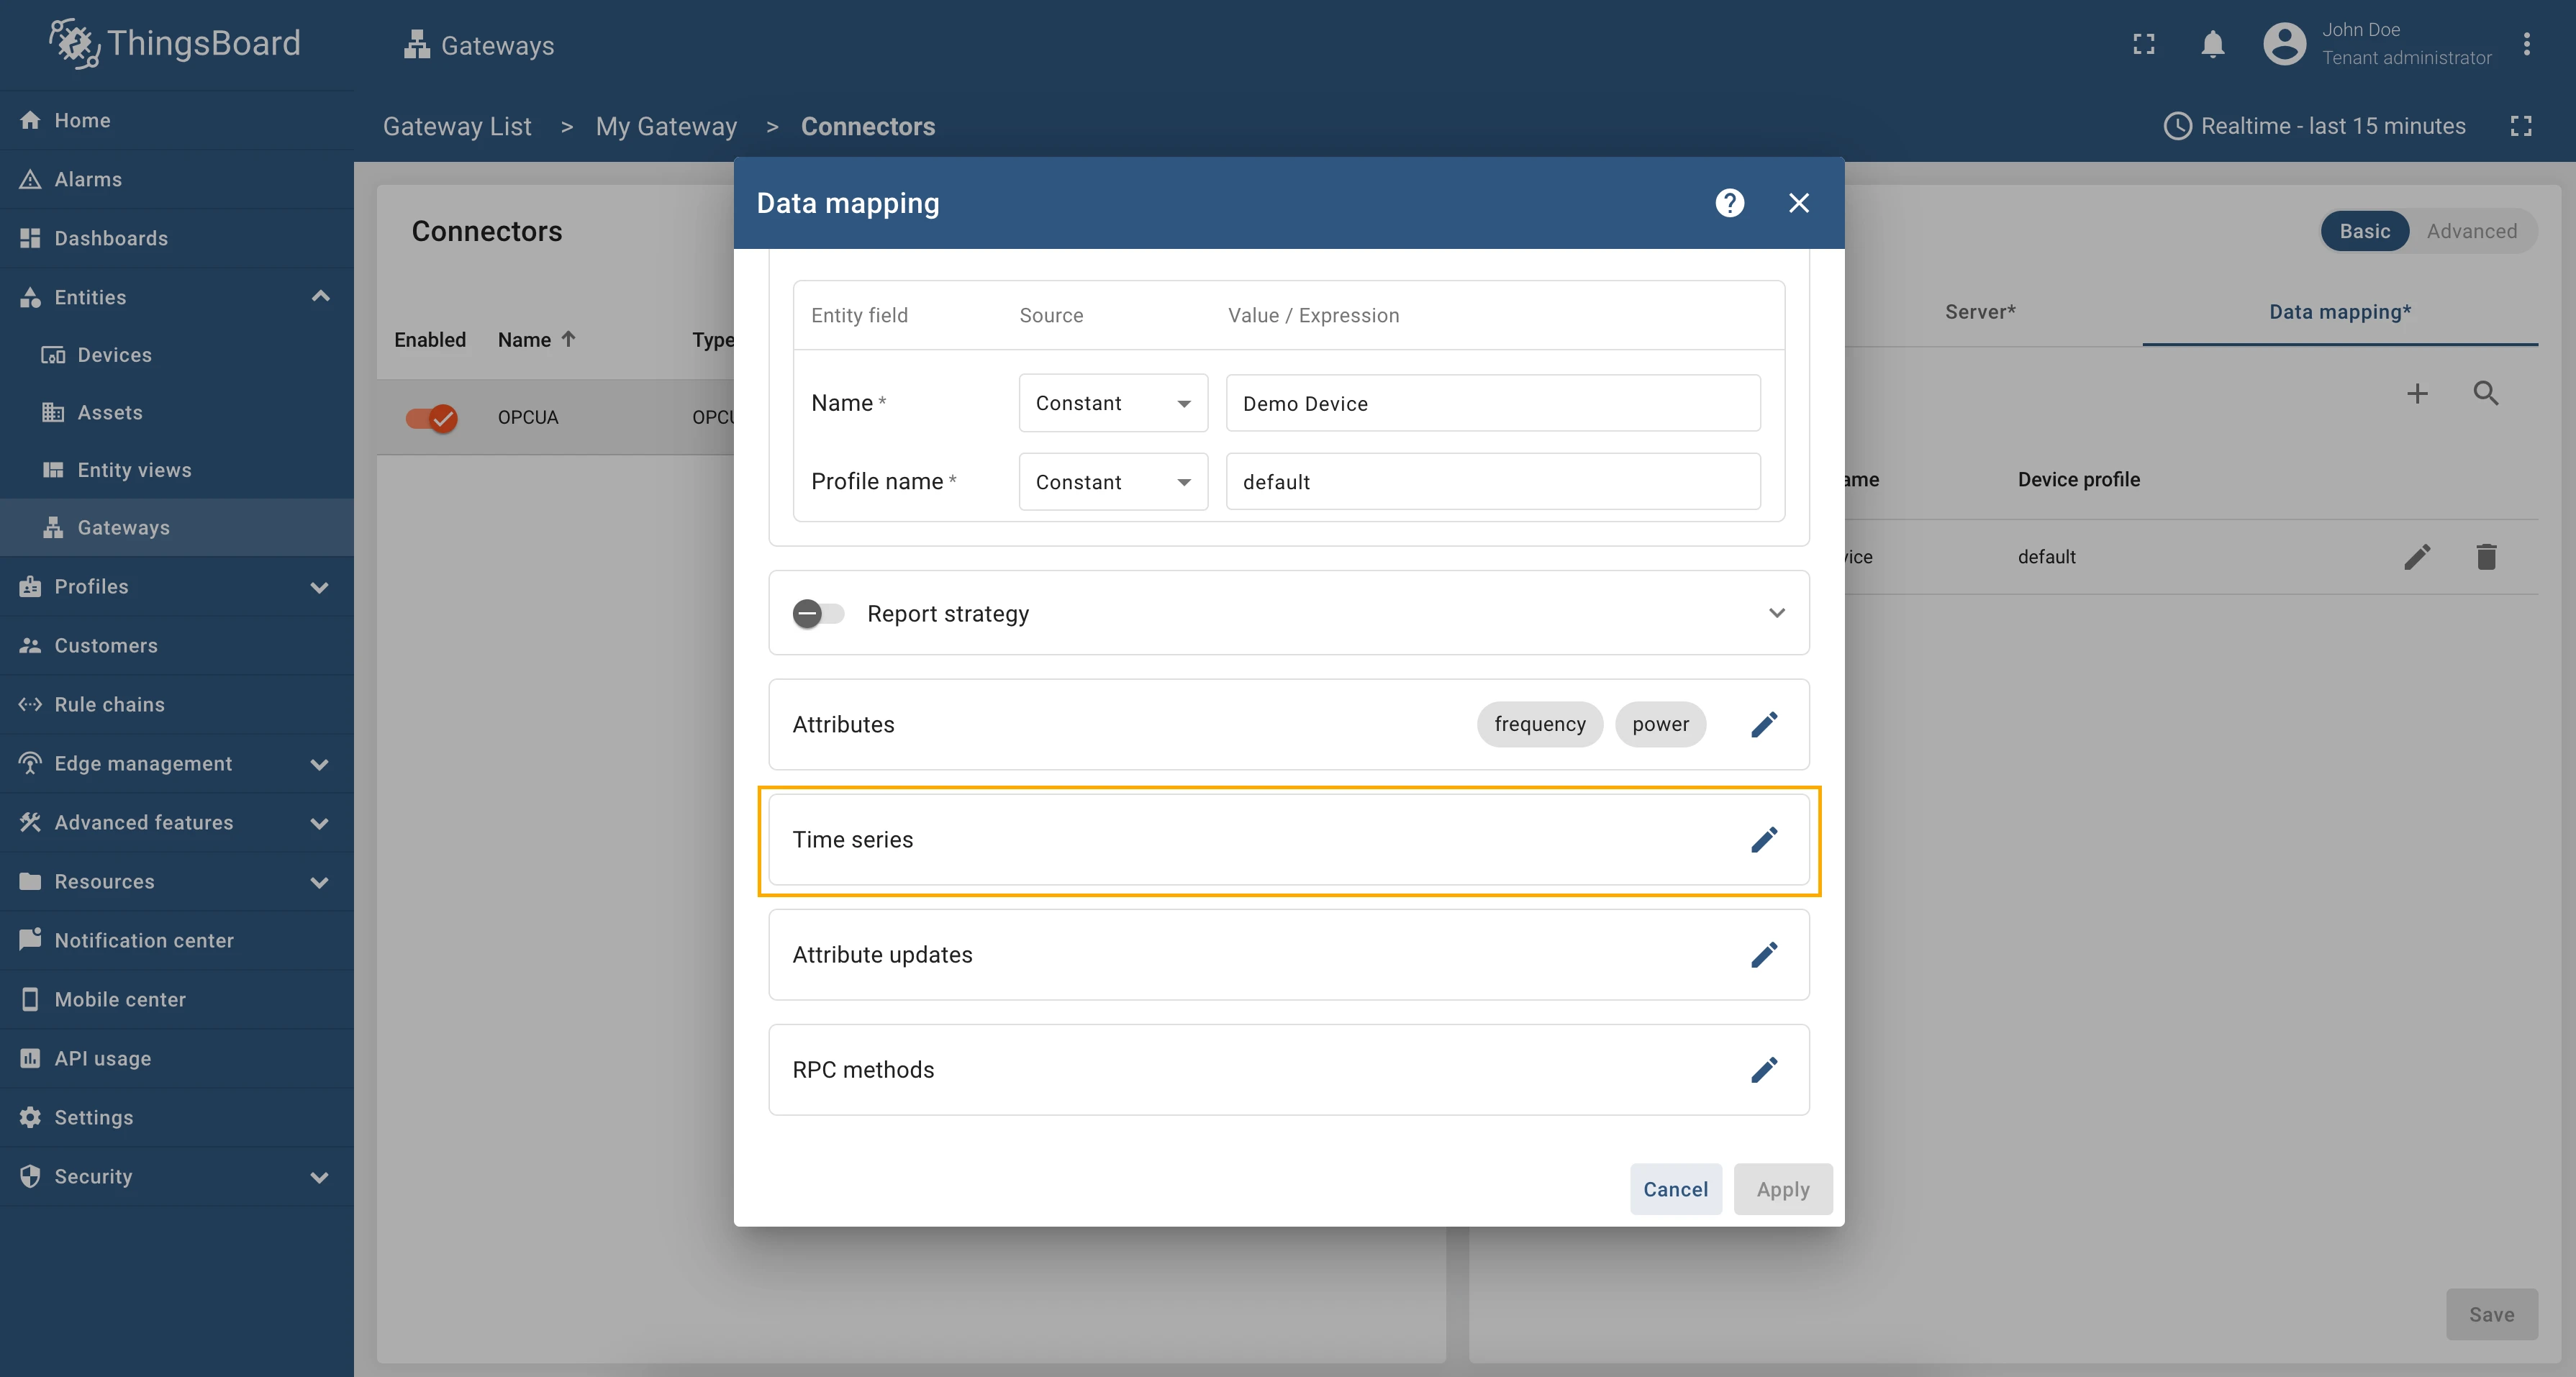
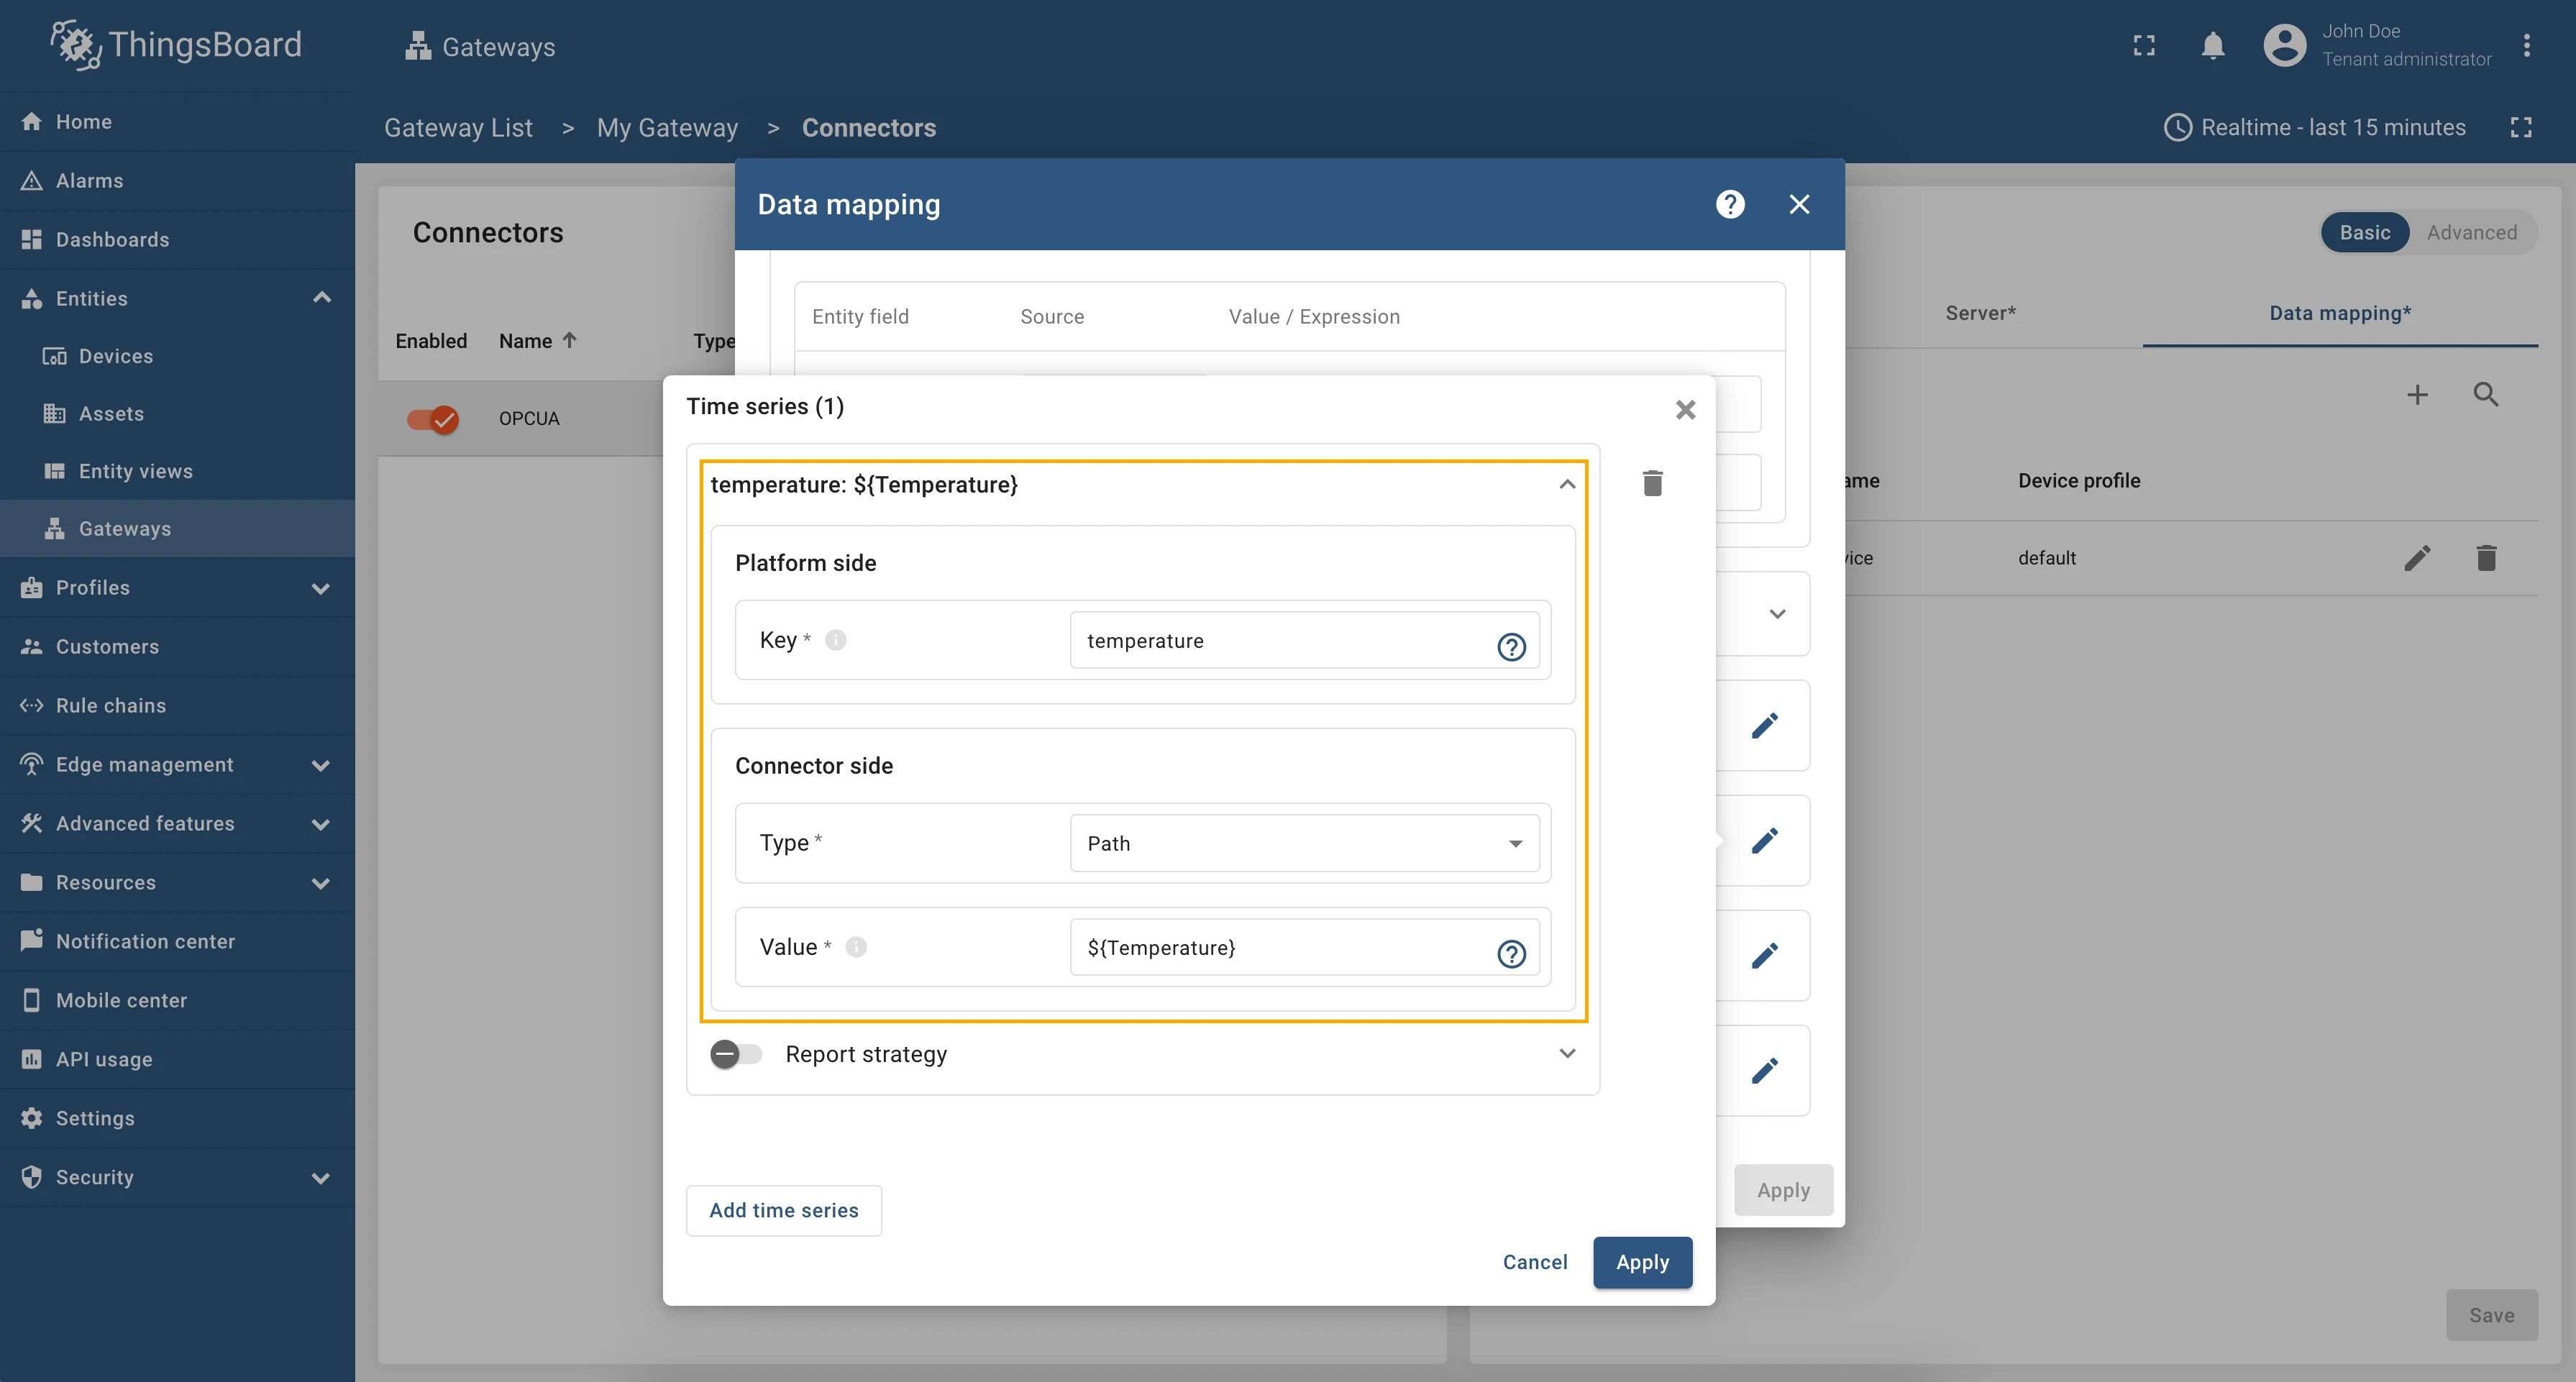
- Click on the pencil icon in the Time series section;
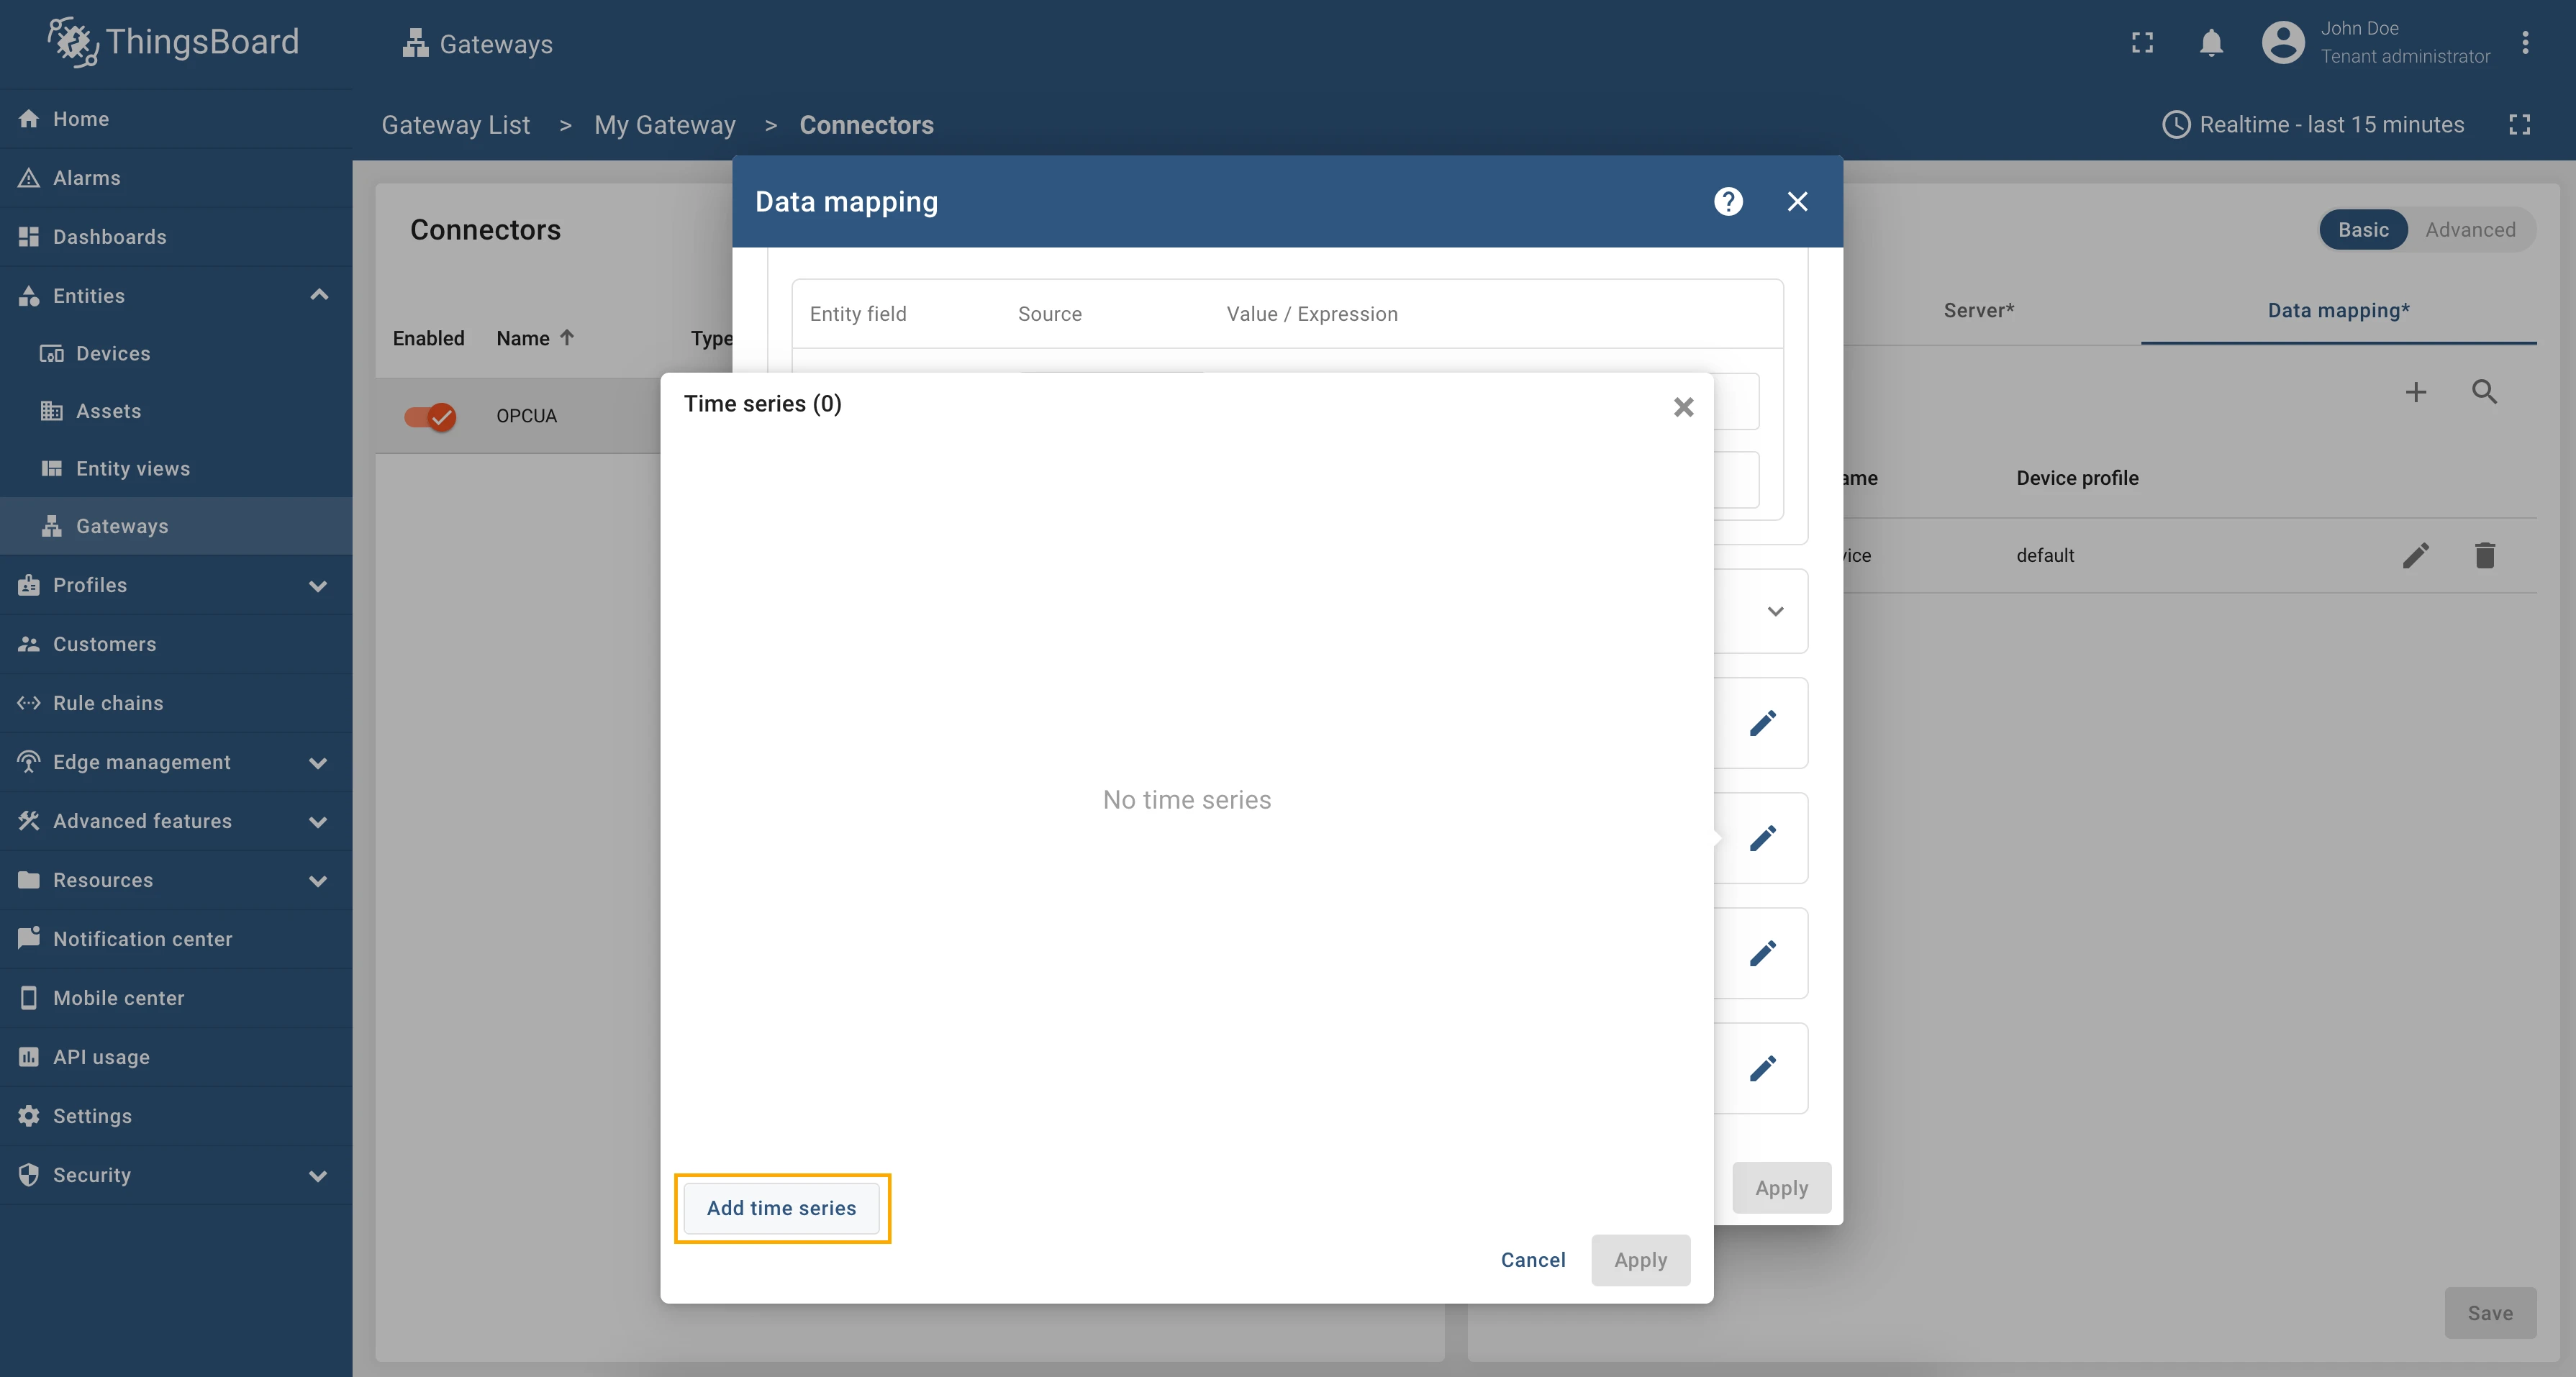
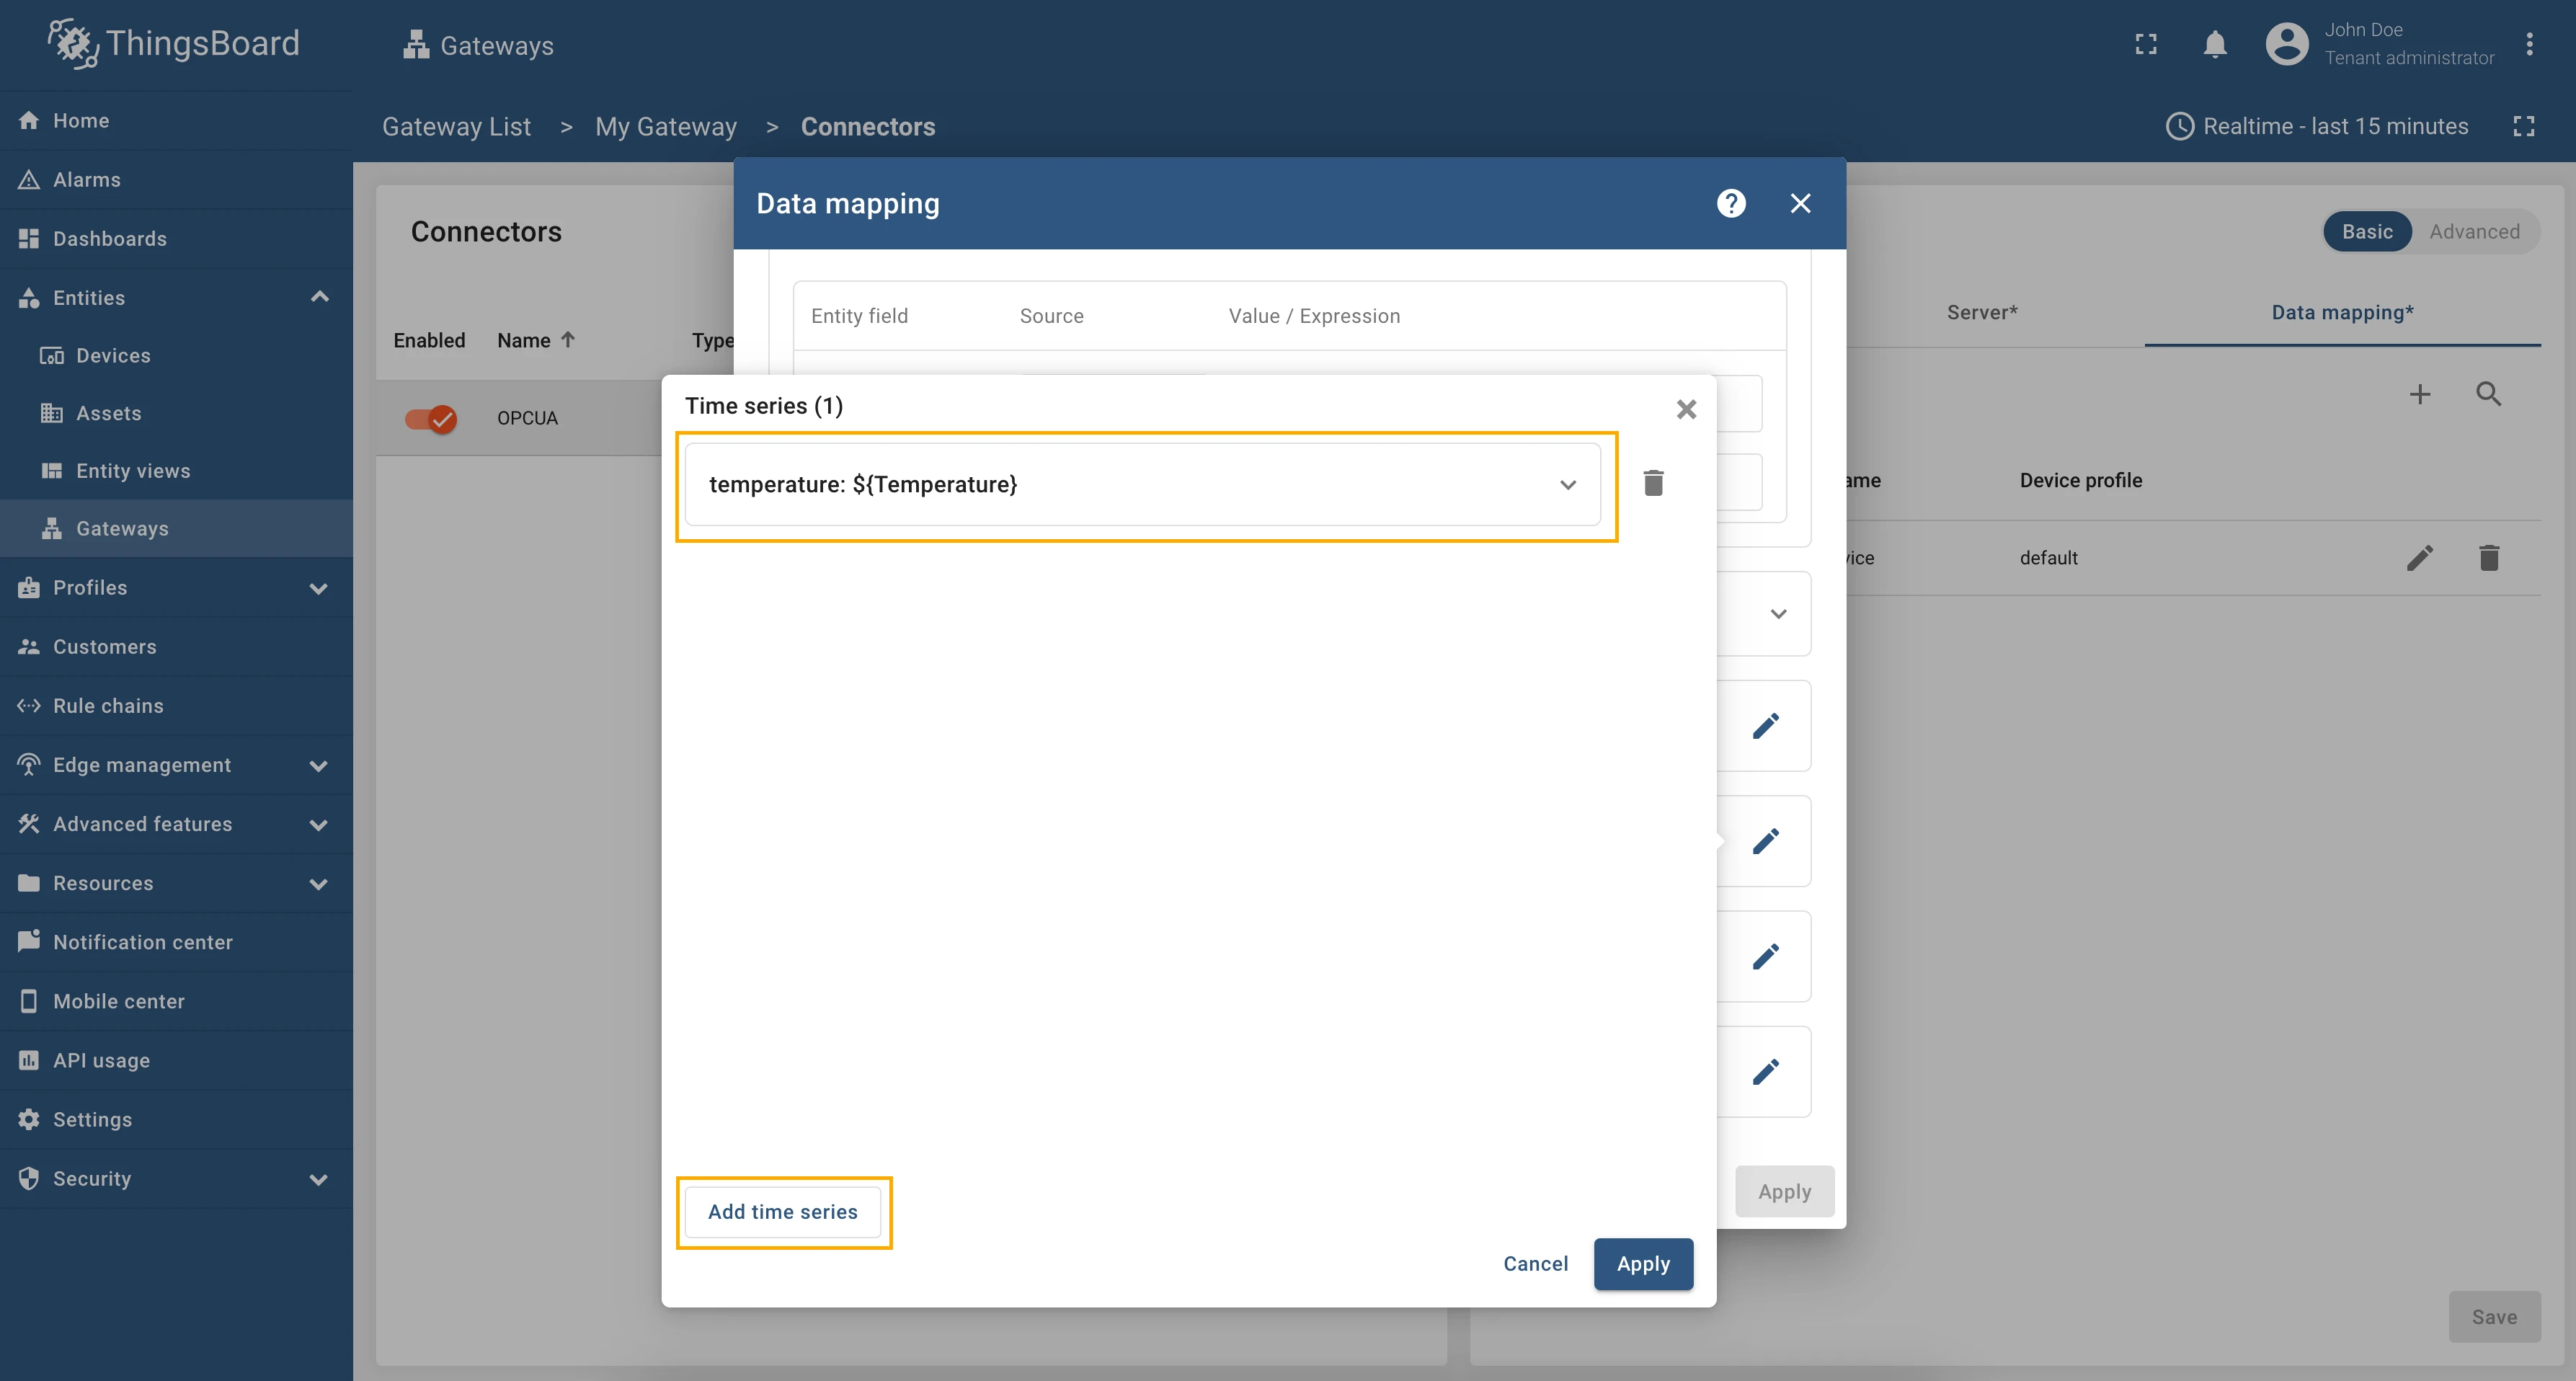
- In the opened window, click on the Add time series button;
- Fill in the fields:
- Fill in the Key field with the “temperature”;
- Select the Type field to the Path;
- Fill in the Value with ”${Temperature}”.
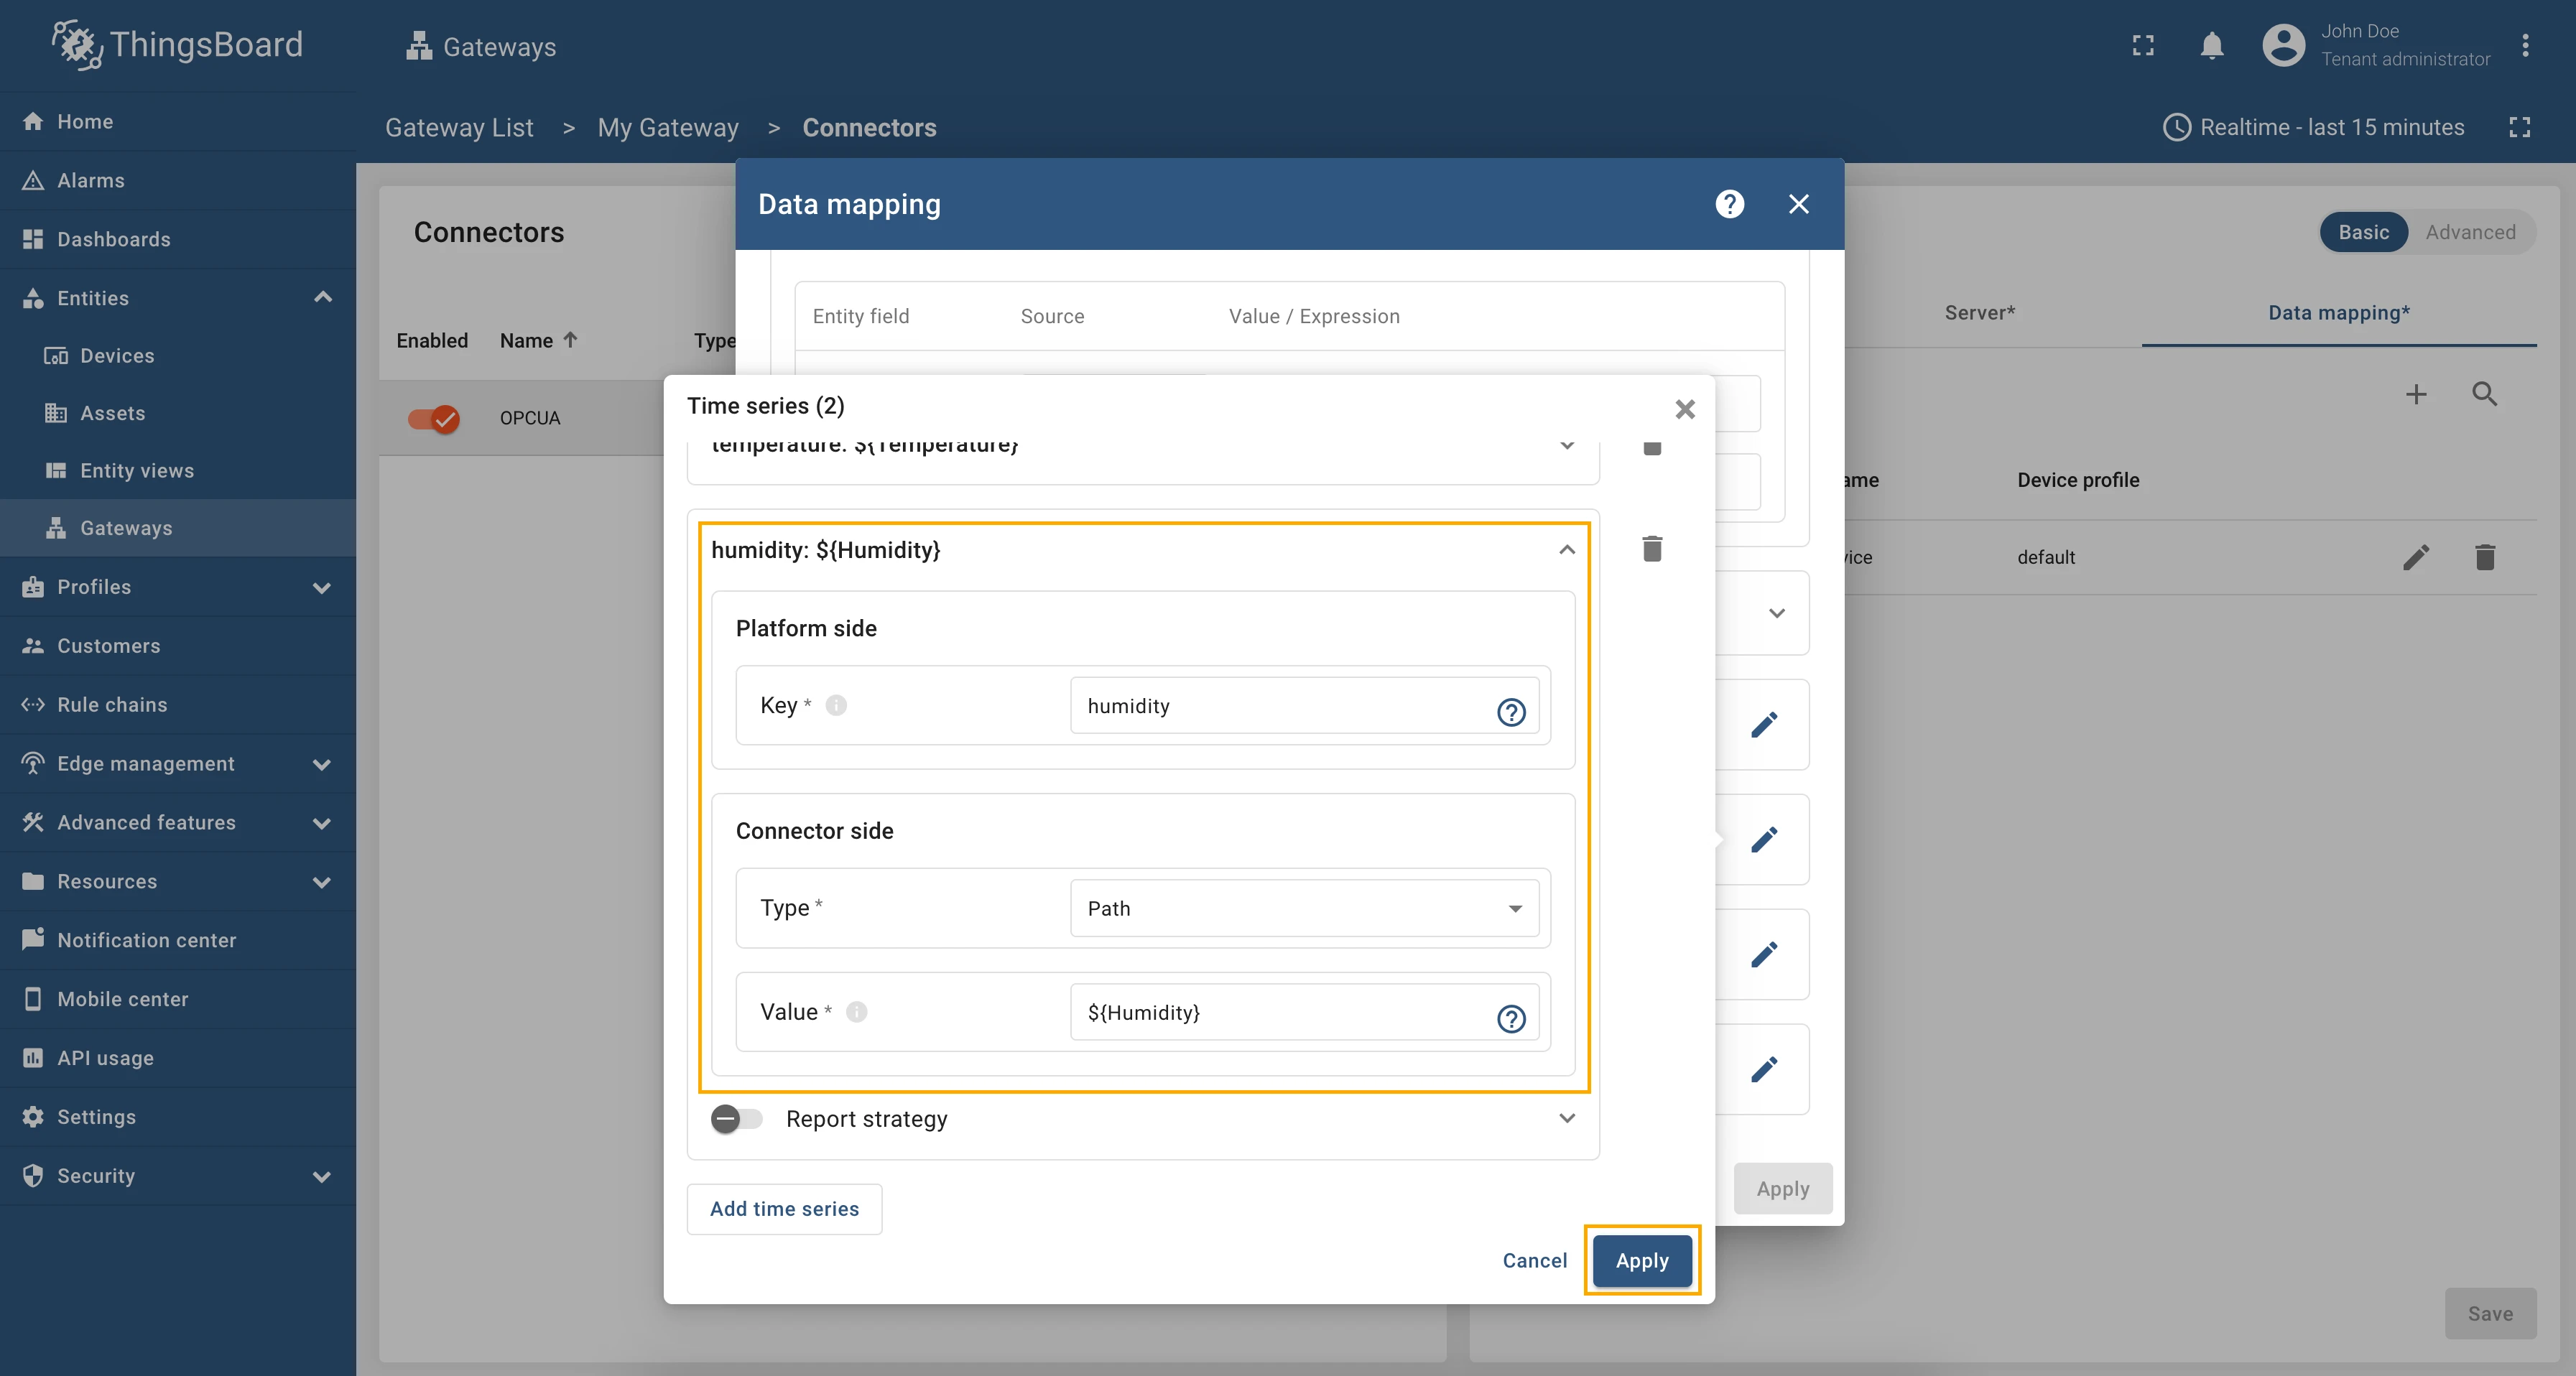
Let’s add another attribute. Collapse the recently added “temperature” time series, click the Add time series button, and fill in the fields with the following values, using the same process as before:
| Field name | Value |
|---|---|
| Key | humidity |
| Type | Path |
| Value | ${Humidity} |
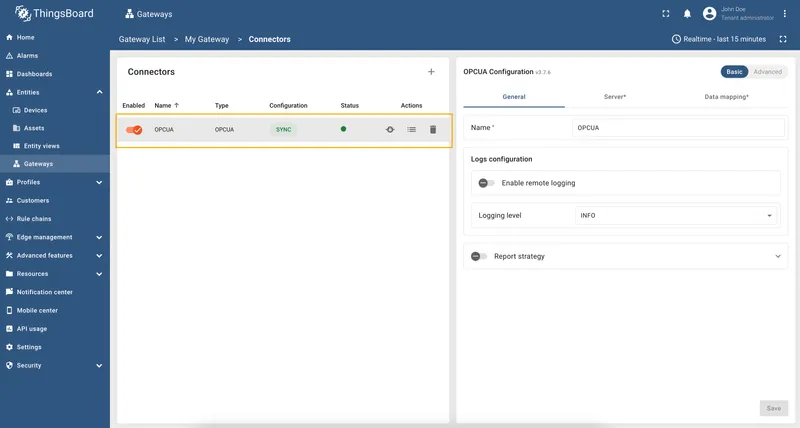
The final view of your configured connector will look like on the following image. Click the Add button after you’ve completed the configuration.
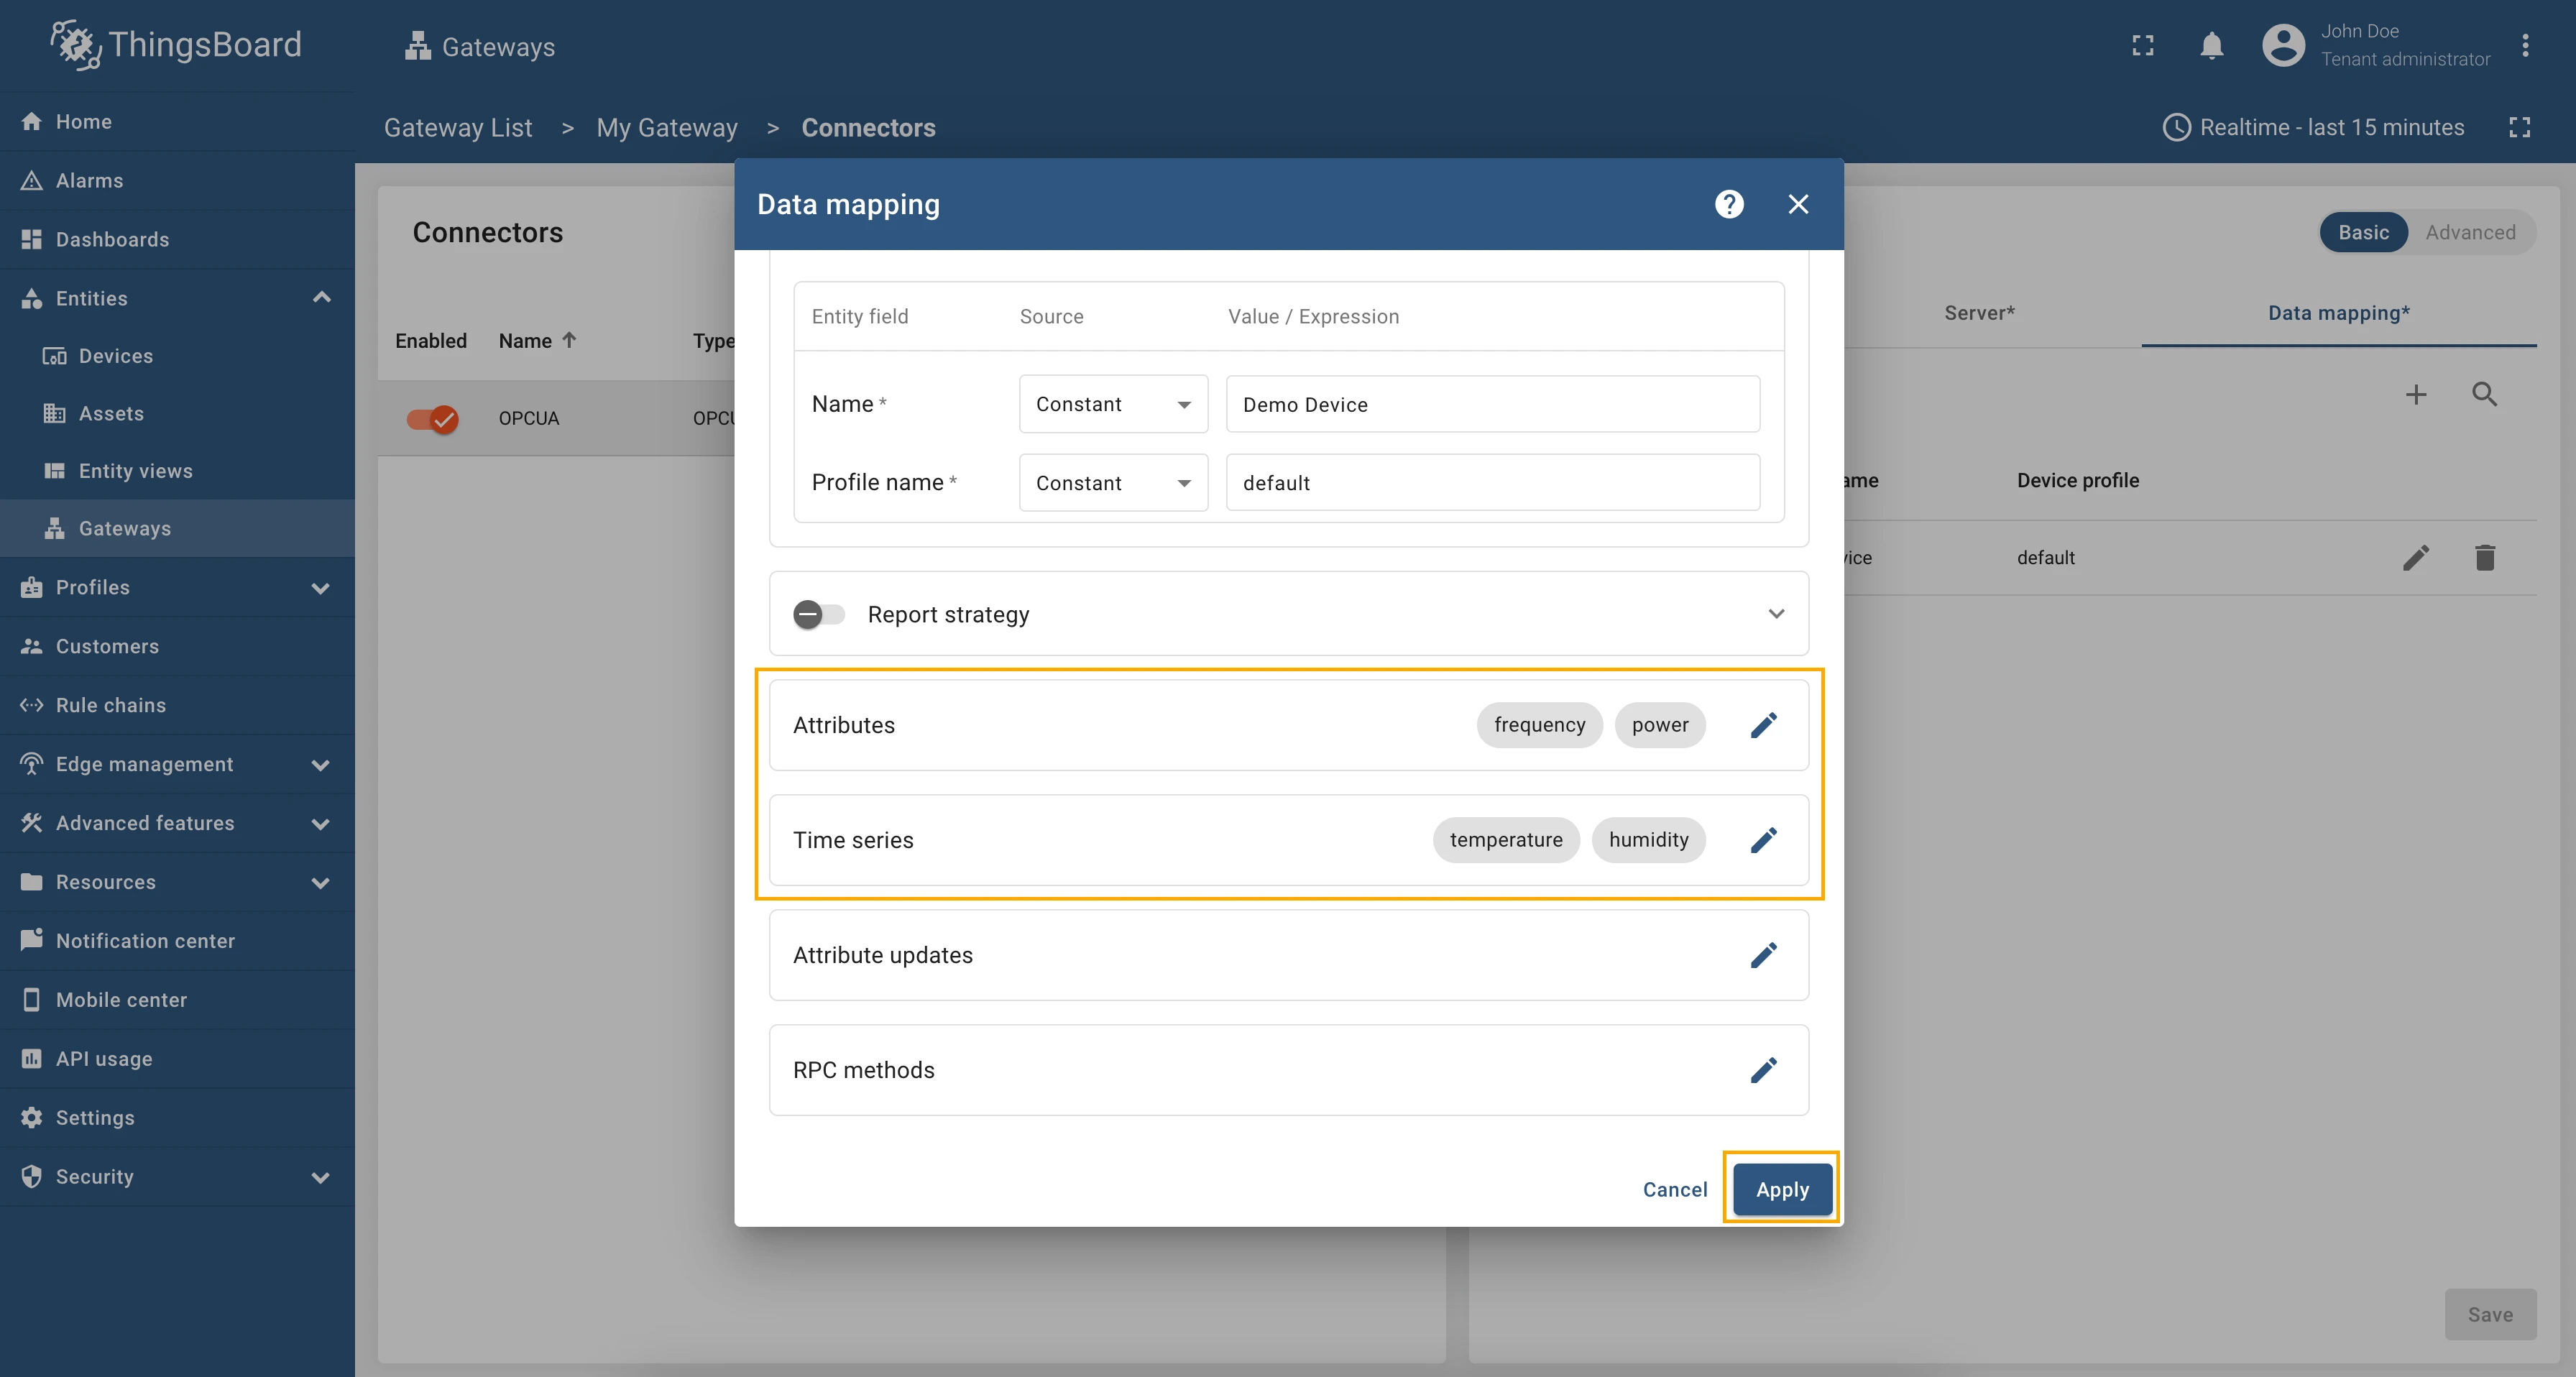
Finally, save the OPC-UA configuration by clicking the Save button.

Following the steps outlined, your gateway will receive and apply the new configuration. It will then synchronize its state with the remote server. You can view the synchronization status of the connector configuration in the Configuration column, which will indicate whether the gateway is successfully aligned with the remote settings.

Also, you can see the connector logs to make sure that the connector works, for this purpose, follow these steps:
-
In the General connector tab enable remove logging by turning on the Enable remote logging toggle. Choose DEBUG in the Log level drop-down menu. Click on the Save button to apply changes.

-
Click on logs icon to open connector logs page.

-
You can see the Logs table that consists of Created time, Status and Message columns.
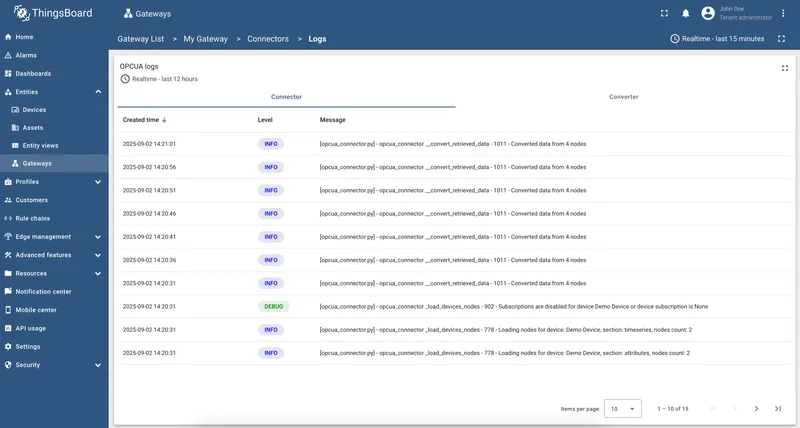


For now, the gateway is ready to process data through the newly created and configured OPC-UA connector.
Step 4. Check device data
Section titled “Step 4. Check device data”To review the data uploaded from your gateway, use the following steps:
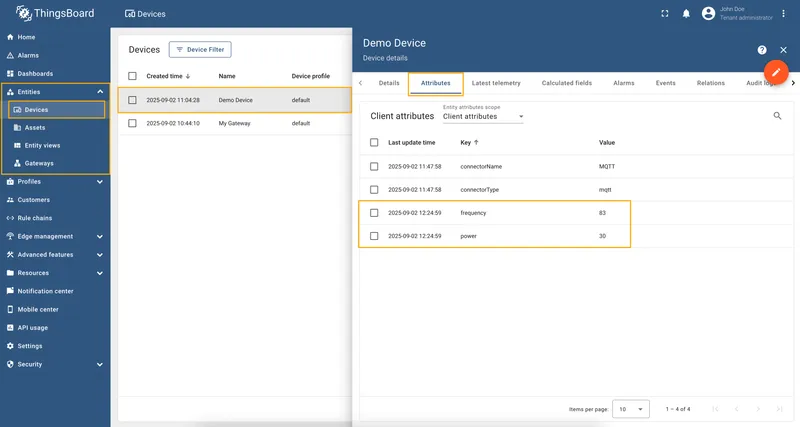
-
Navigate to the Entities > Devices page and click on the created device. This will open the device details page. From there, switch to the Attributes tab to view the attributes that were configured in the connector.
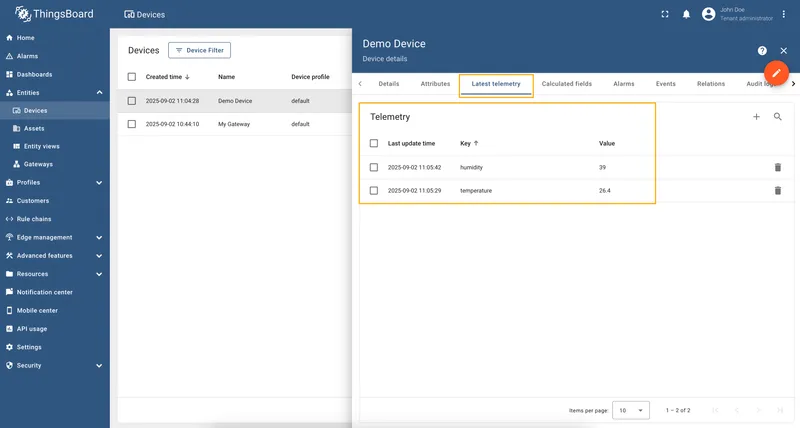
-
To view real-time telemetry data from the device, navigate to the Latest Telemetry tab. Here, you will find the telemetry data being sent by the device, including metrics like “humidity” and “temperature”. This tab provides real-time device telemetry updates.


Configure other connectors
Section titled “Configure other connectors”After the successful installation and configuration of your first connector, you can configure other connectors to connect to different devices. You can find more information about connectors in the following articles:
- MQTT connector
- OPC-UA connector
- Modbus connector
- BLE connector
- Request connector
- REST connector
- CAN connector
- FTP connector
- Socket connector
- XMPP connector
- BACnet connector
- OCPP connector
- ODBC connector
- KNX connector
- SNMP connector
- Custom connector
More about ThingsBoard IoT Gateways Dashboard, you can read here.
Was this helpful?