Metric Explorer
The Trendz Metric Explorer lets you validate which telemetries have data, review statistics, analyze time patterns, and explore general telemetry behavior for any device or asset. It also enables generating new metrics from existing ones using AI Assistance or AI Suggestions.
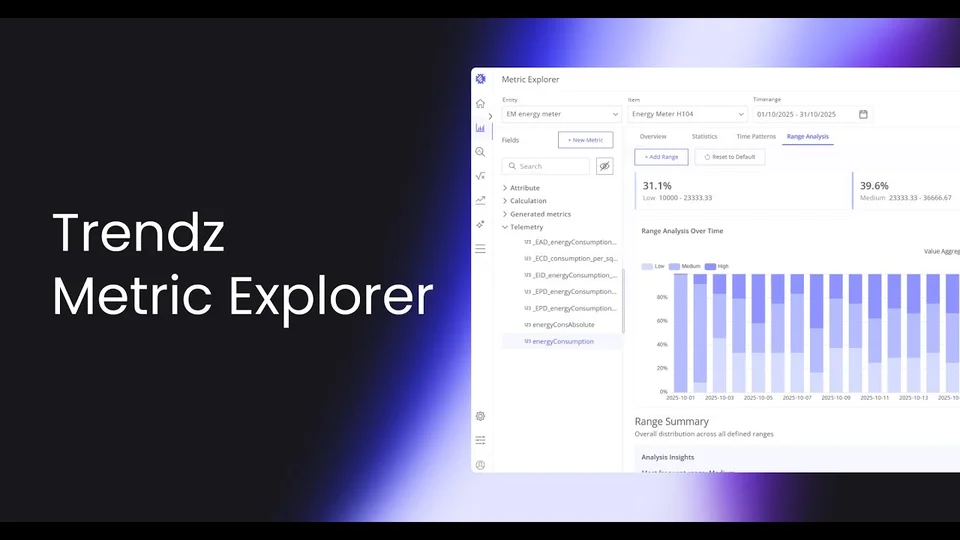
Playing this video loads it from YouTube (Google), which sets cookies on its own domain. See our Cookie Policy.
Video: https://www.youtube.com/watch?v=r2pqMzdXEHE
Interface
Section titled “Interface”You can access the Metric Explorer by clicking the chart icon () in the Trendz navigation.
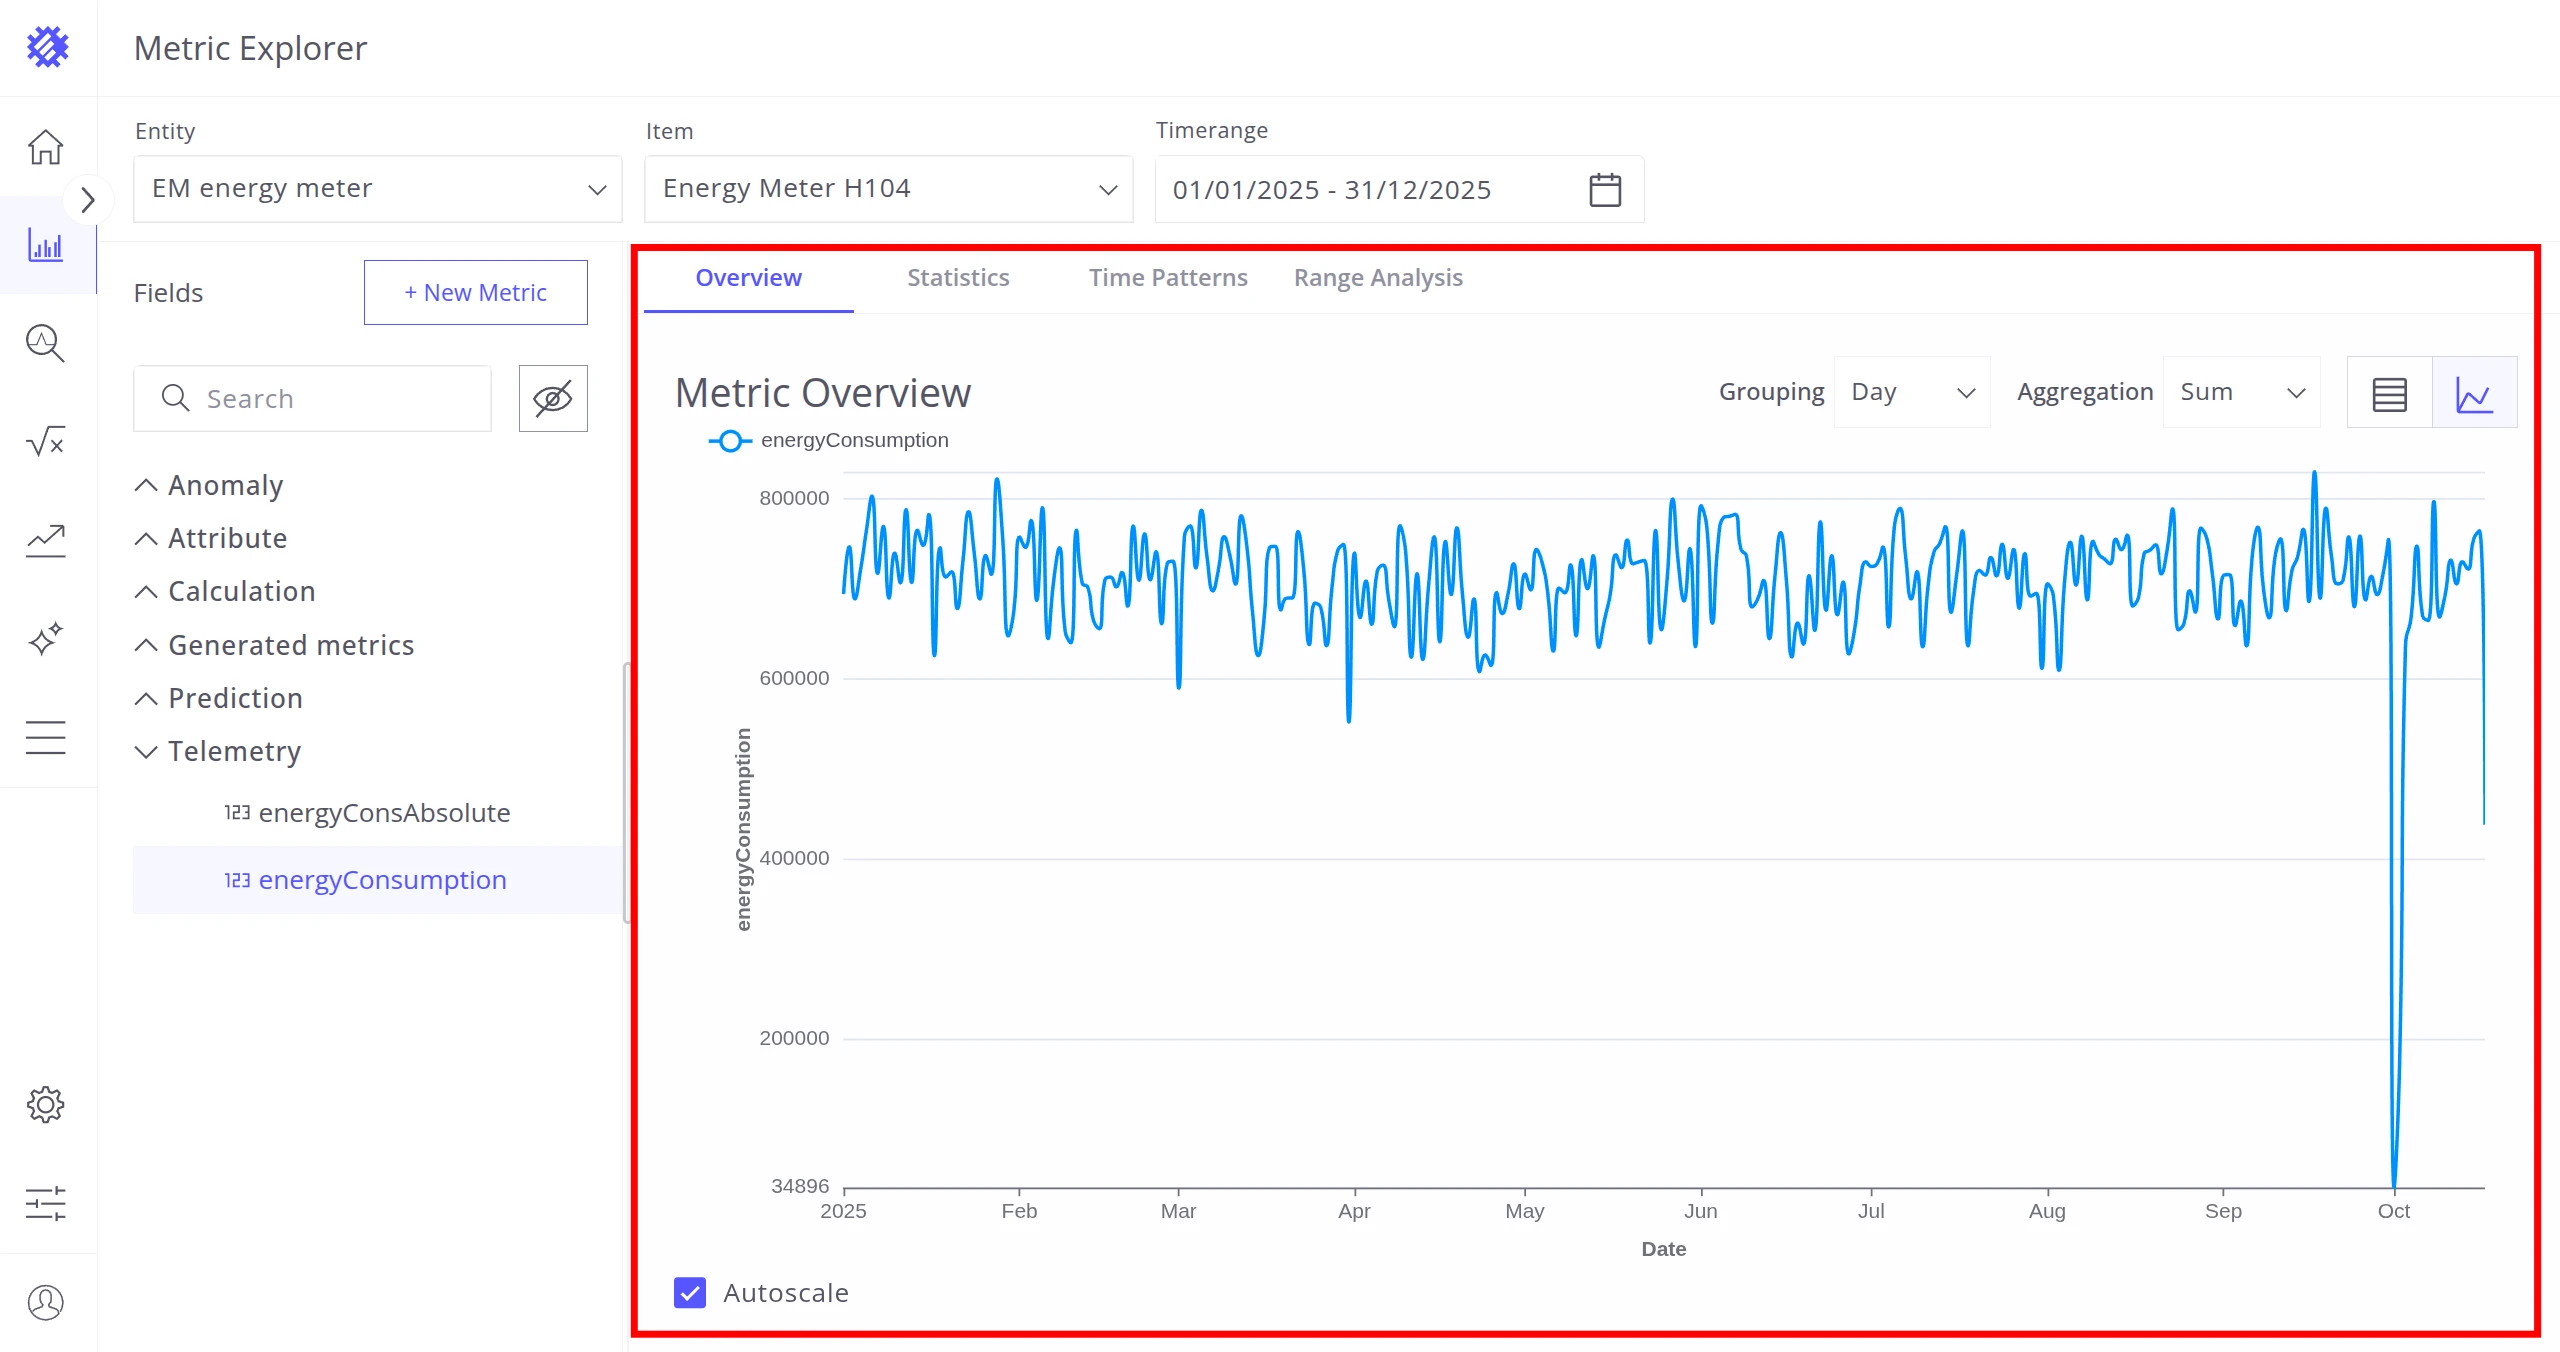
The interface has three main sections:
┌──────────────────────────────────────────────────────┐ │ HEADER — Entity / Item / Timerange │ ├─────────────────────────┬────────────────────────────┤ │ FIELDS SECTION │ TABS SECTION │ │ │ │ │ • Anomaly │ ┌─ Overview │ │ • Attribute │ ├─ Statistics │ │ • Calculation │ ├─ Time Patterns │ │ • Generated Metrics │ └─ Range Analysis │ │ • Prediction │ │ │ • Telemetry │ │ └─────────────────────────┴────────────────────────────┘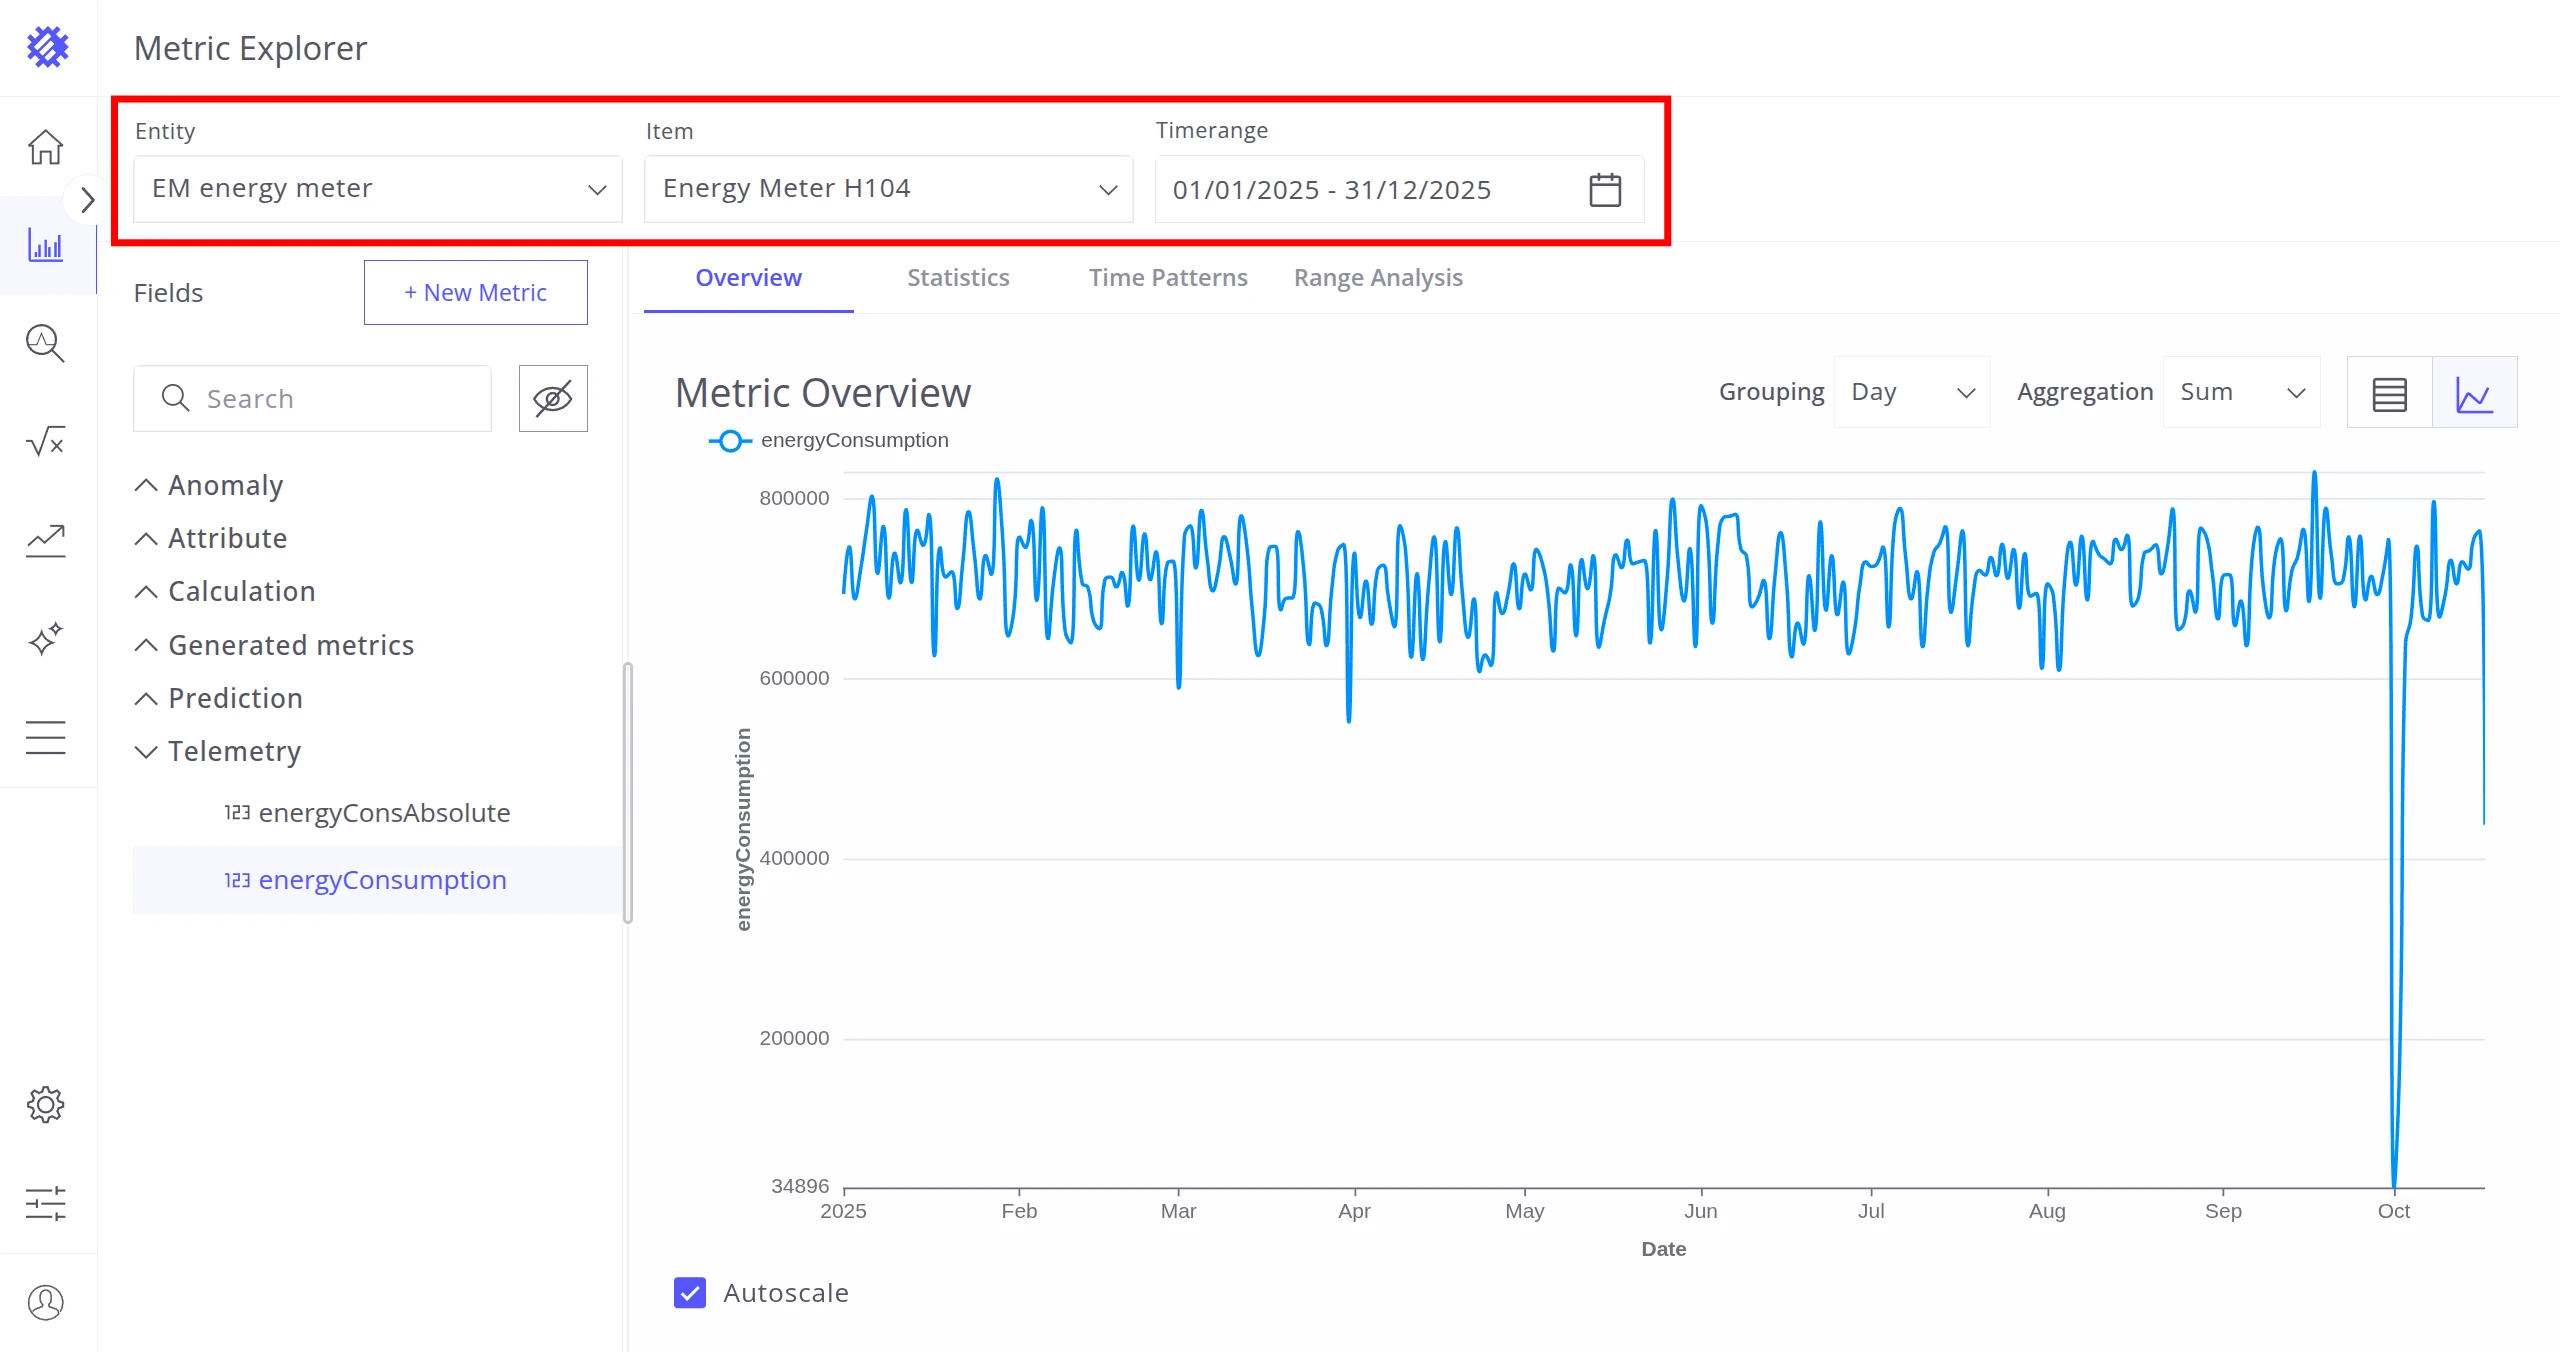
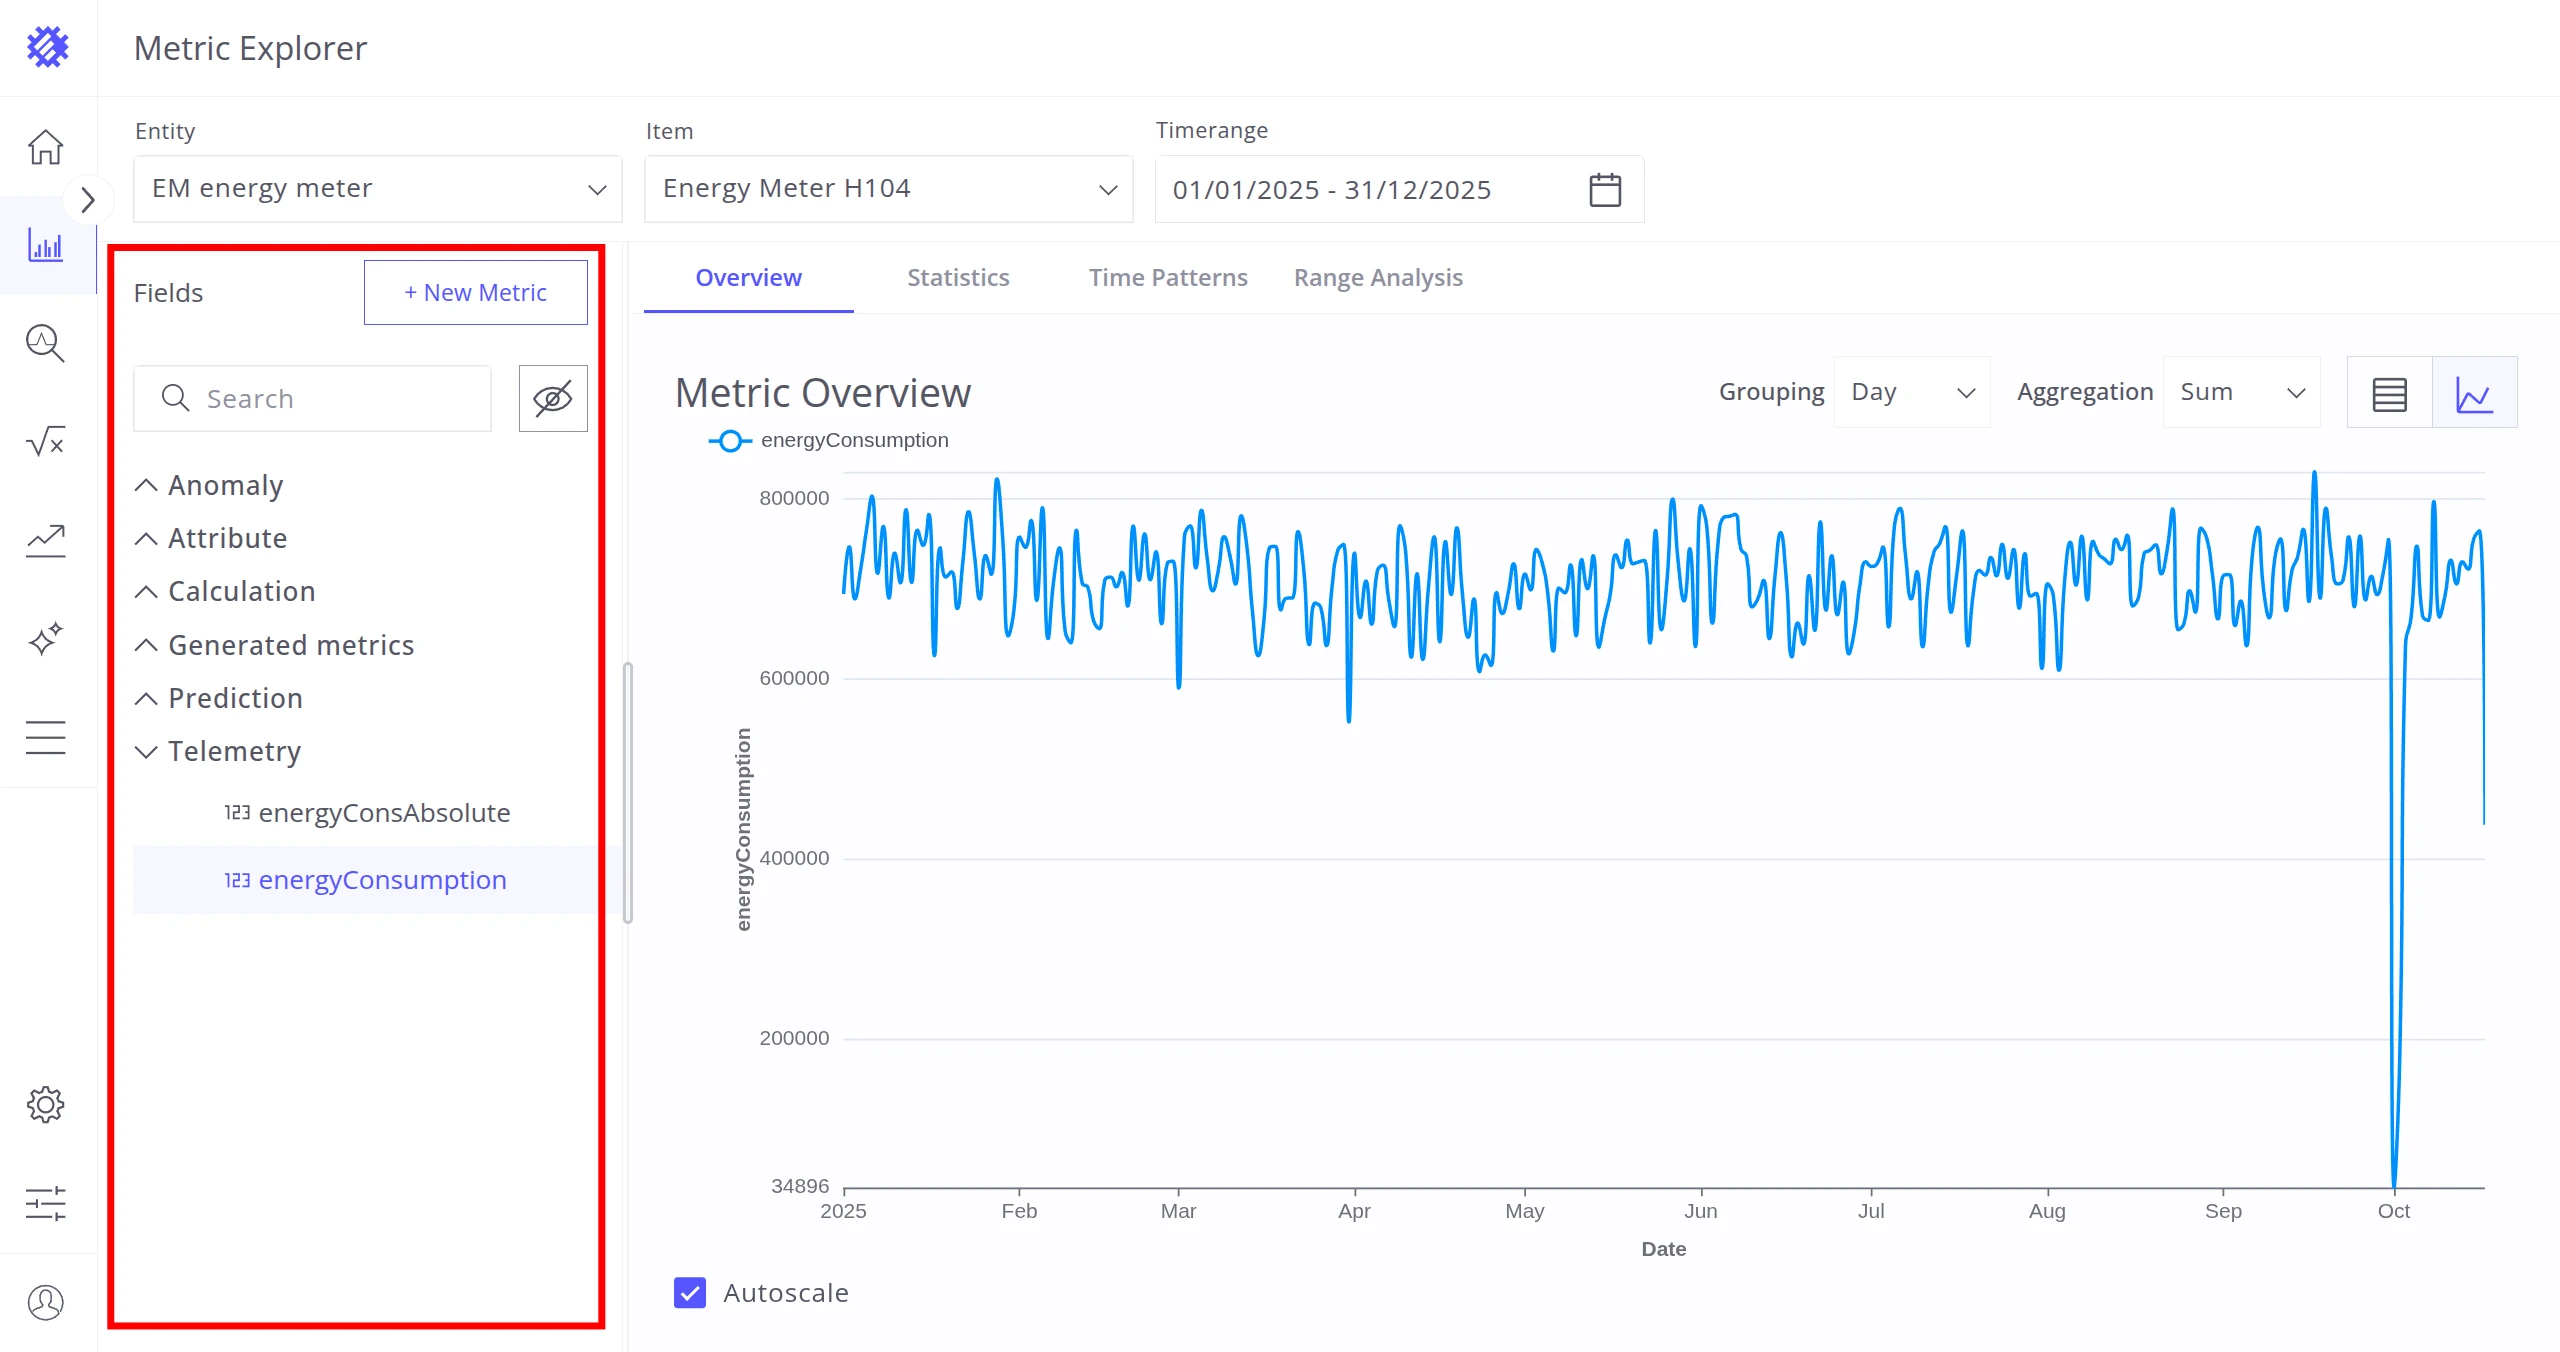
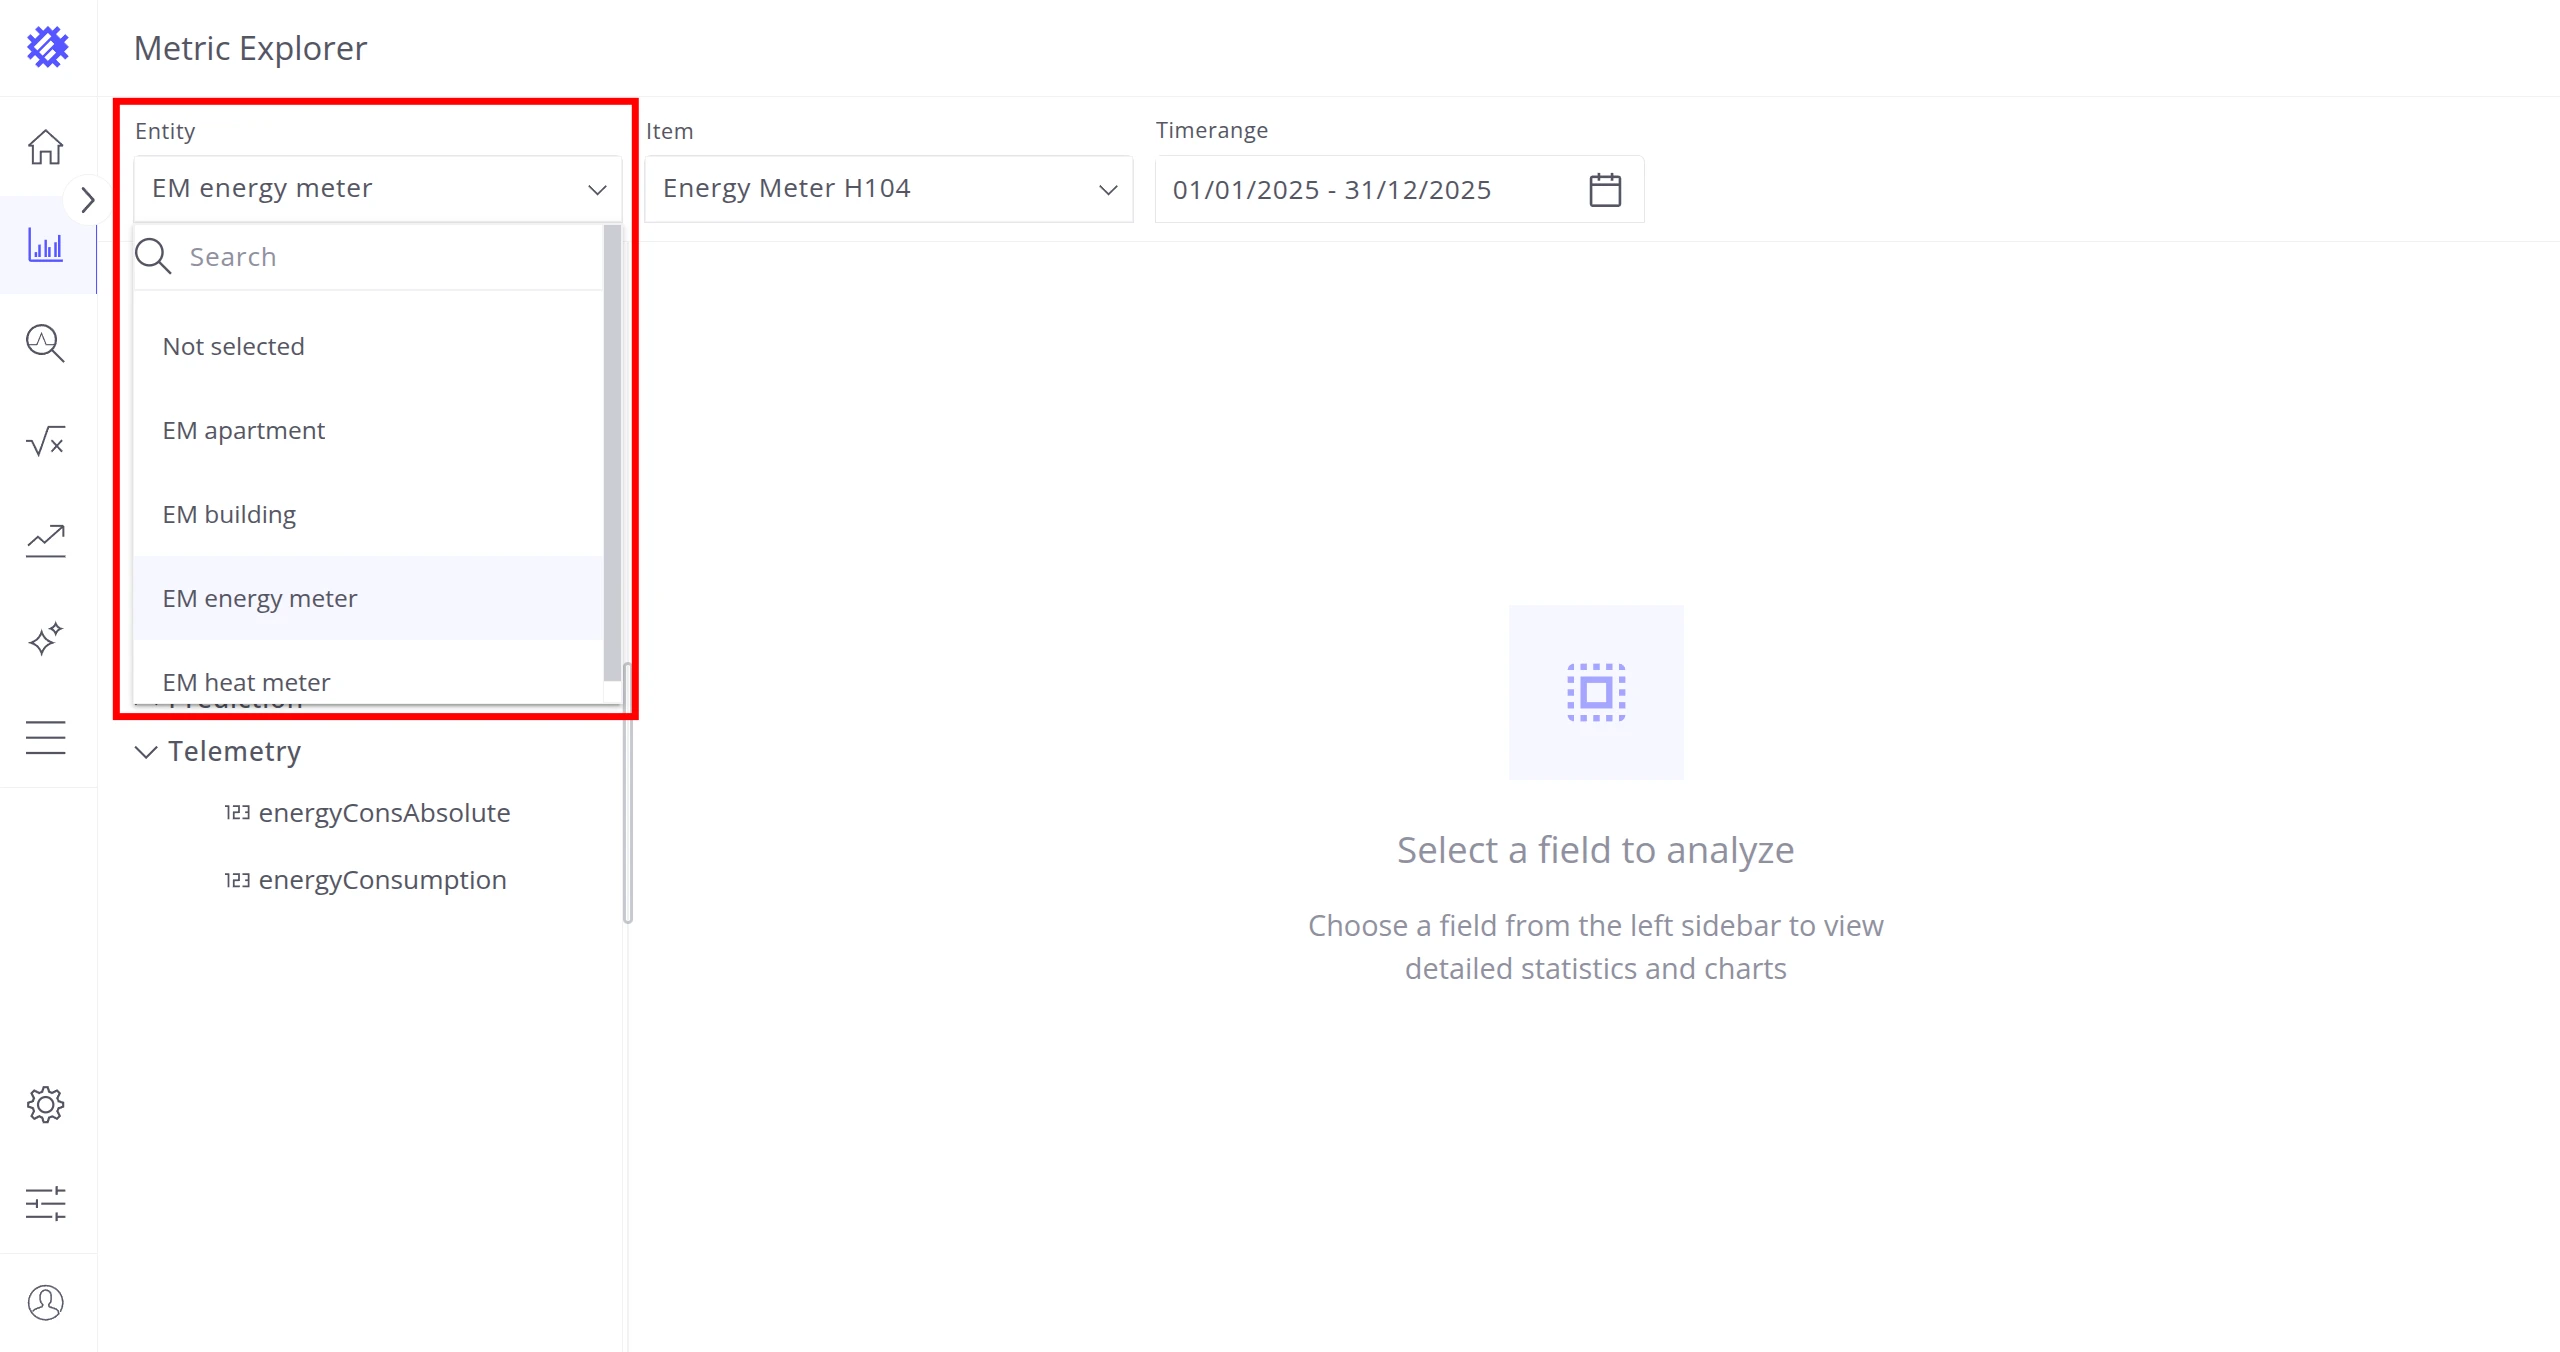
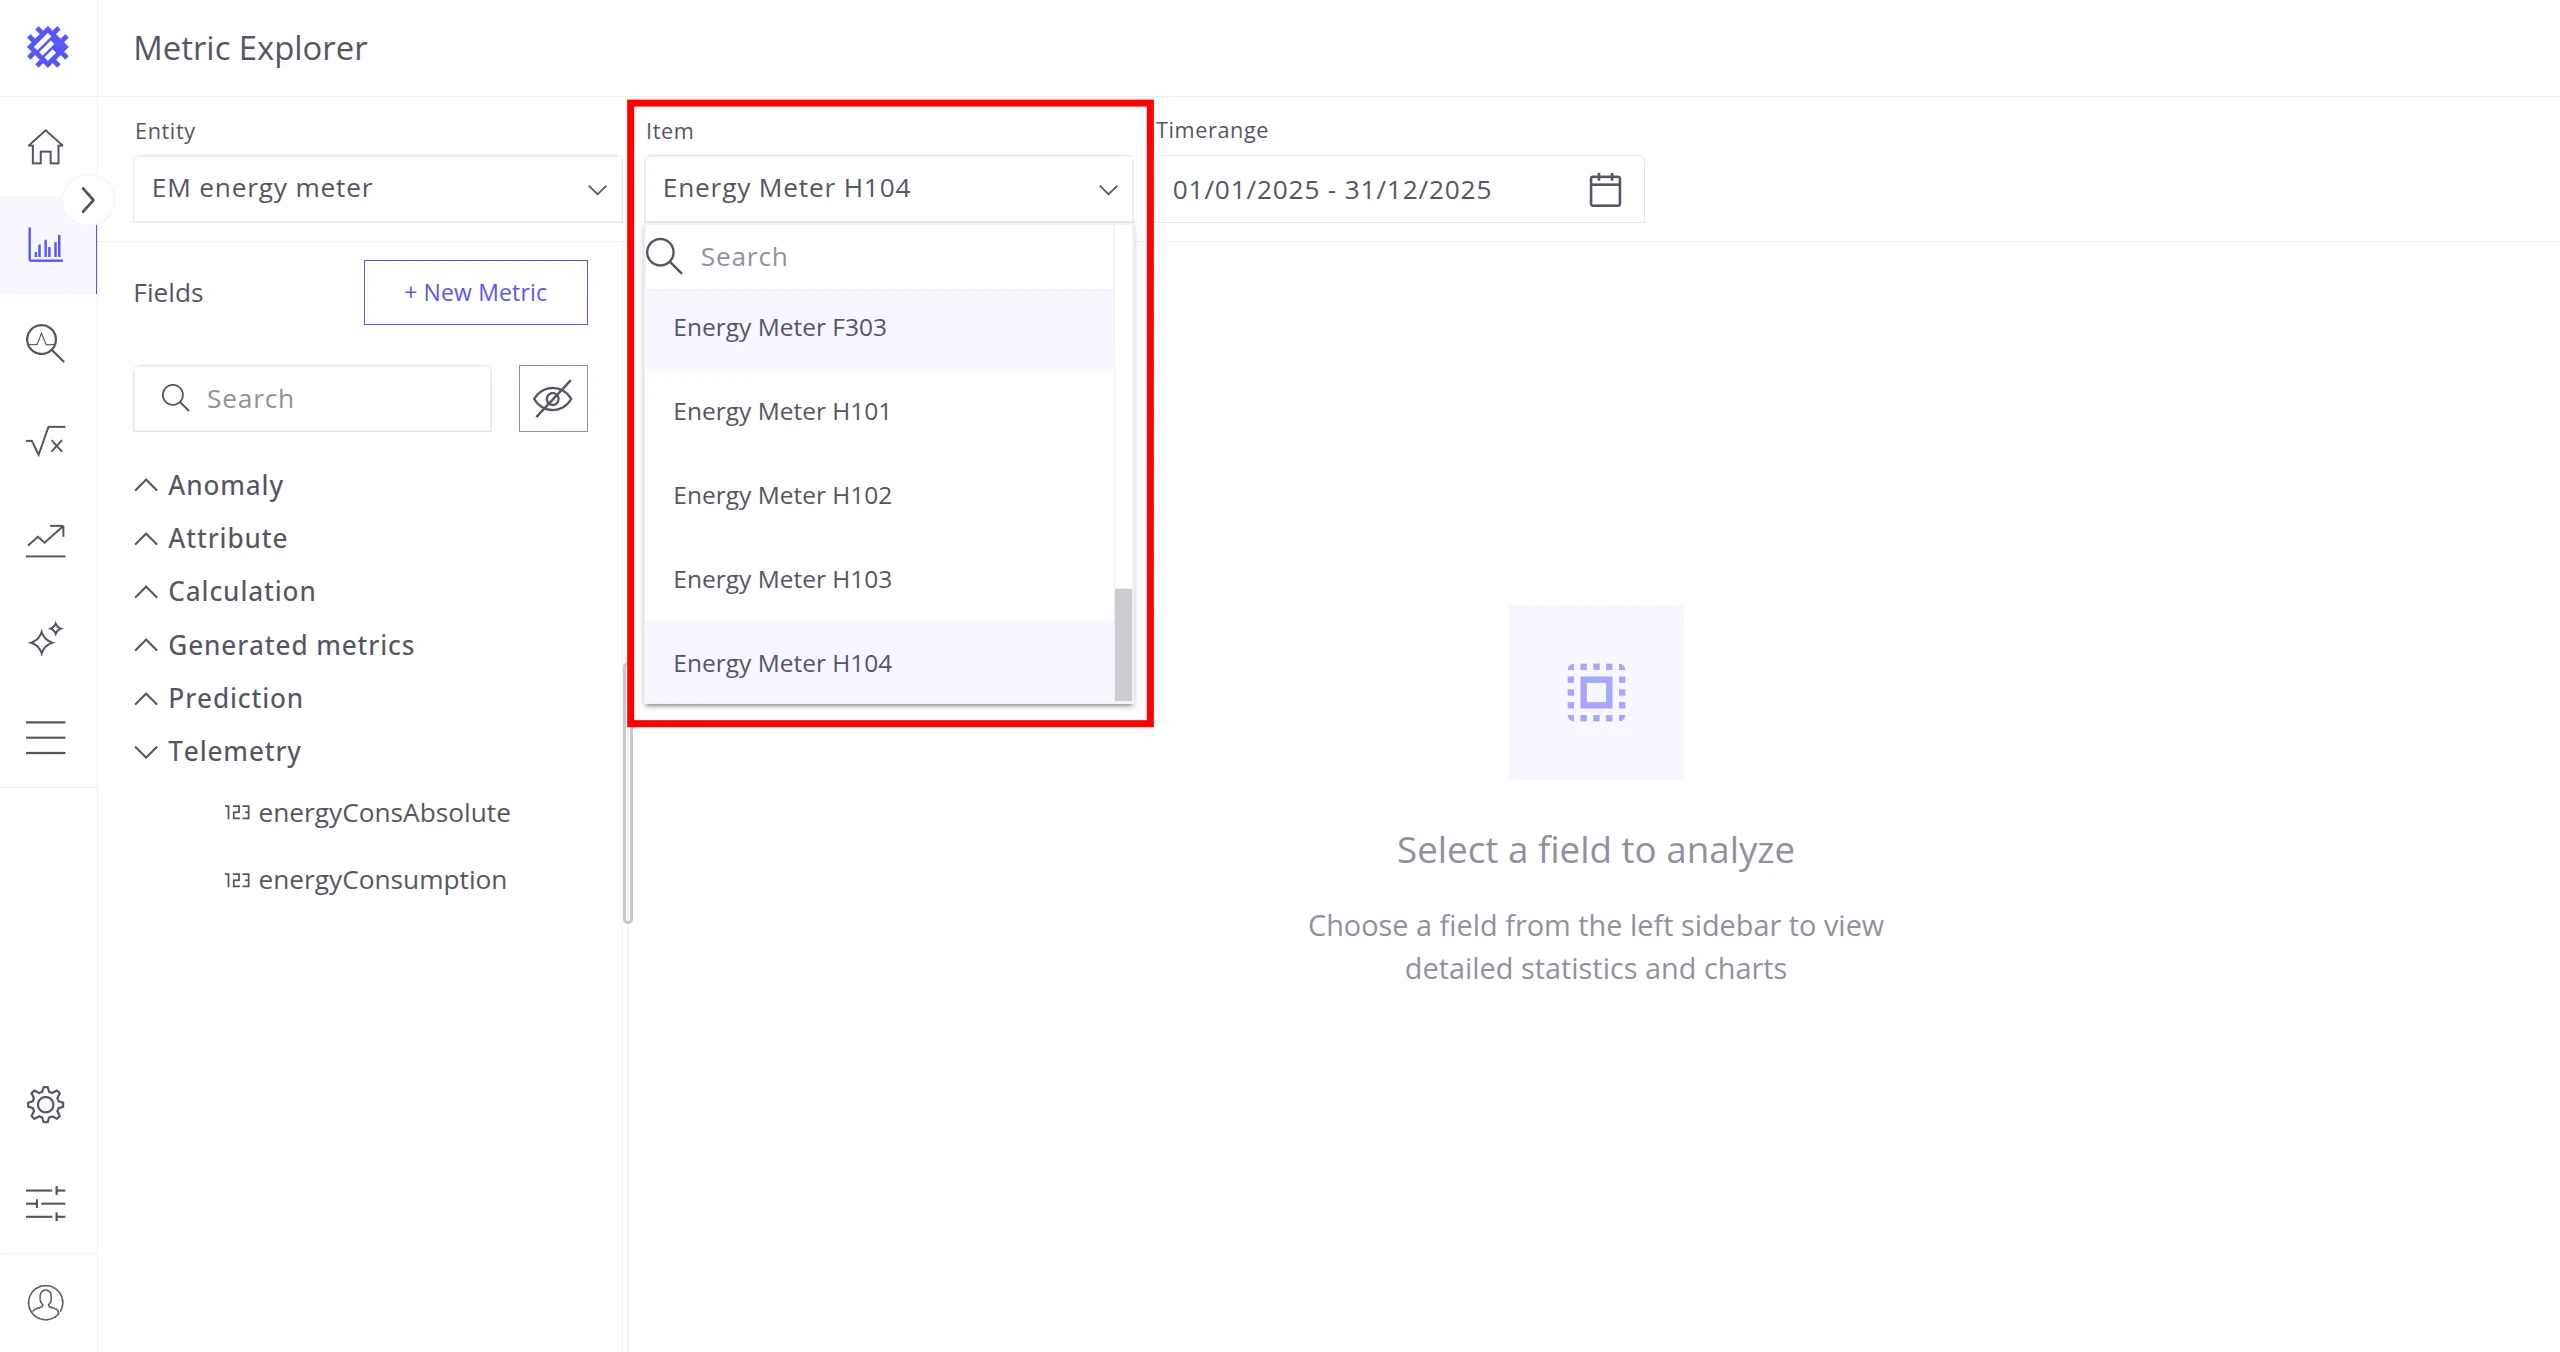
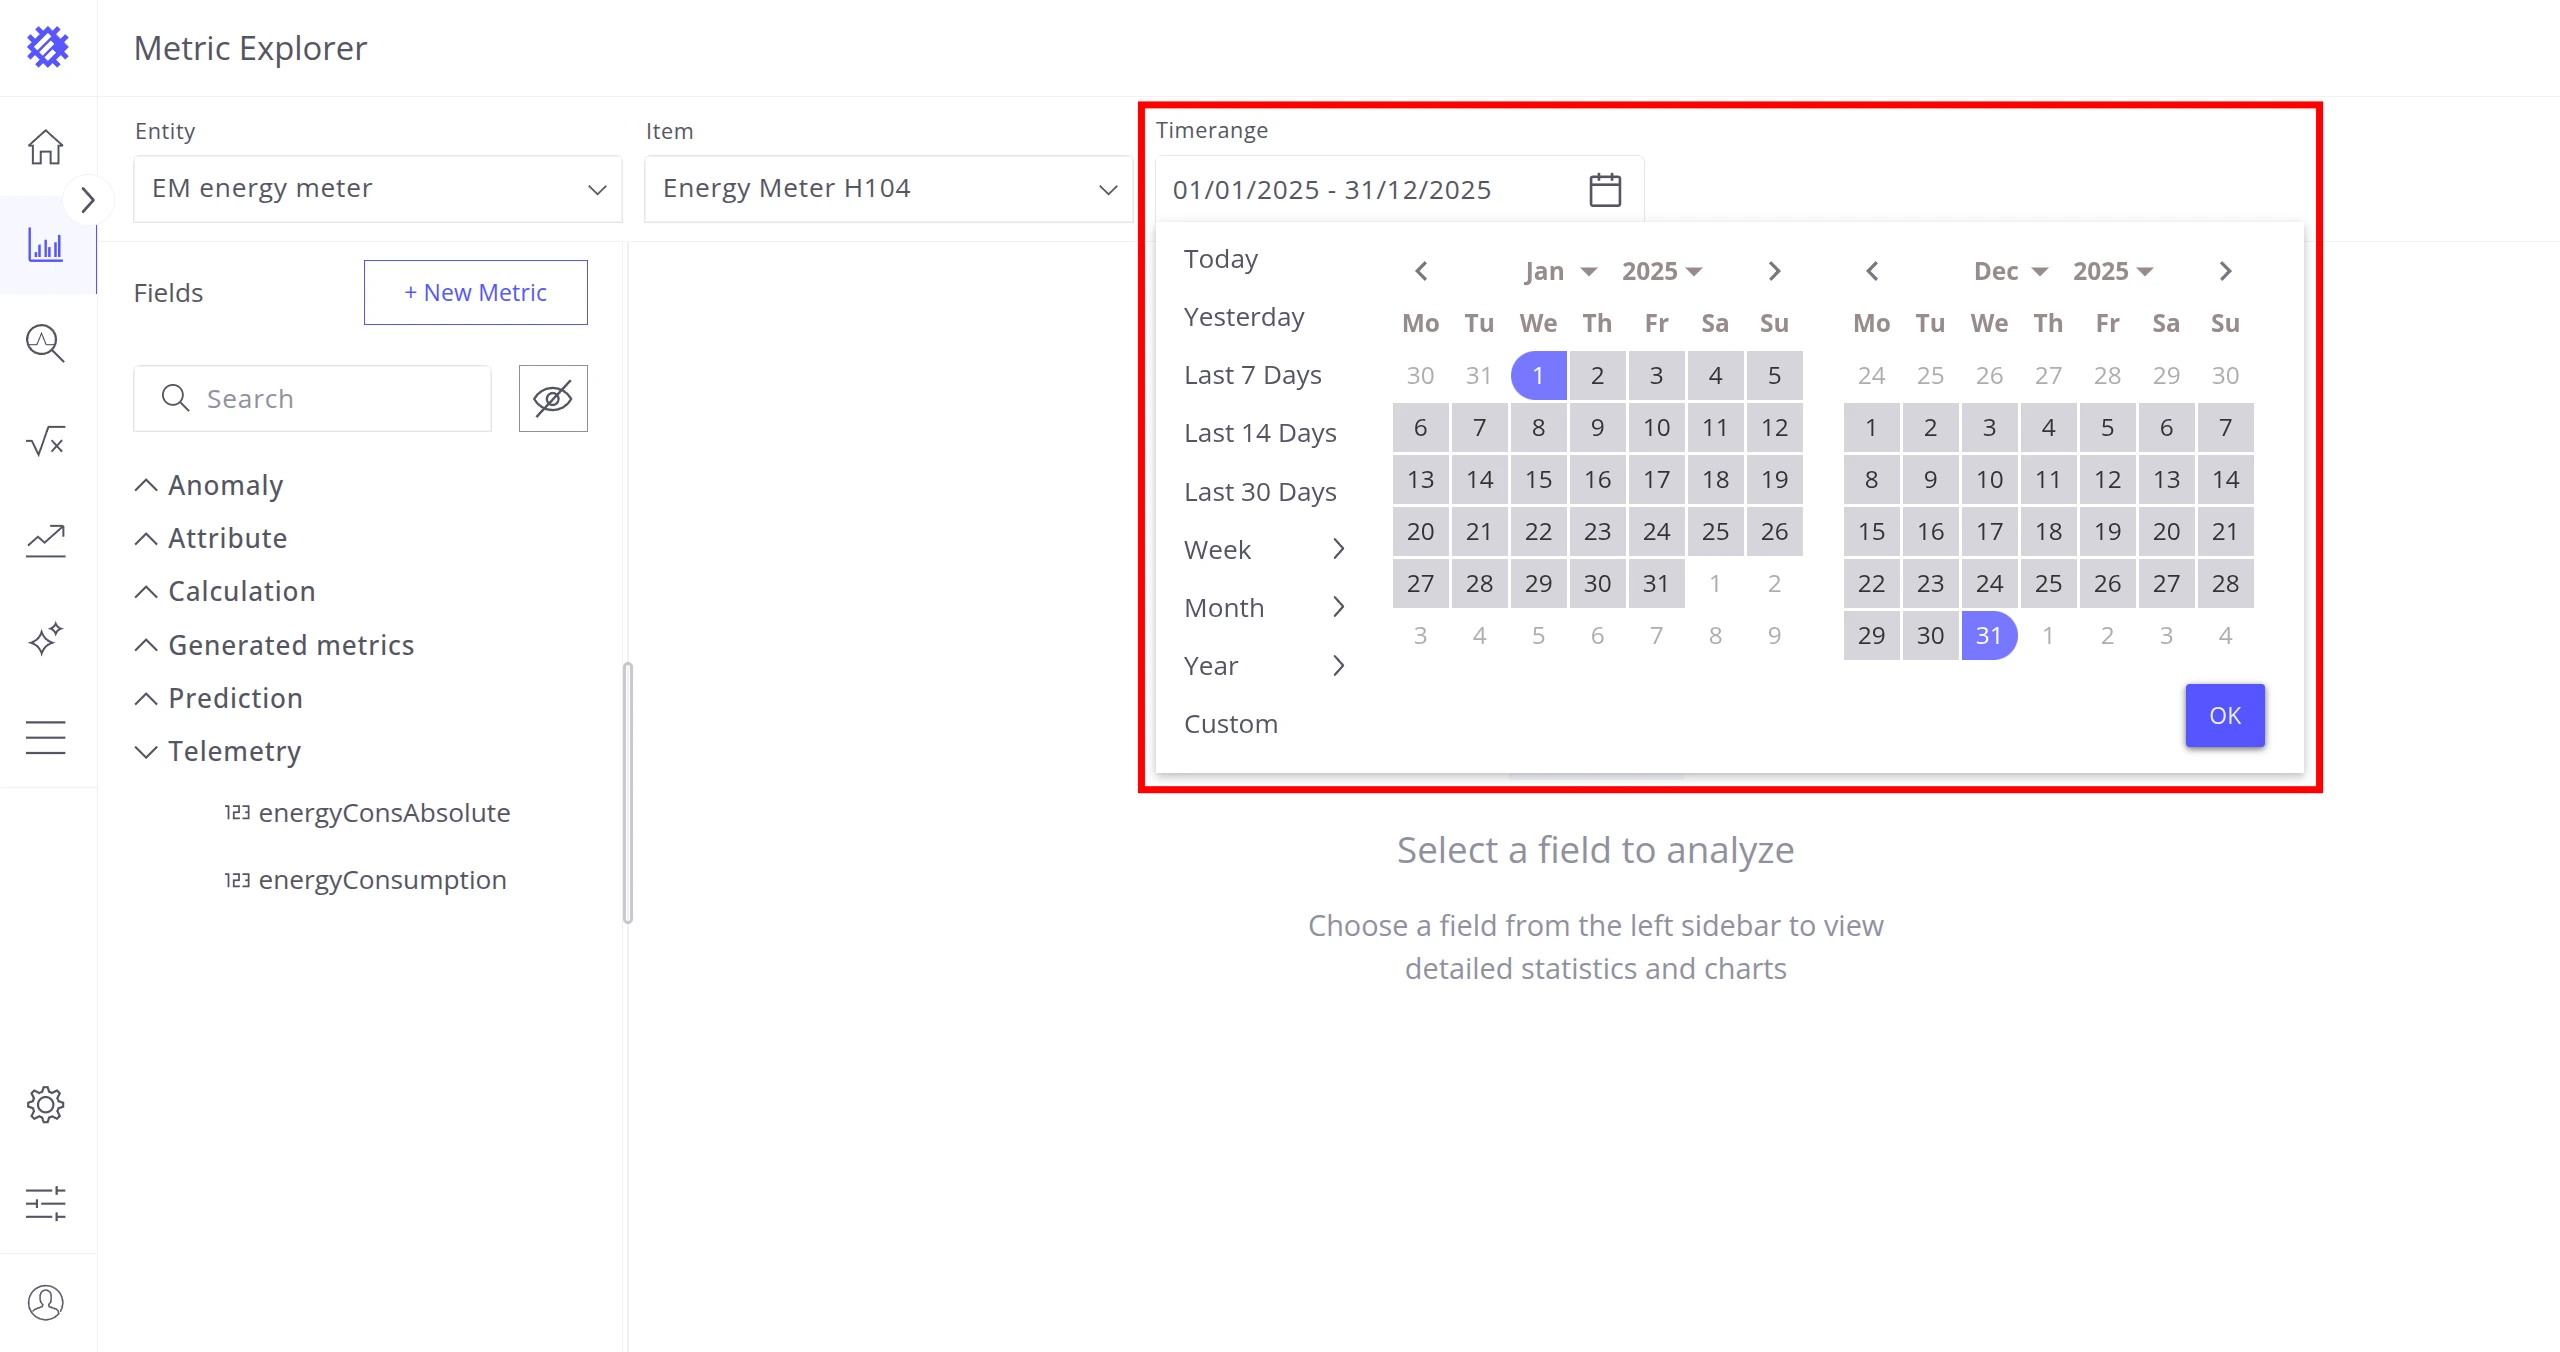
To begin, select an Entity (Device or Asset profile), an Item (Device or Asset) to explore, and specify the timerange for the analysis. These settings can be changed at any time.
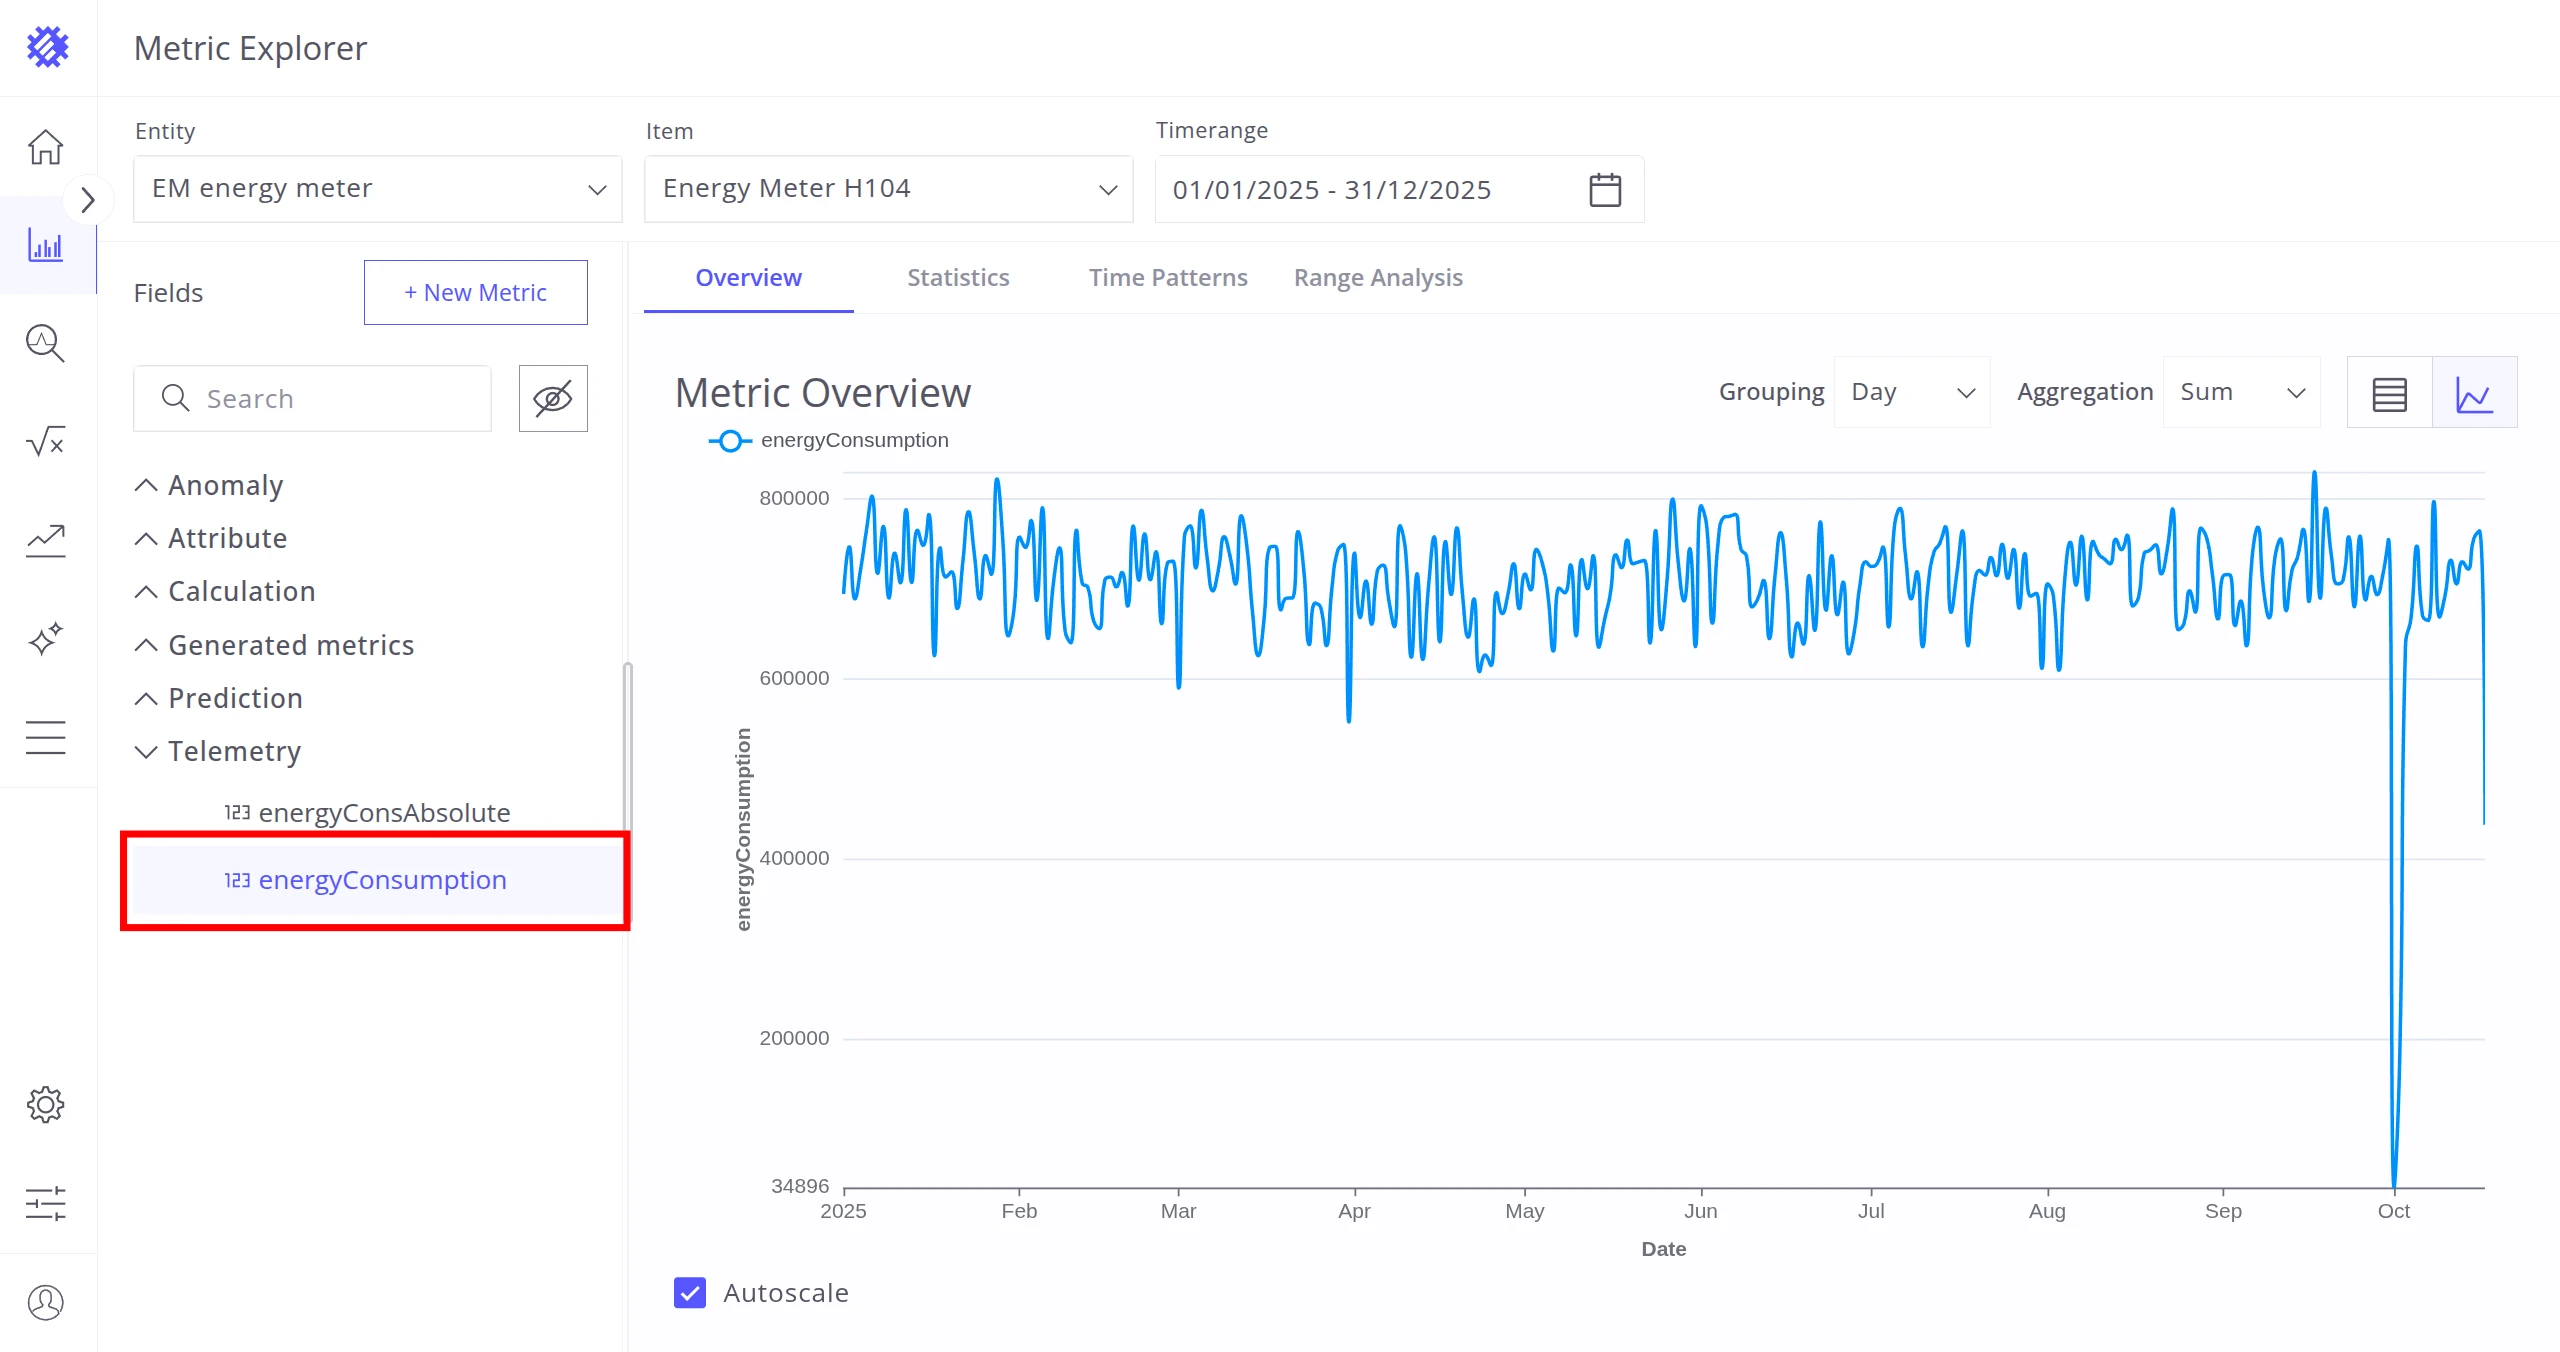
After selecting the entity, item, and timerange, choose a metric (telemetry or attribute) for analysis.
Fields Section
Section titled “Fields Section”The Fields Section shows all telemetries and attributes available in both ThingsBoard and Trendz, divided into up to six groups:
| Group | Description |
|---|---|
| Anomaly | Anomaly Score or Anomaly Score Index detected by Trendz Anomaly Models and saved to ThingsBoard. |
| Attribute | Attributes from ThingsBoard. |
| Calculation | Calculations saved by Trendz Calculation Fields to ThingsBoard. |
| Generated Metrics | Metrics created directly in the Metric Explorer. |
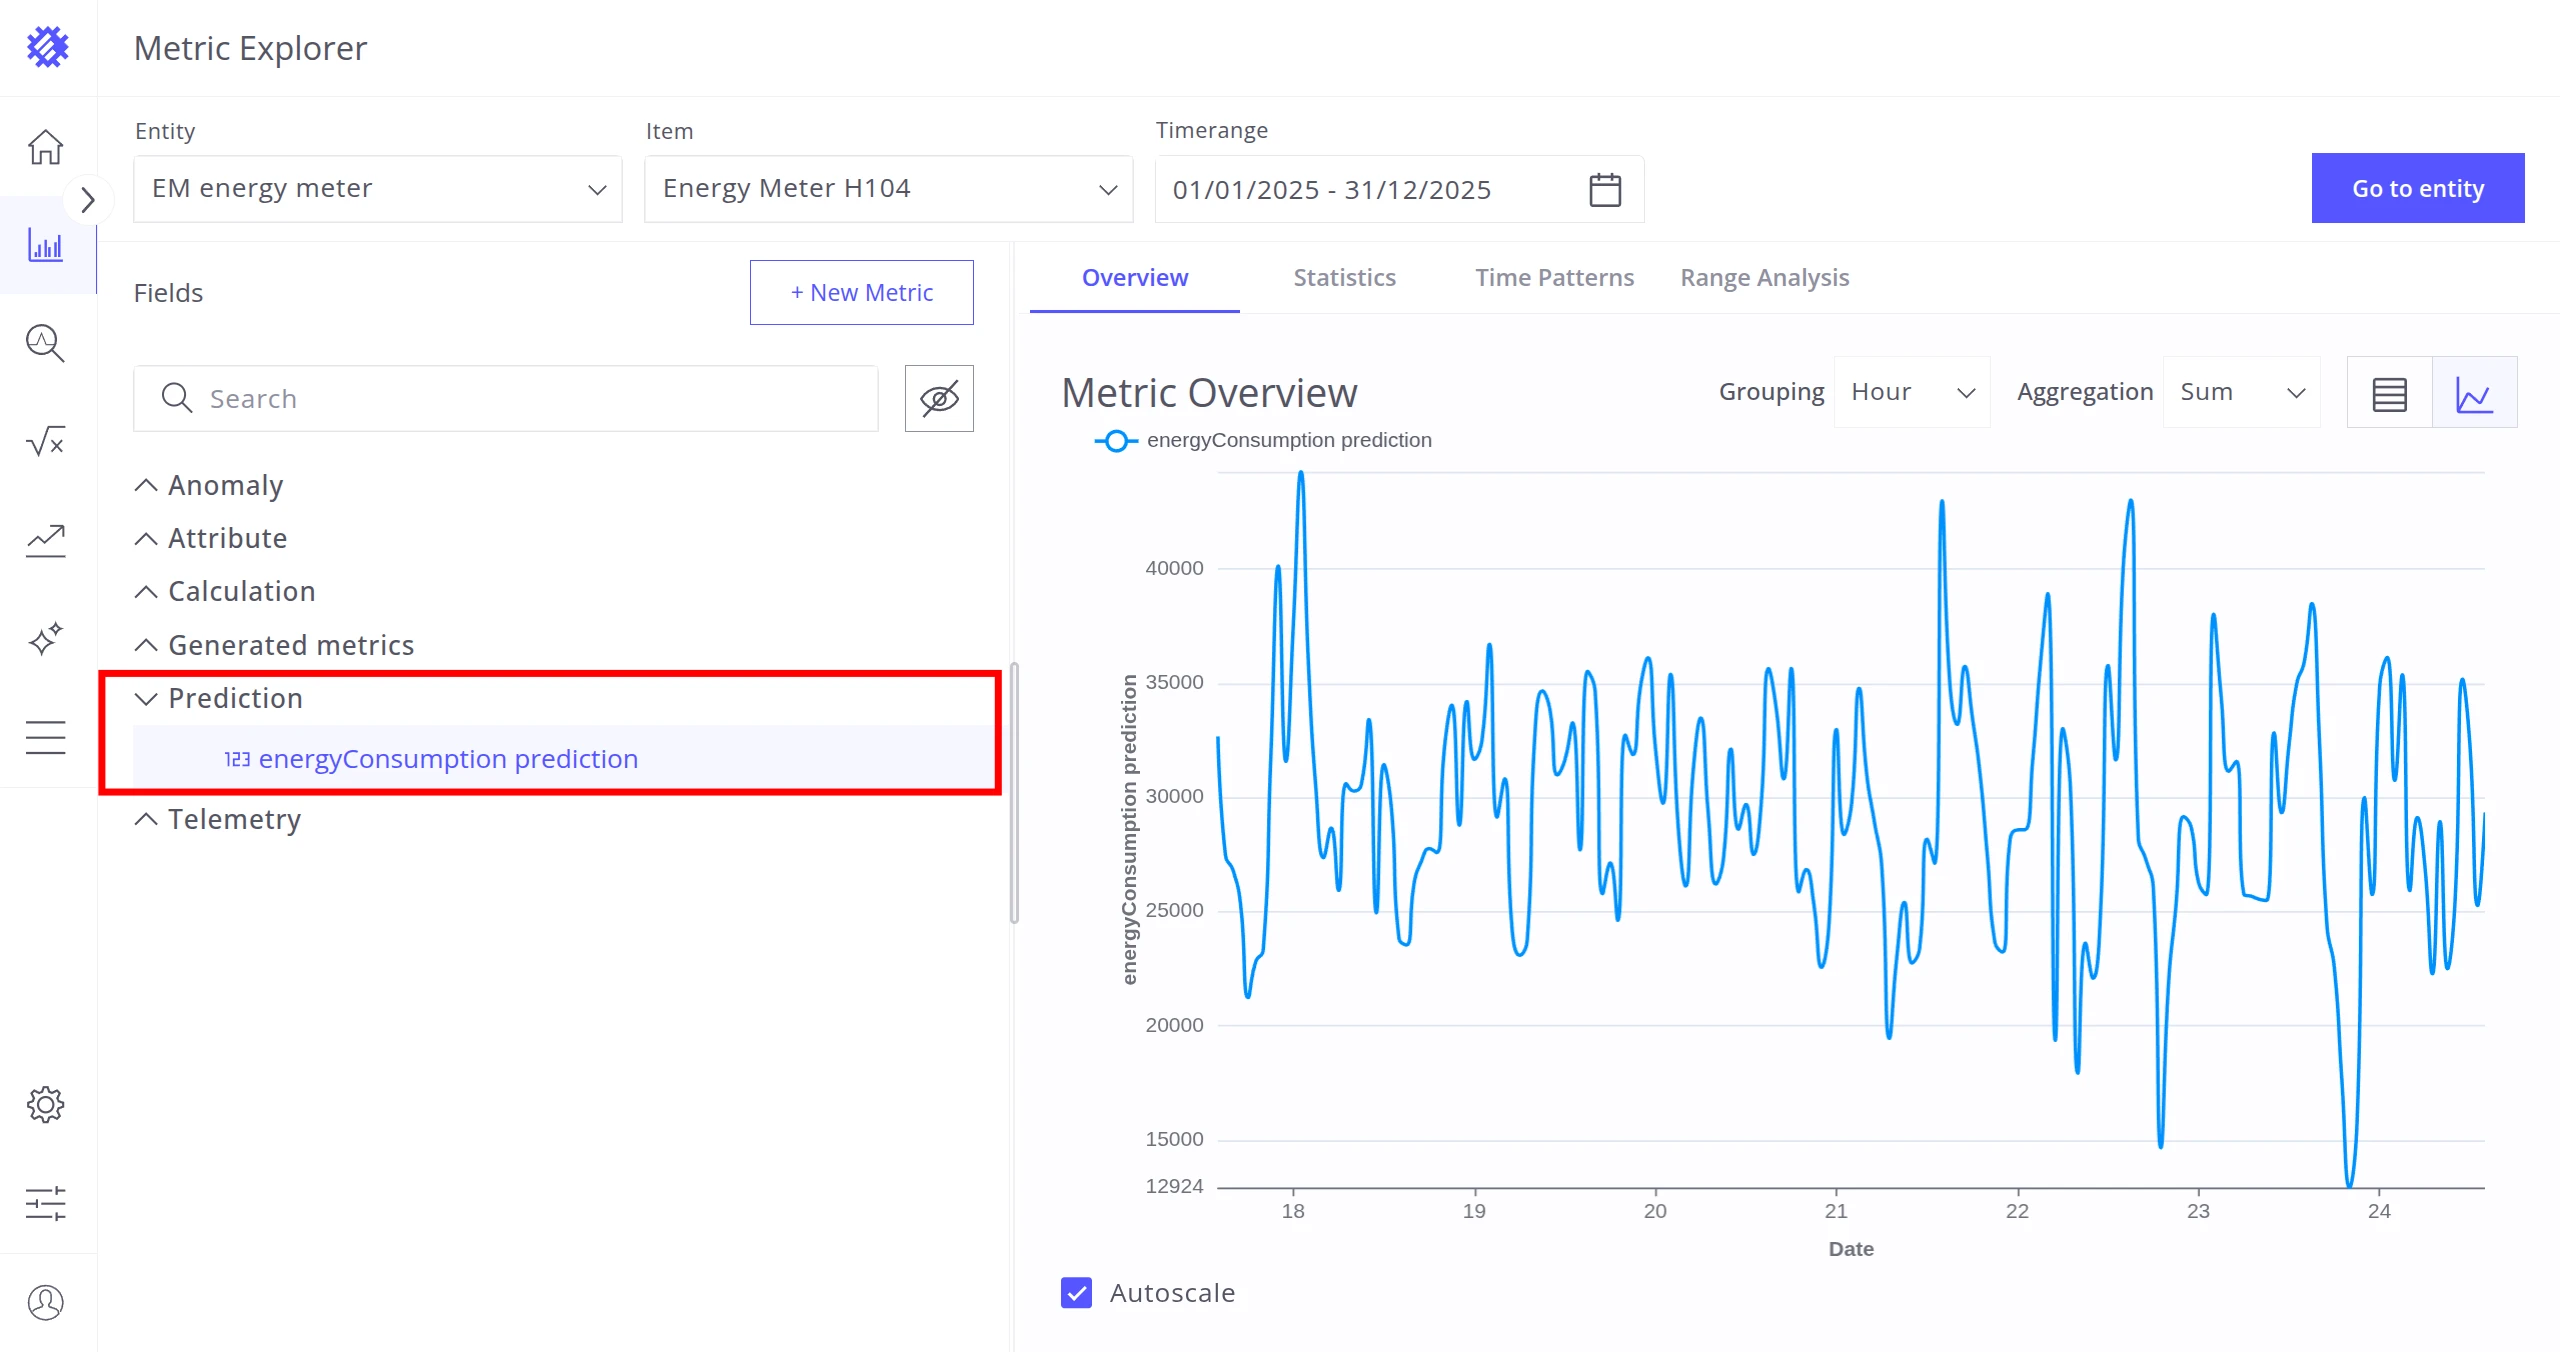
| Prediction | Predictions generated by Trendz Prediction Models and saved to ThingsBoard. |
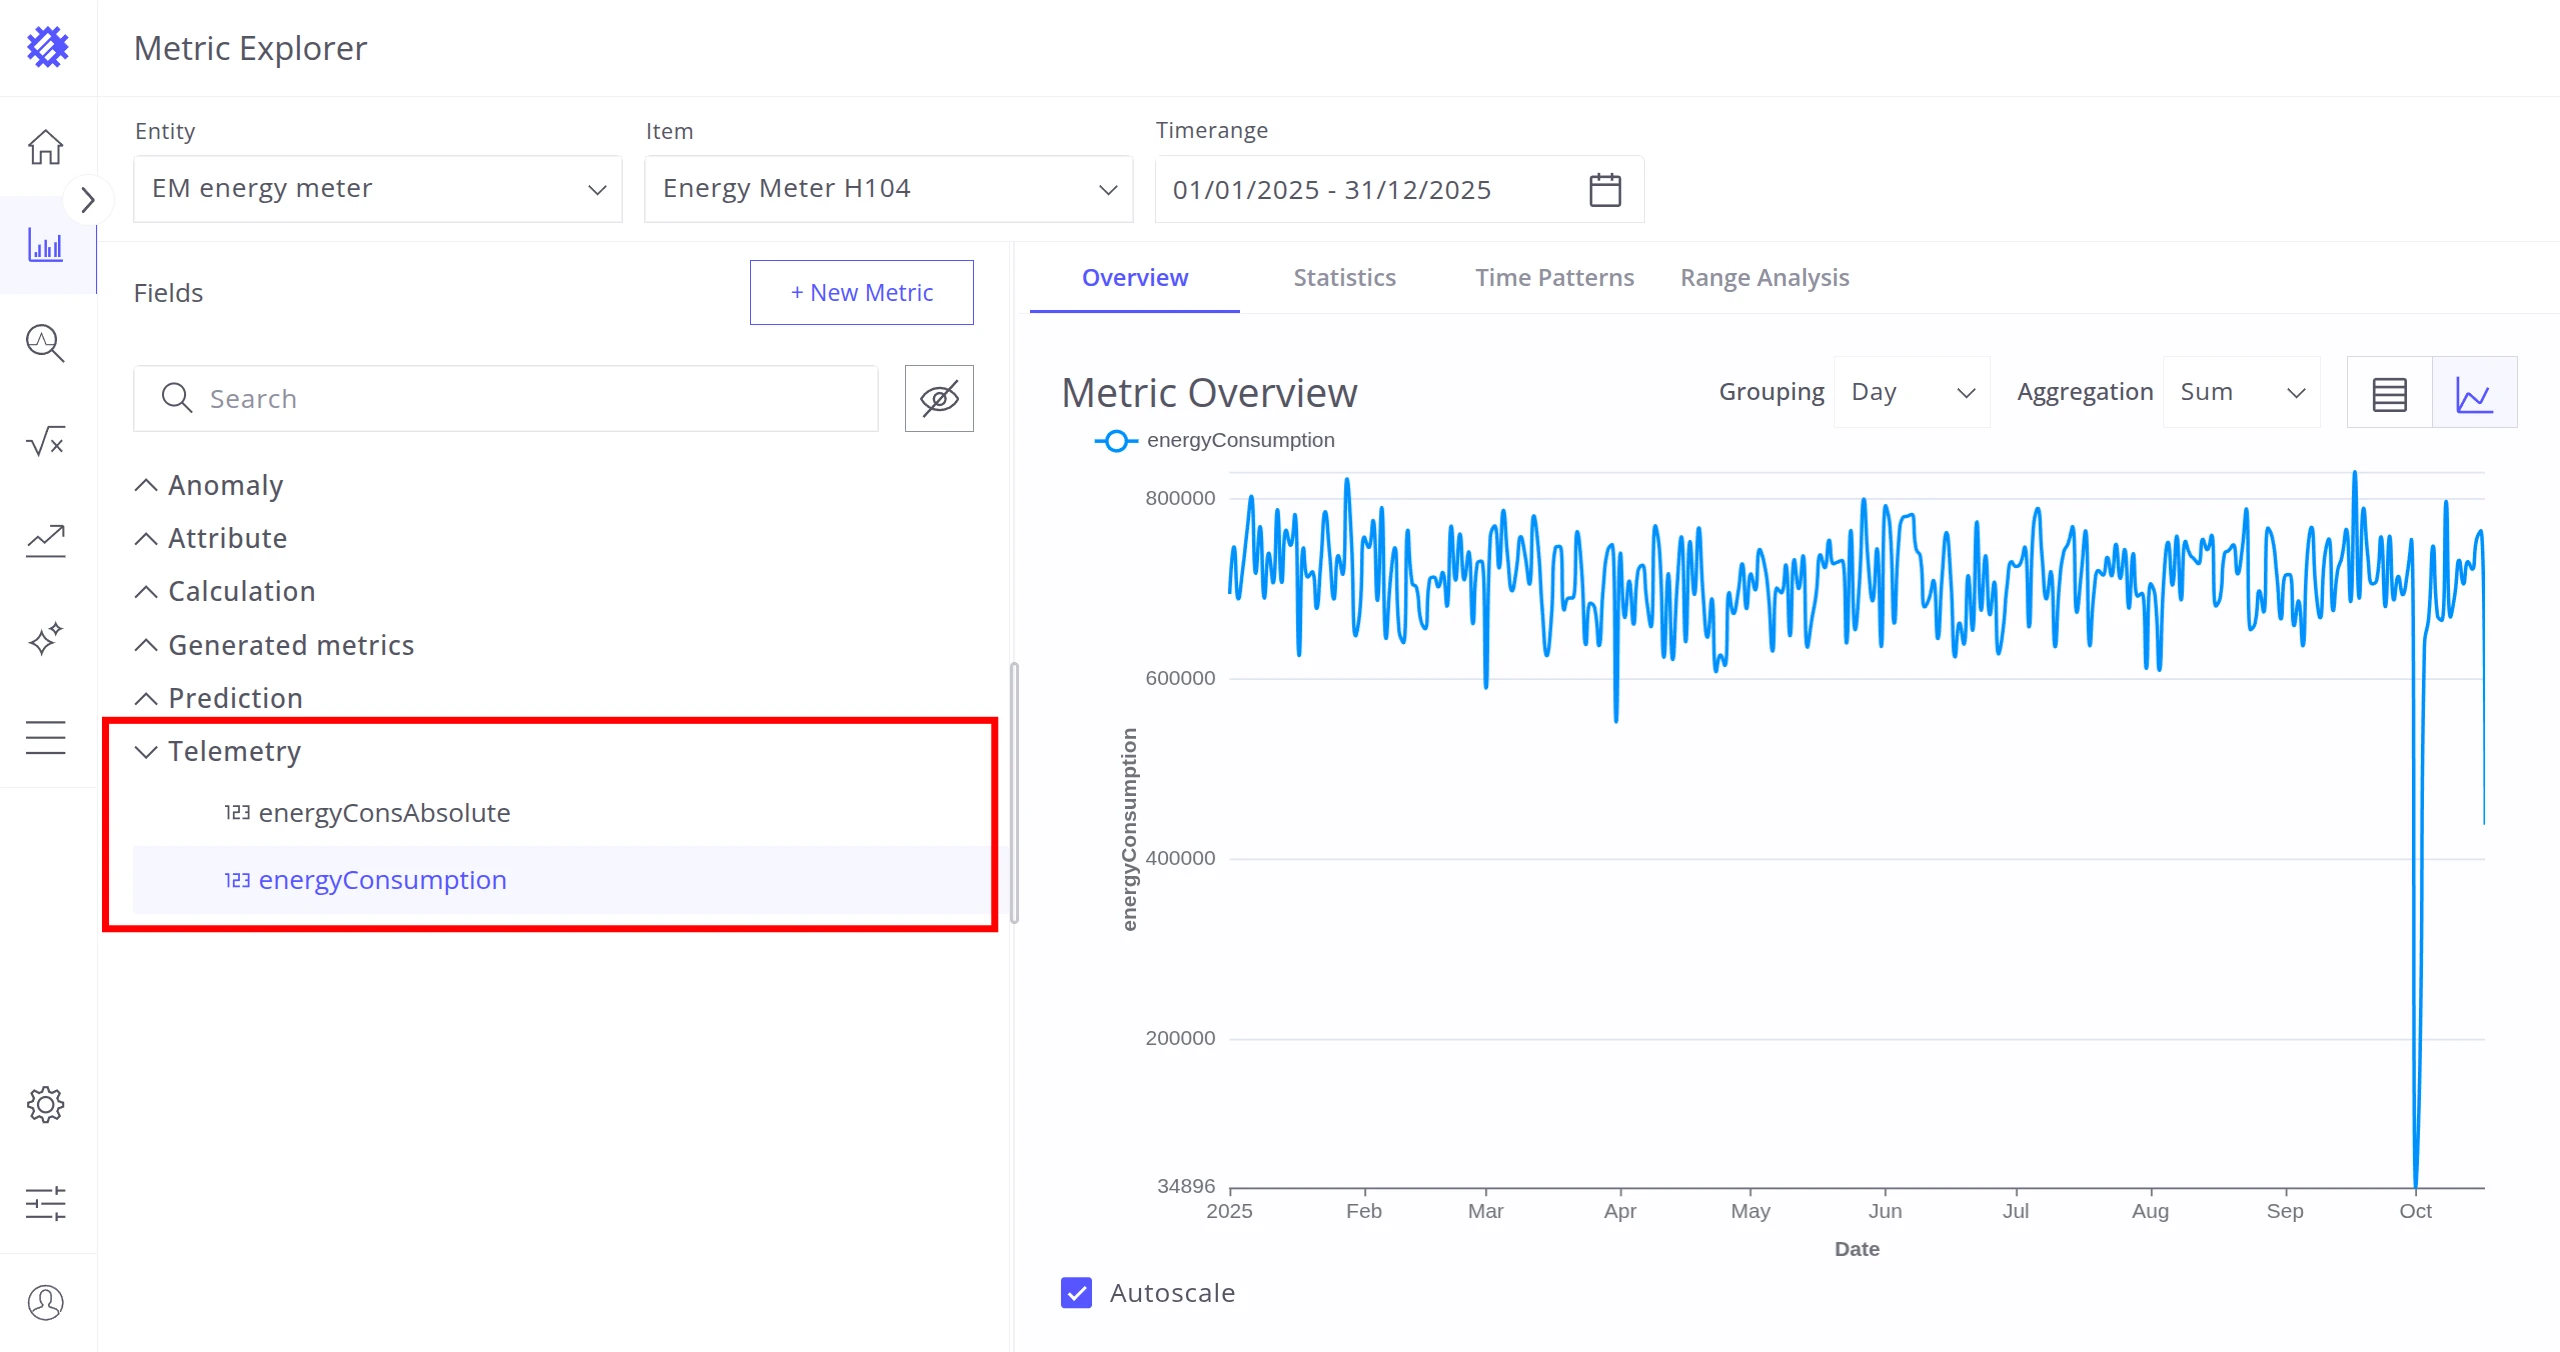
| Telemetry | Raw telemetries from ThingsBoard. |
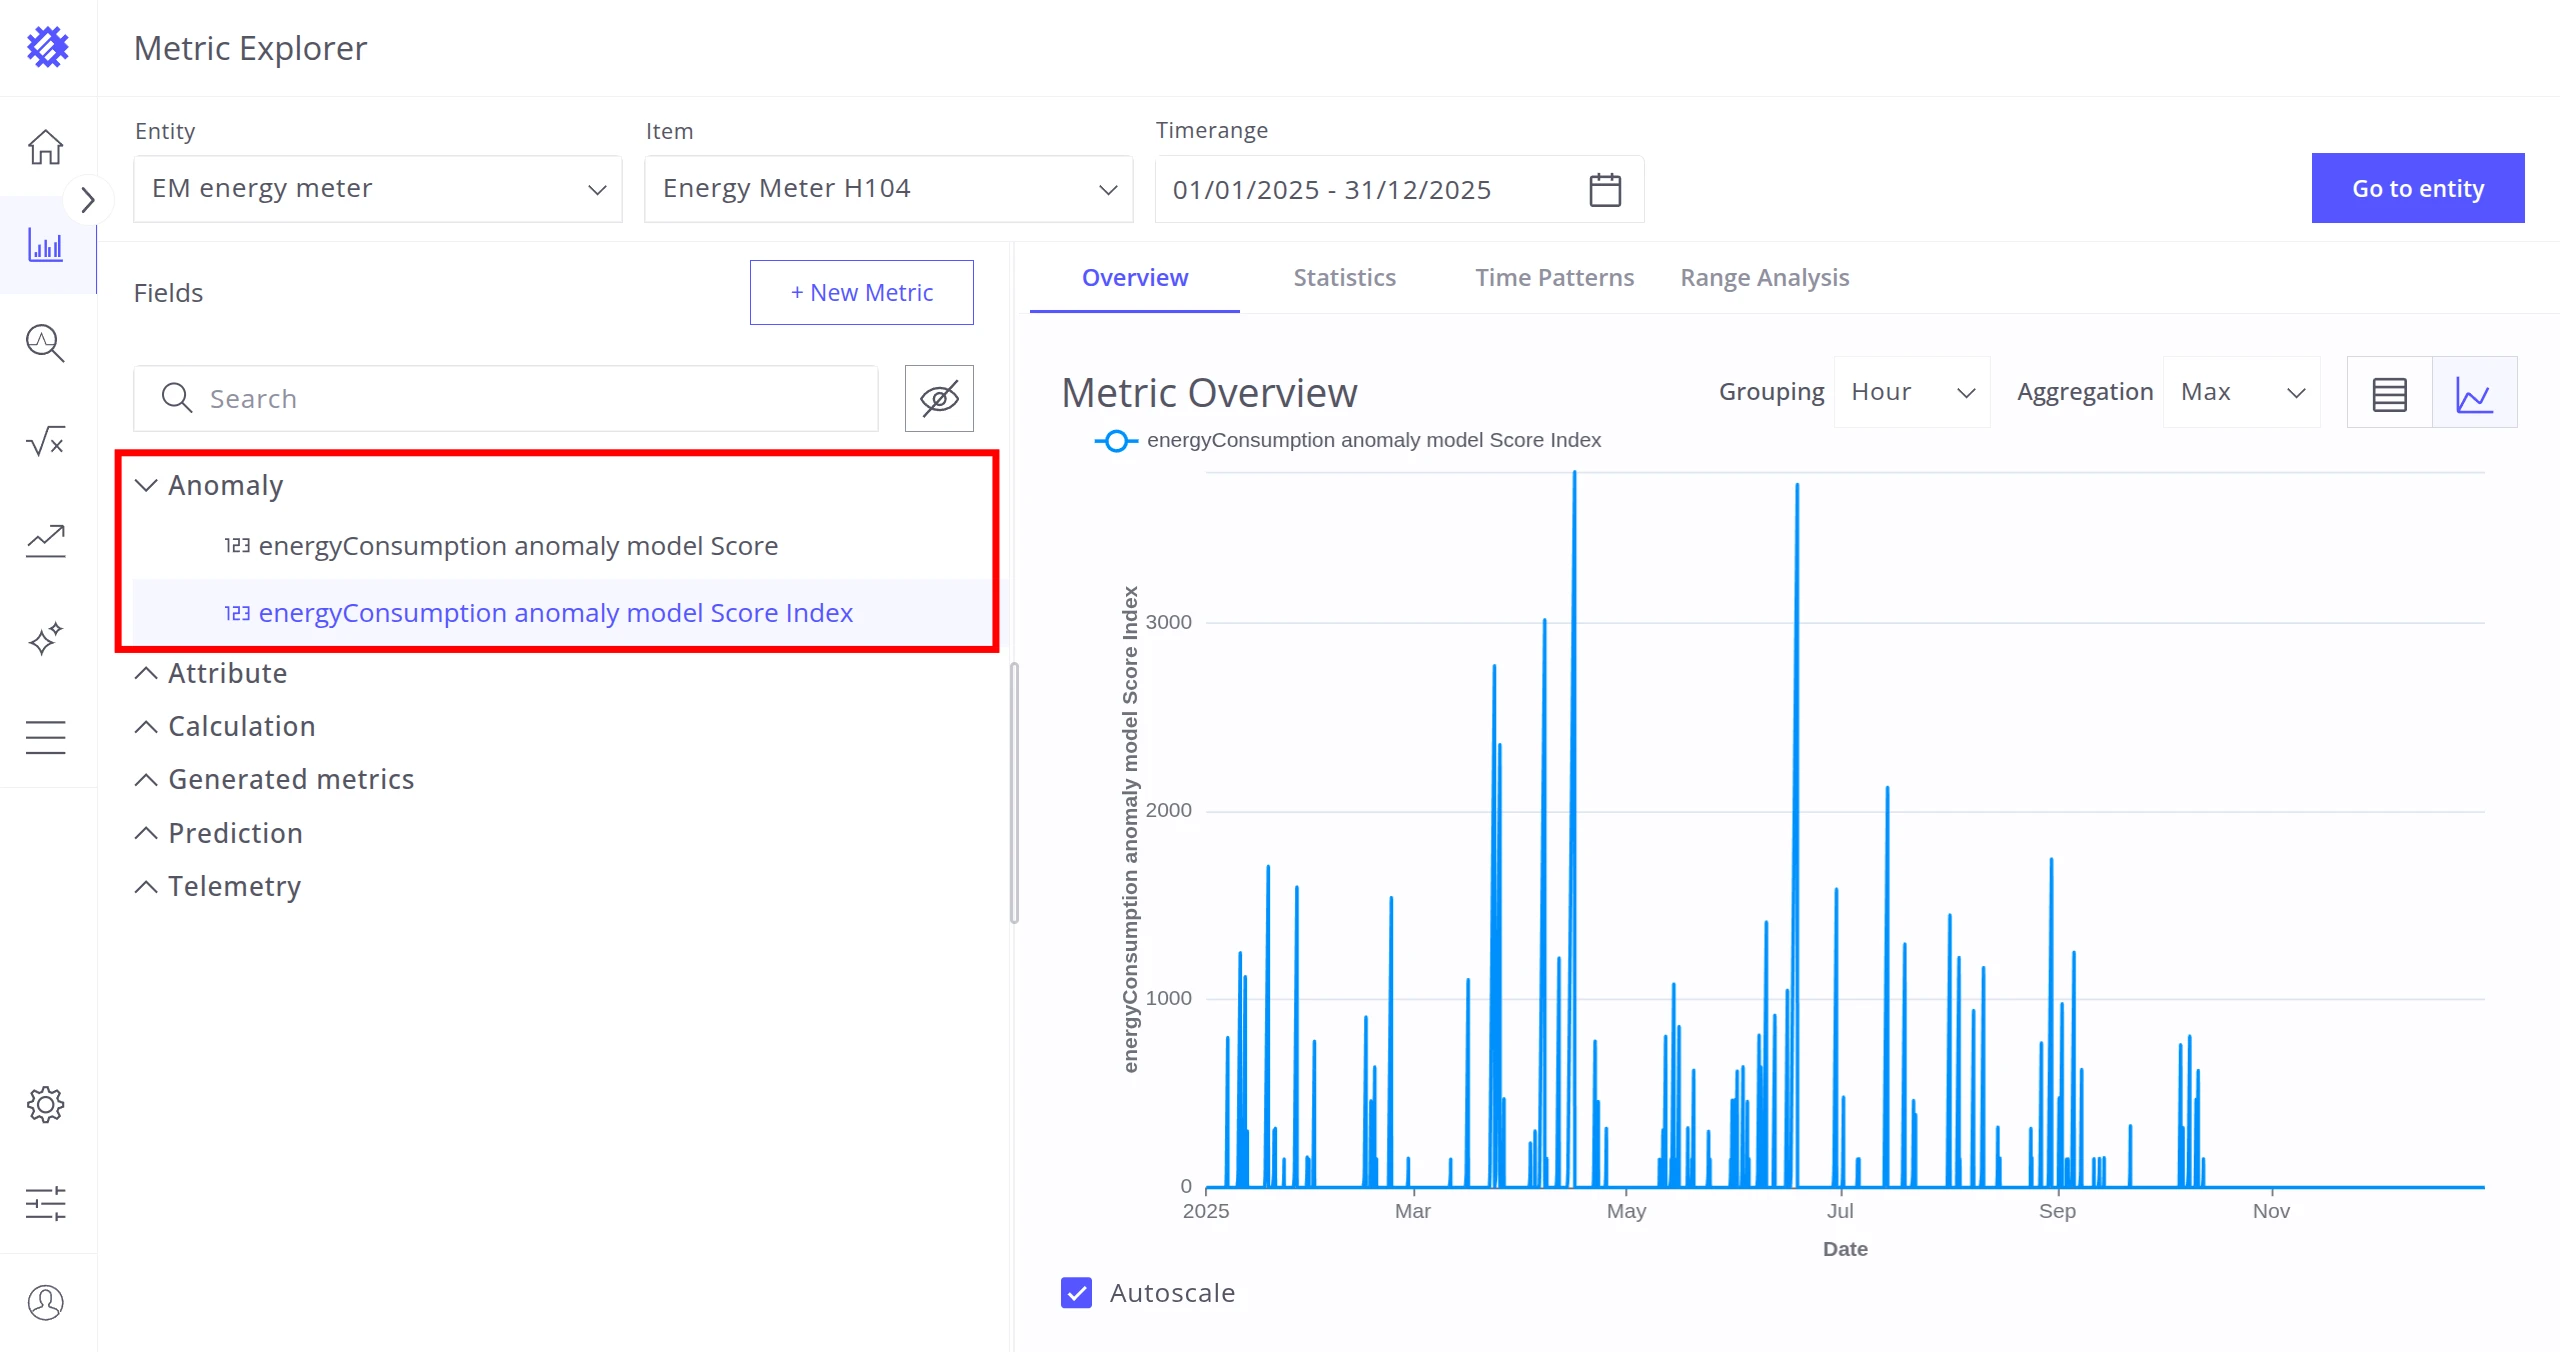
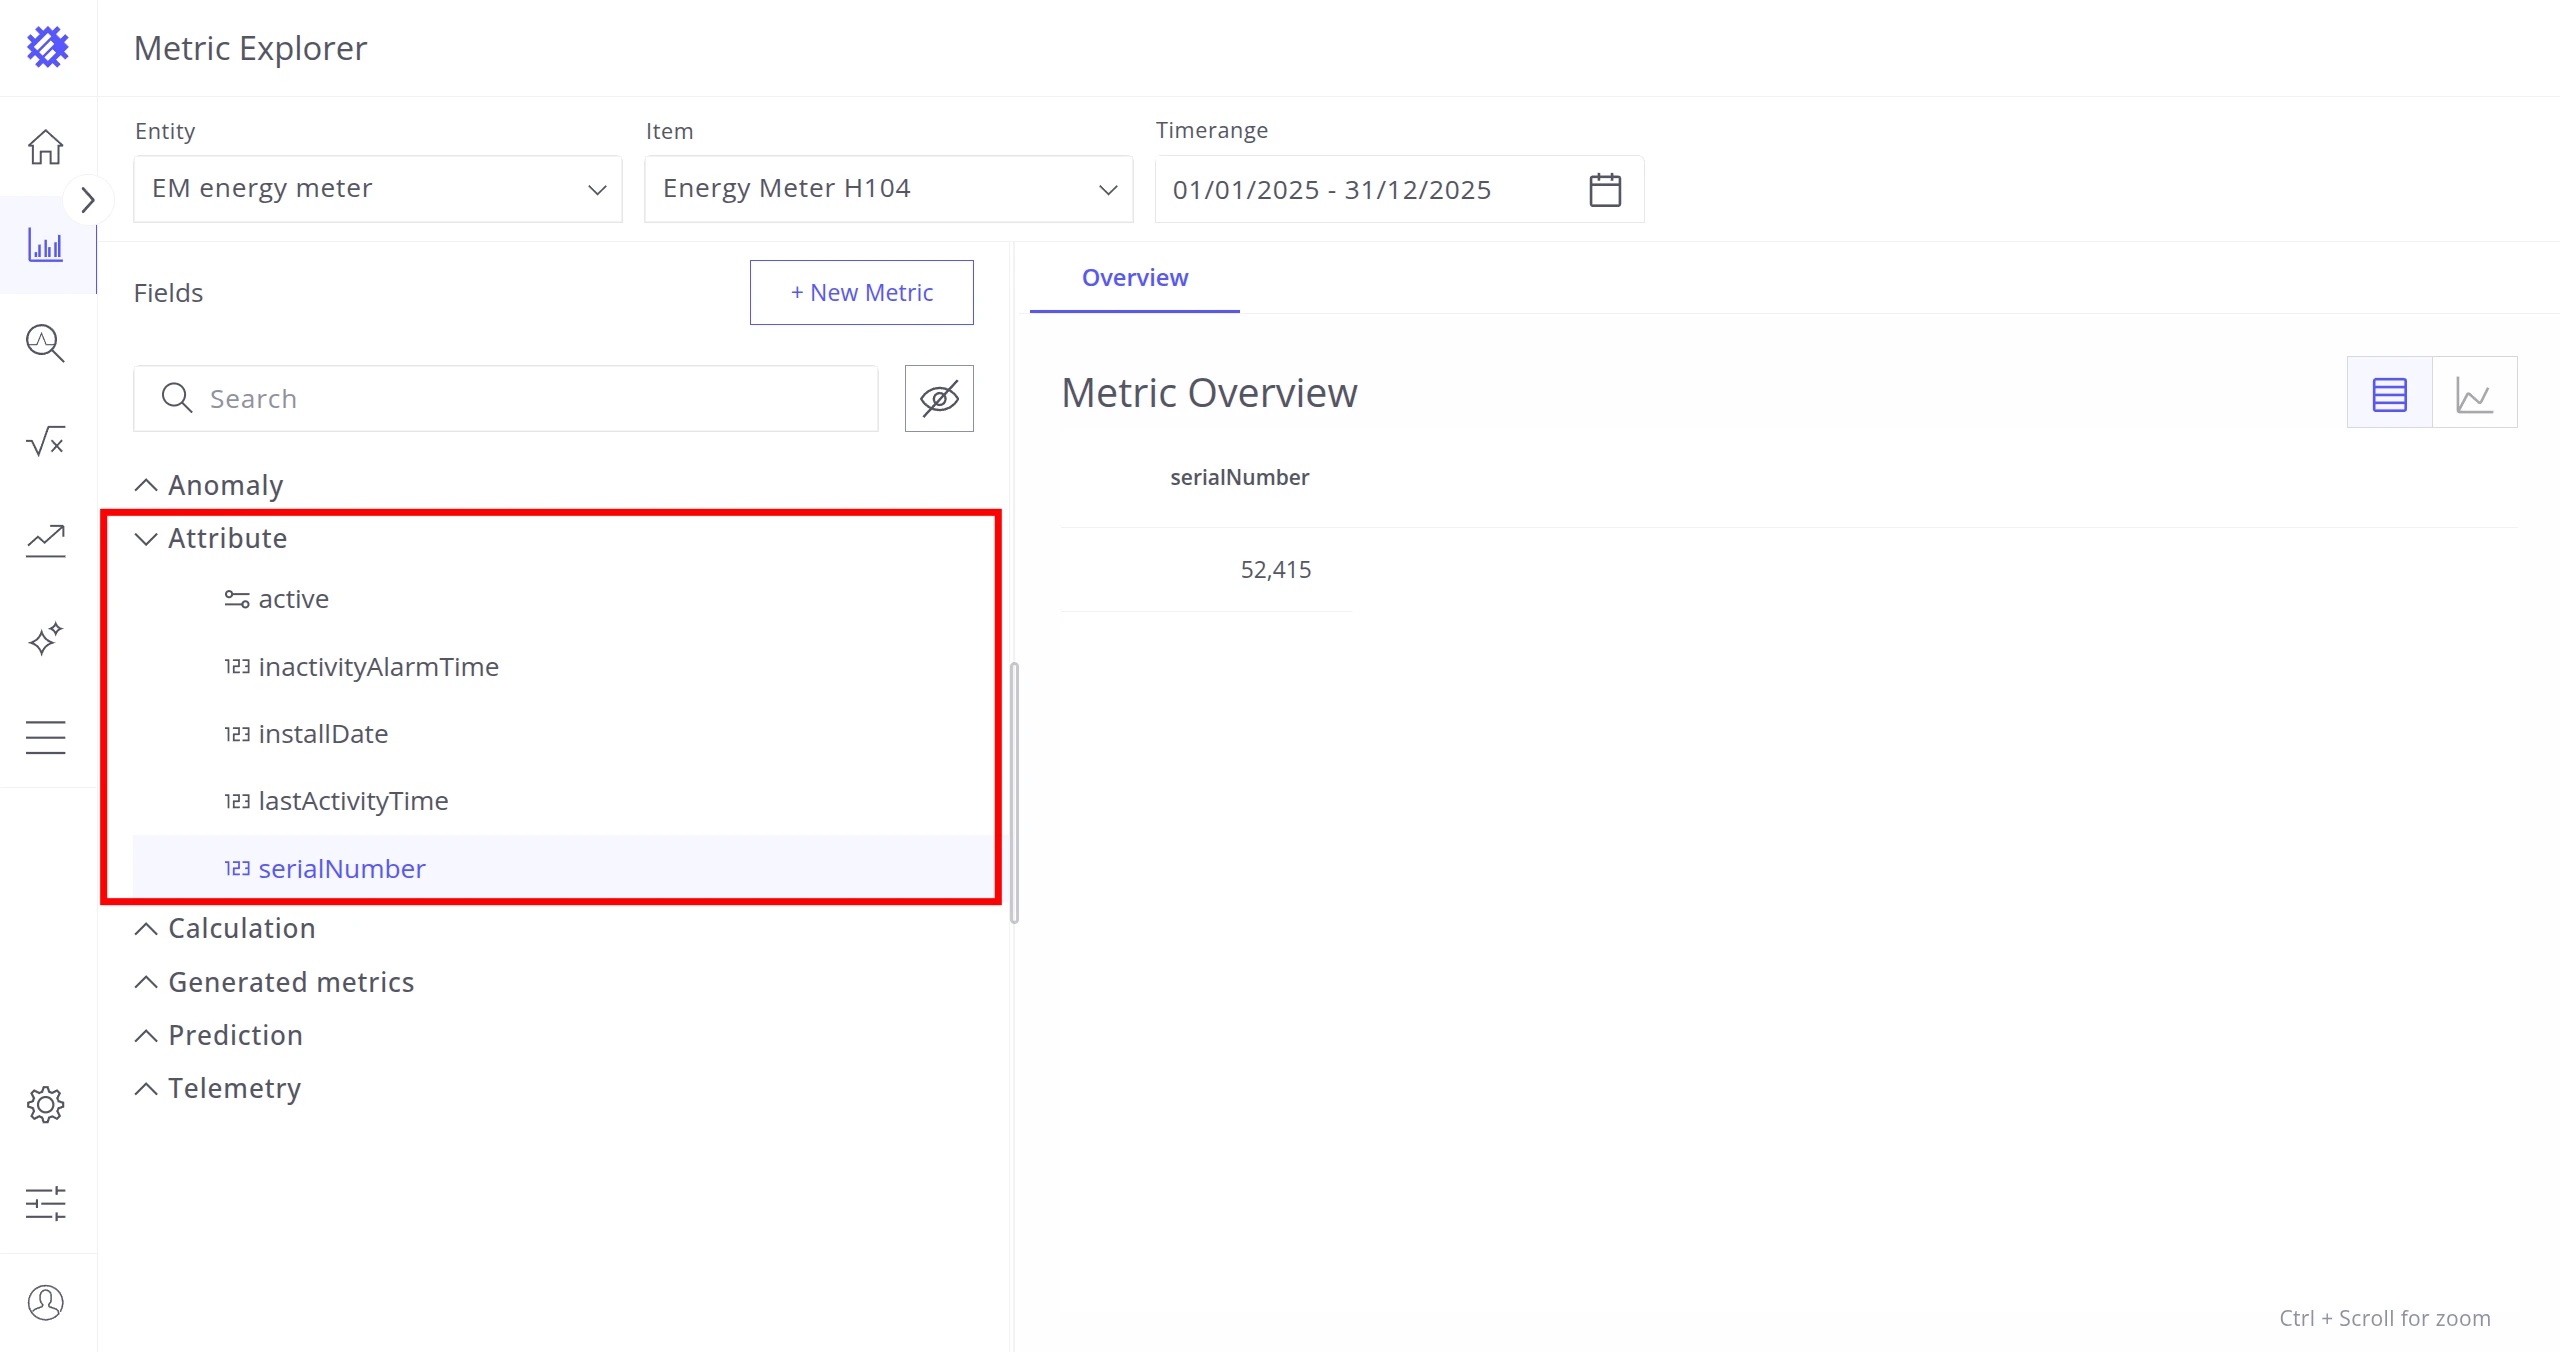
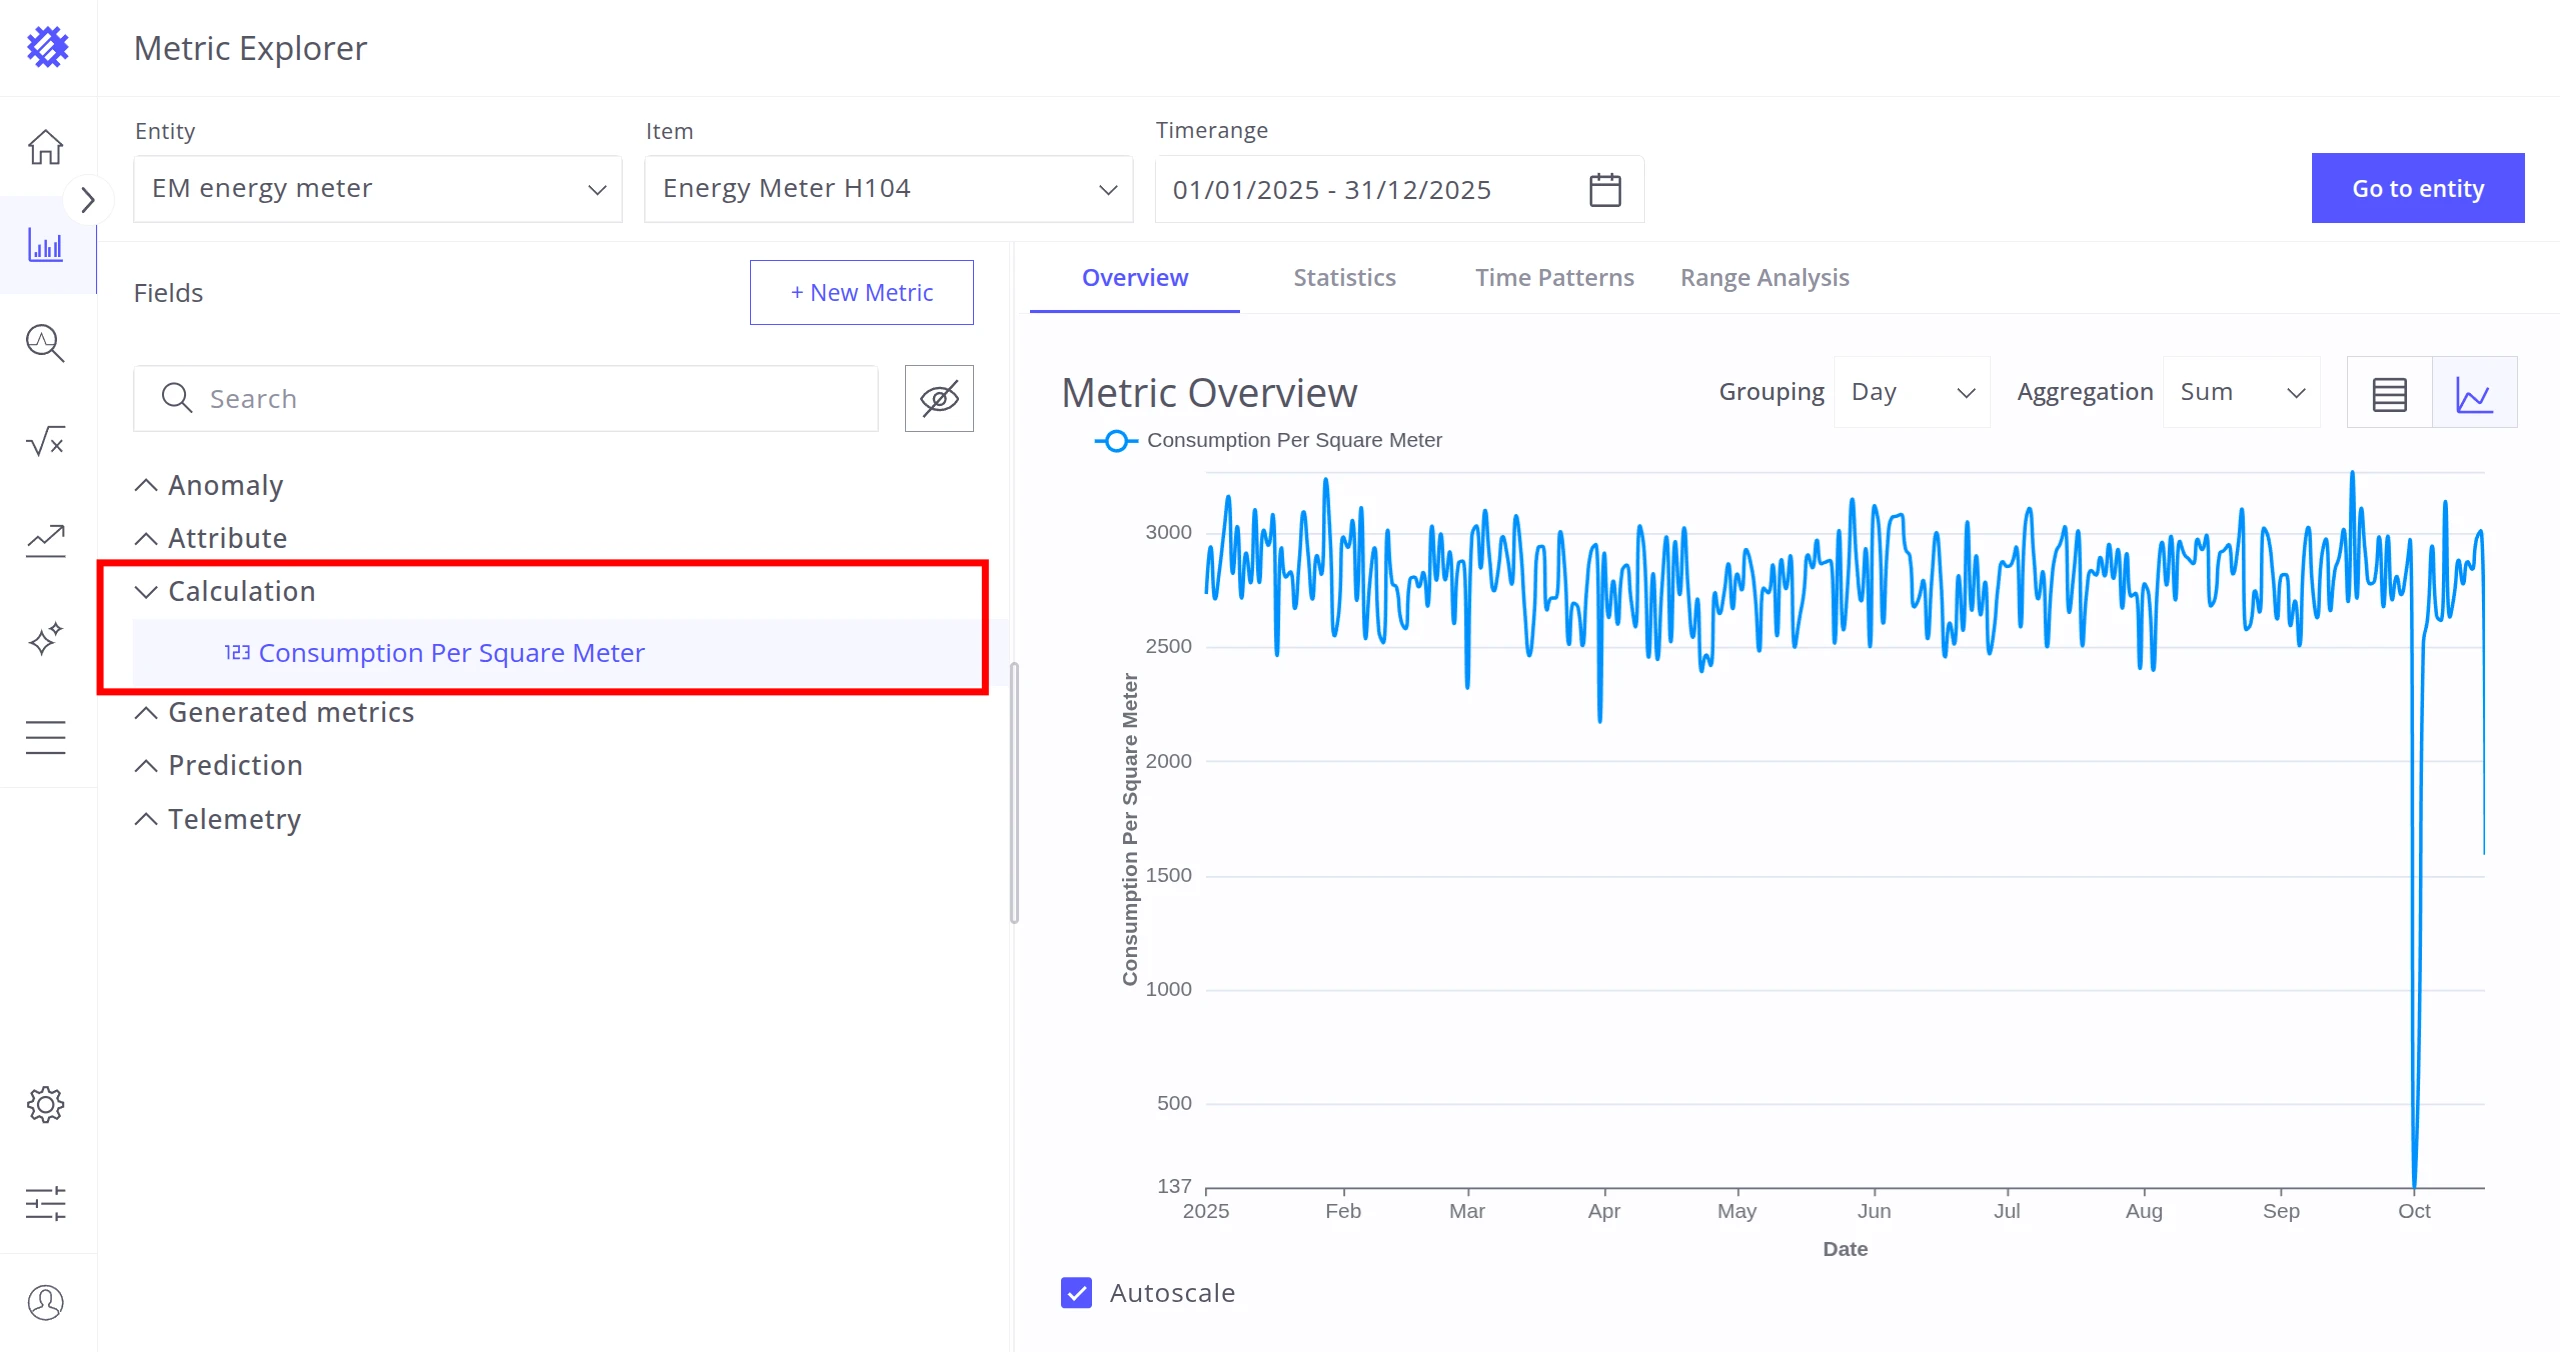
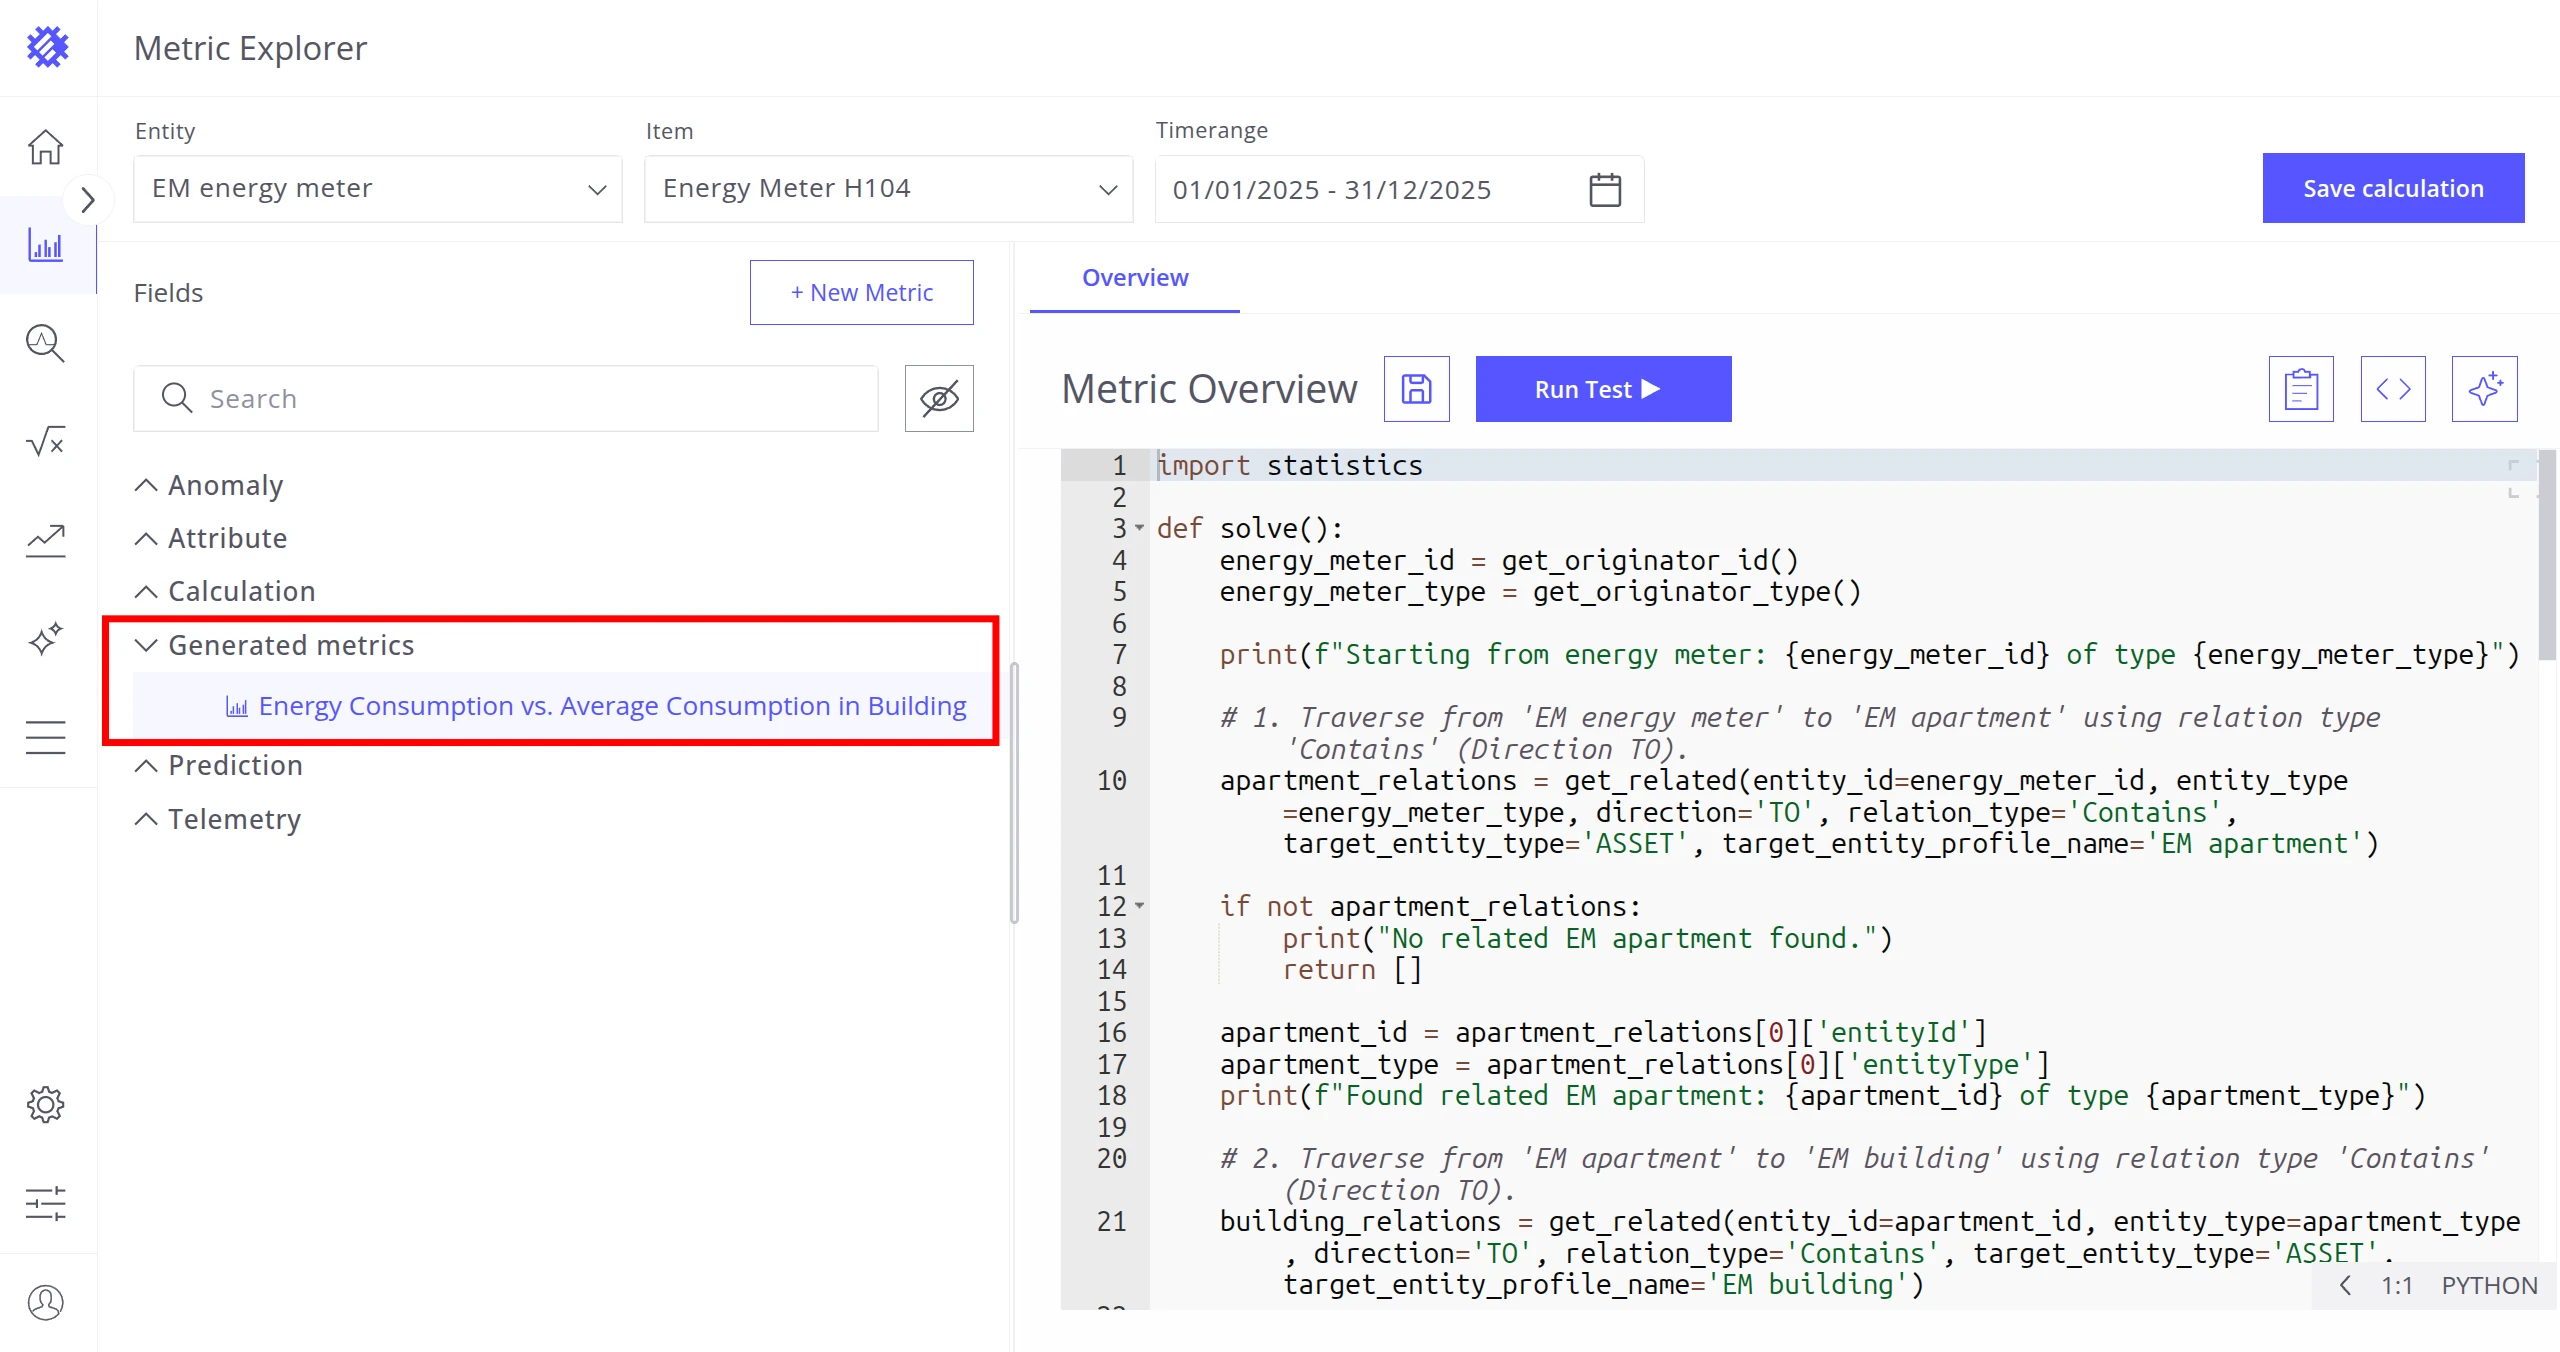
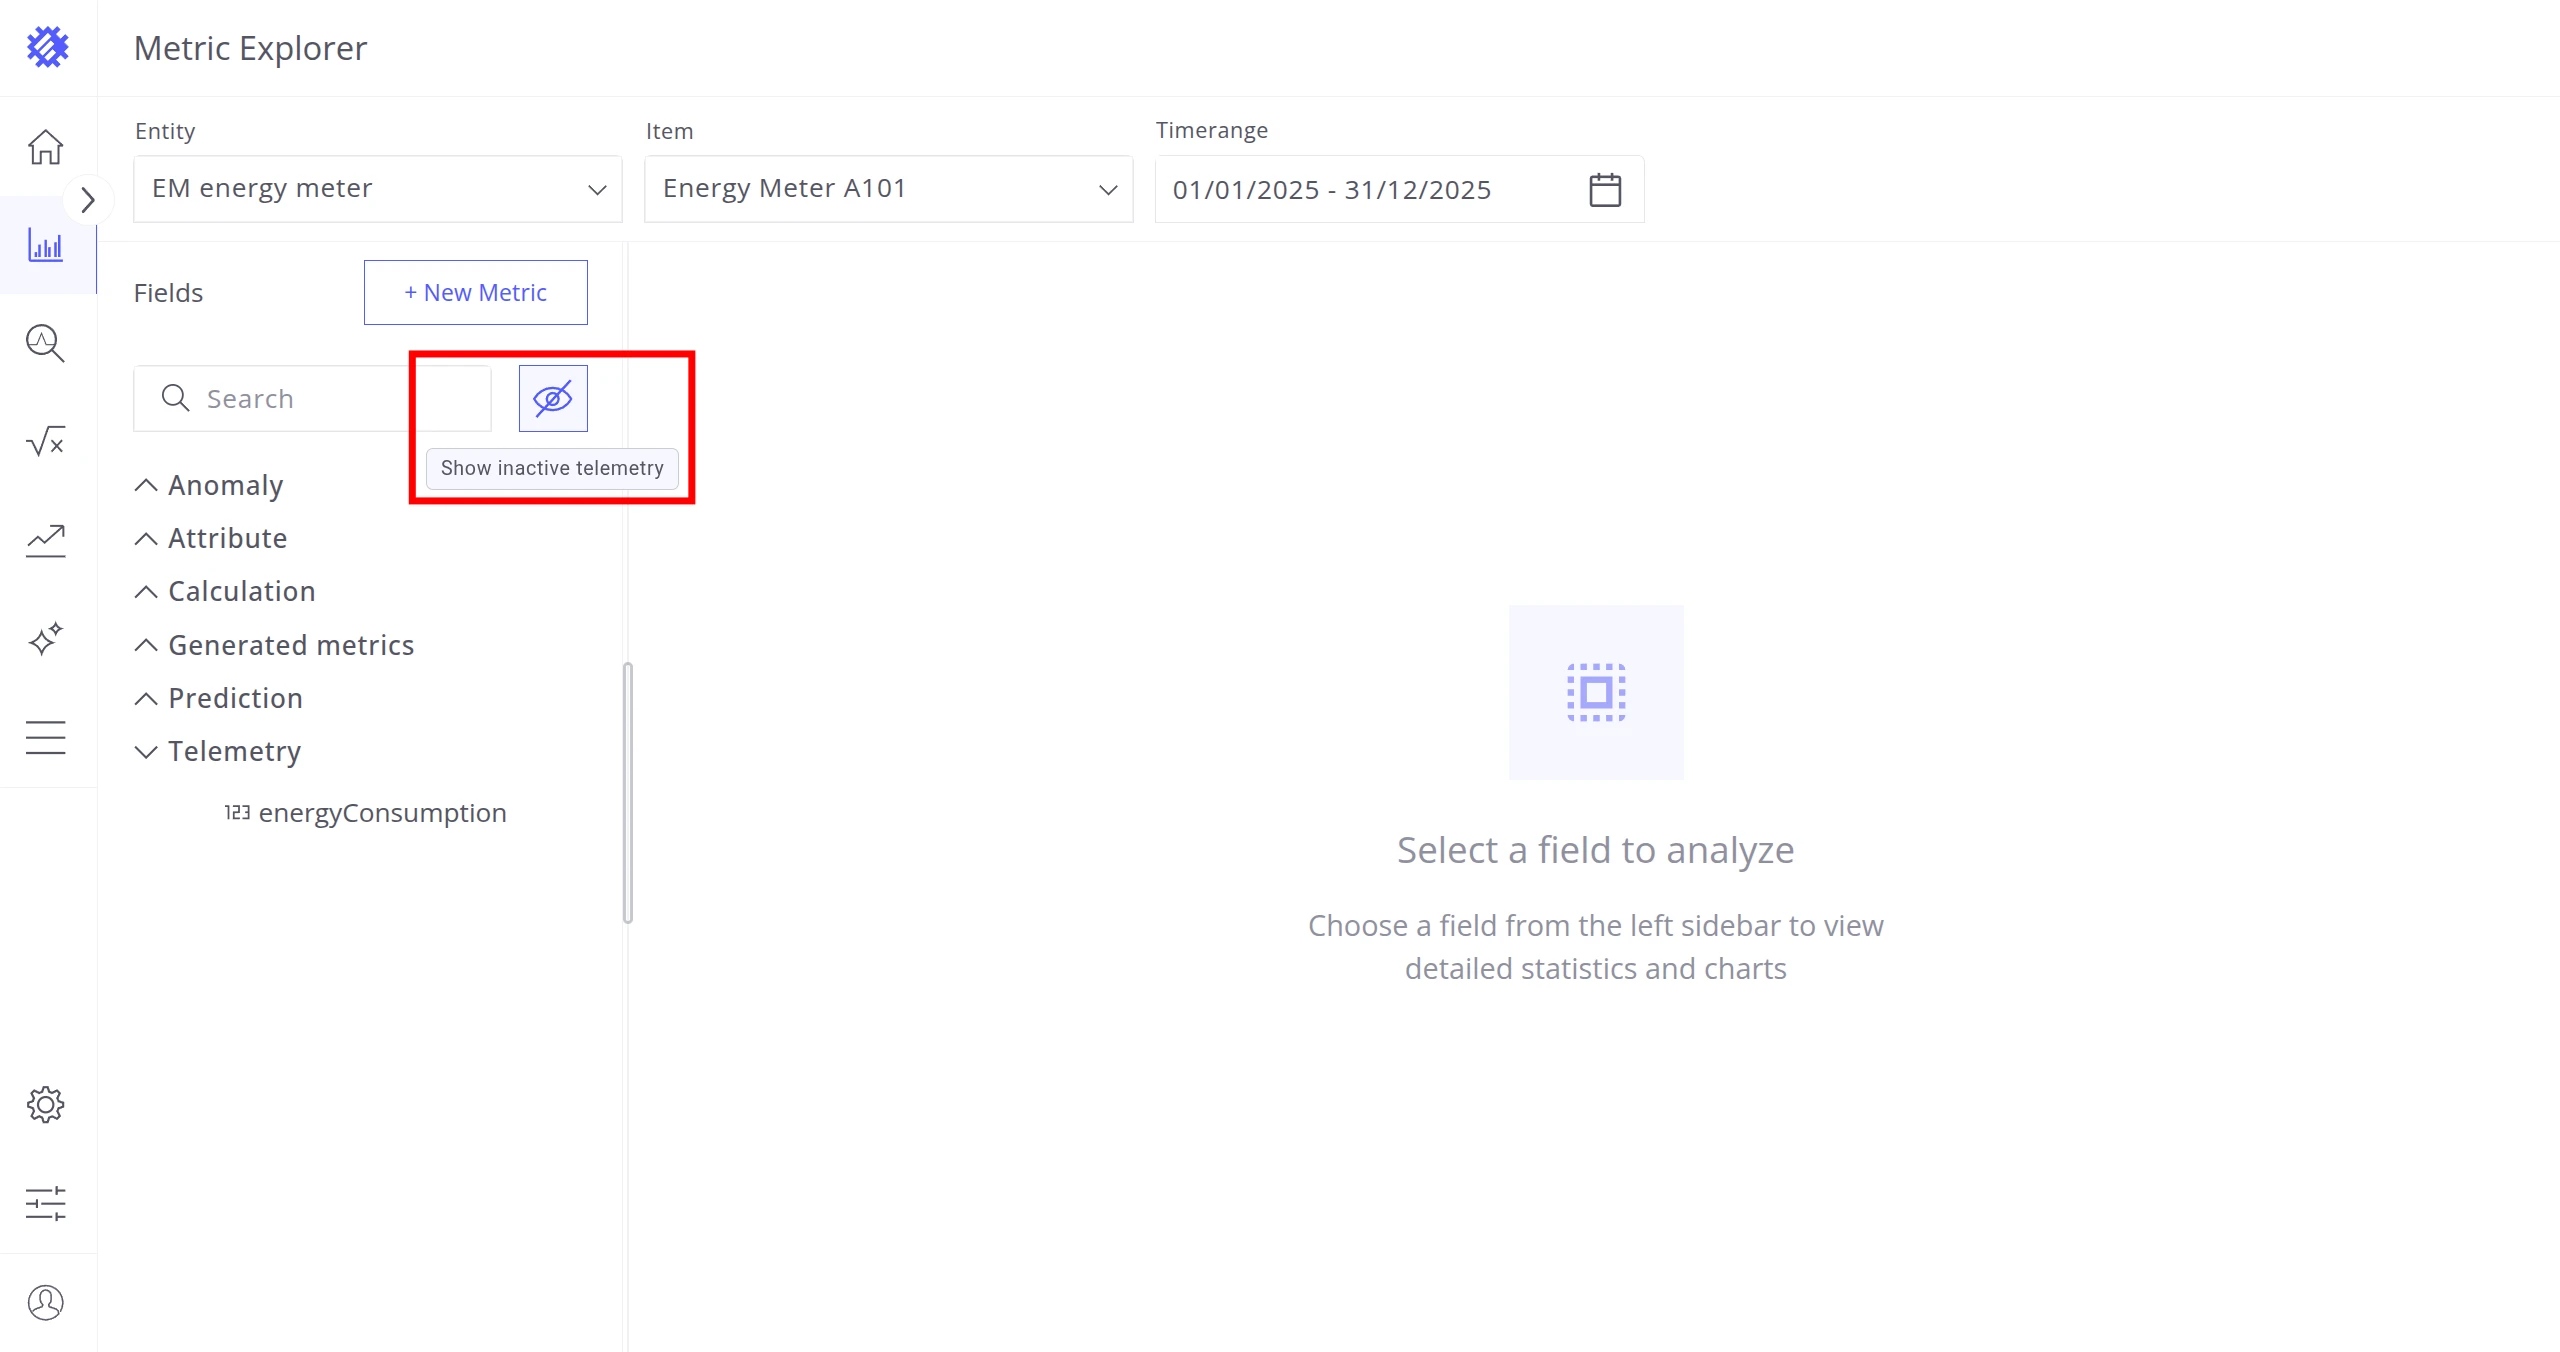
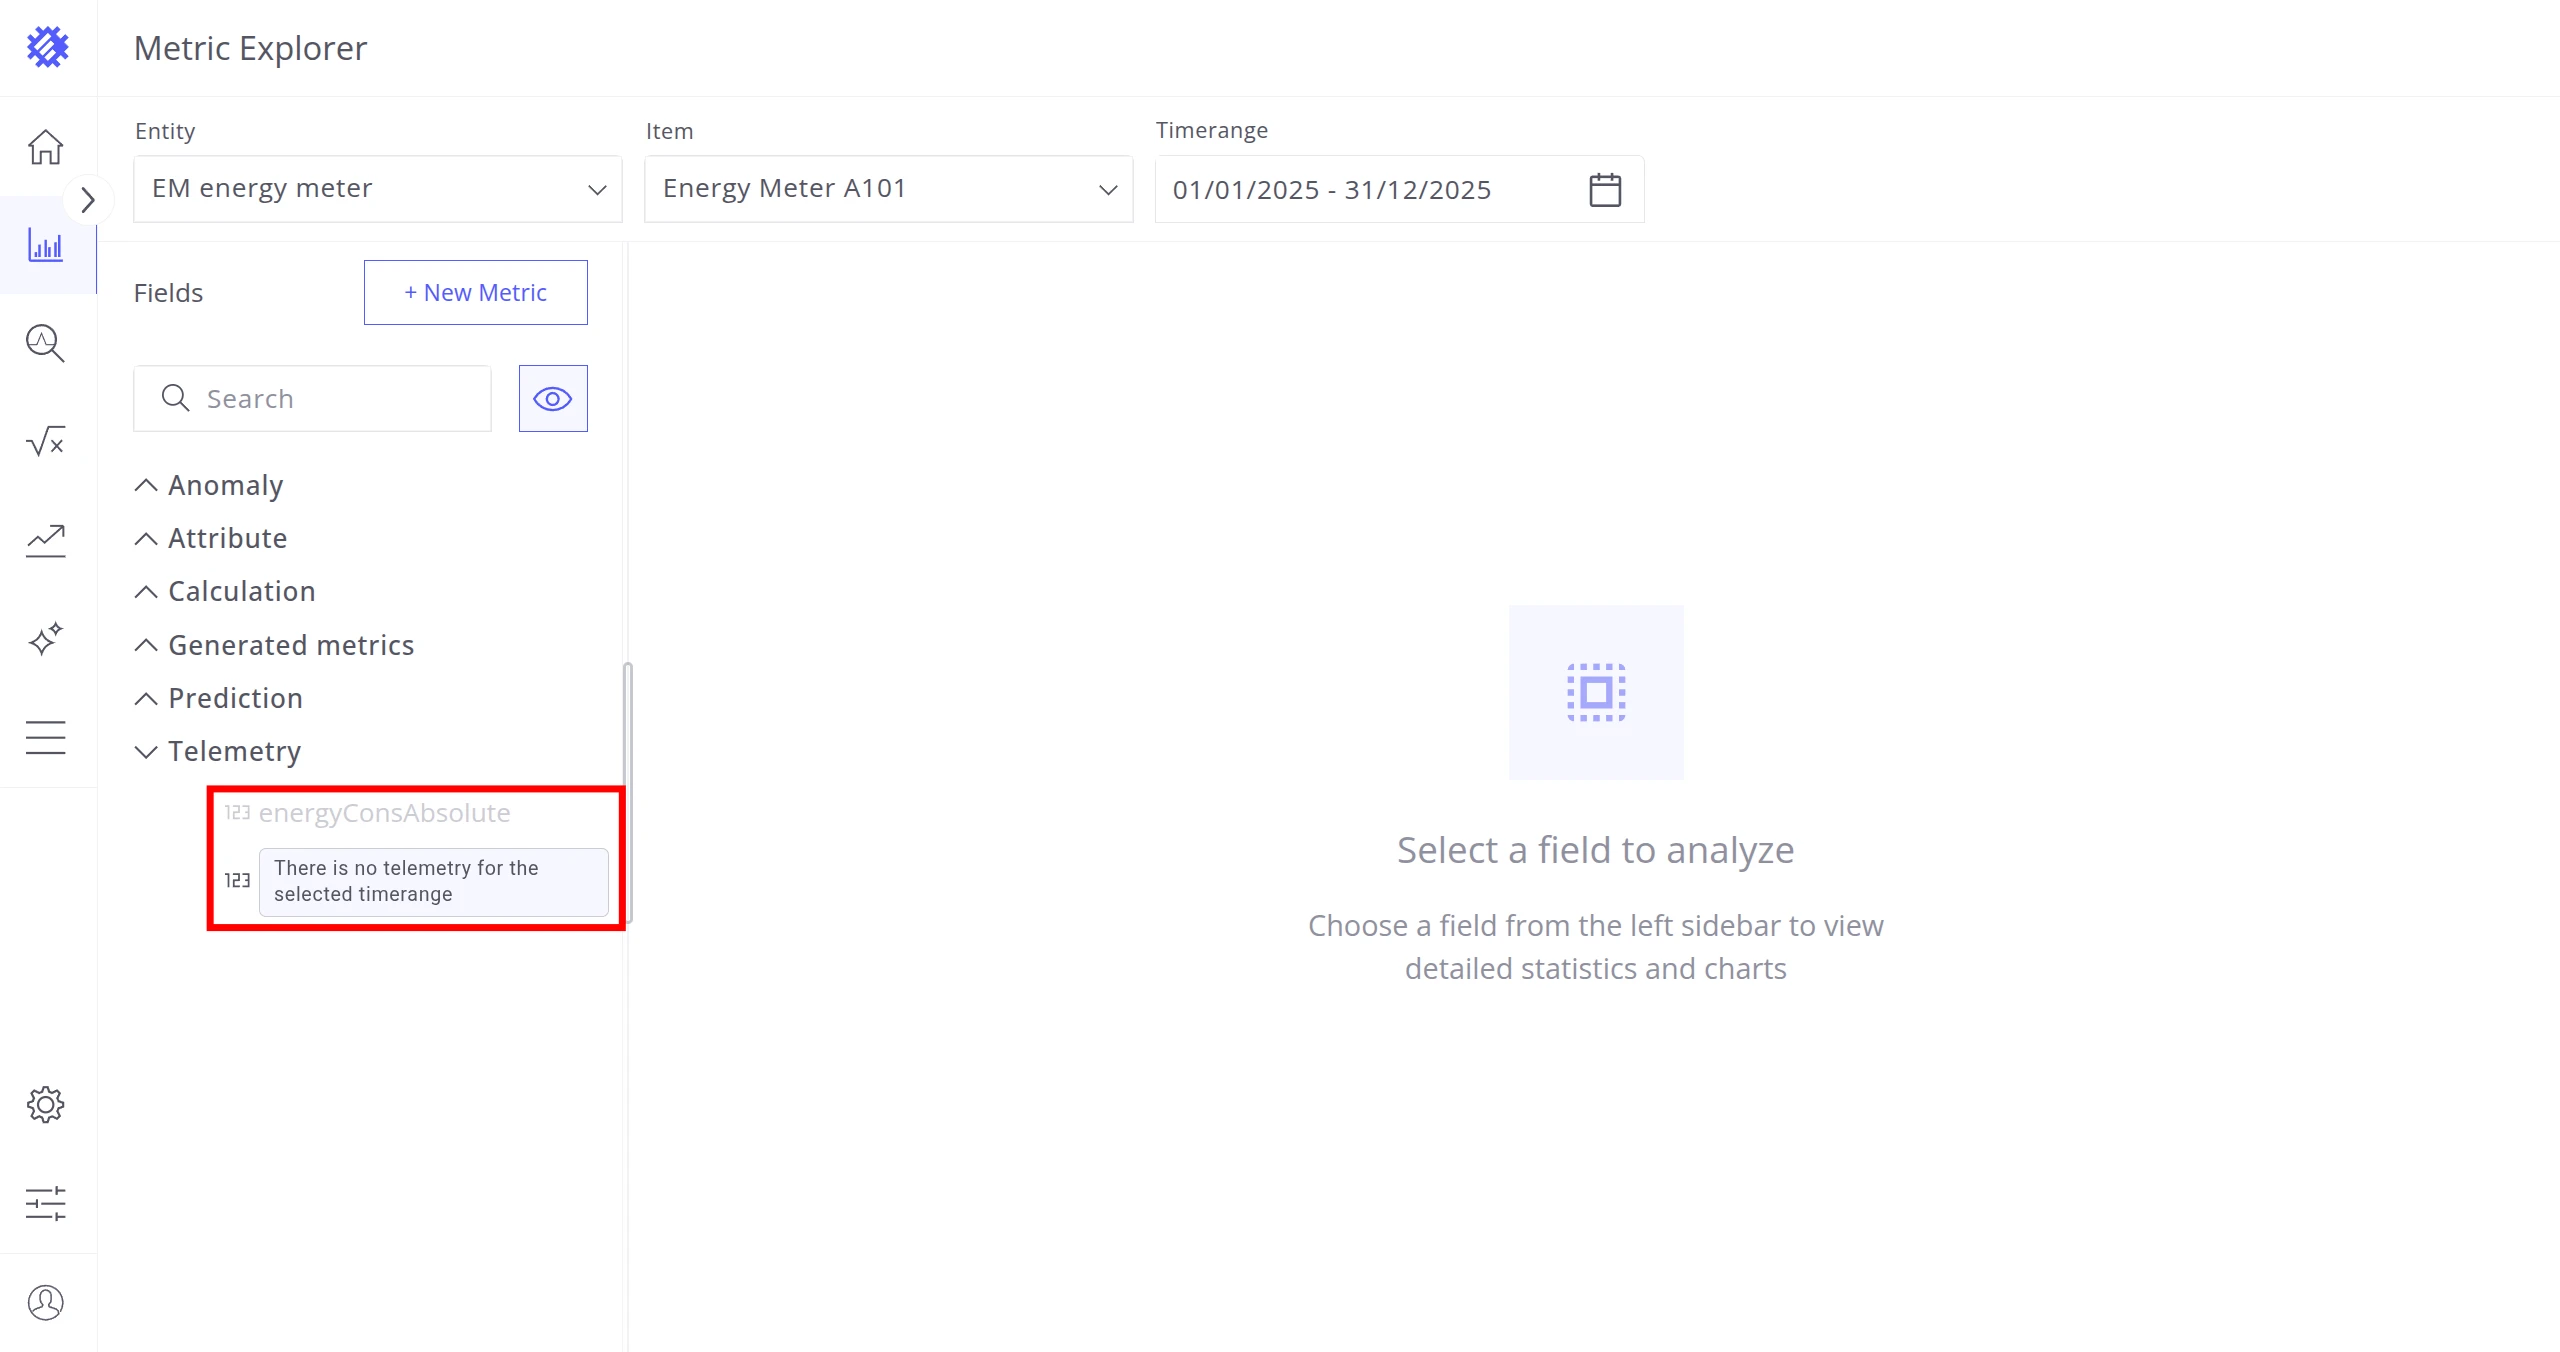
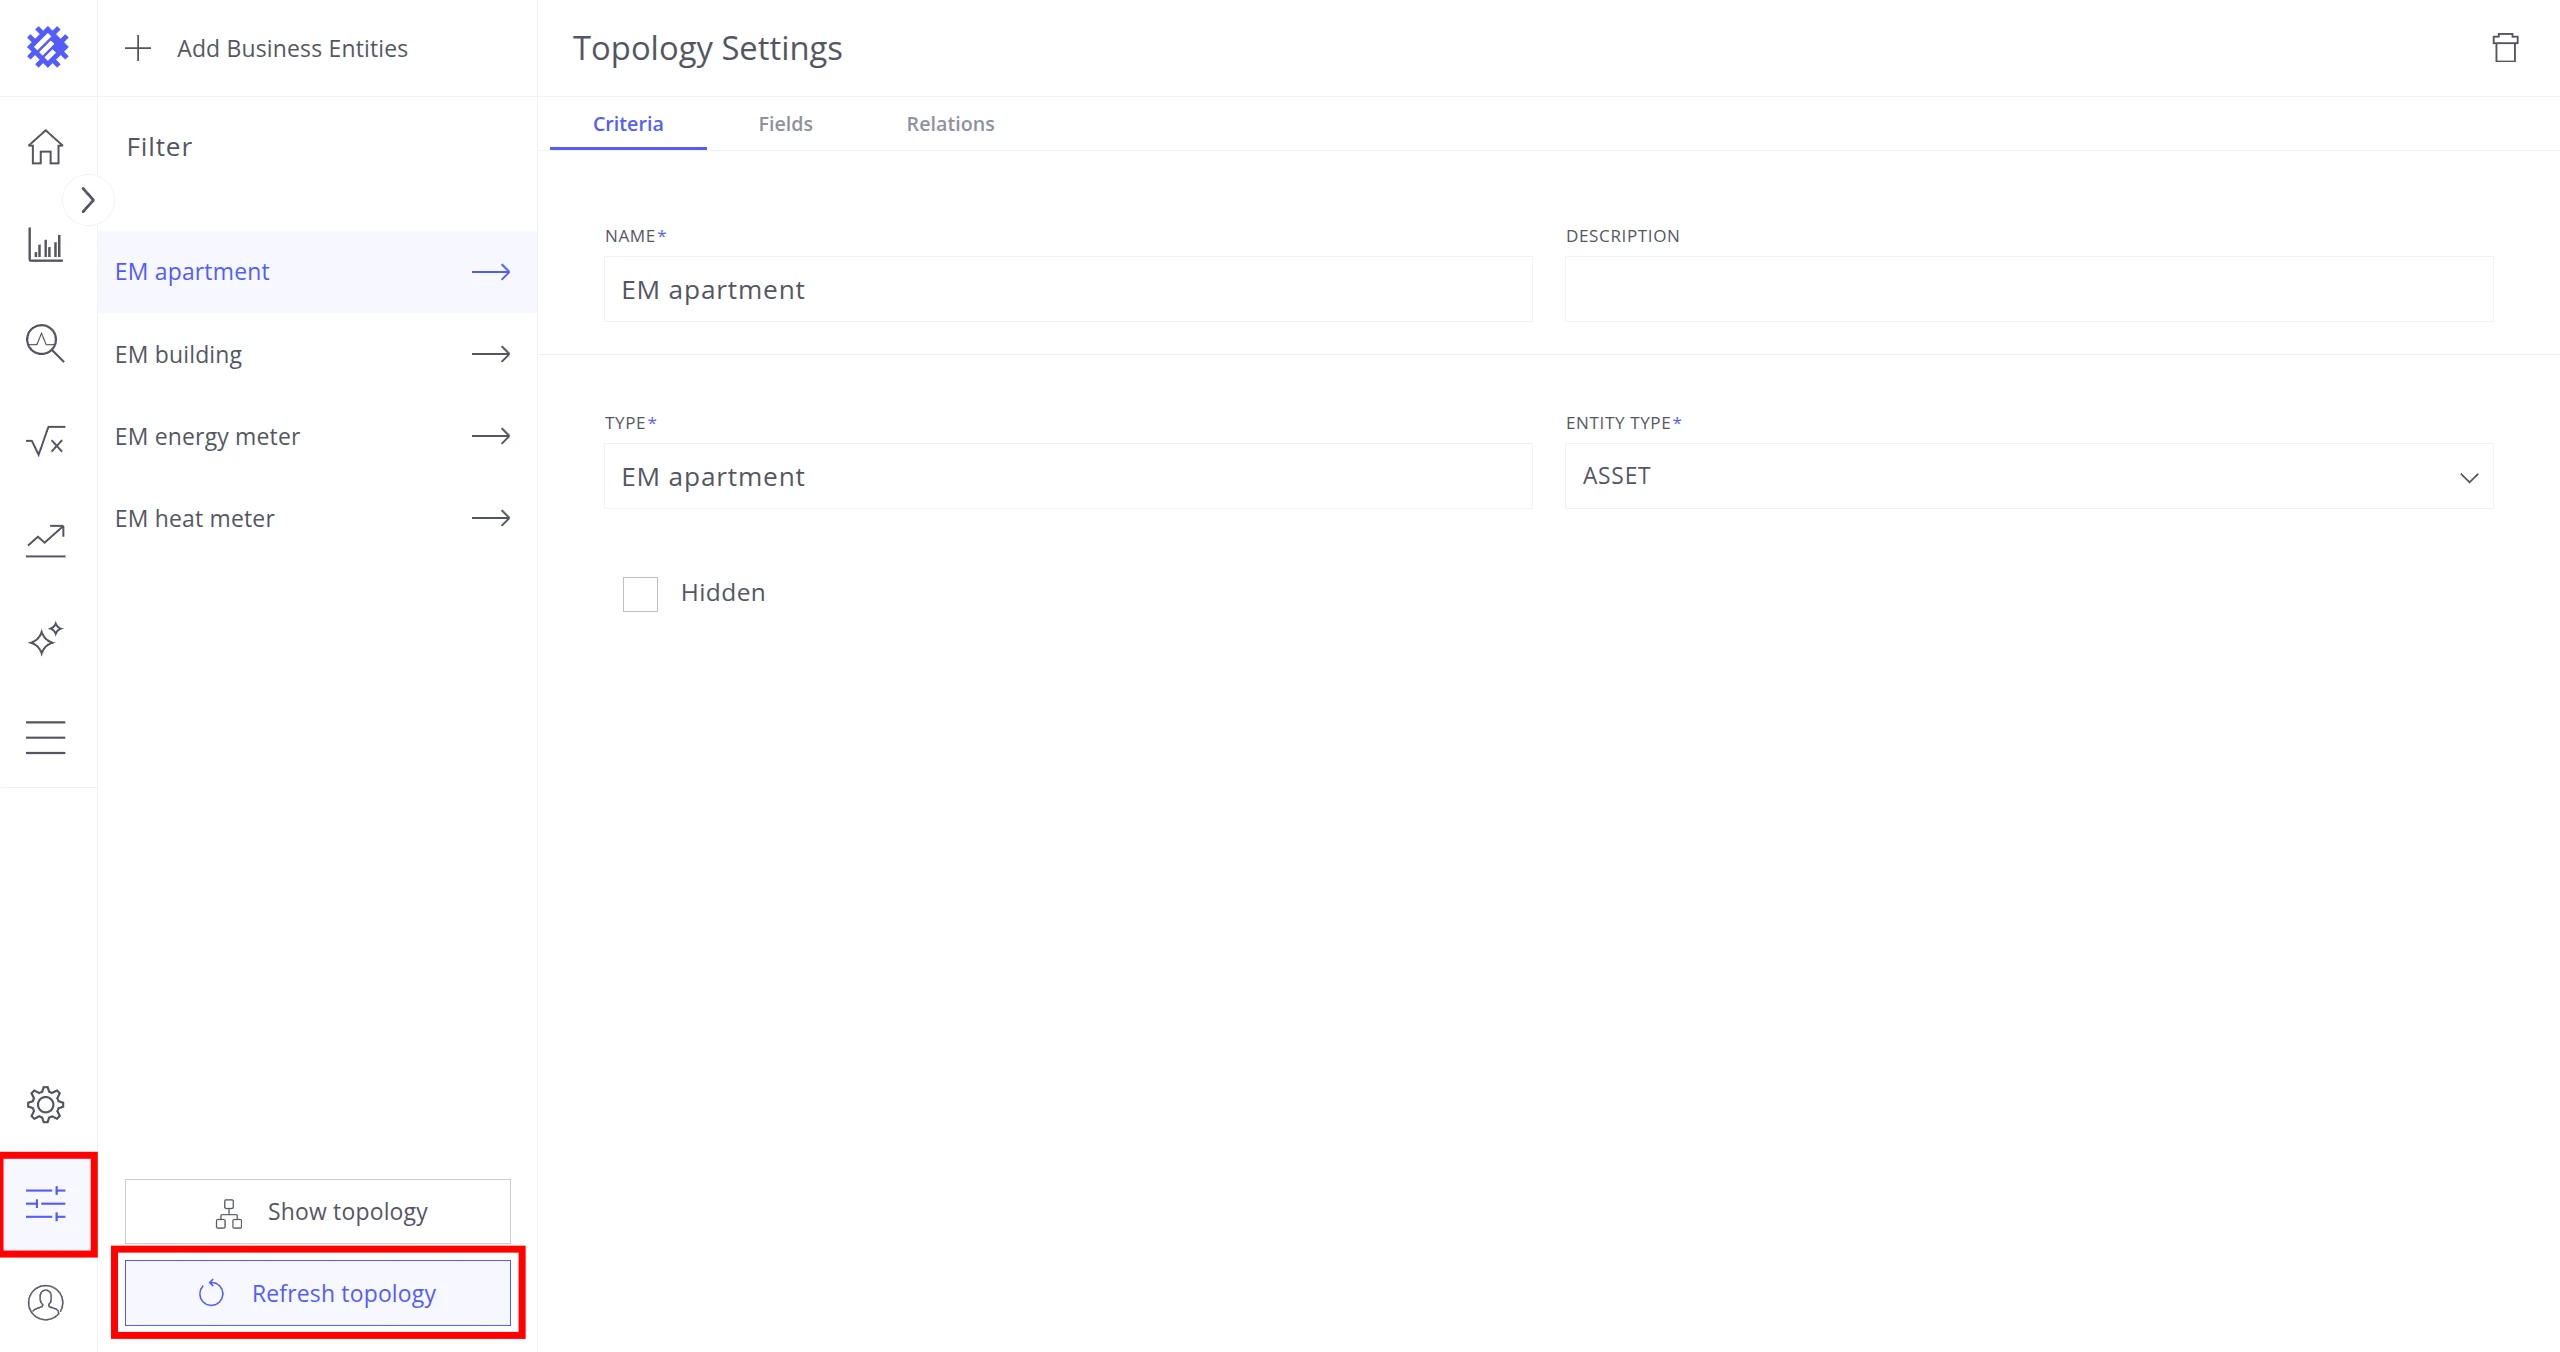
If a telemetry you are looking for is missing, click Show Inactive Telemetries to display telemetries that exist for the item but have no data in the selected timerange. If it still does not appear, perform a topology discovery to sync the latest ThingsBoard structure with Trendz.
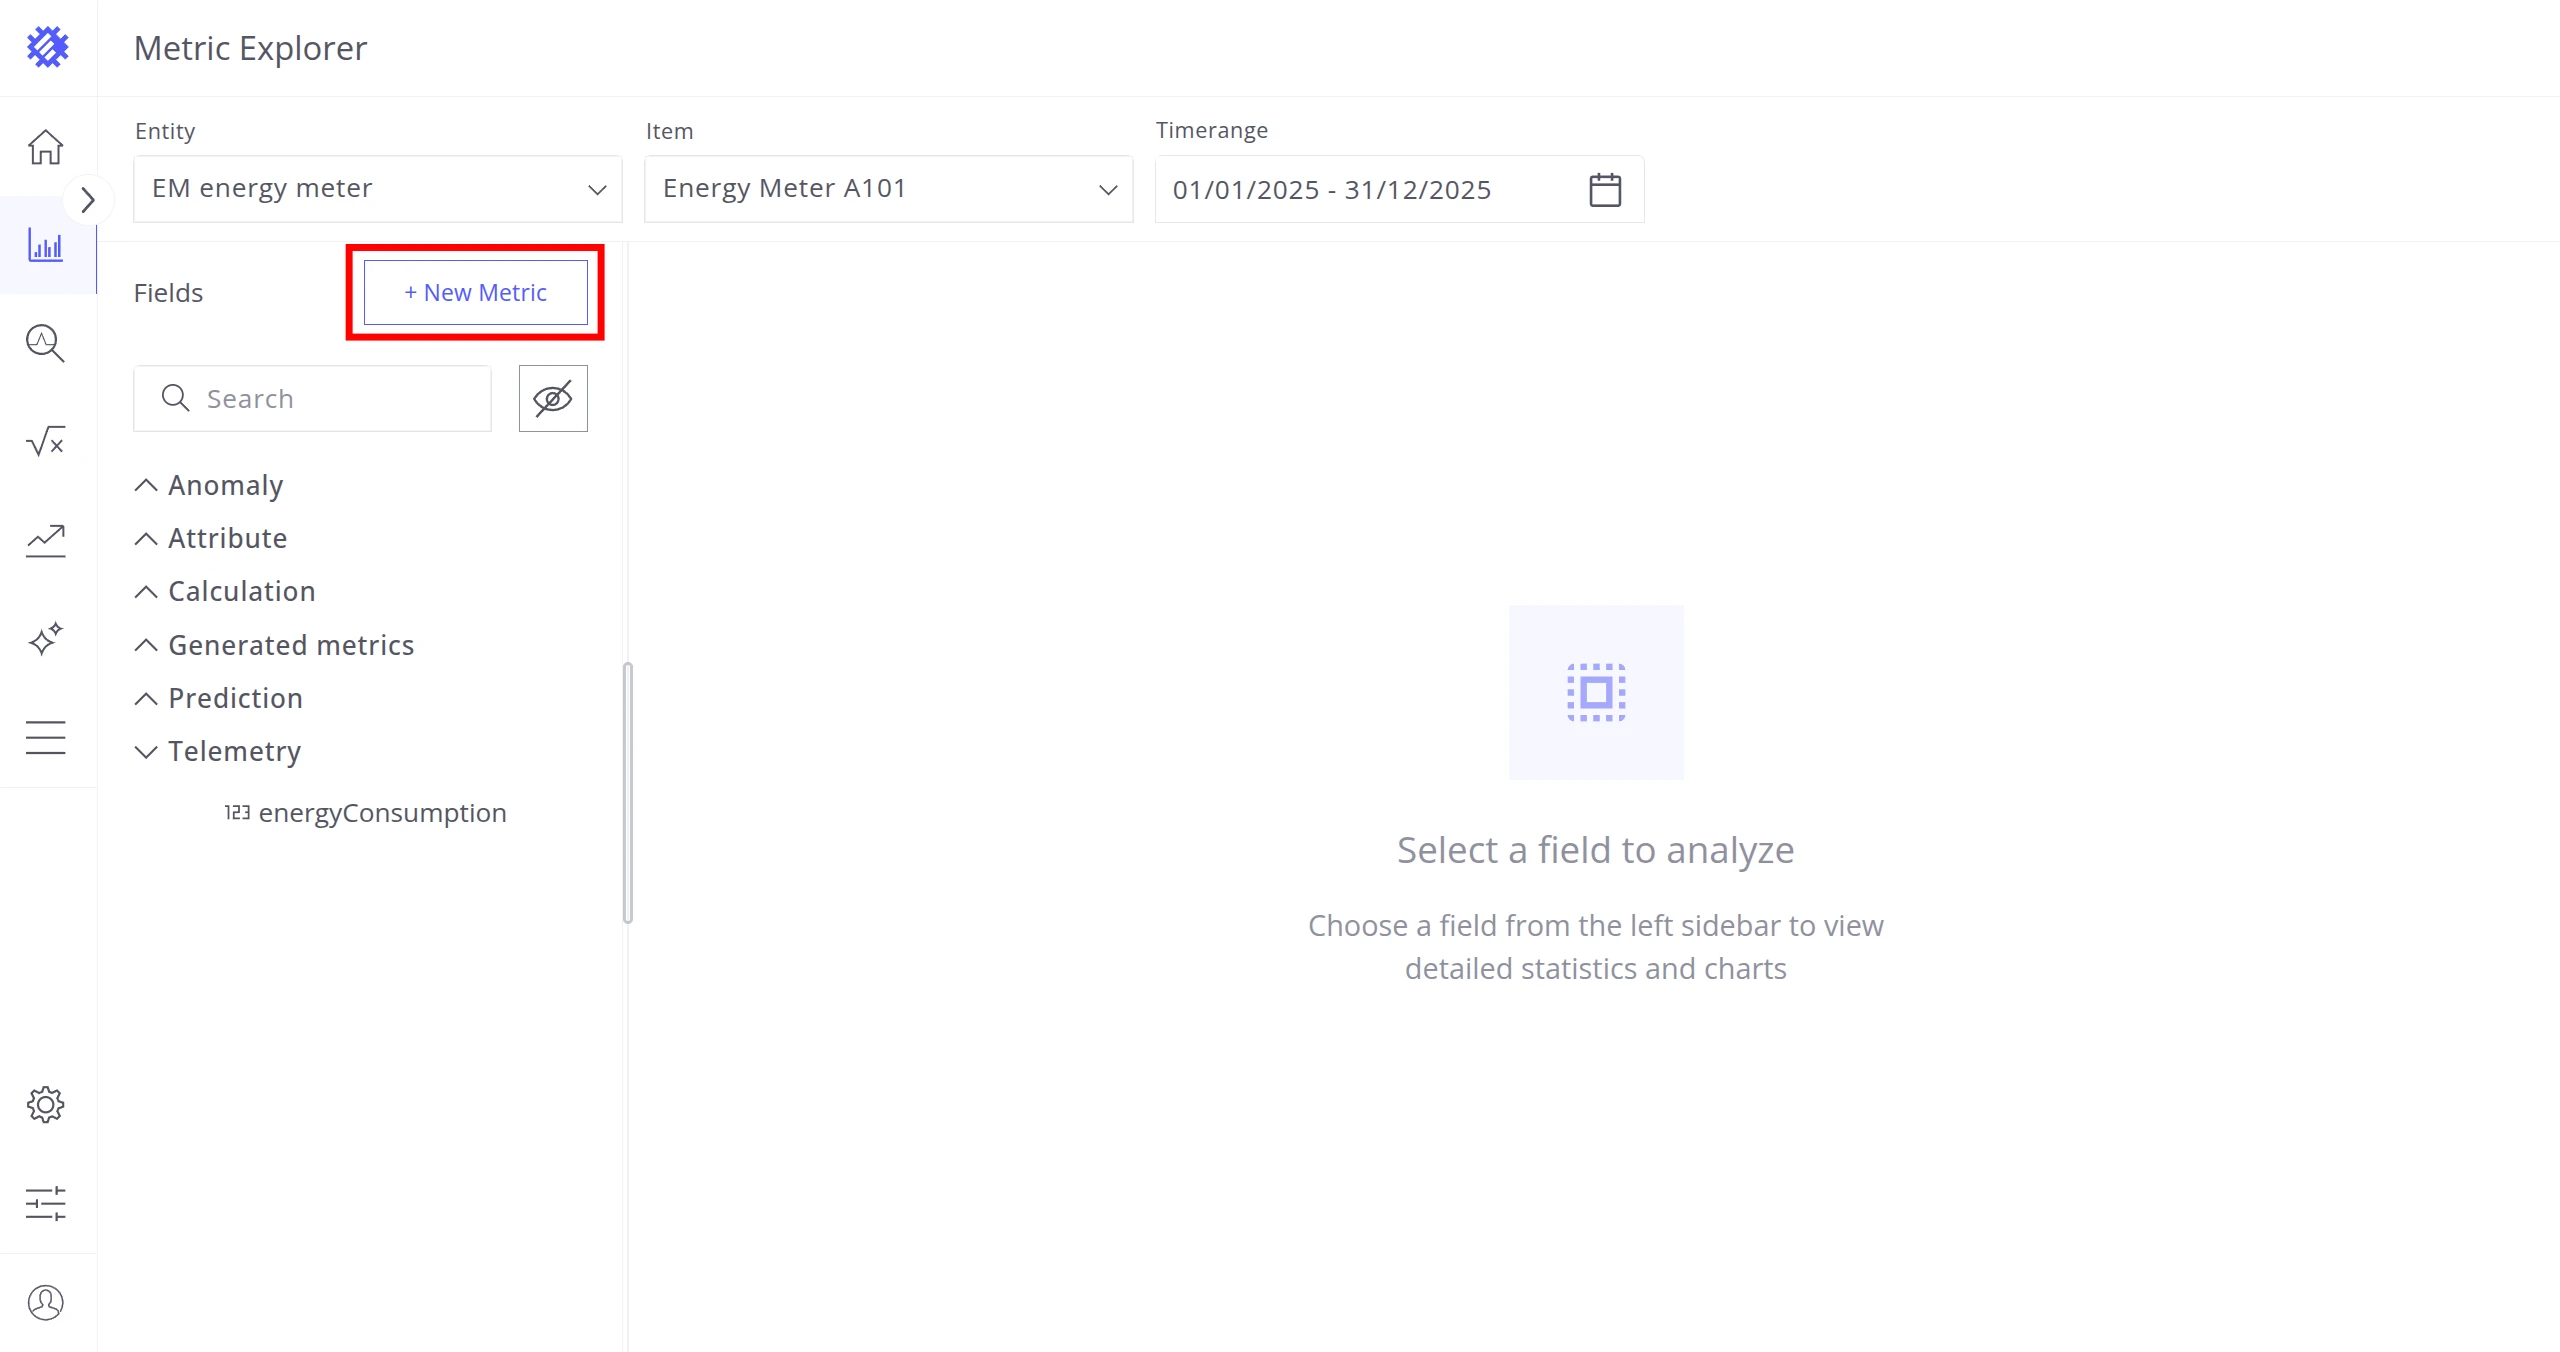
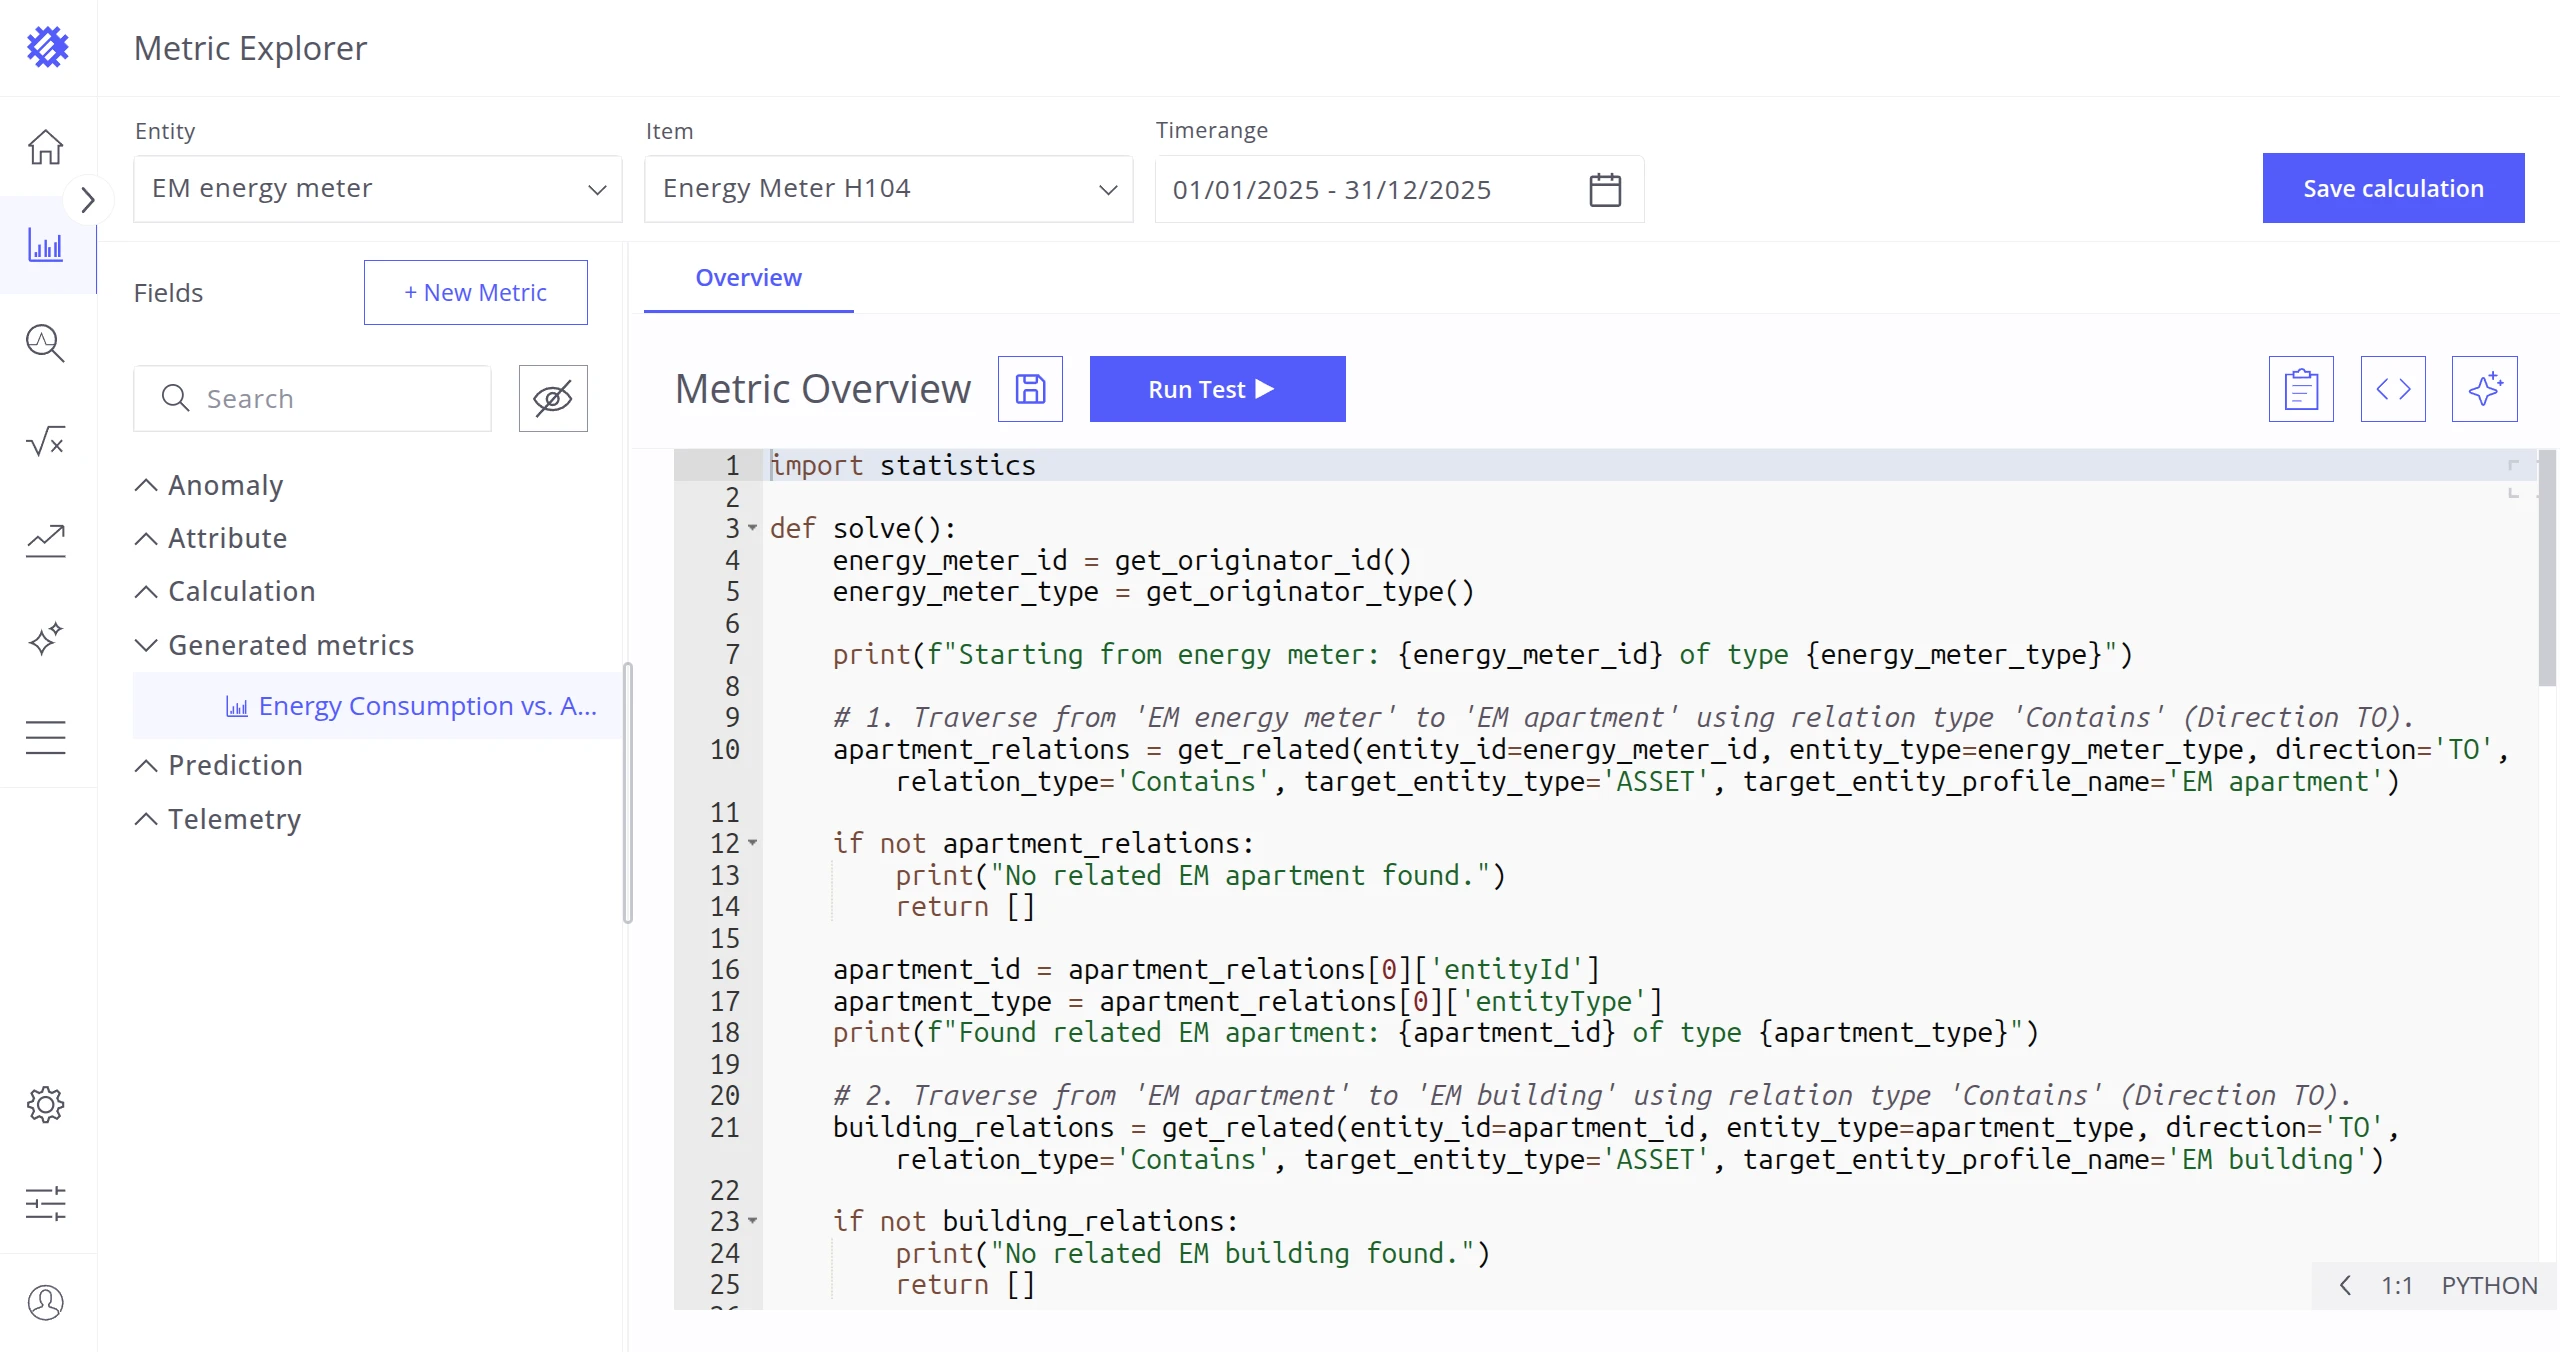
You can also use the + New Metric button to create new metrics from existing ones. See Generate New Metric for details.
Attributes
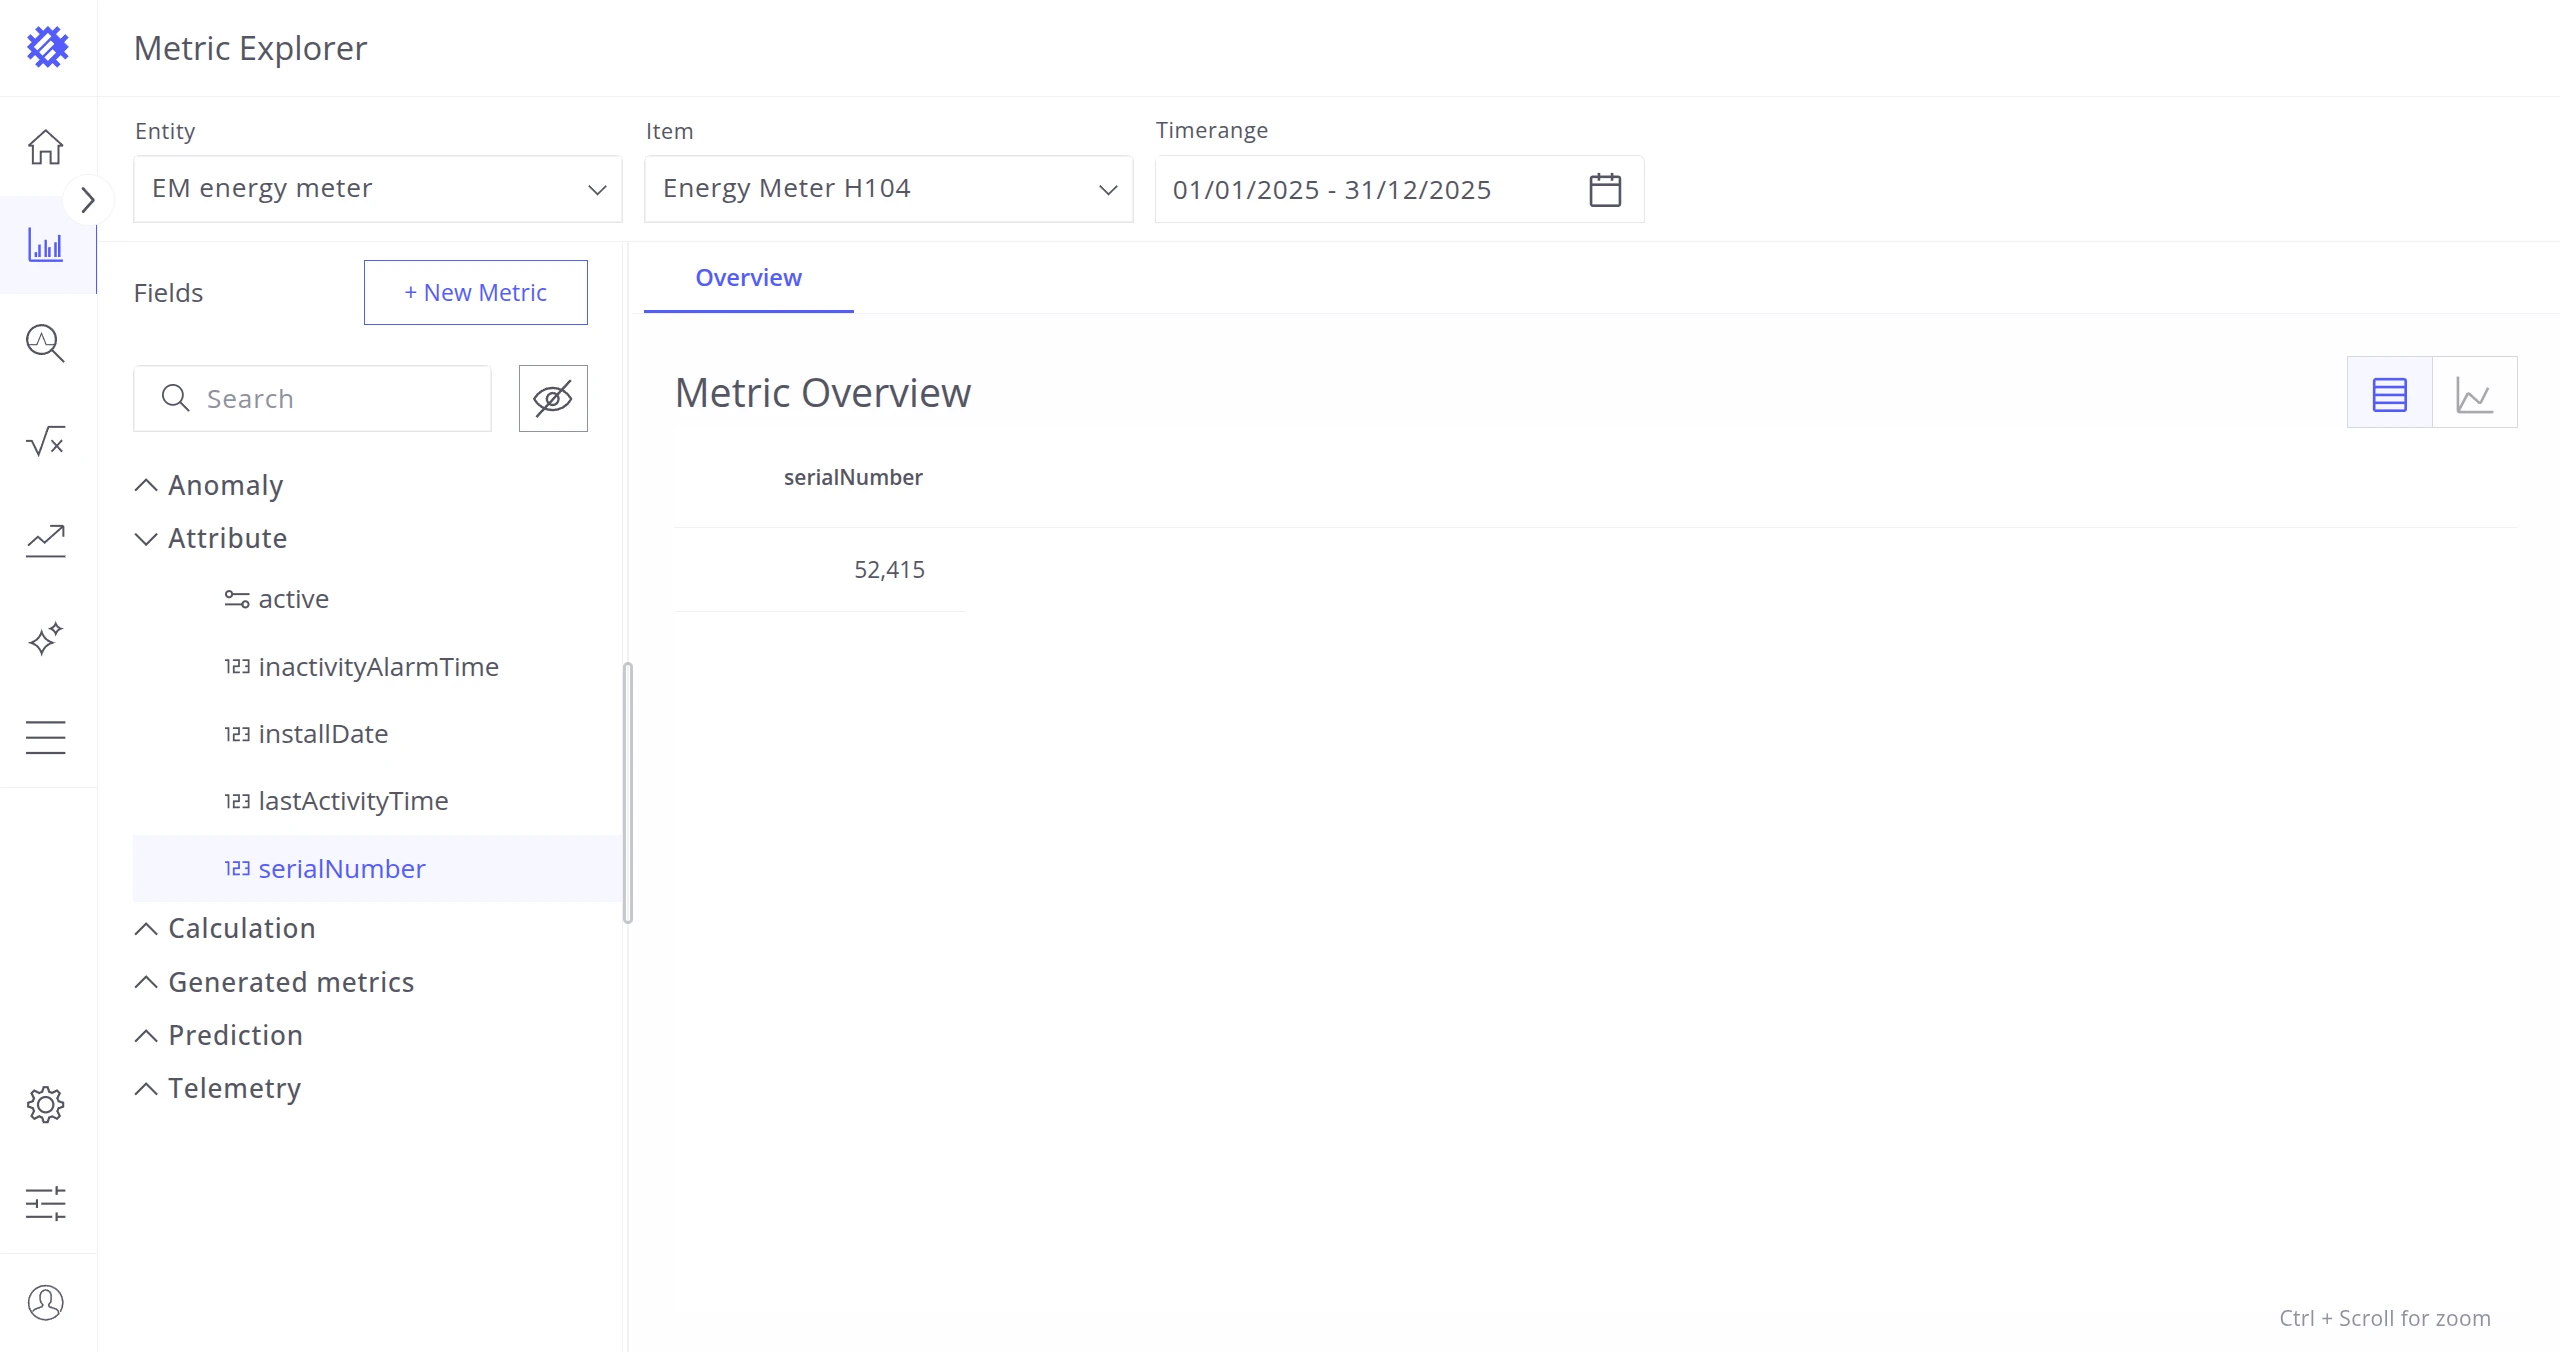
Section titled “Attributes”Lists all attributes of the selected item with their corresponding Trendz business entity fields. Clicking an attribute displays its current value.
Telemetries
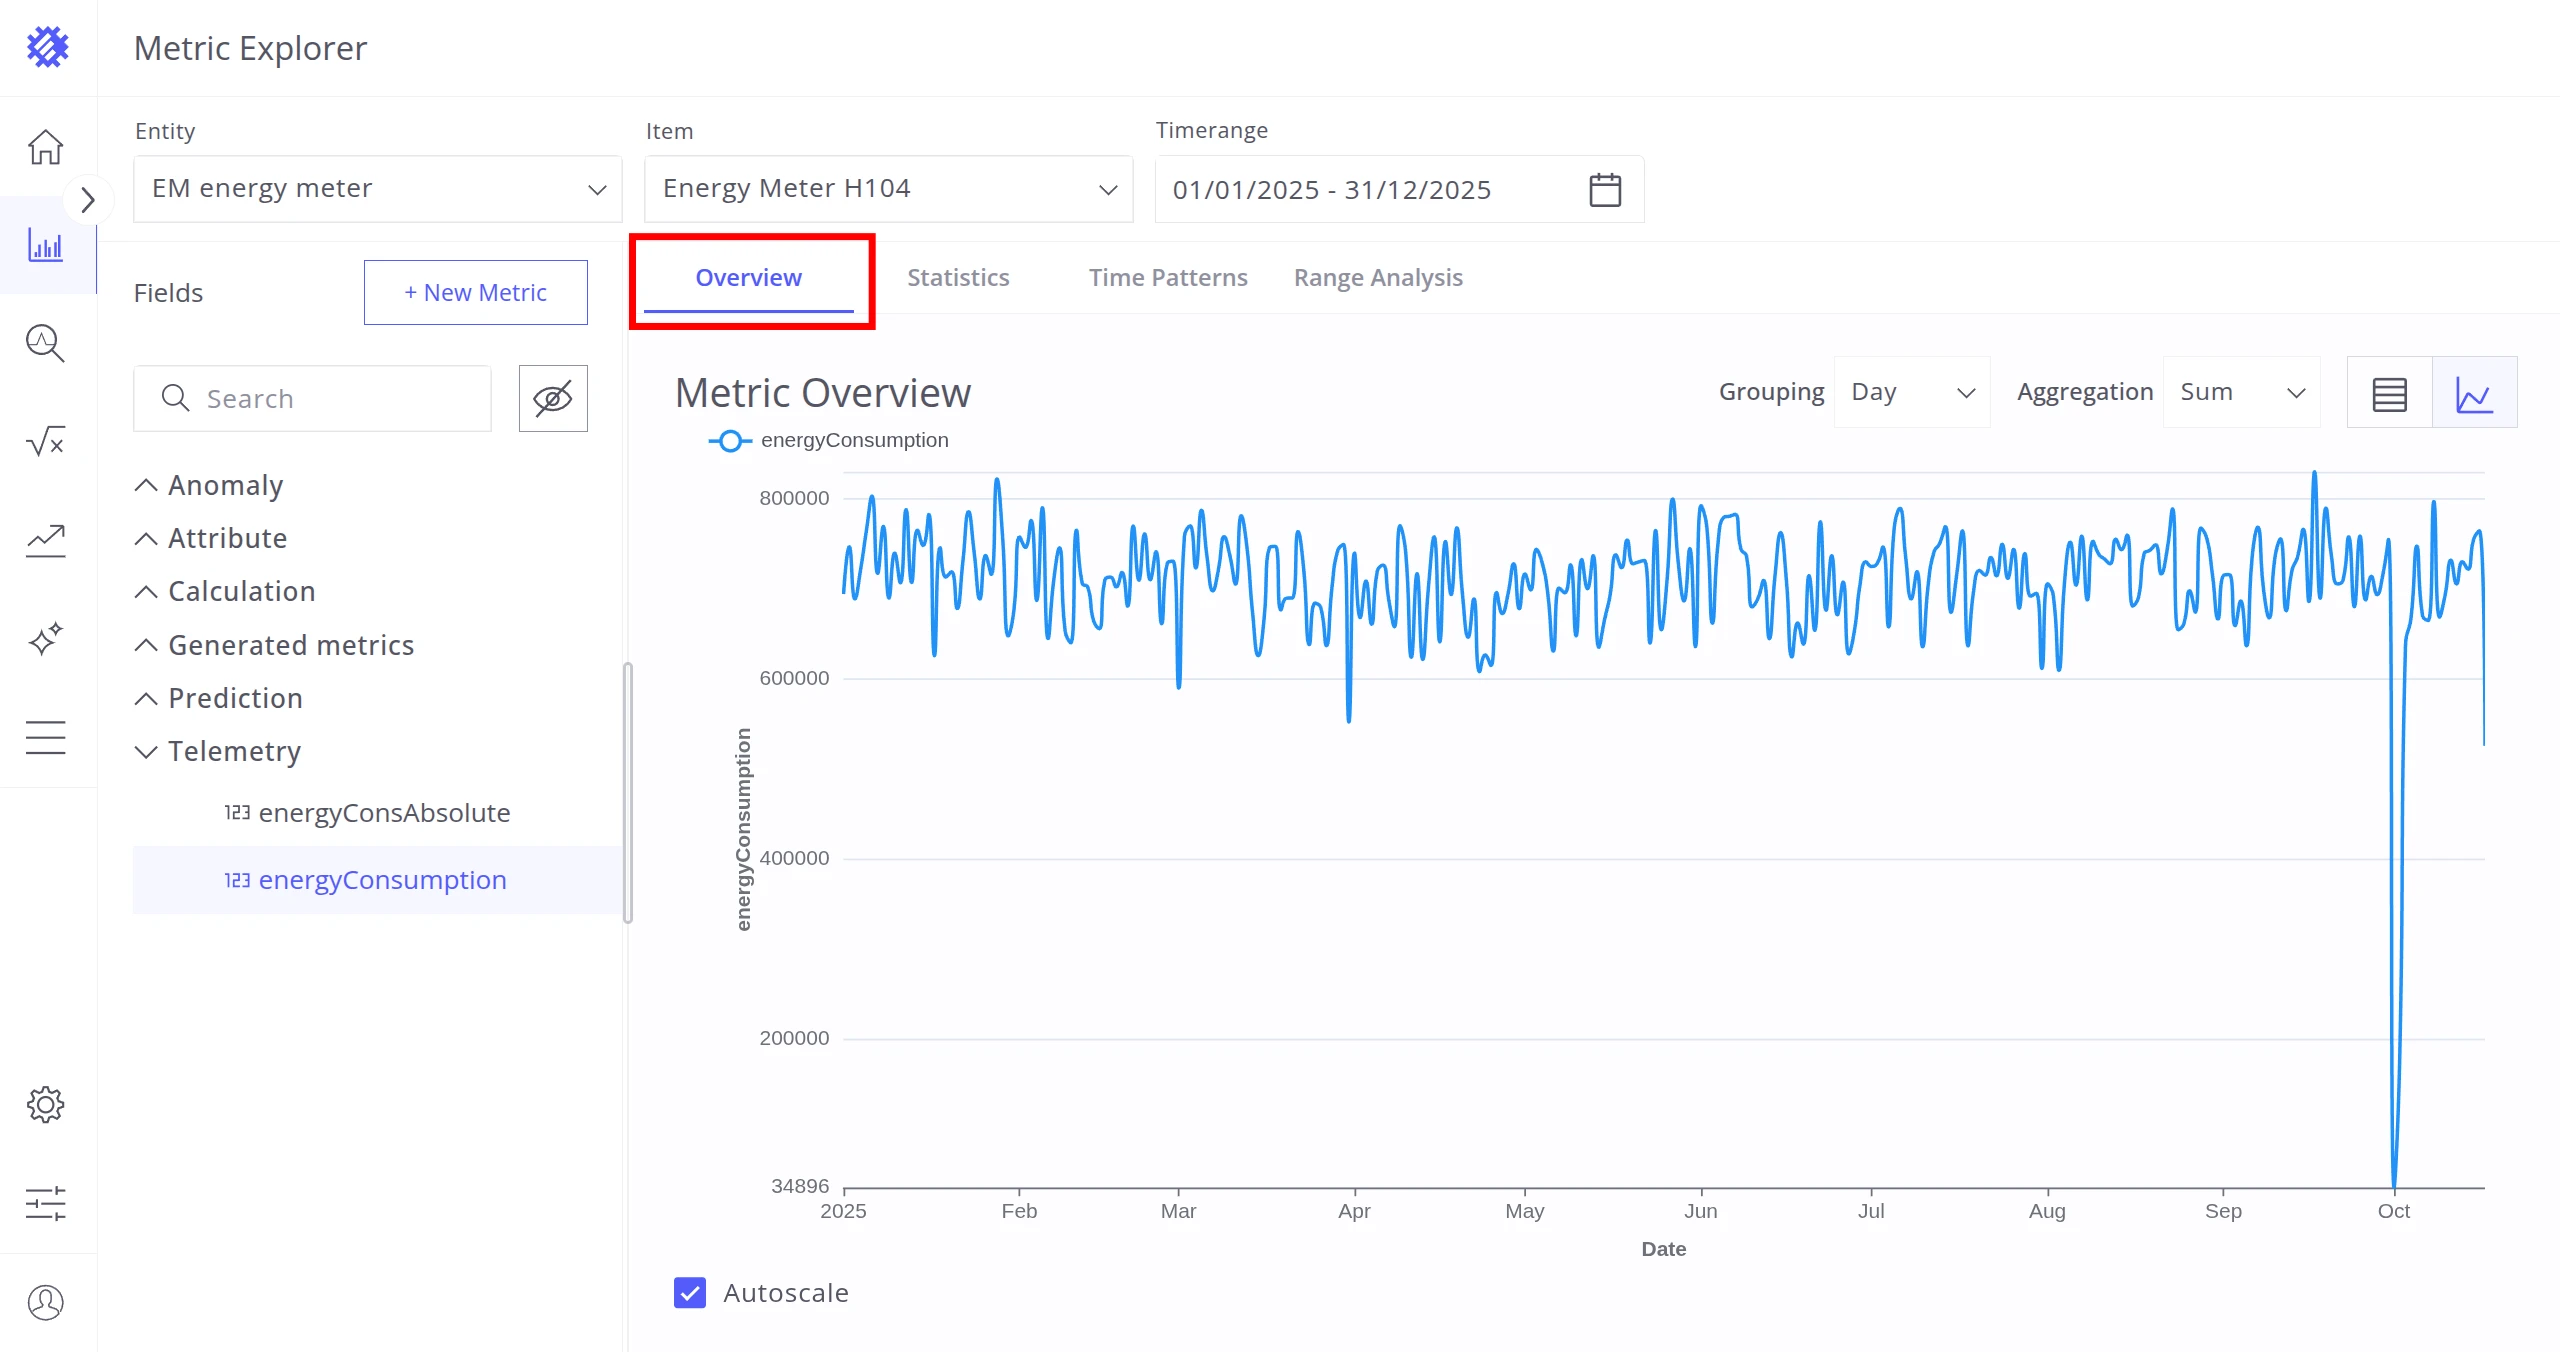
Section titled “Telemetries”Shows all telemetries of the selected item that have at least one data point in the selected timerange.
Each telemetry entry offers four analysis tabs:
| Tab | Description |
|---|---|
| Overview | Line chart or table view of telemetry values. |
| Statistics | Basic statistical summary for the selected timerange. |
| Time Patterns | Behavioral patterns across time units. |
| Range Analysis | Distribution of telemetry values over time and range intervals. |
Calculations, Predictions, and Anomalies
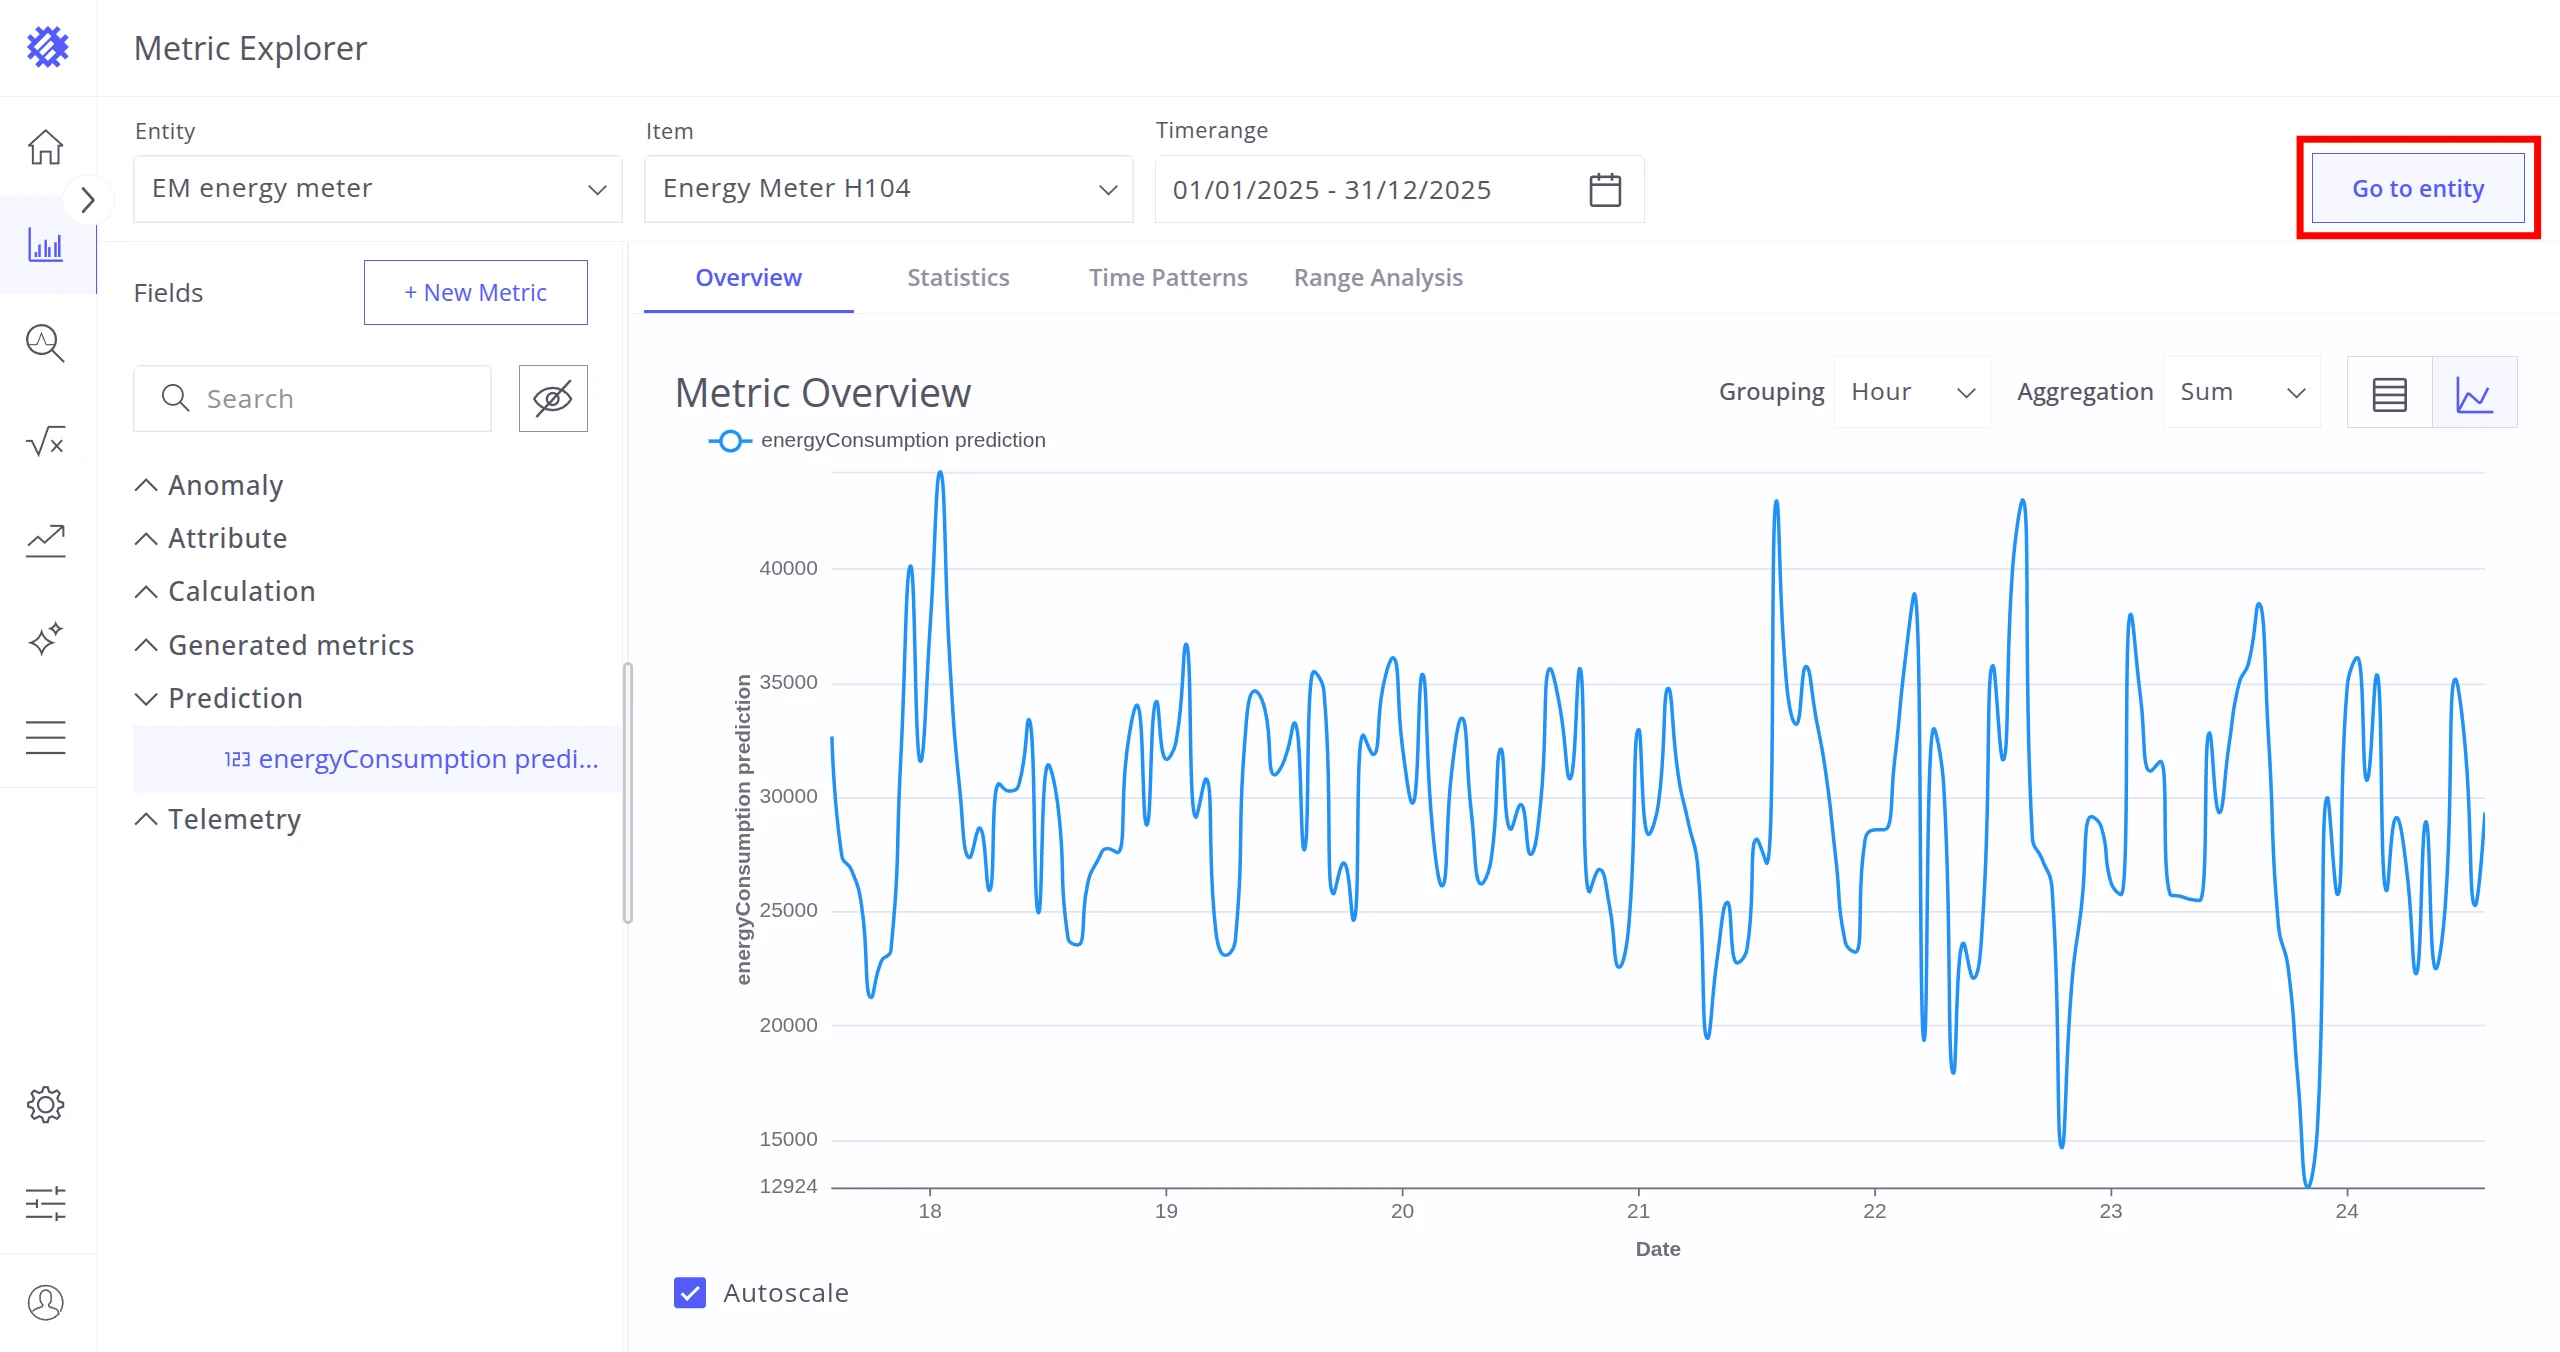
Section titled “Calculations, Predictions, and Anomalies”Telemetries generated by Trendz entities (Calculation Fields, Prediction Models, or Anomaly Models). These use the same four-tab structure as regular telemetries, with an additional Go to Entity button for quick navigation to the related Trendz entity.
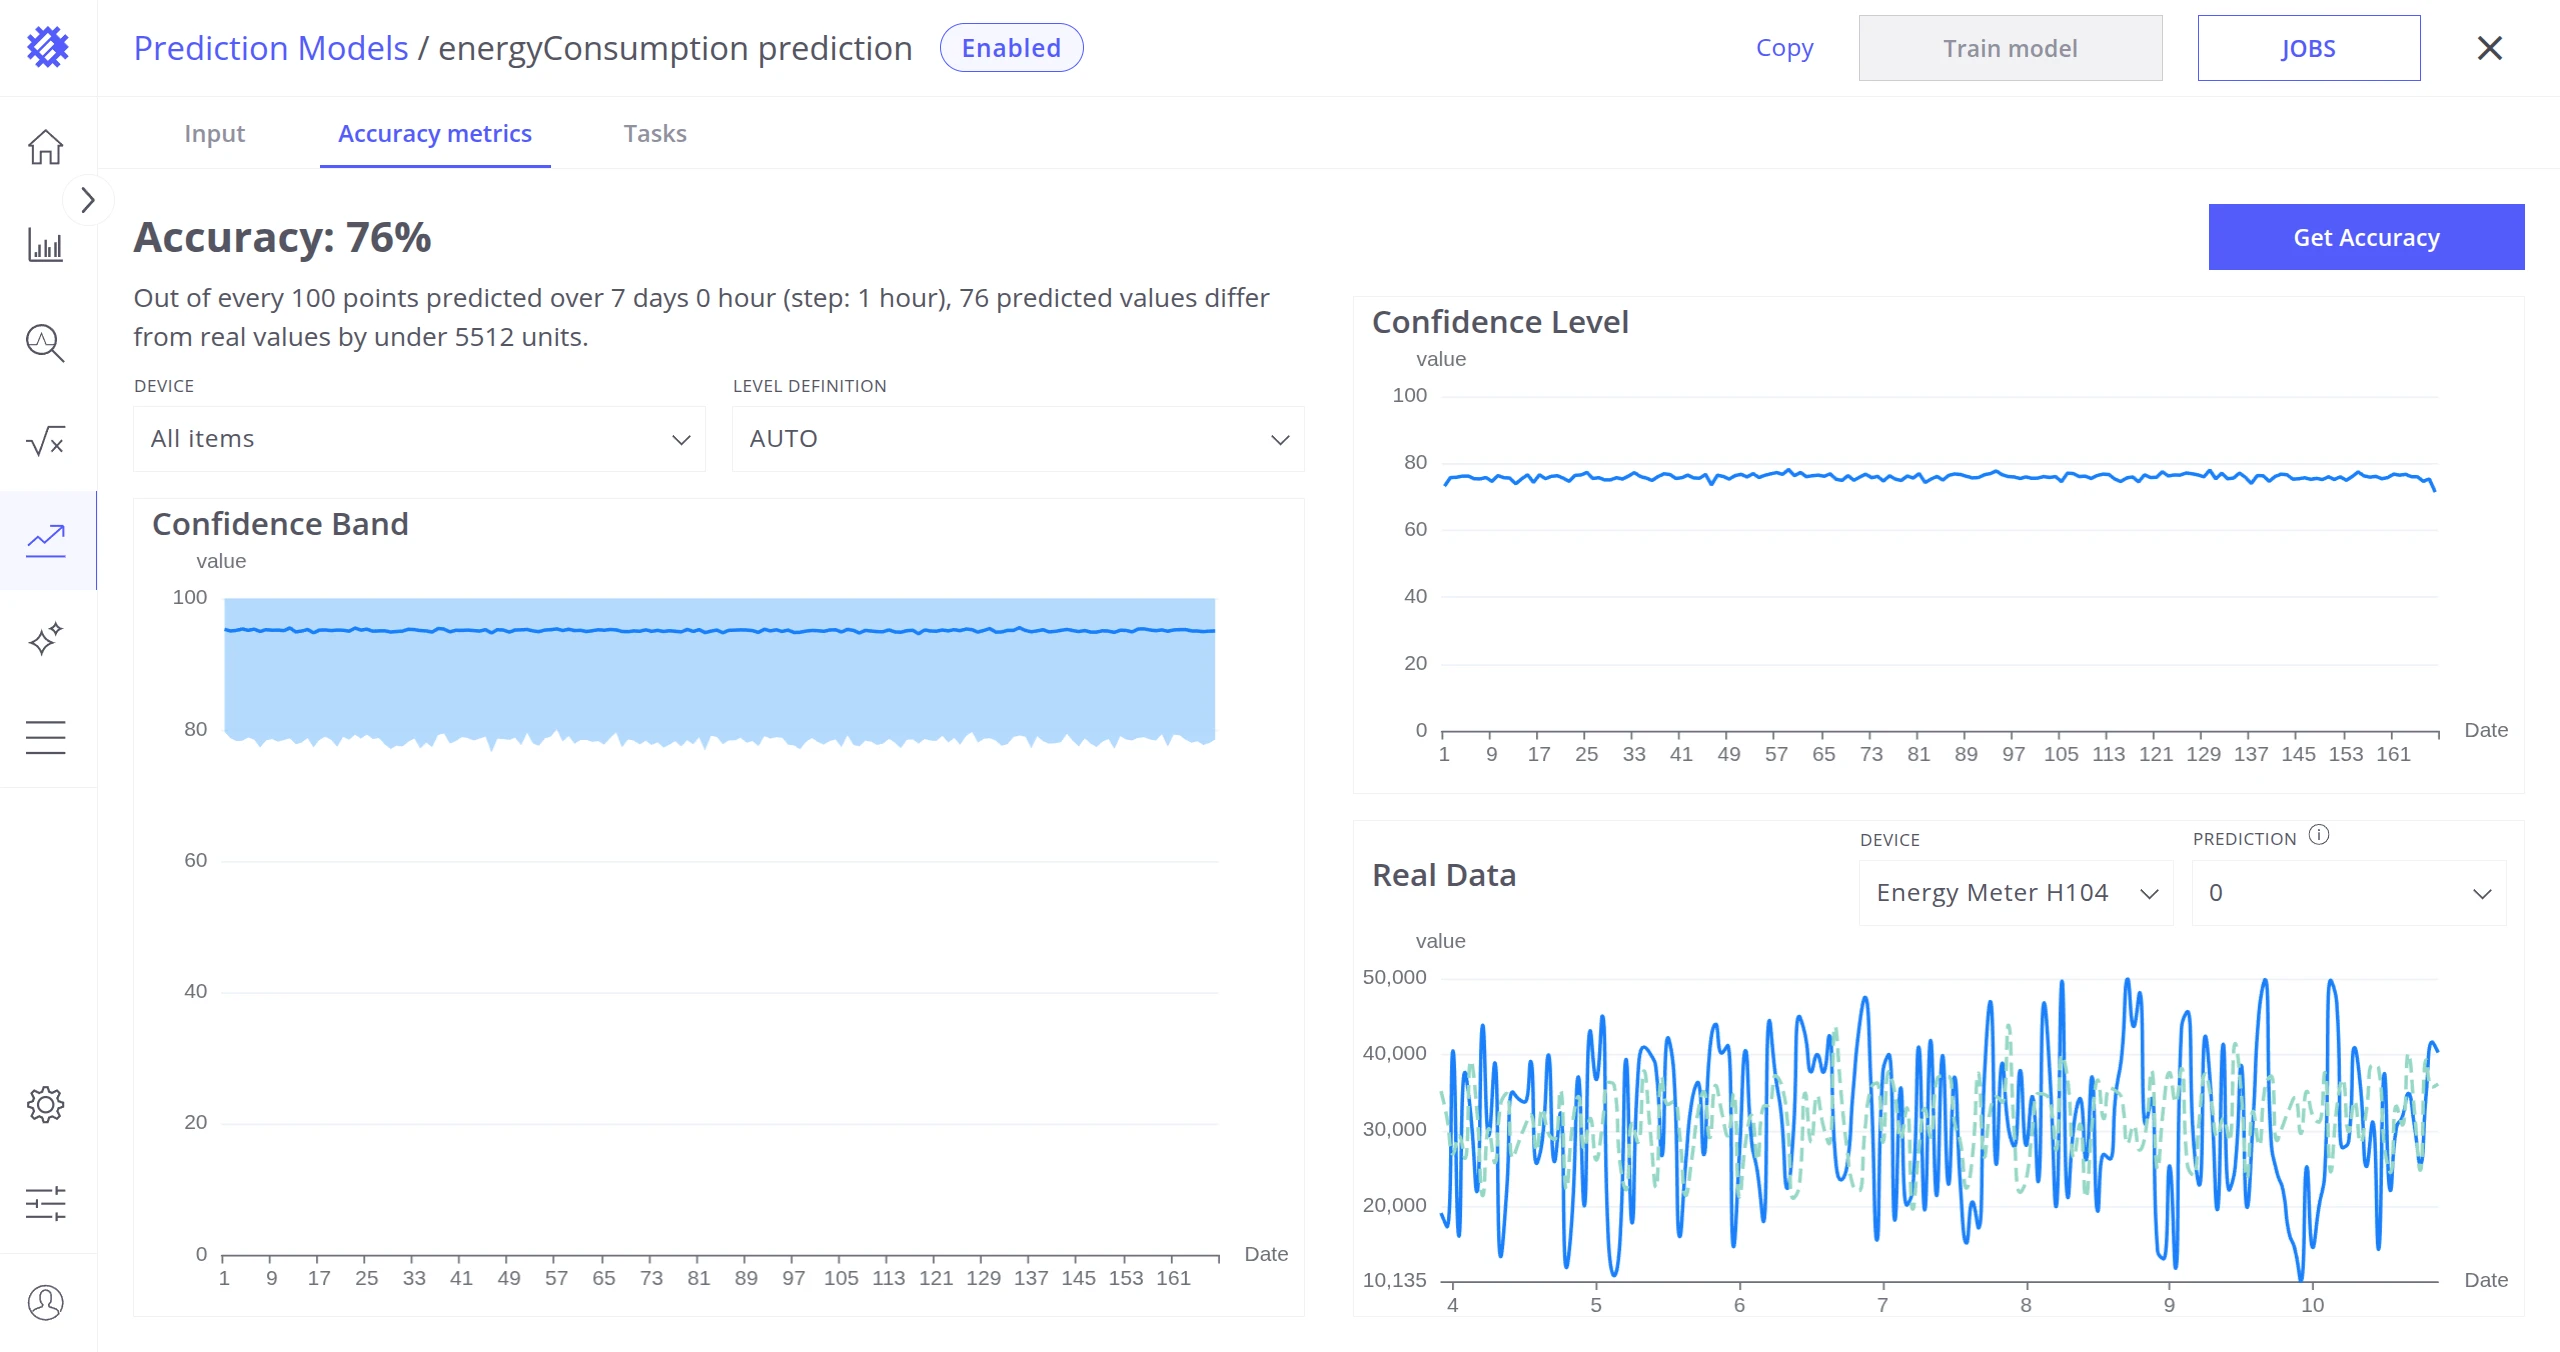
If a field does not appear in the expected group, ensure the Trendz entity is configured to save telemetry to ThingsBoard. Refer to the respective guides:
- Calculation Field — Save to ThingsBoard
- Prediction Model — Save telemetry
- Anomaly Model — Save to ThingsBoard
Generated Metrics
Section titled “Generated Metrics”Displays metrics generated directly within the Metric Explorer. See Generate New Metric for details.
Tabs Section
Section titled “Tabs Section”When a telemetry is selected, the Tabs Section displays analytical views for exploration.
Chart controls available in all tabs:
- Zoom — hold Ctrl and scroll with the mouse wheel to zoom any chart.
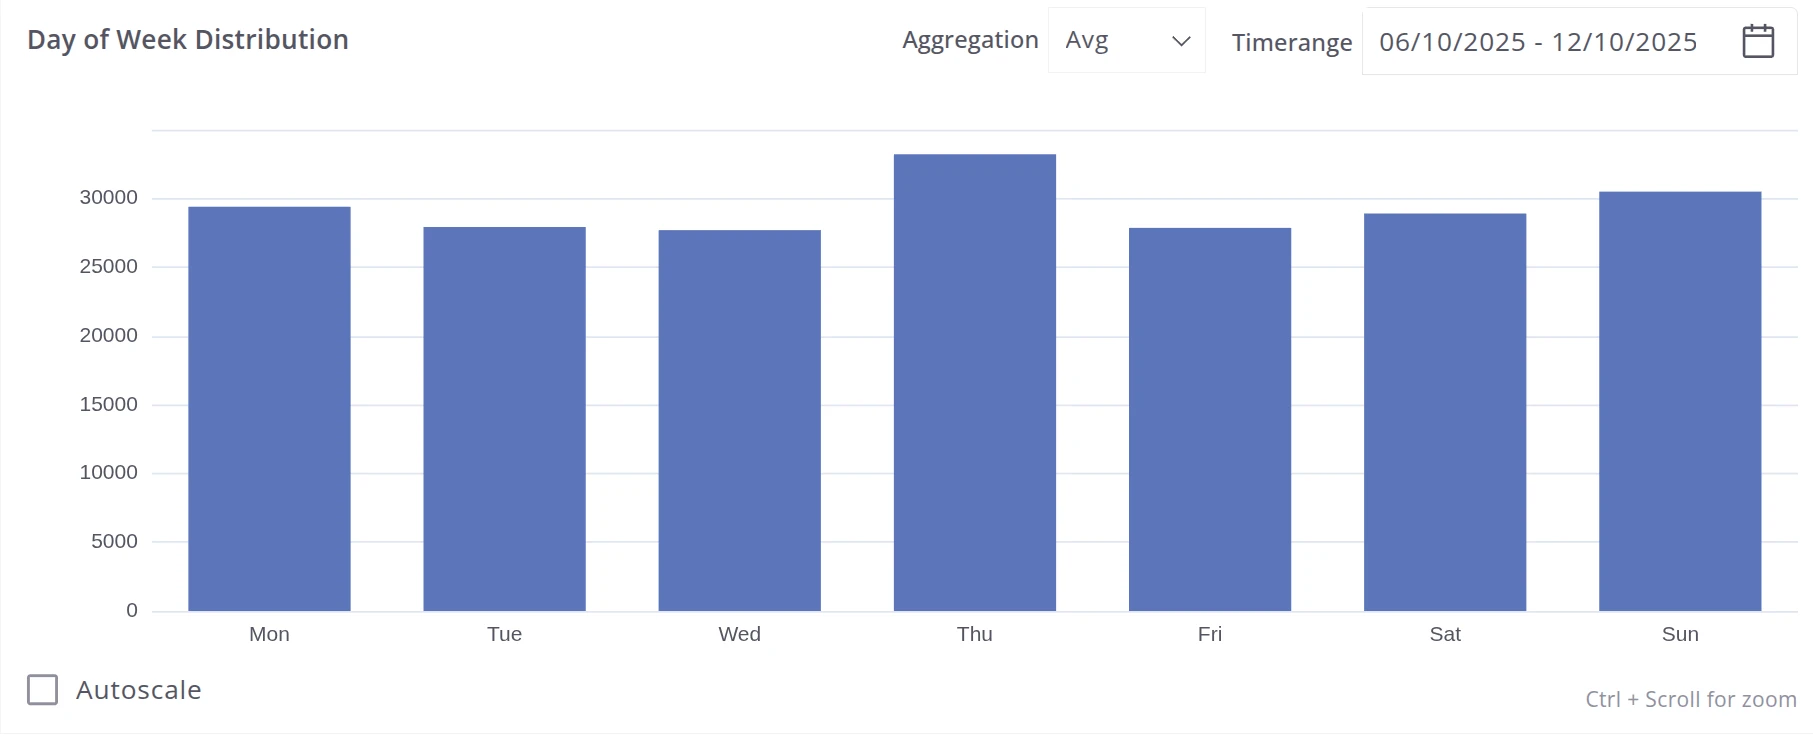
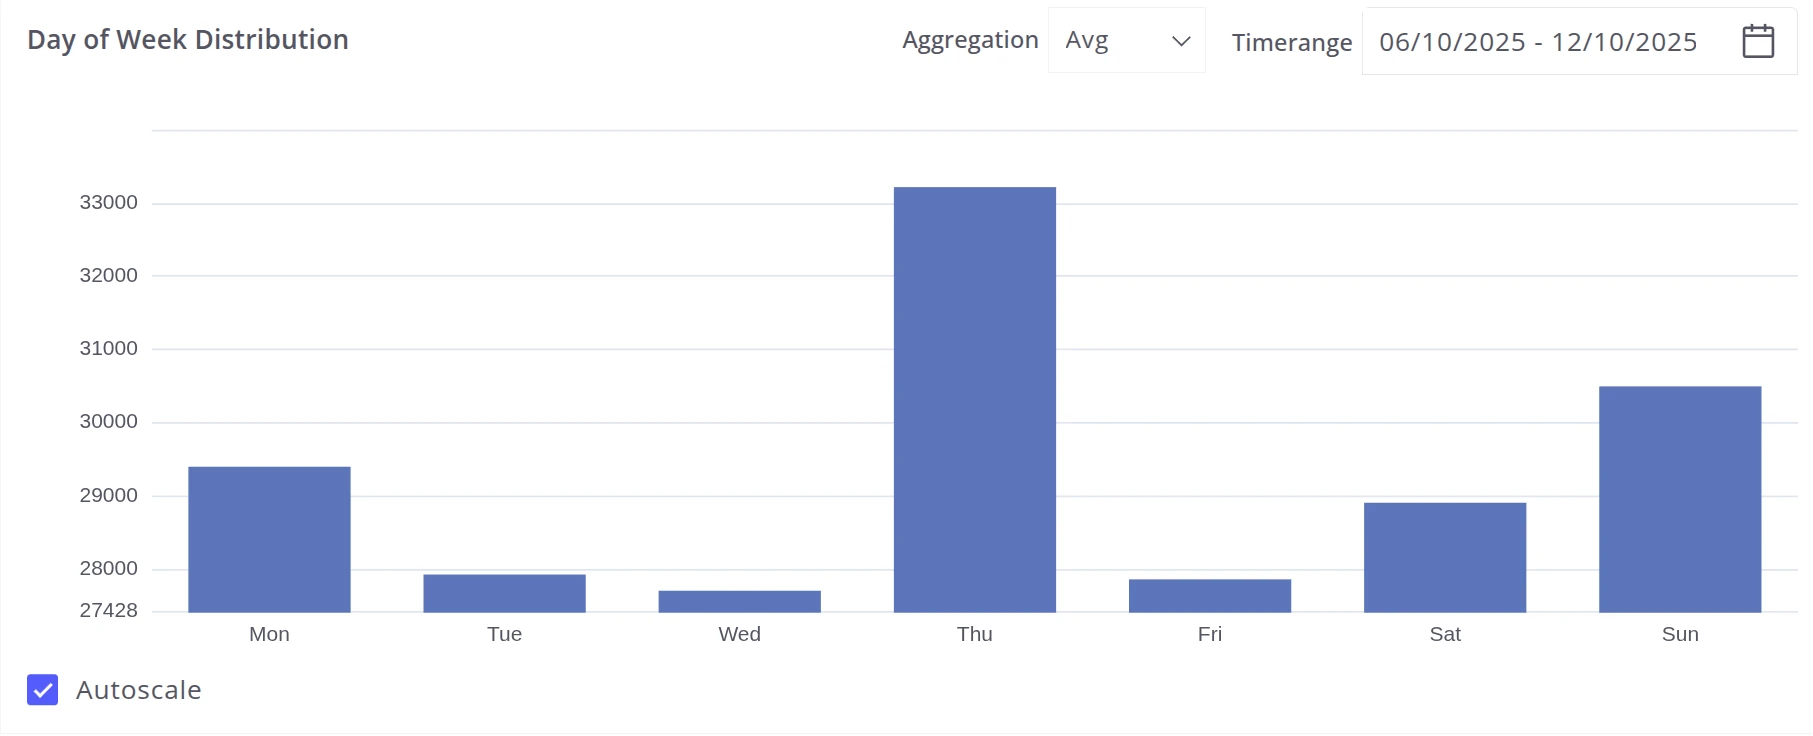
- Autoscale — when disabled, the Y-axis starts at 0 and ends at the maximum value; when enabled, the Y-axis fits the actual data range (min to max).
Overview Tab
Section titled “Overview Tab”Shows the historical trend of the selected telemetry within the timerange.
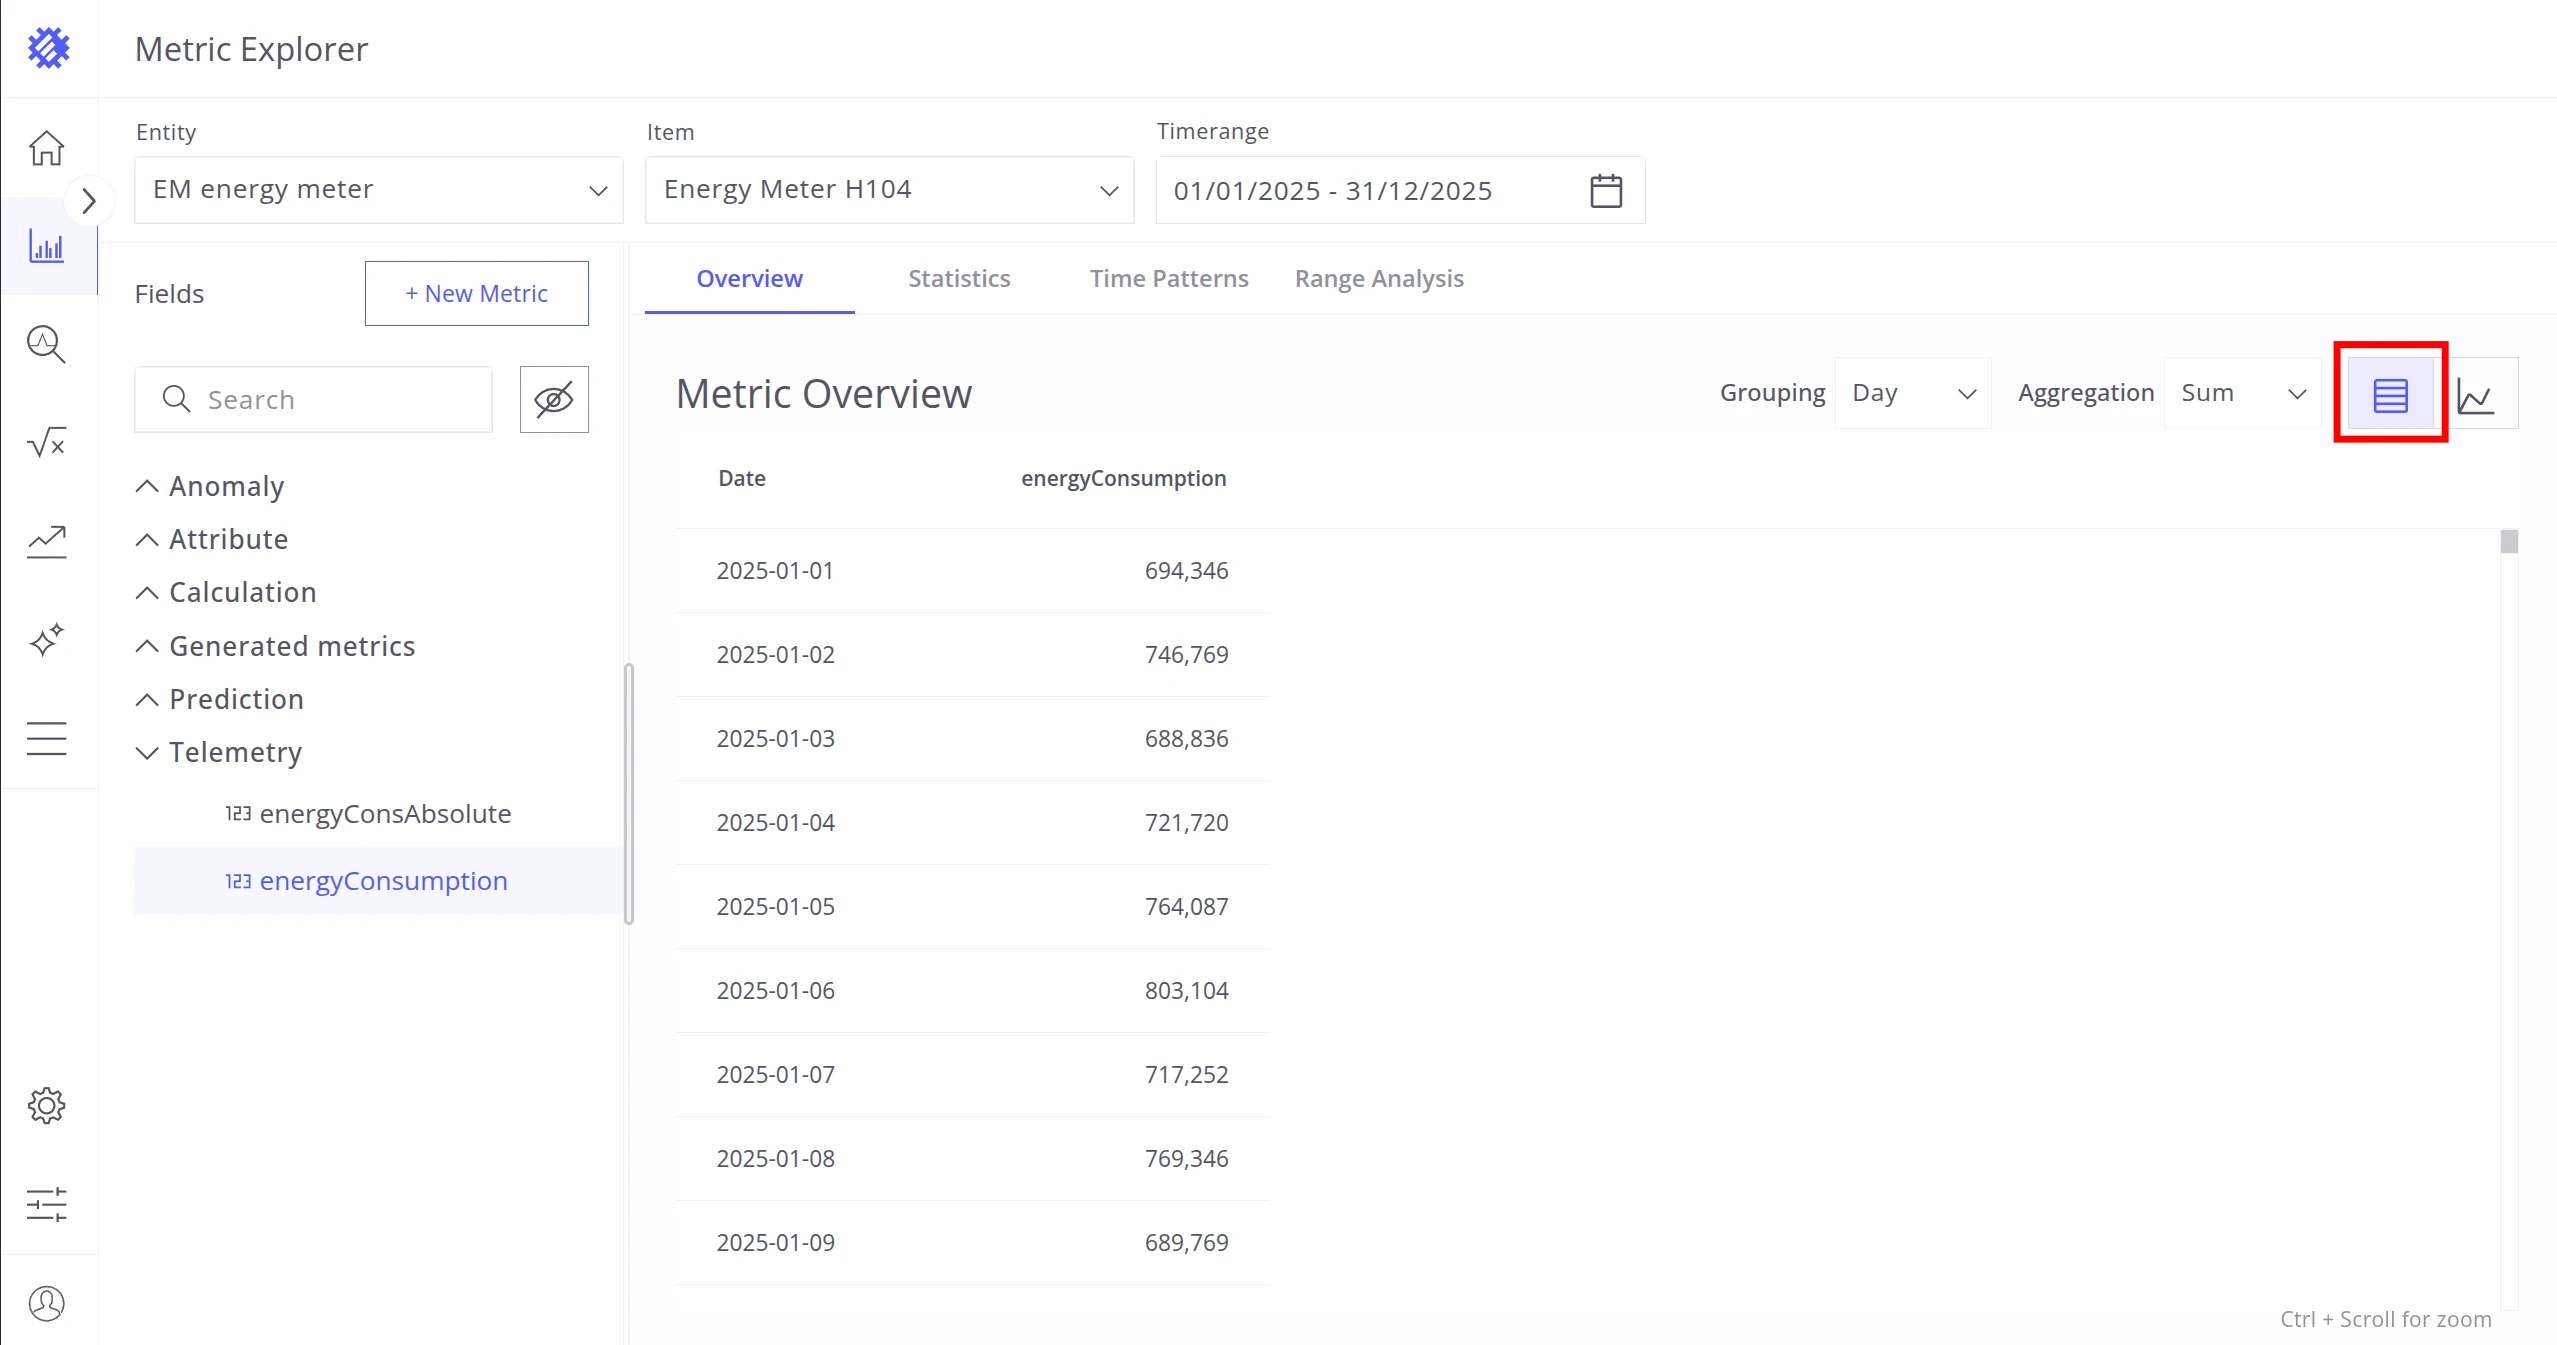
- Switch between Table and Line Chart views.
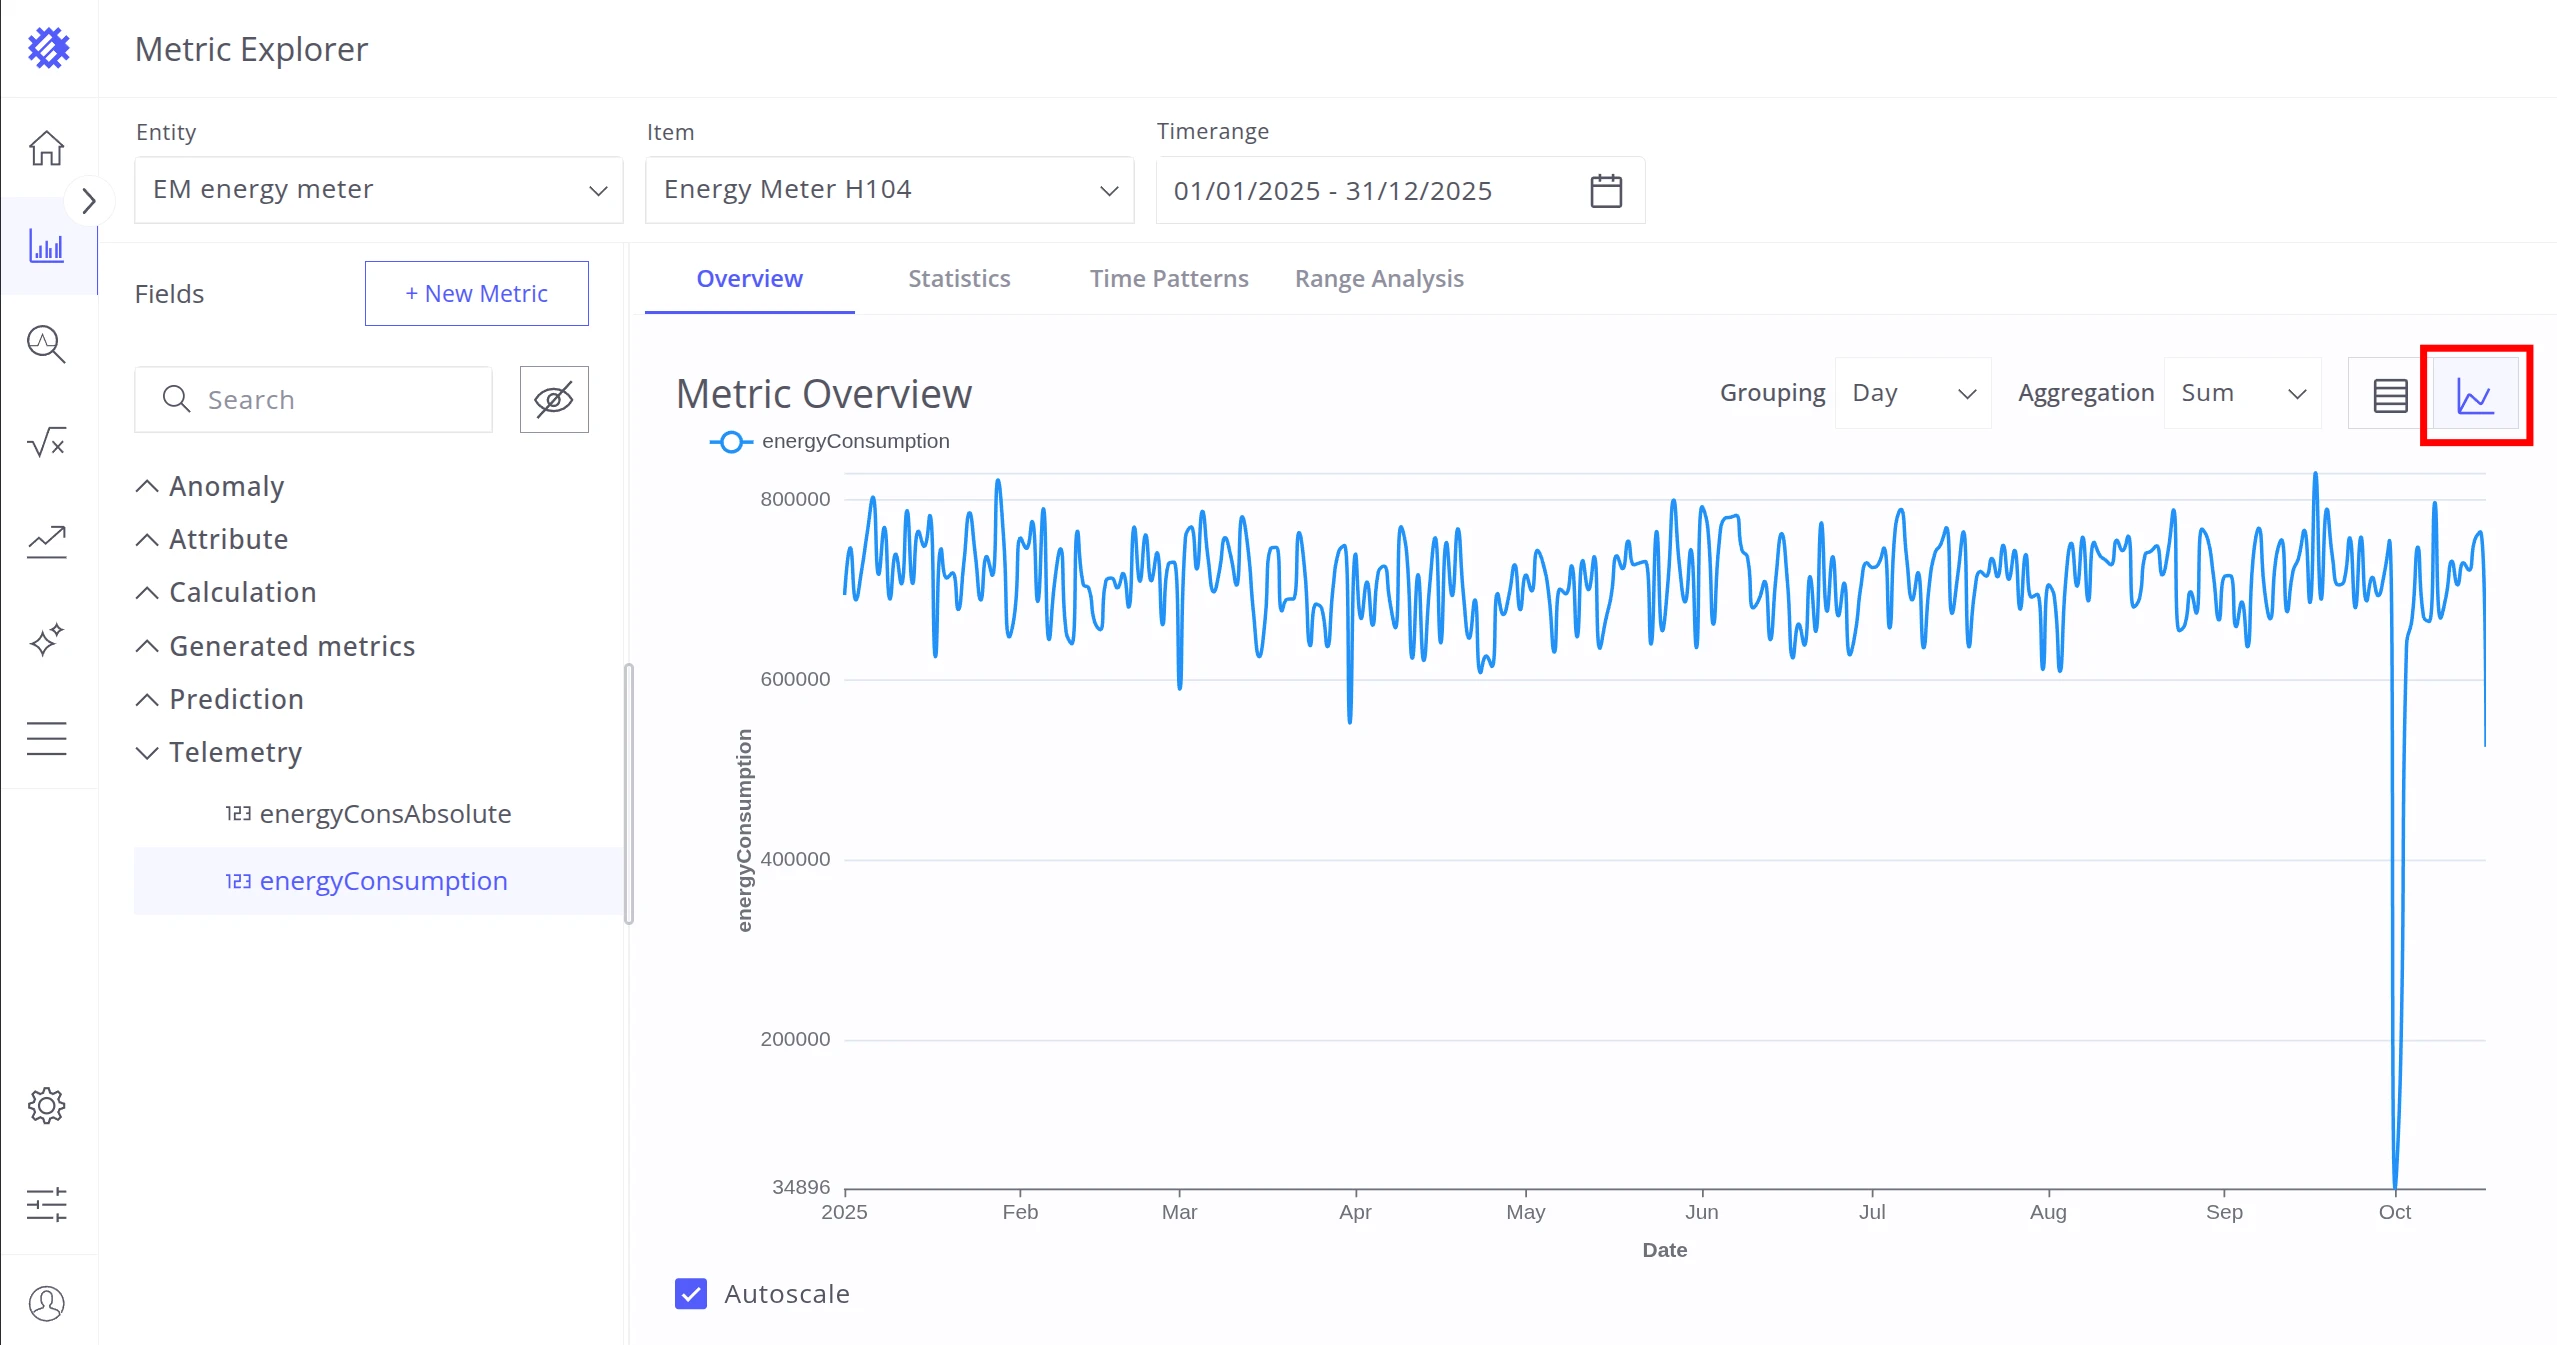
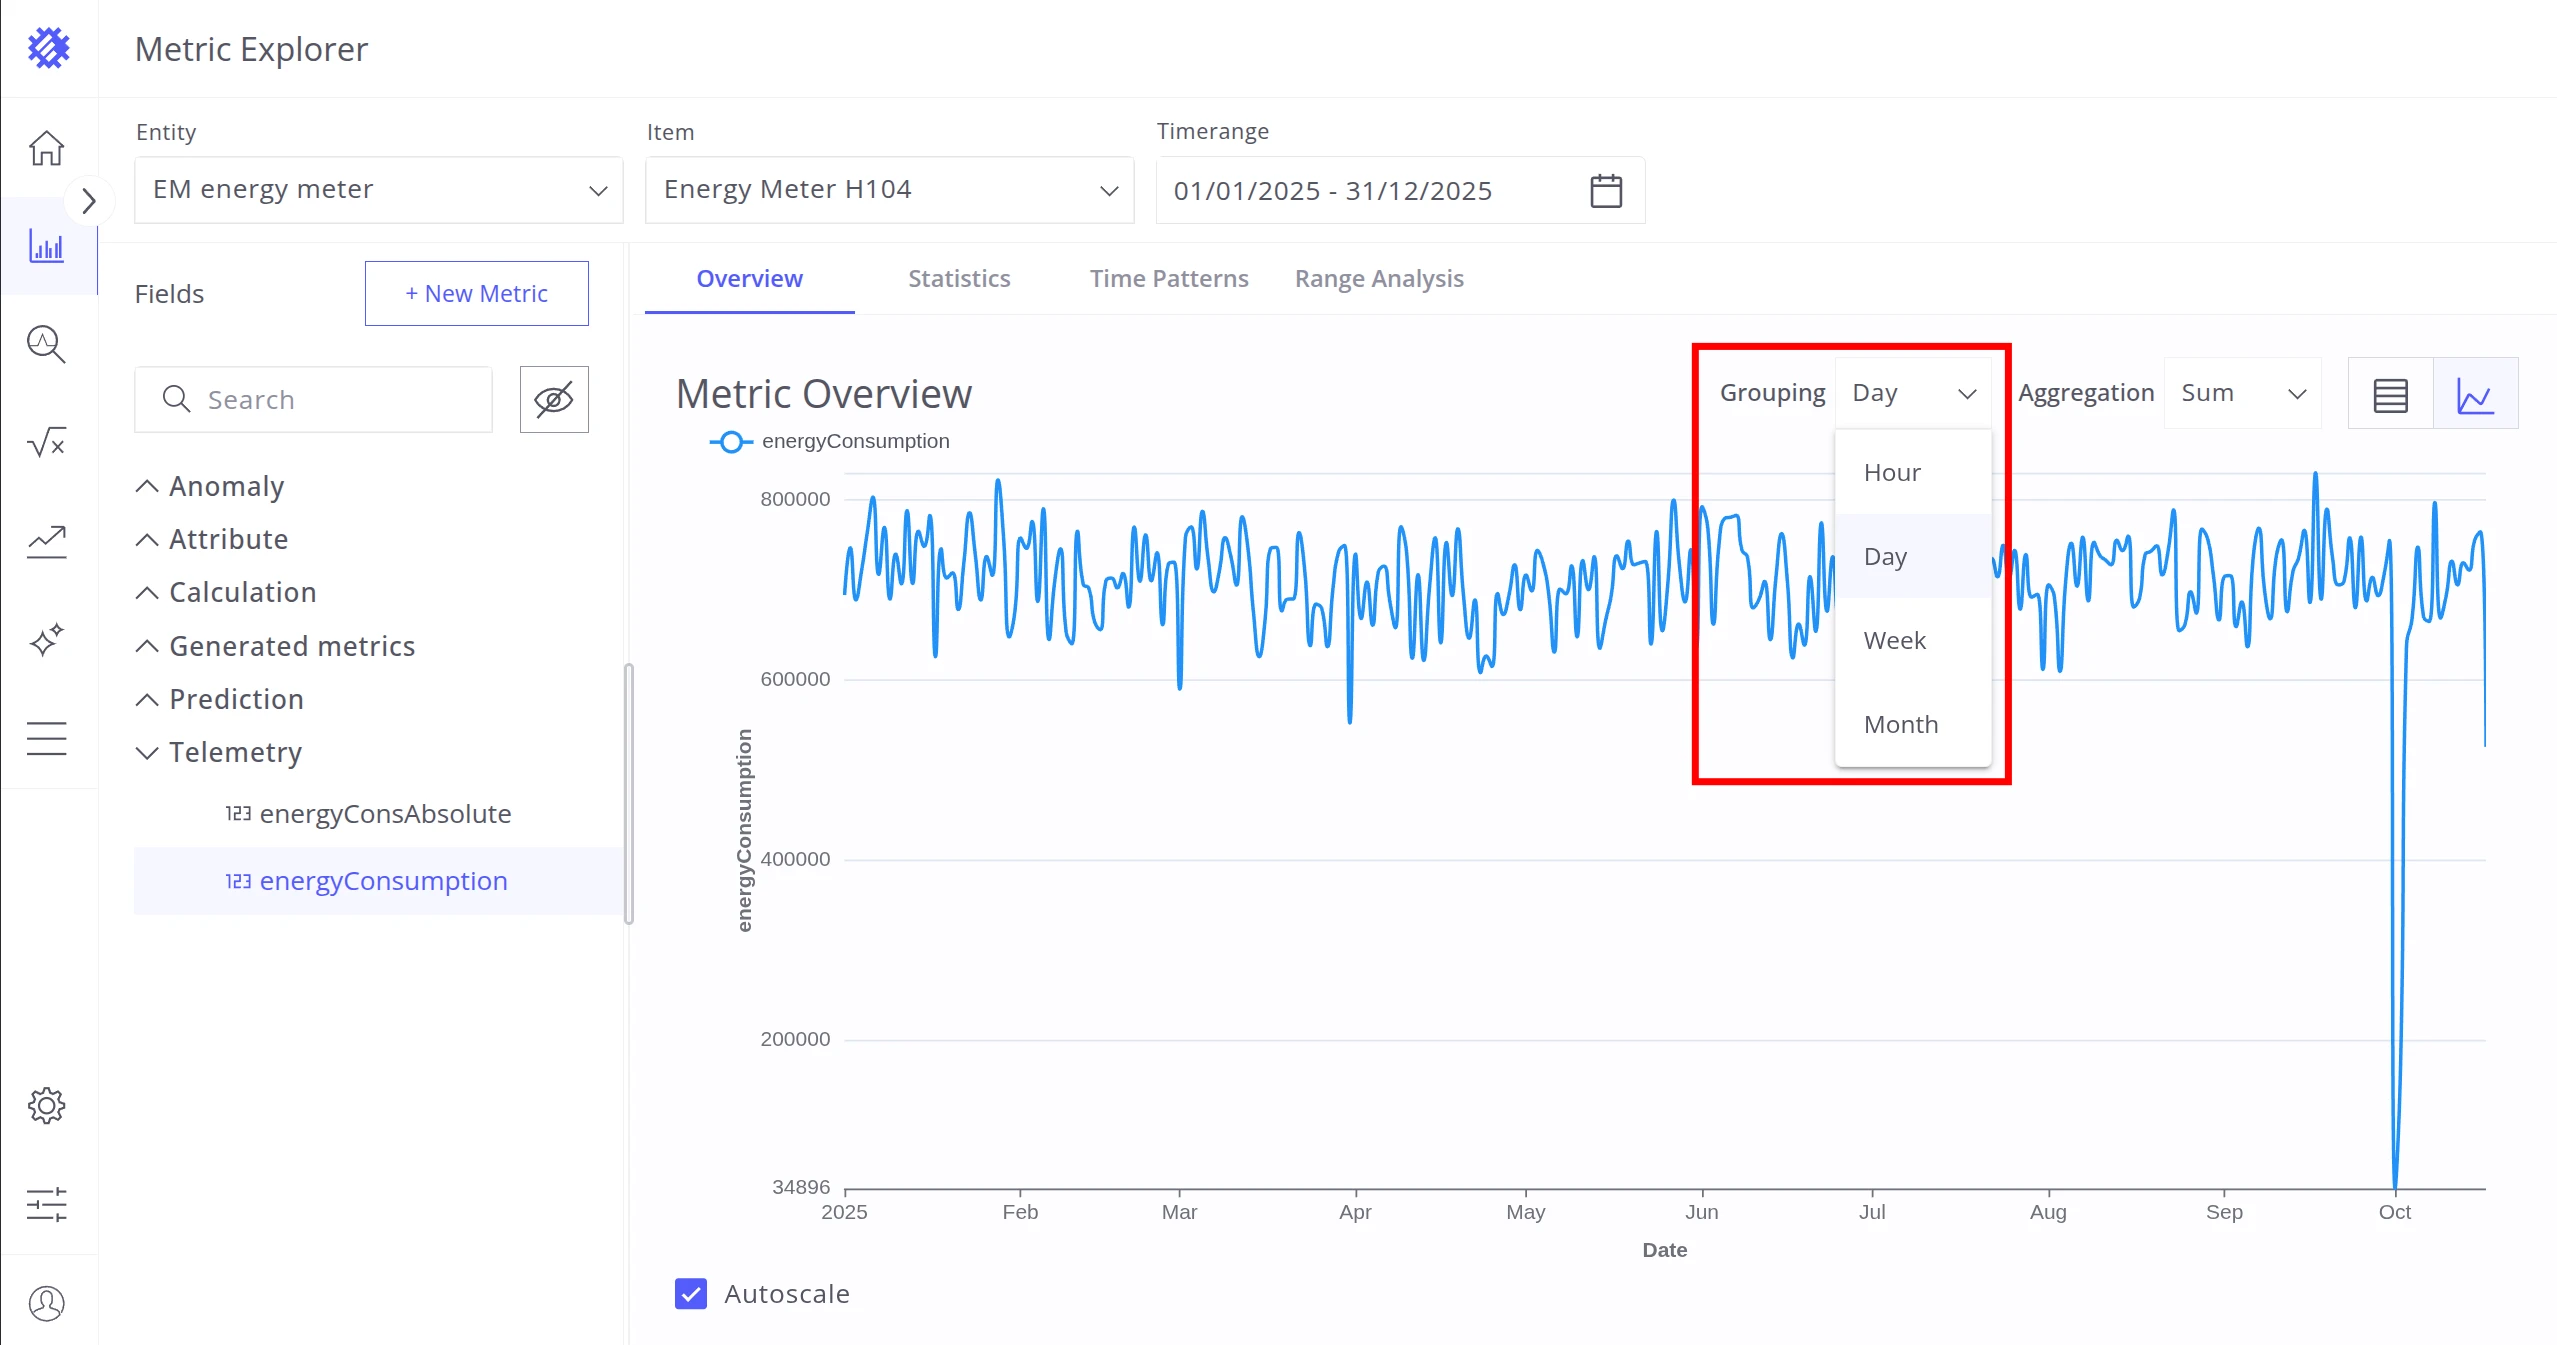
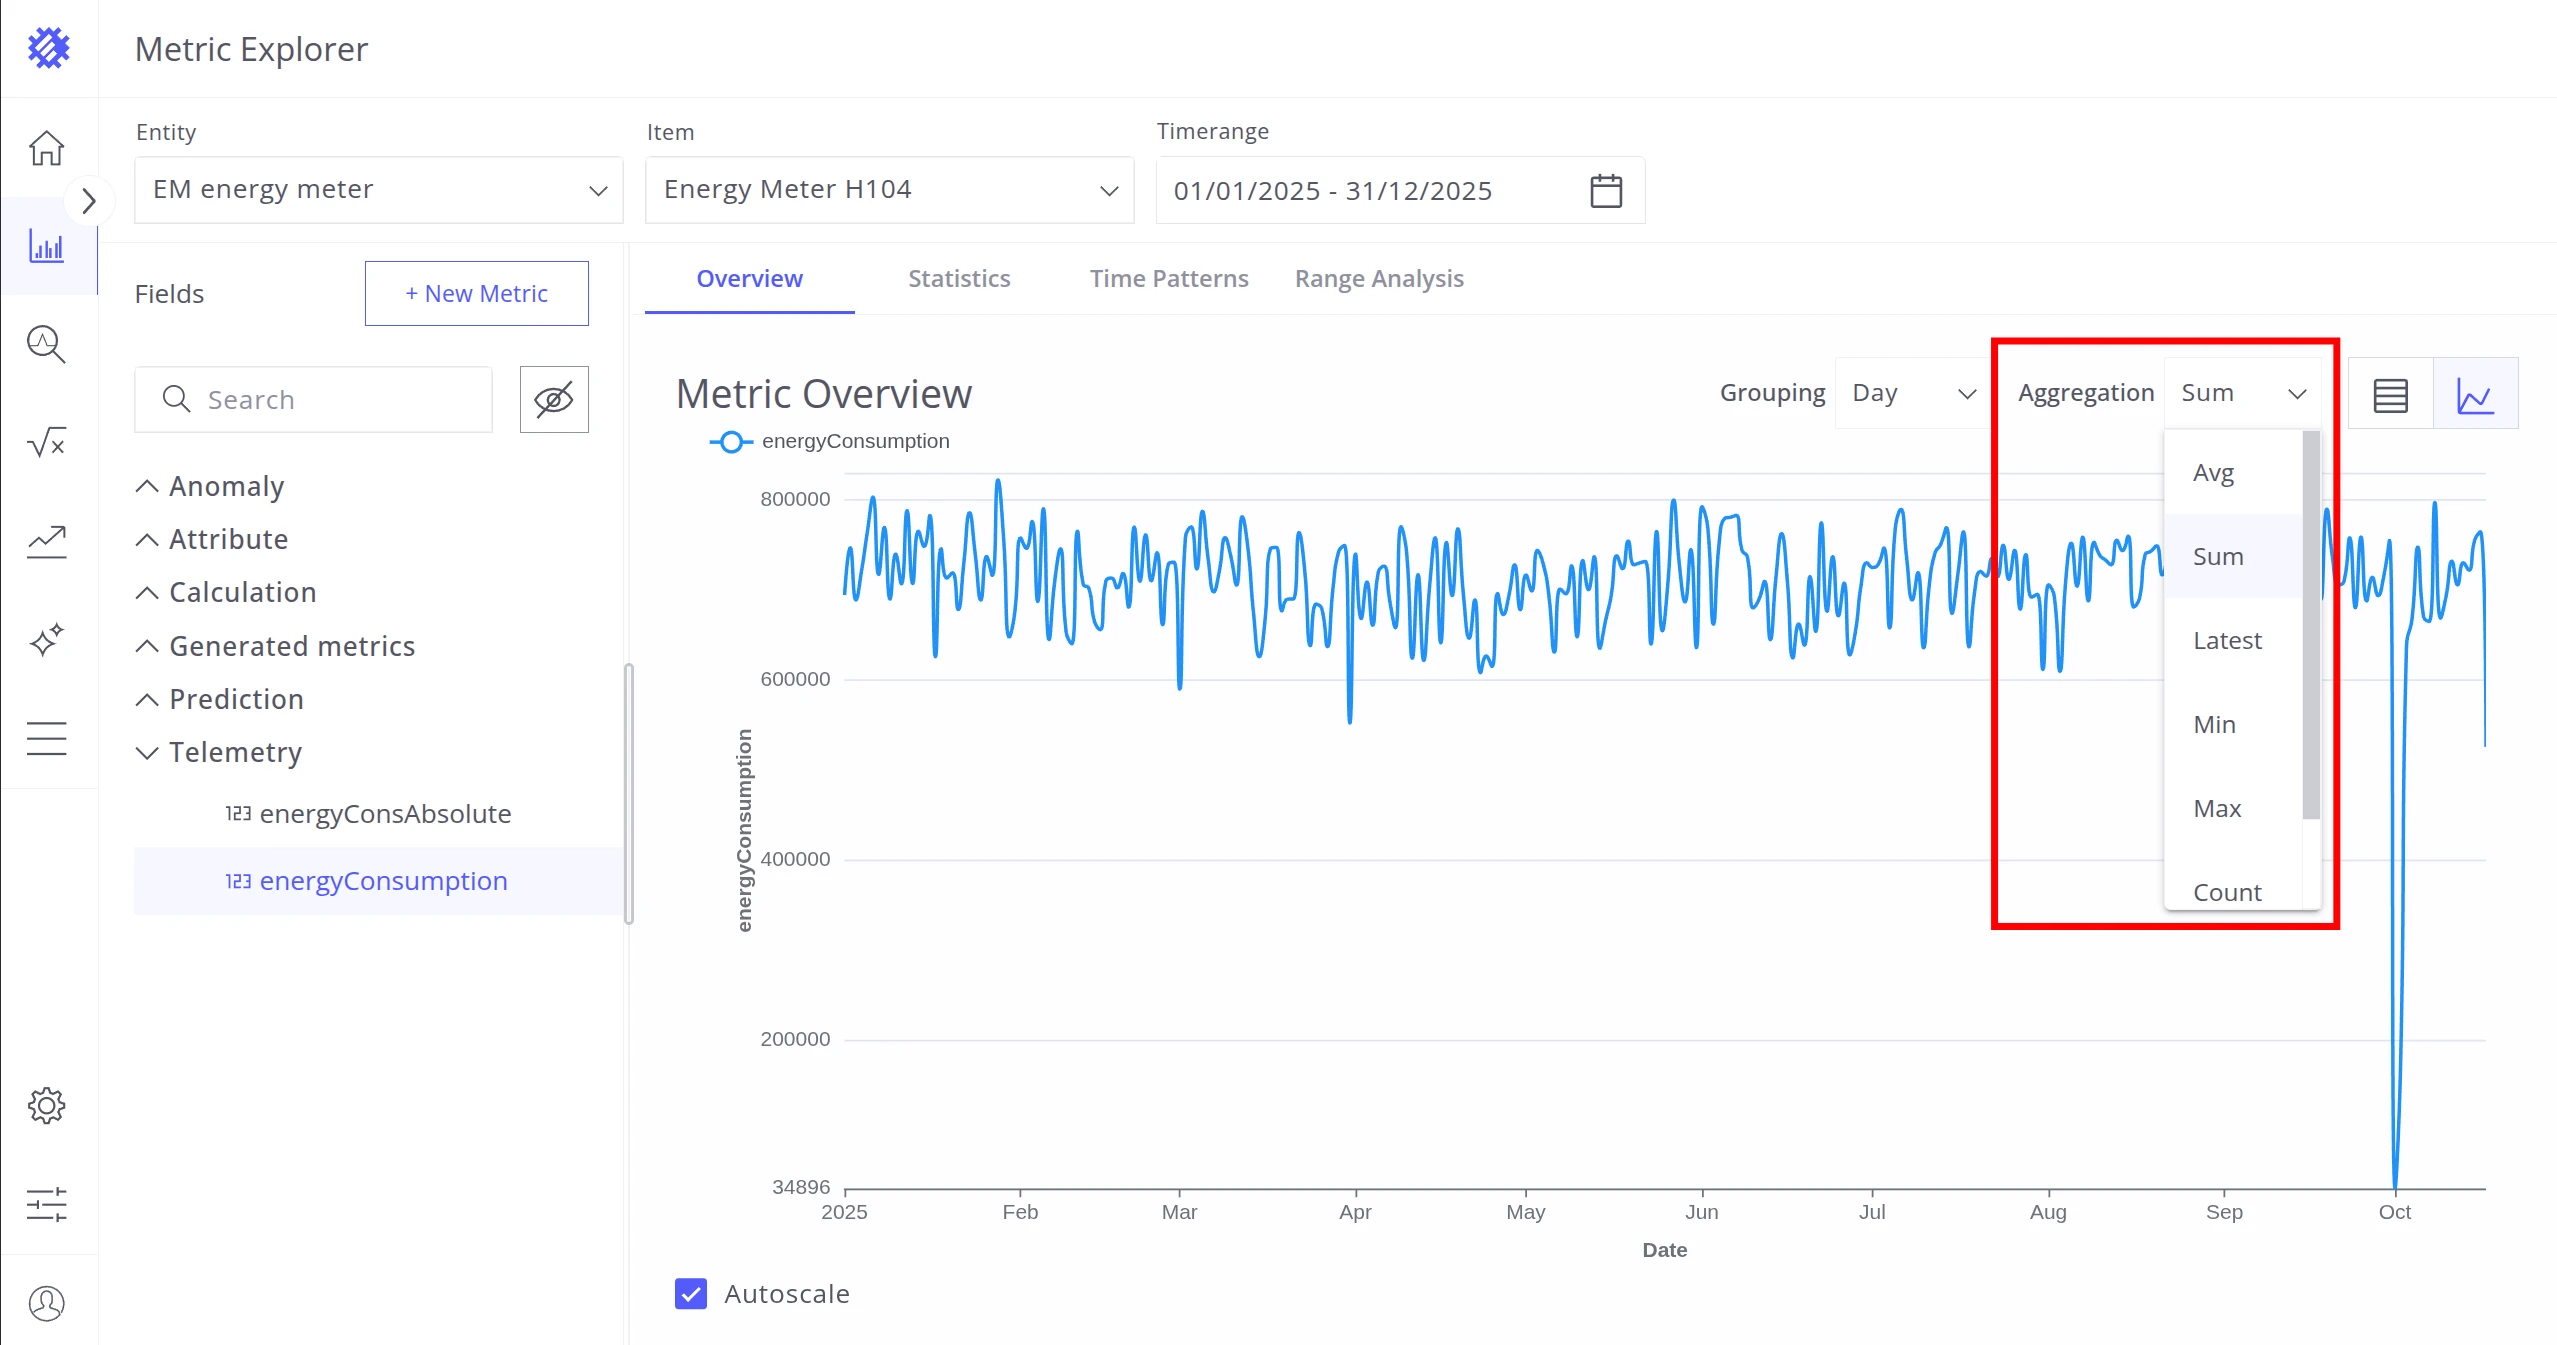
- Configure the grouping unit and aggregation method.
Statistics Tab
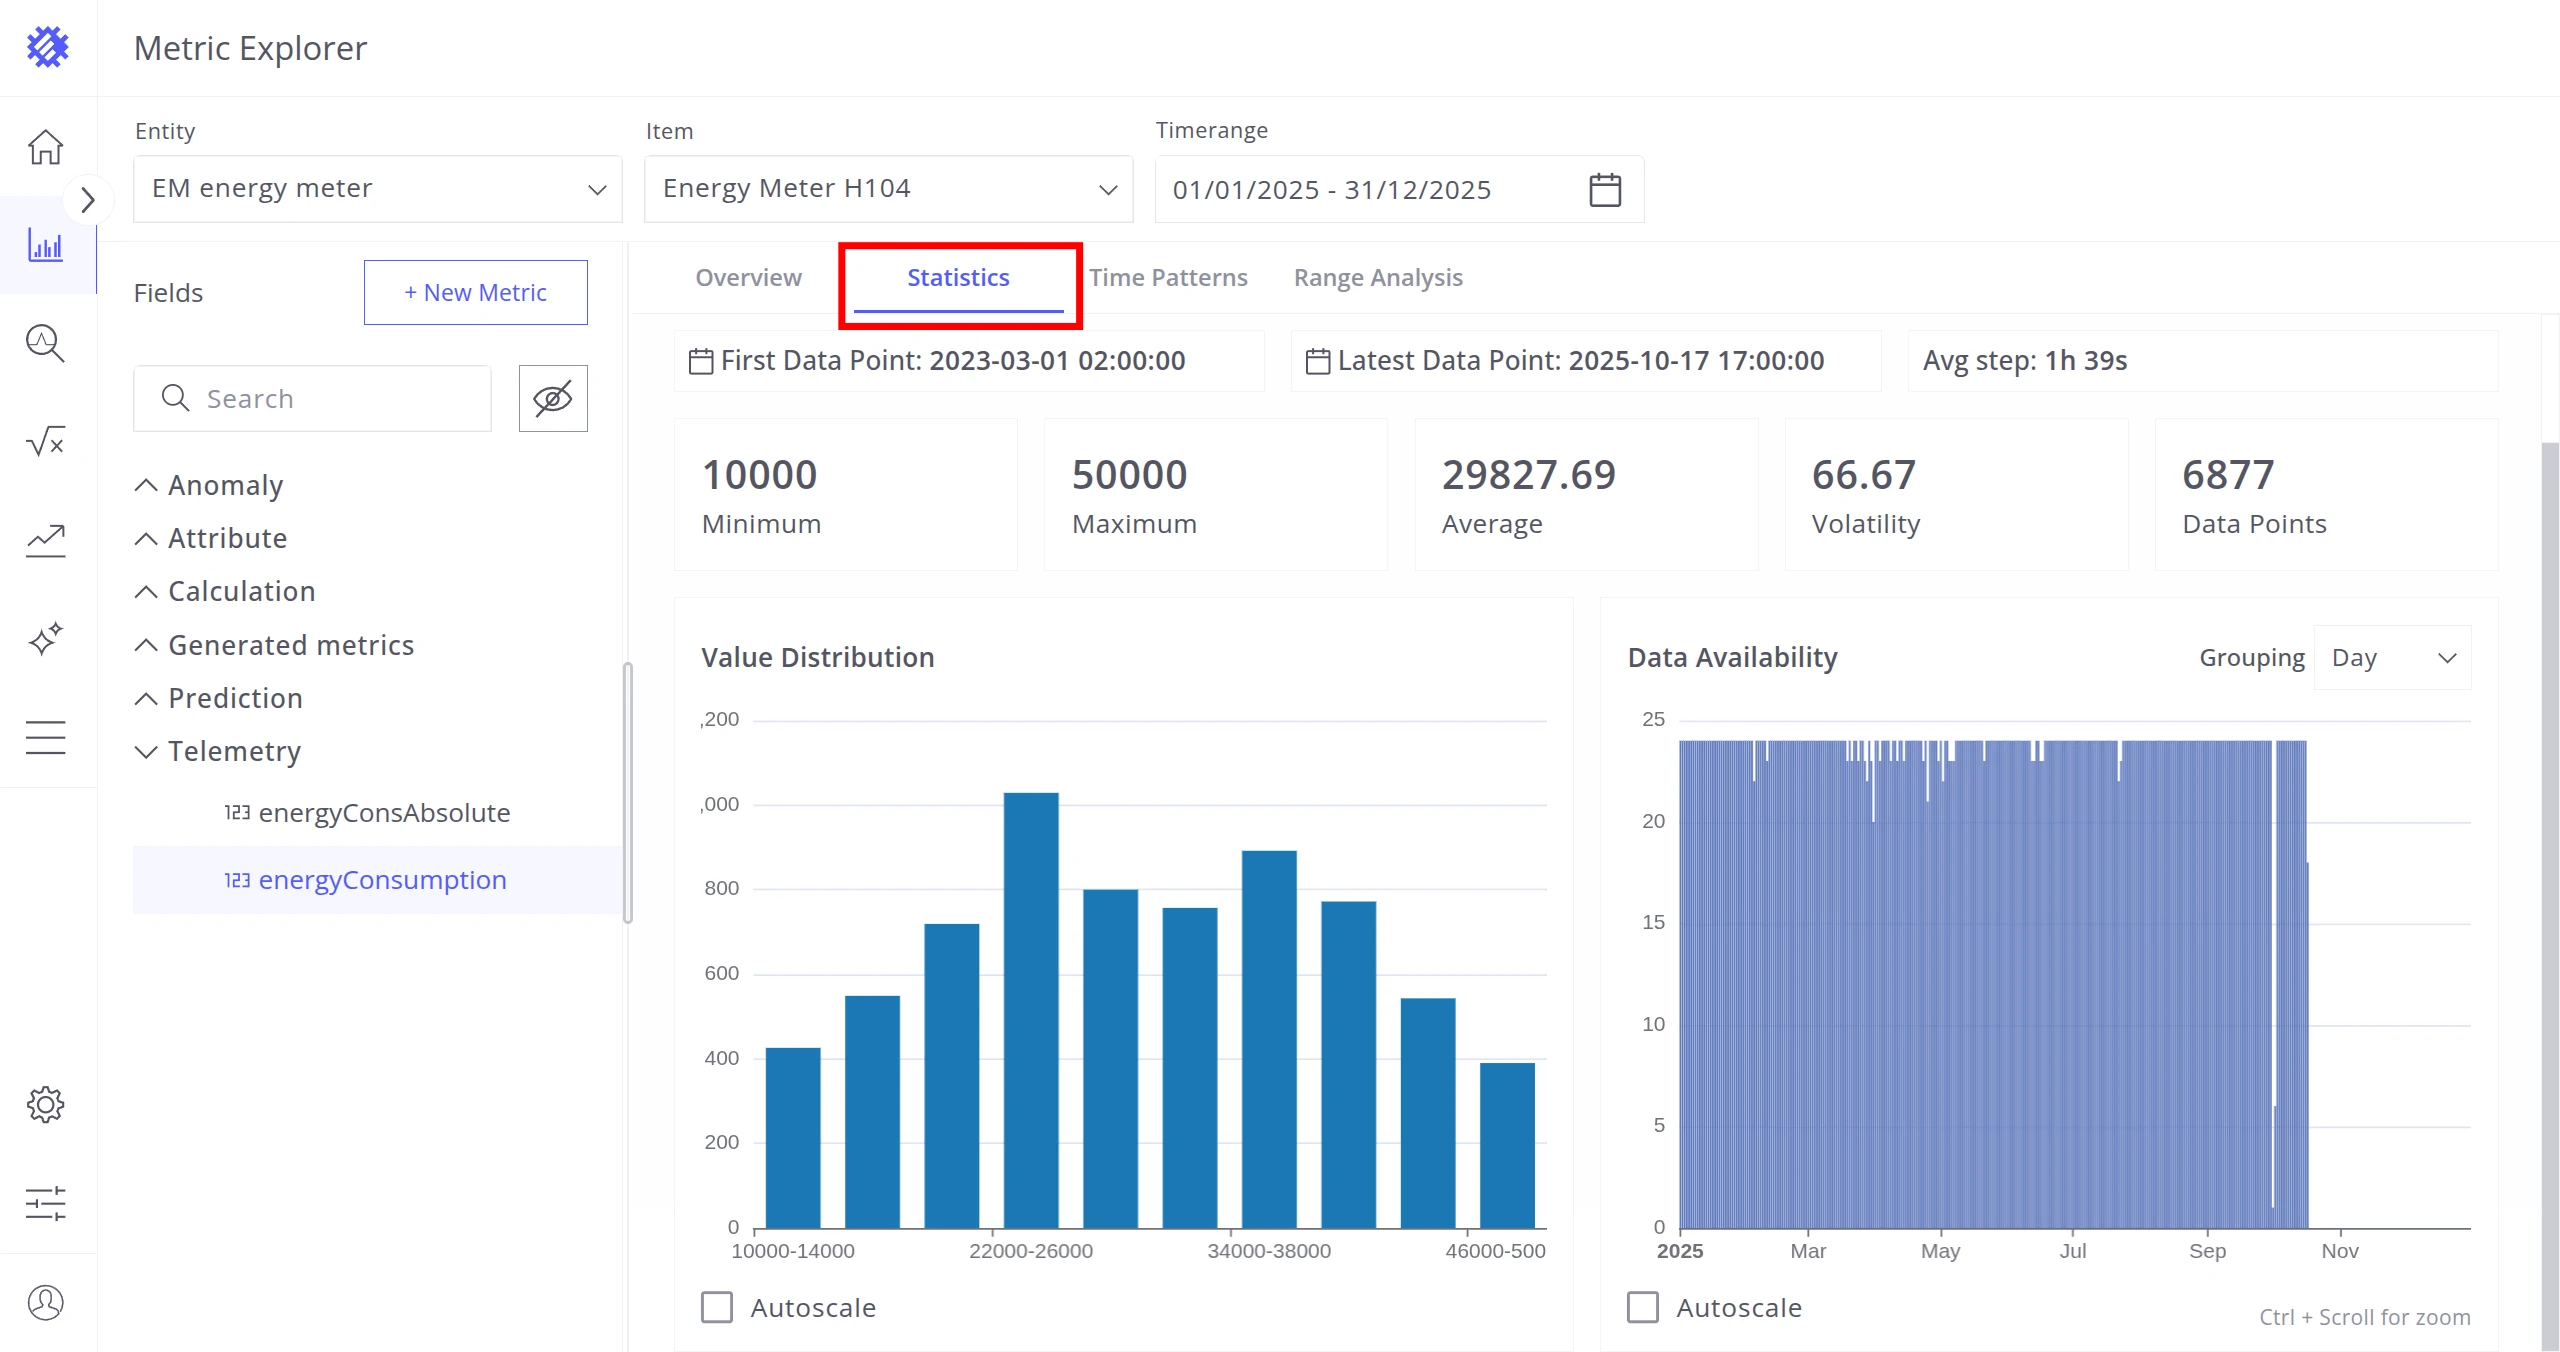
Section titled “Statistics Tab”Displays fundamental statistics for the selected telemetry within the timerange:
| Metric | Description |
|---|---|
| First Data Point | Earliest available record. |
| Latest Data Point | Most recent record. |
| Avg Step | Average time gap between consecutive data points. |
| Minimum / Maximum / Average | Basic numeric summaries. |
| Volatility | Frequency of telemetry value changes. |
| Value Distribution | Histogram showing the spread of values. |
| Data Availability | Histogram showing the temporal distribution of data points. |
Time Patterns Tab
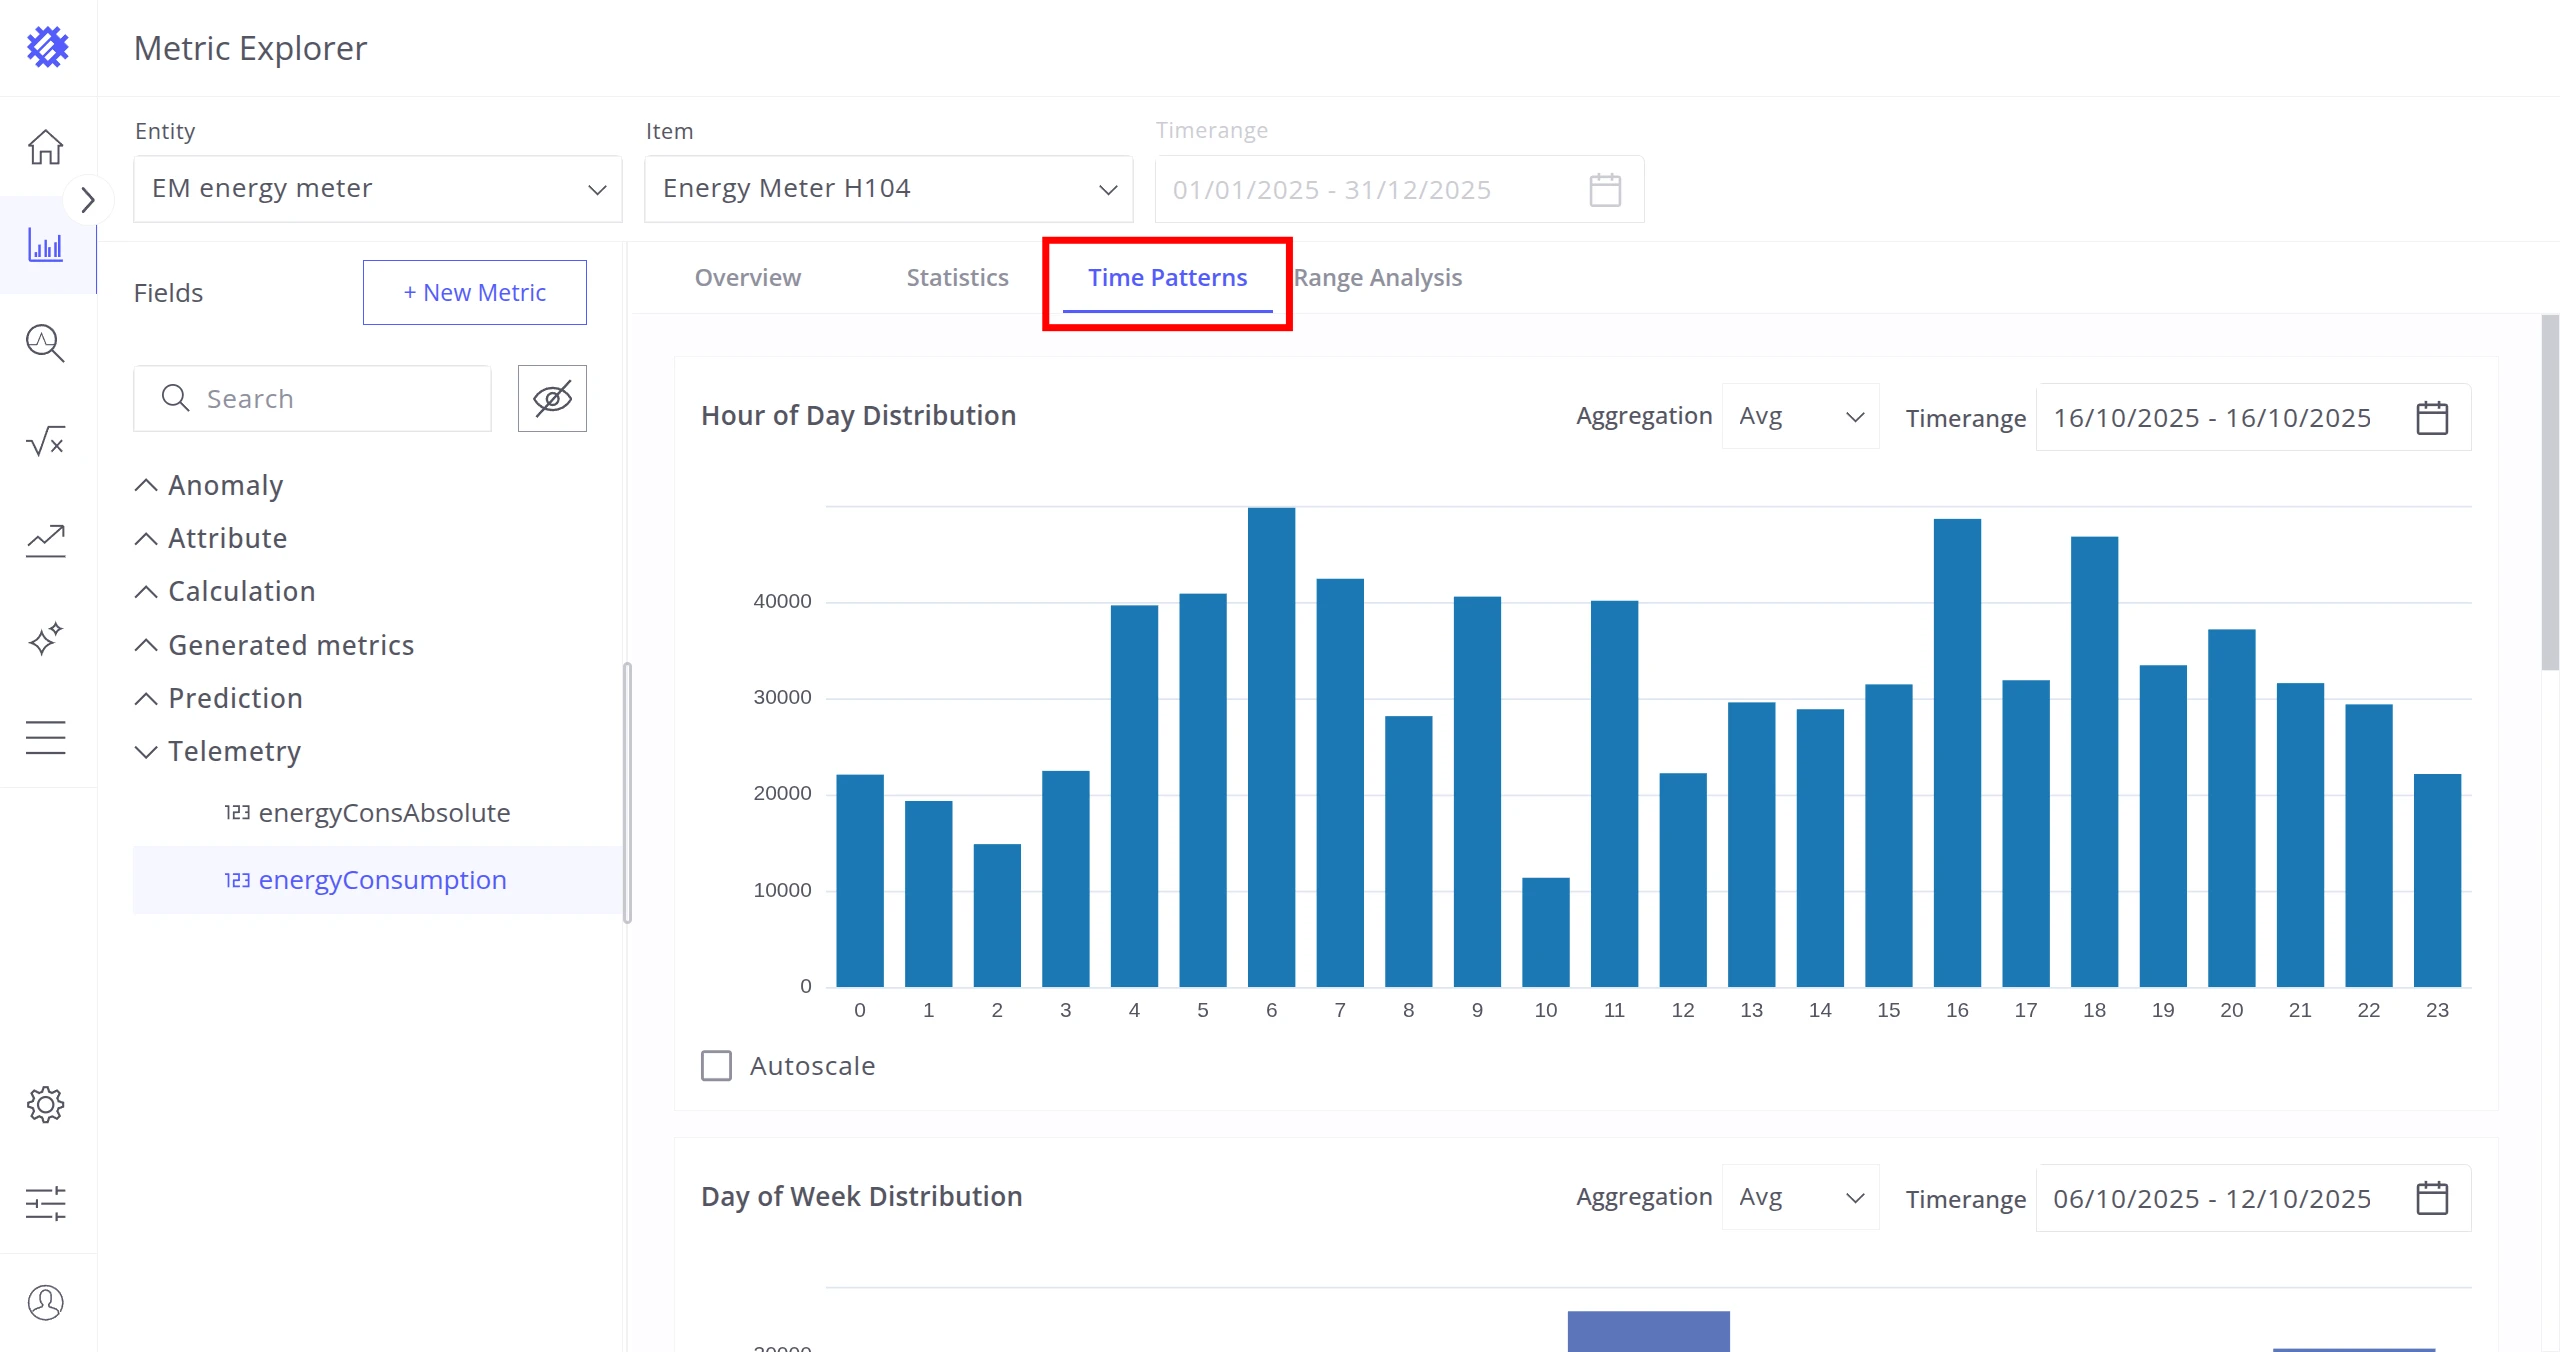
Section titled “Time Patterns Tab”Analyzes telemetry behavior across time-based aggregations. Each chart can have an independent timerange and aggregation setting.
| Chart | Description |
|---|---|
| Hour of Day Distribution | Aggregation by hour of day. |
| Day of Week Distribution | Aggregation by day of week. |
| Weekly Heatmap | Aggregation by hour and weekday. |
| Calendar Heatmap | Aggregation by calendar days. |
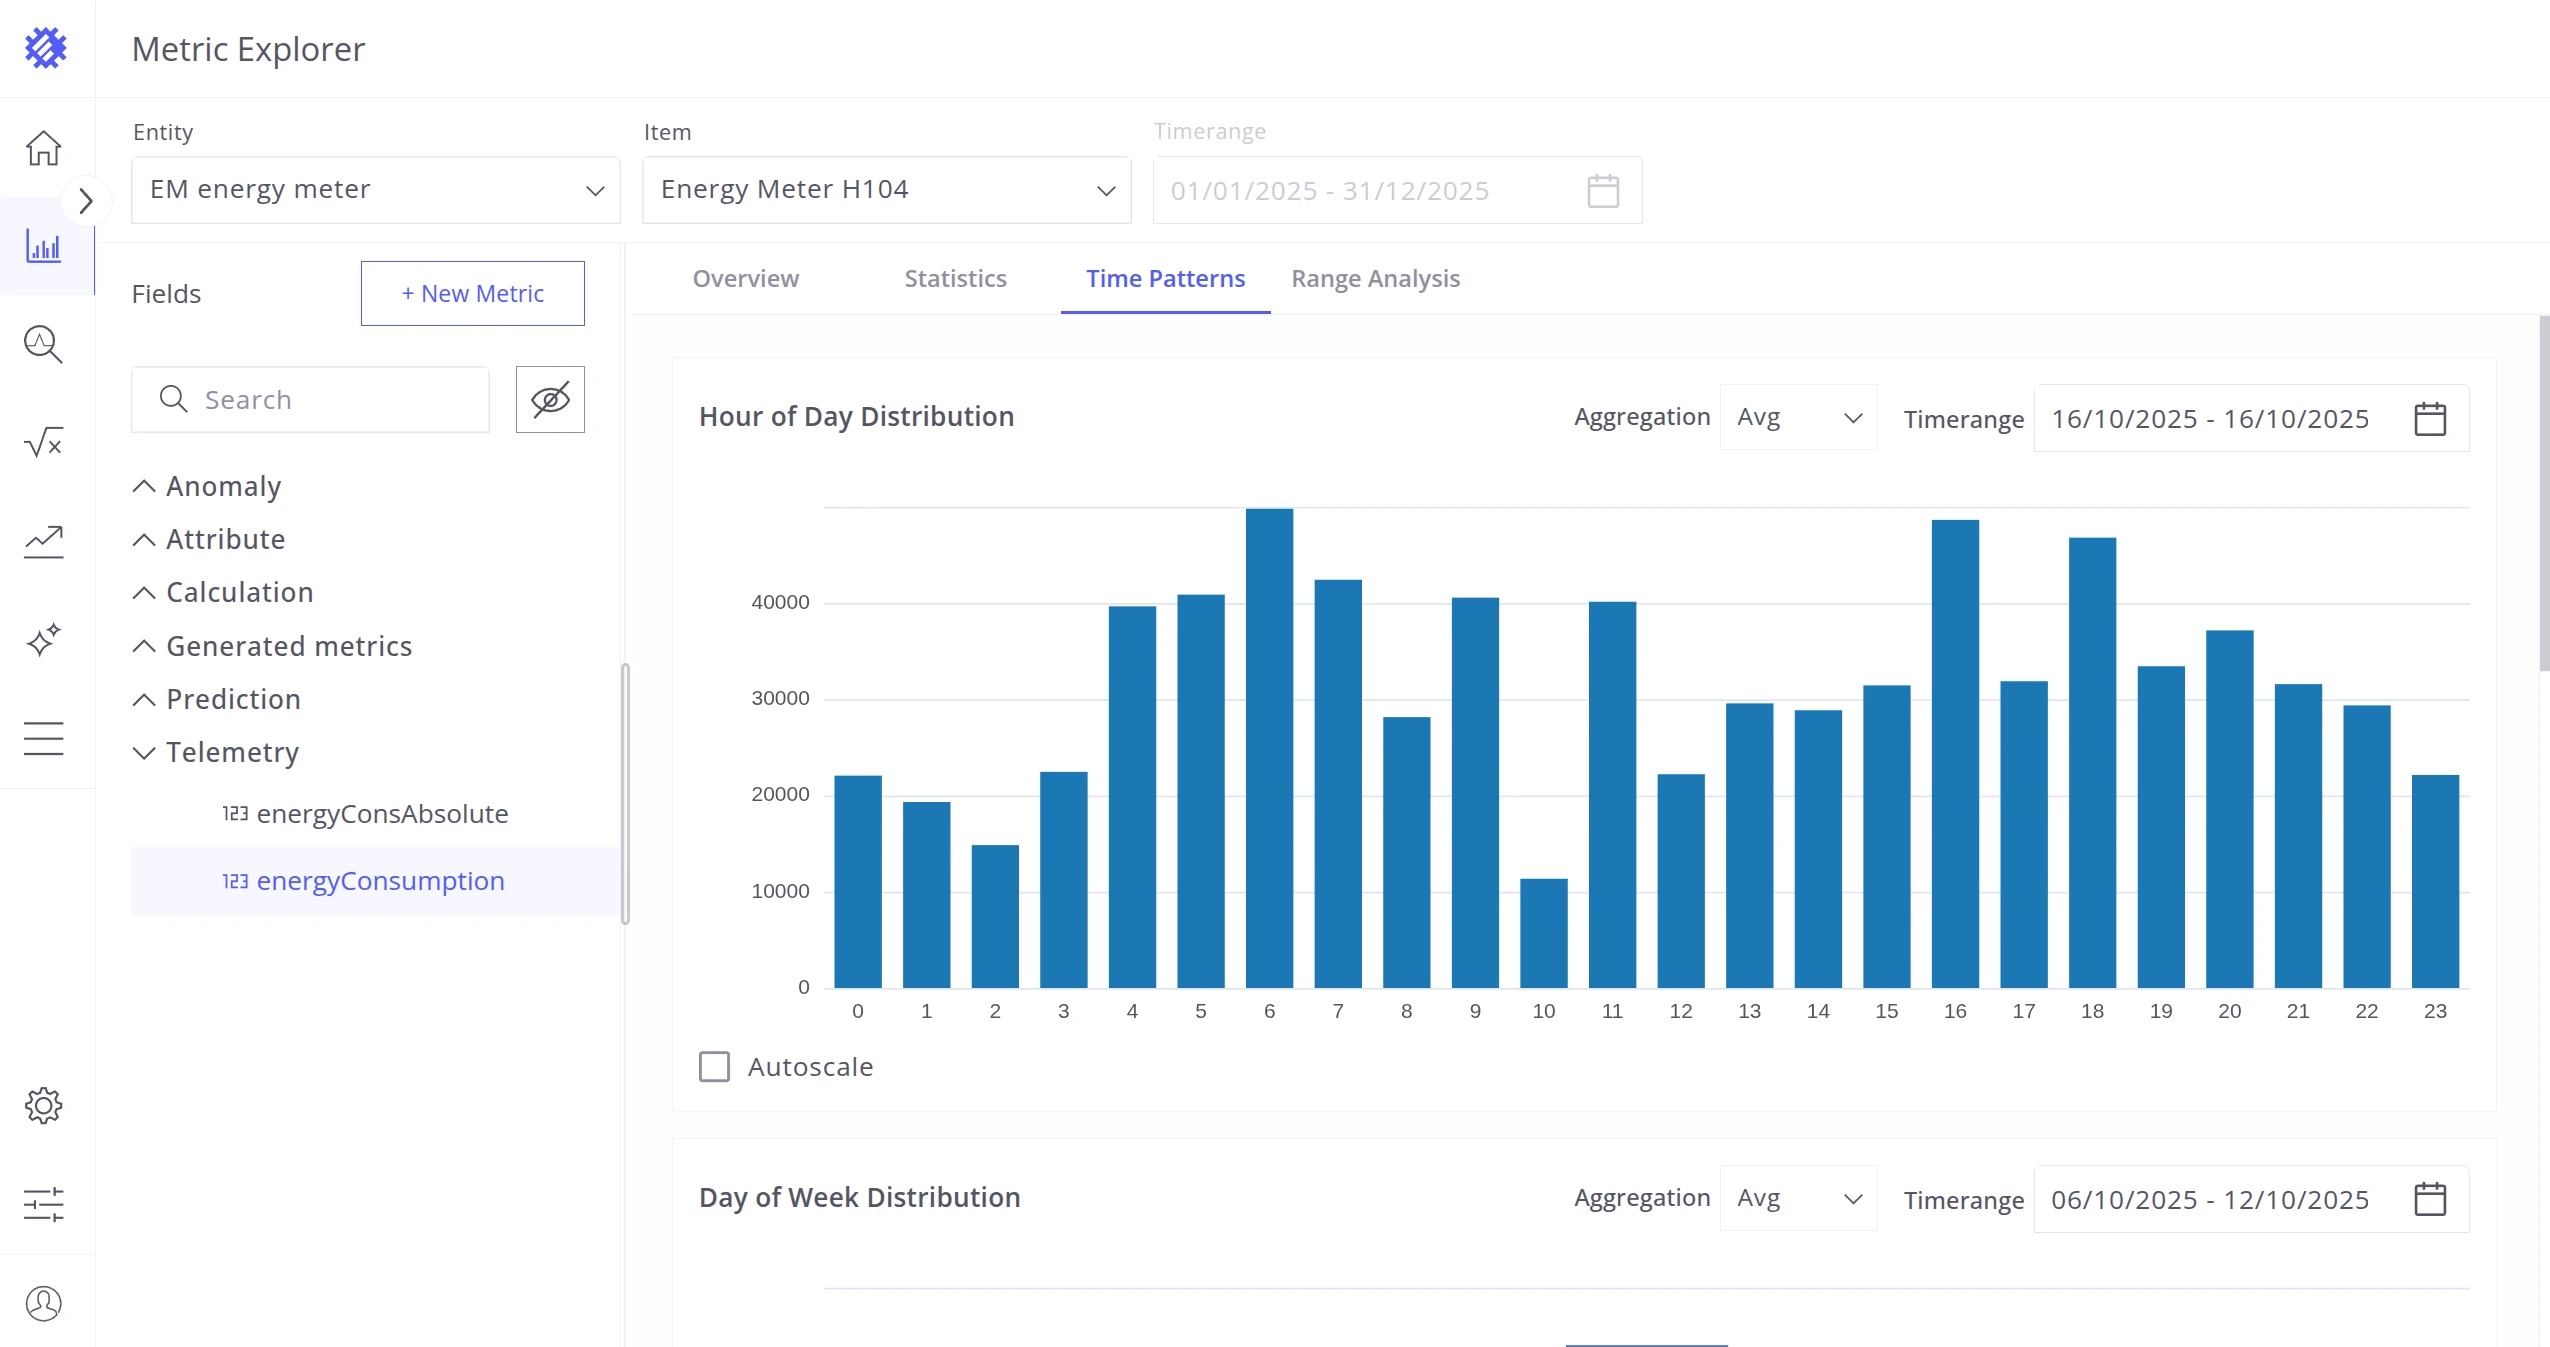
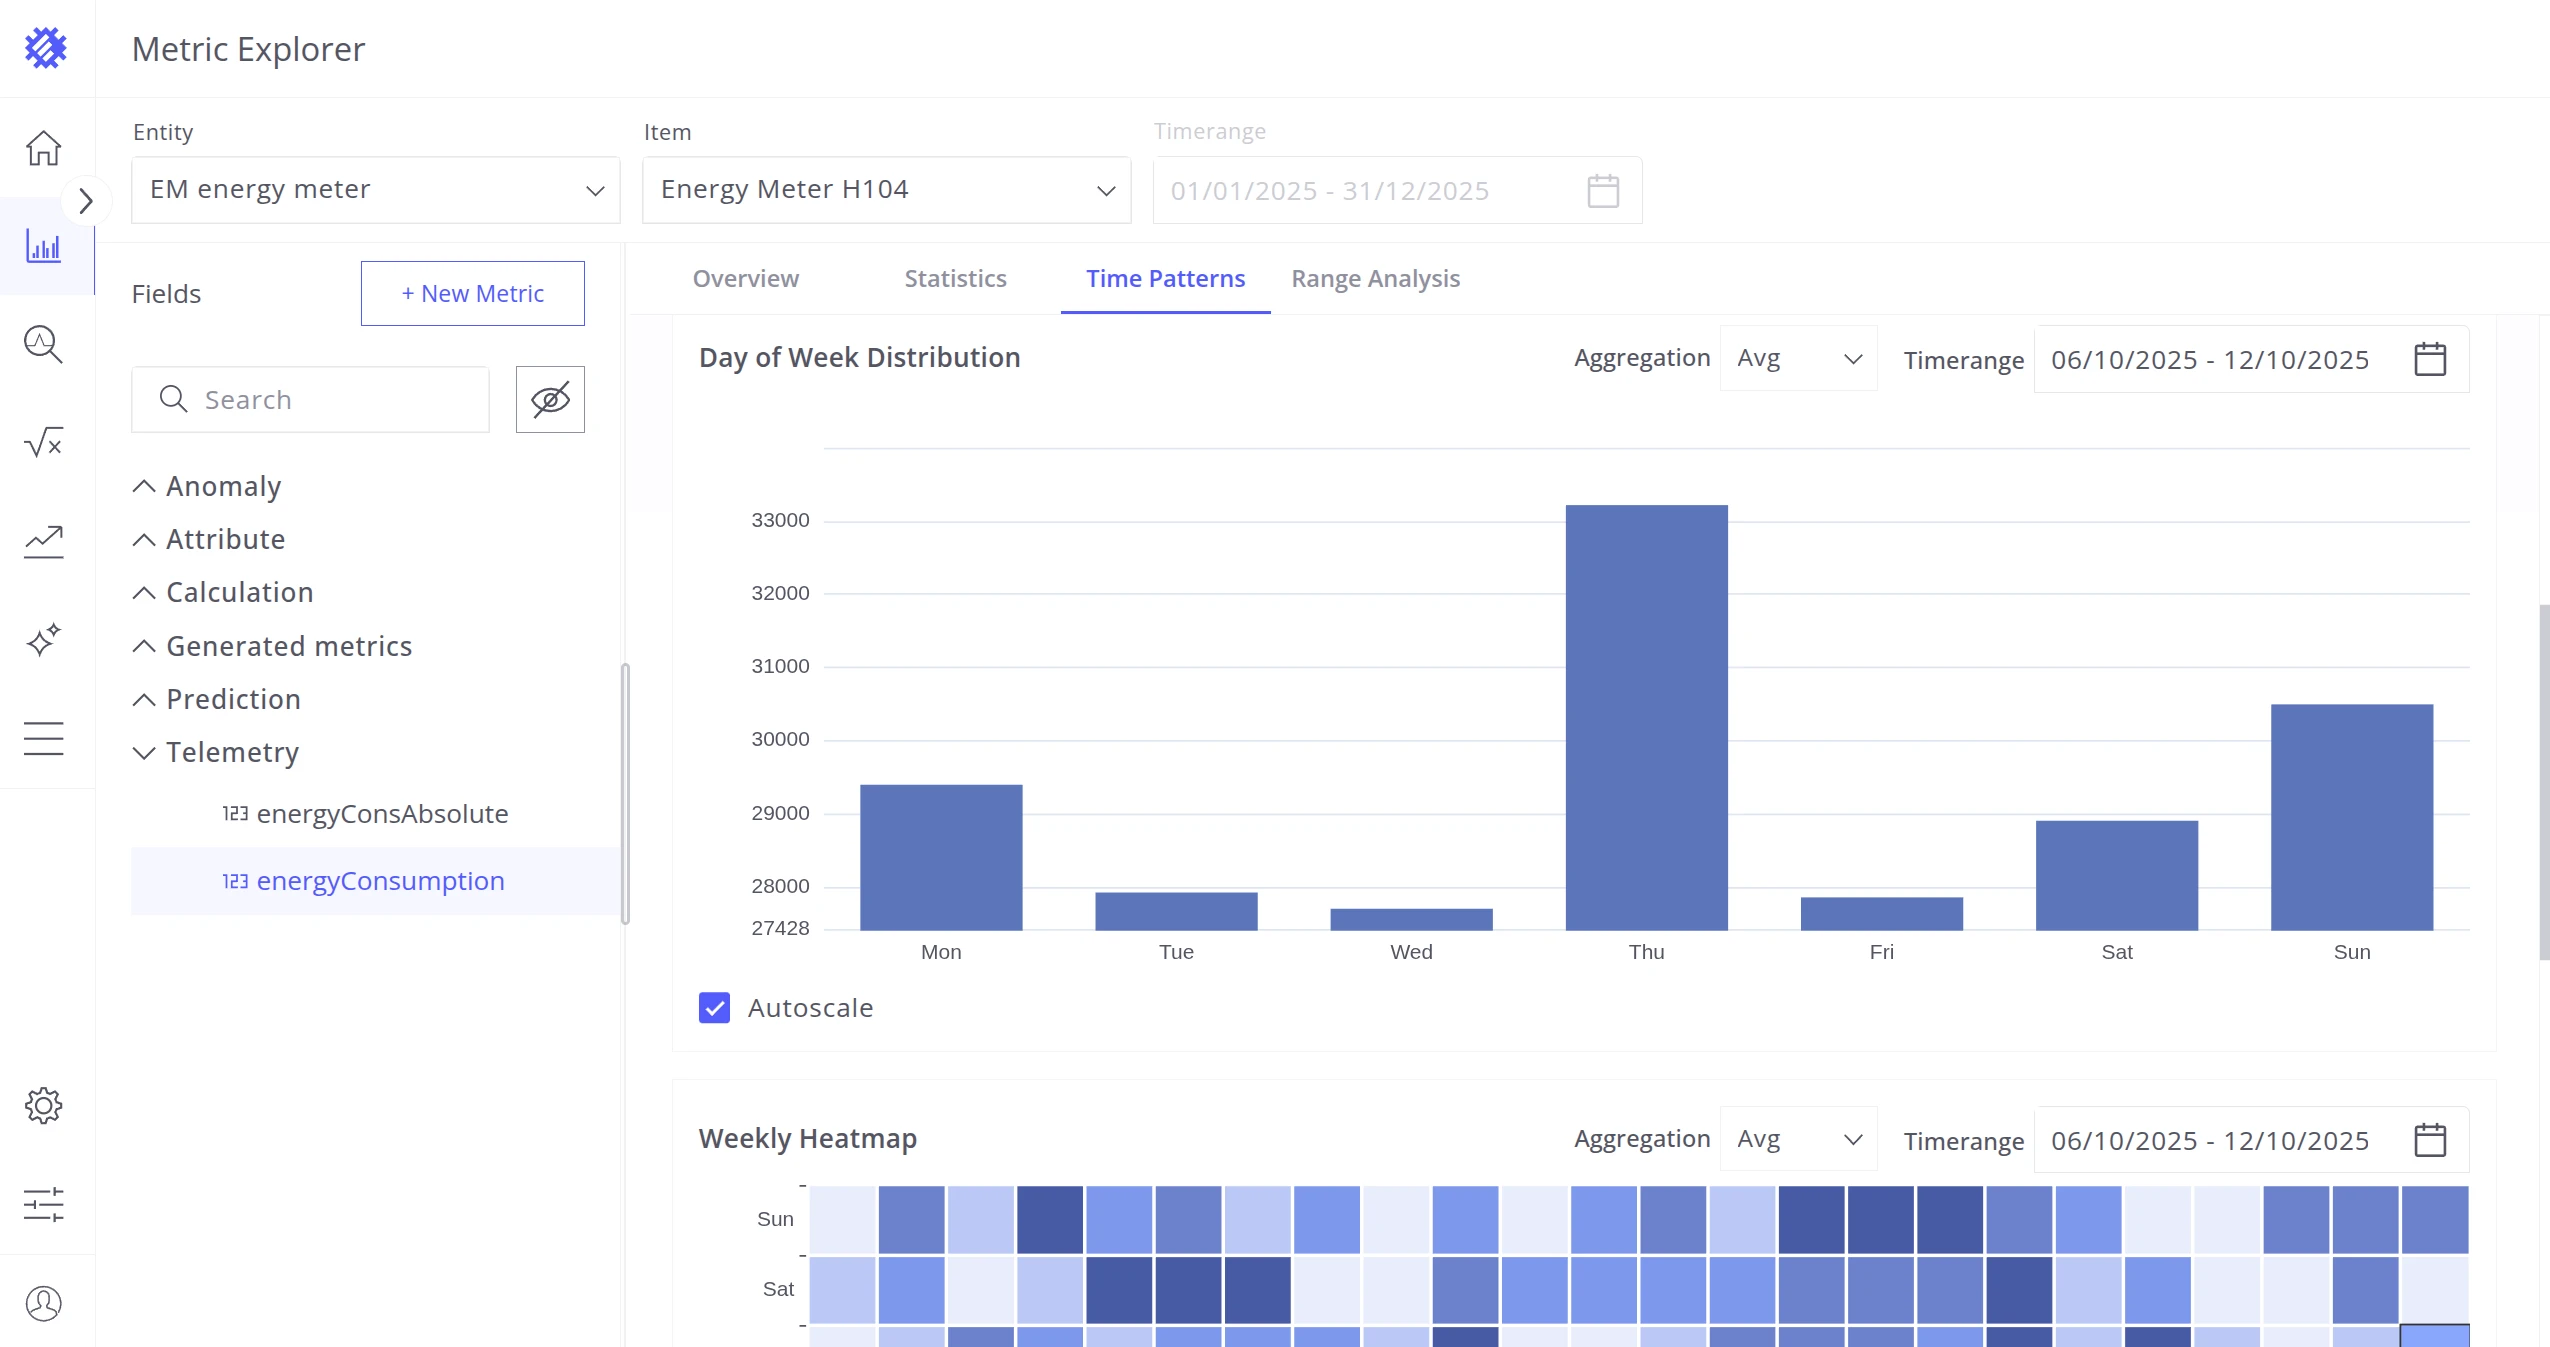
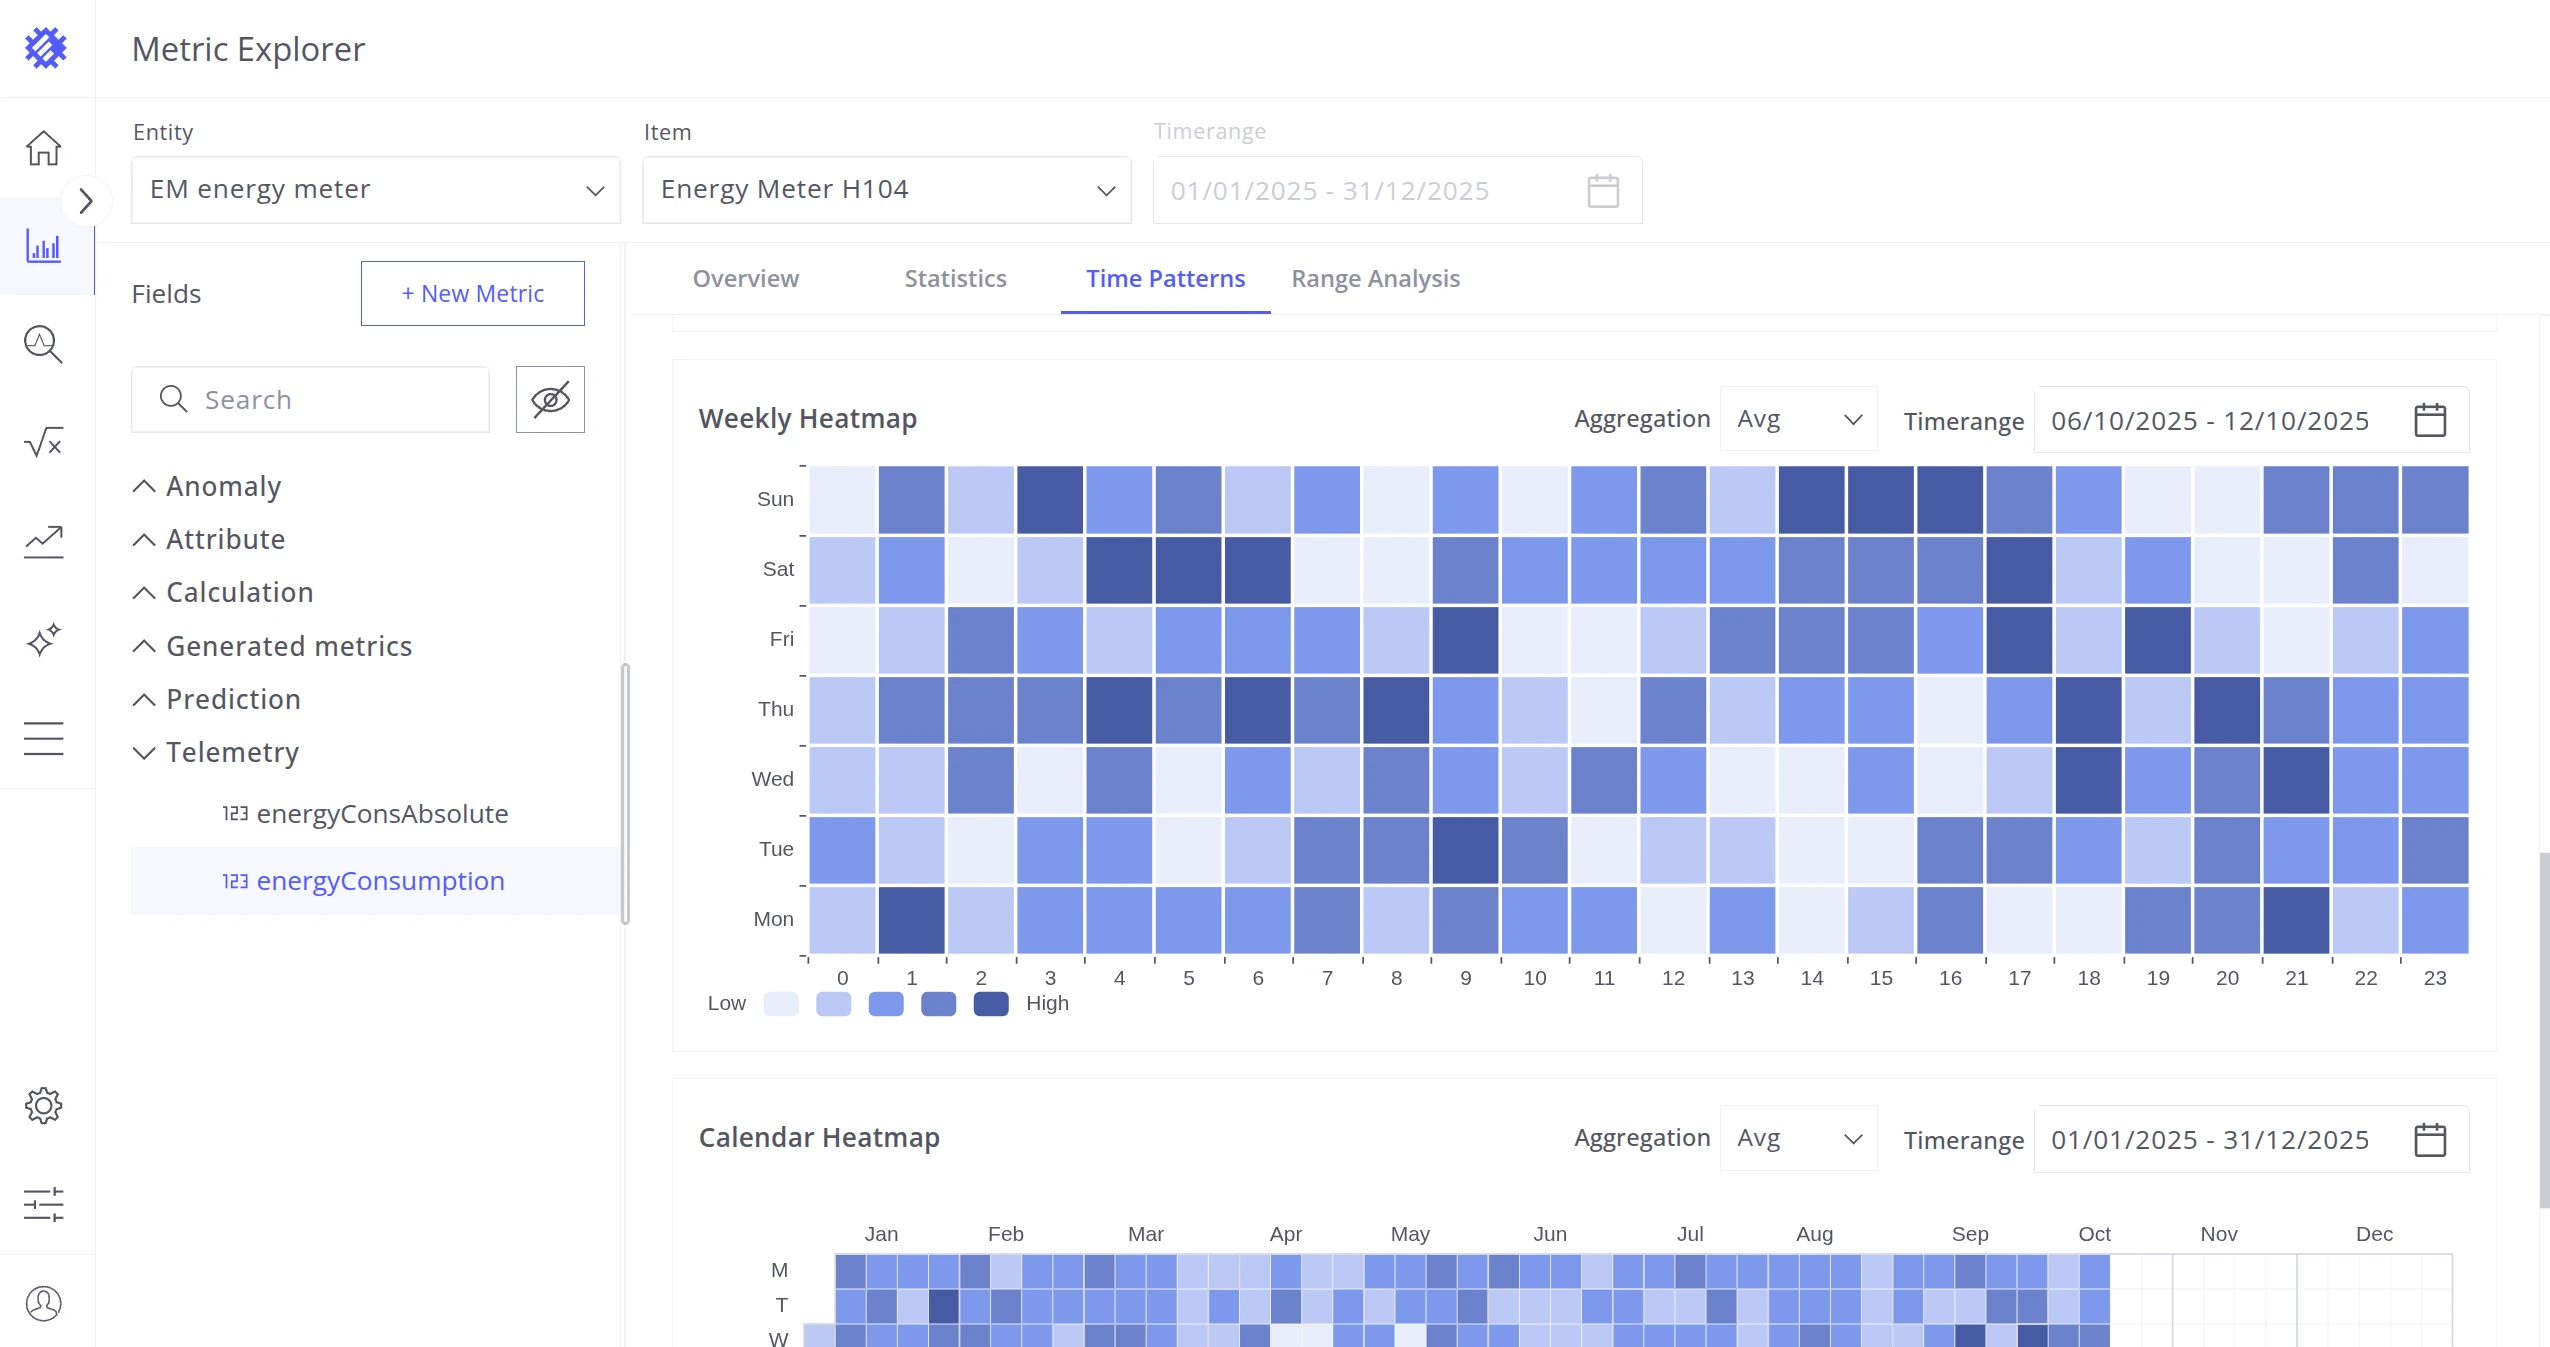
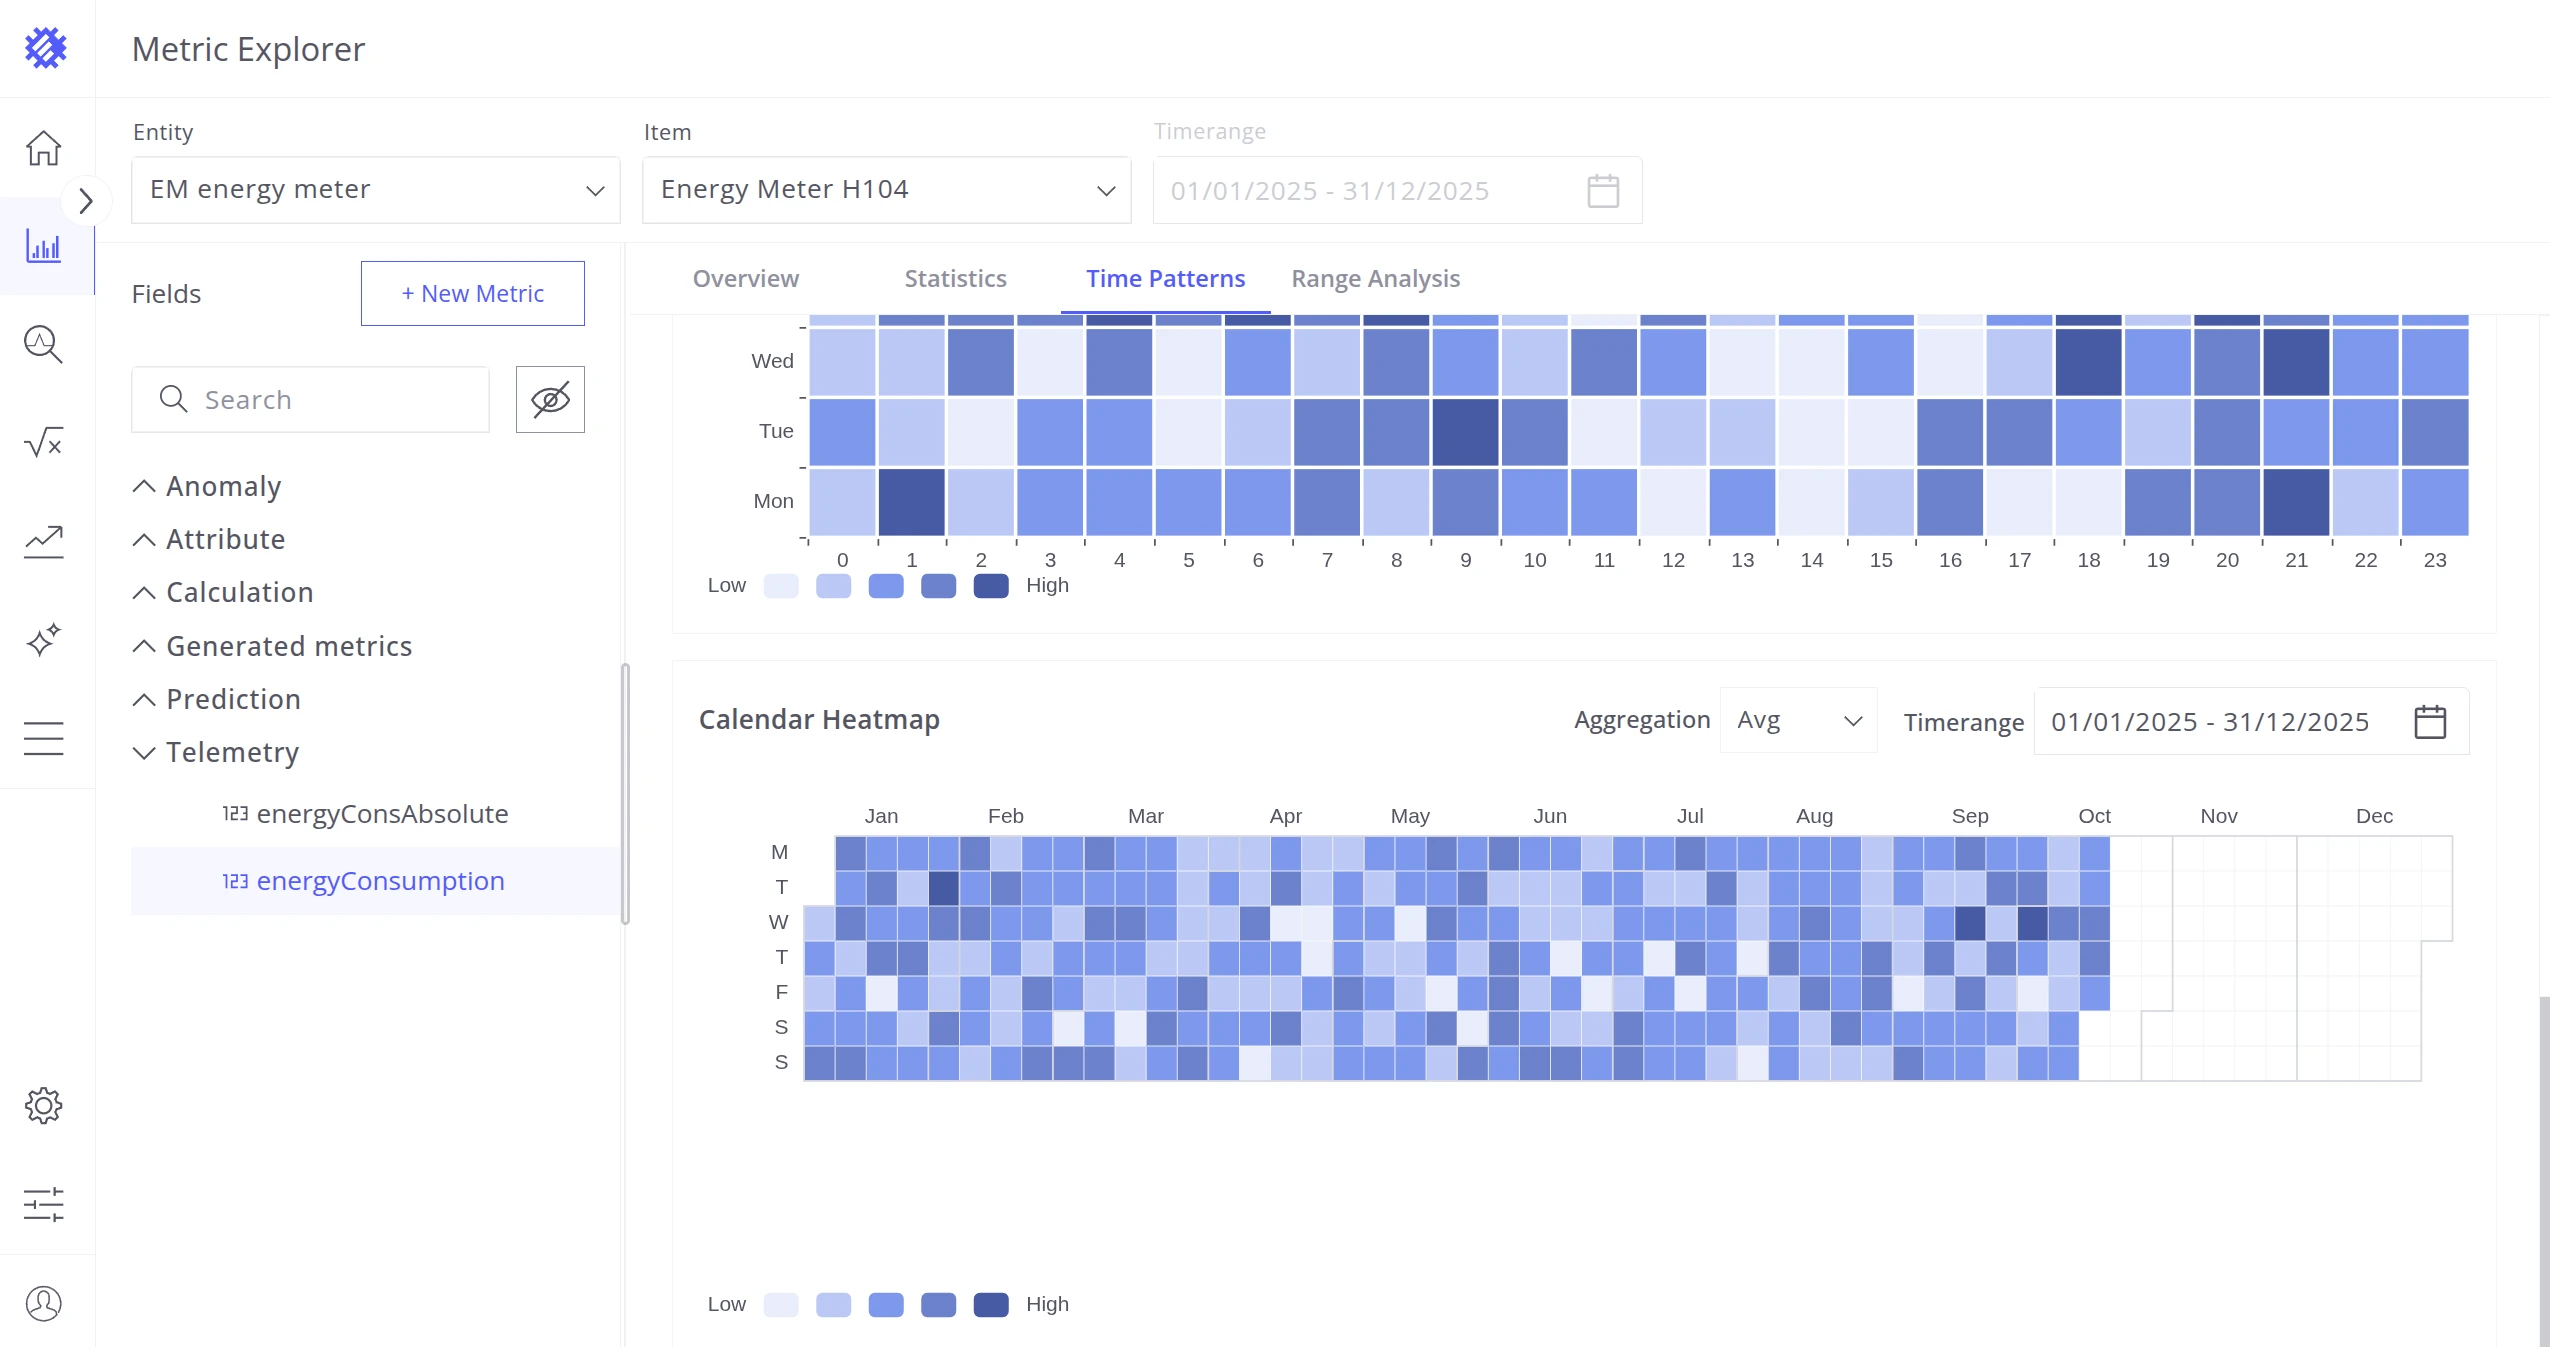
Range Analysis Tab
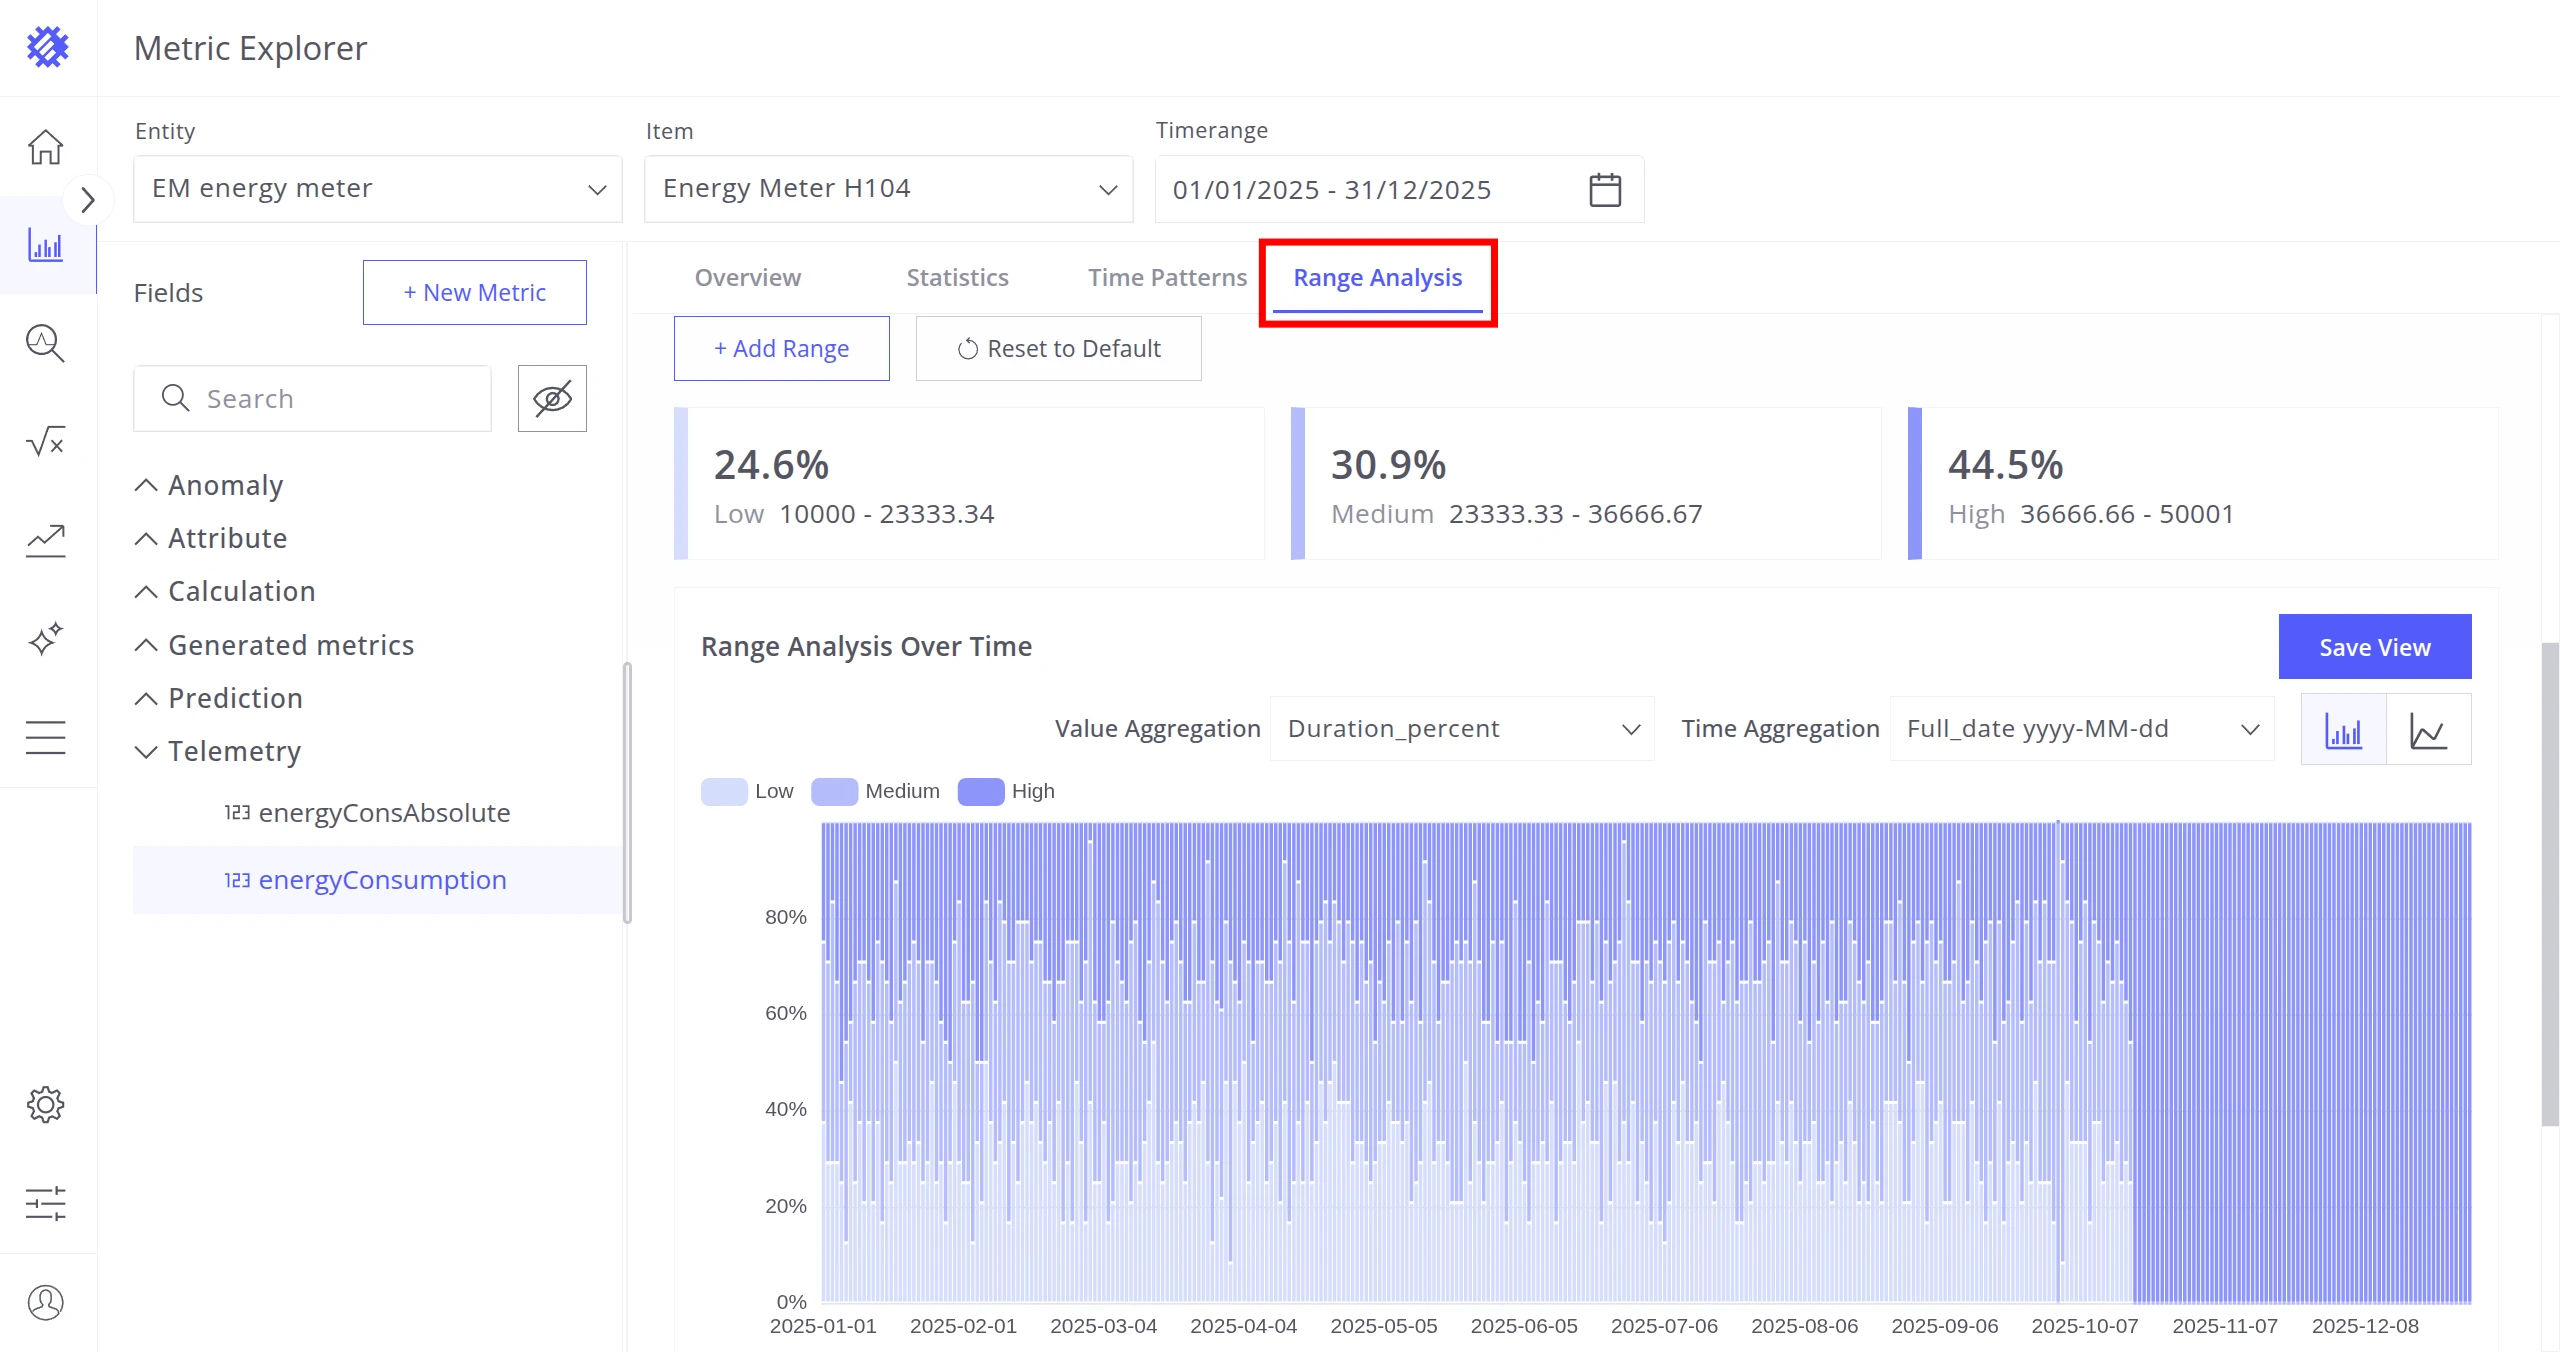
Section titled “Range Analysis Tab”Explores how long telemetry values stay within defined ranges. You define the ranges, and Trendz calculates duration and distribution statistics.
Setting up ranges:
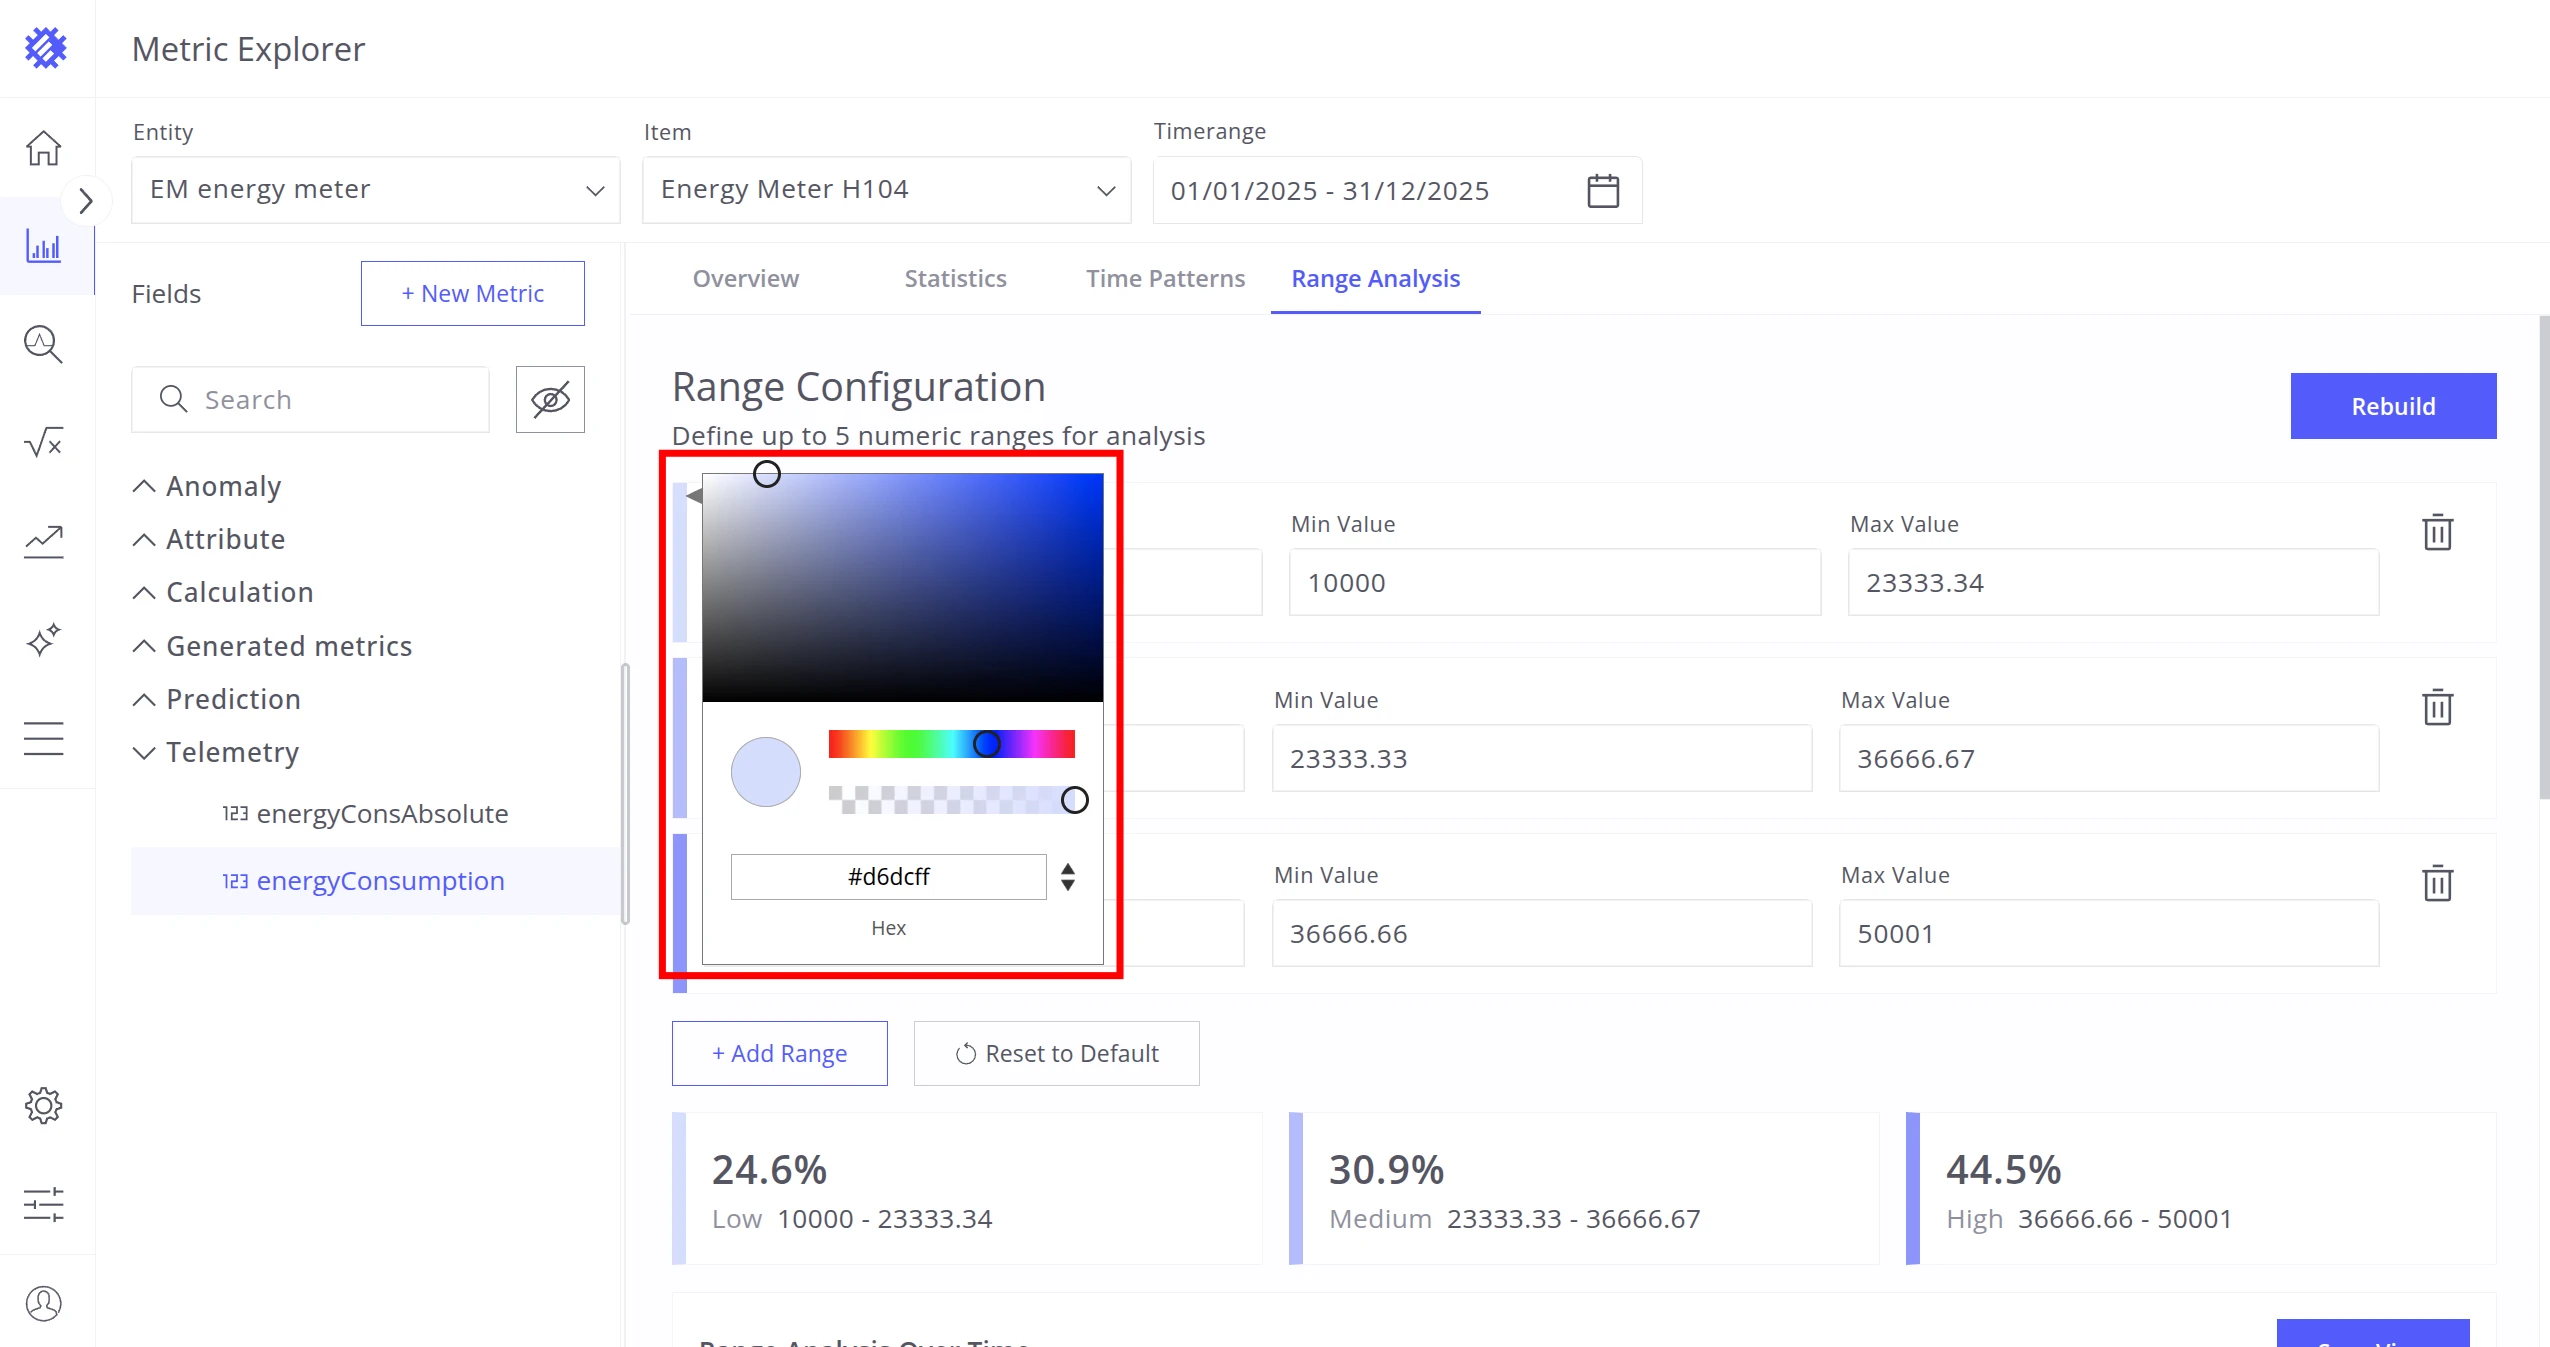
- Configure ranges with names, colors, and value limits.
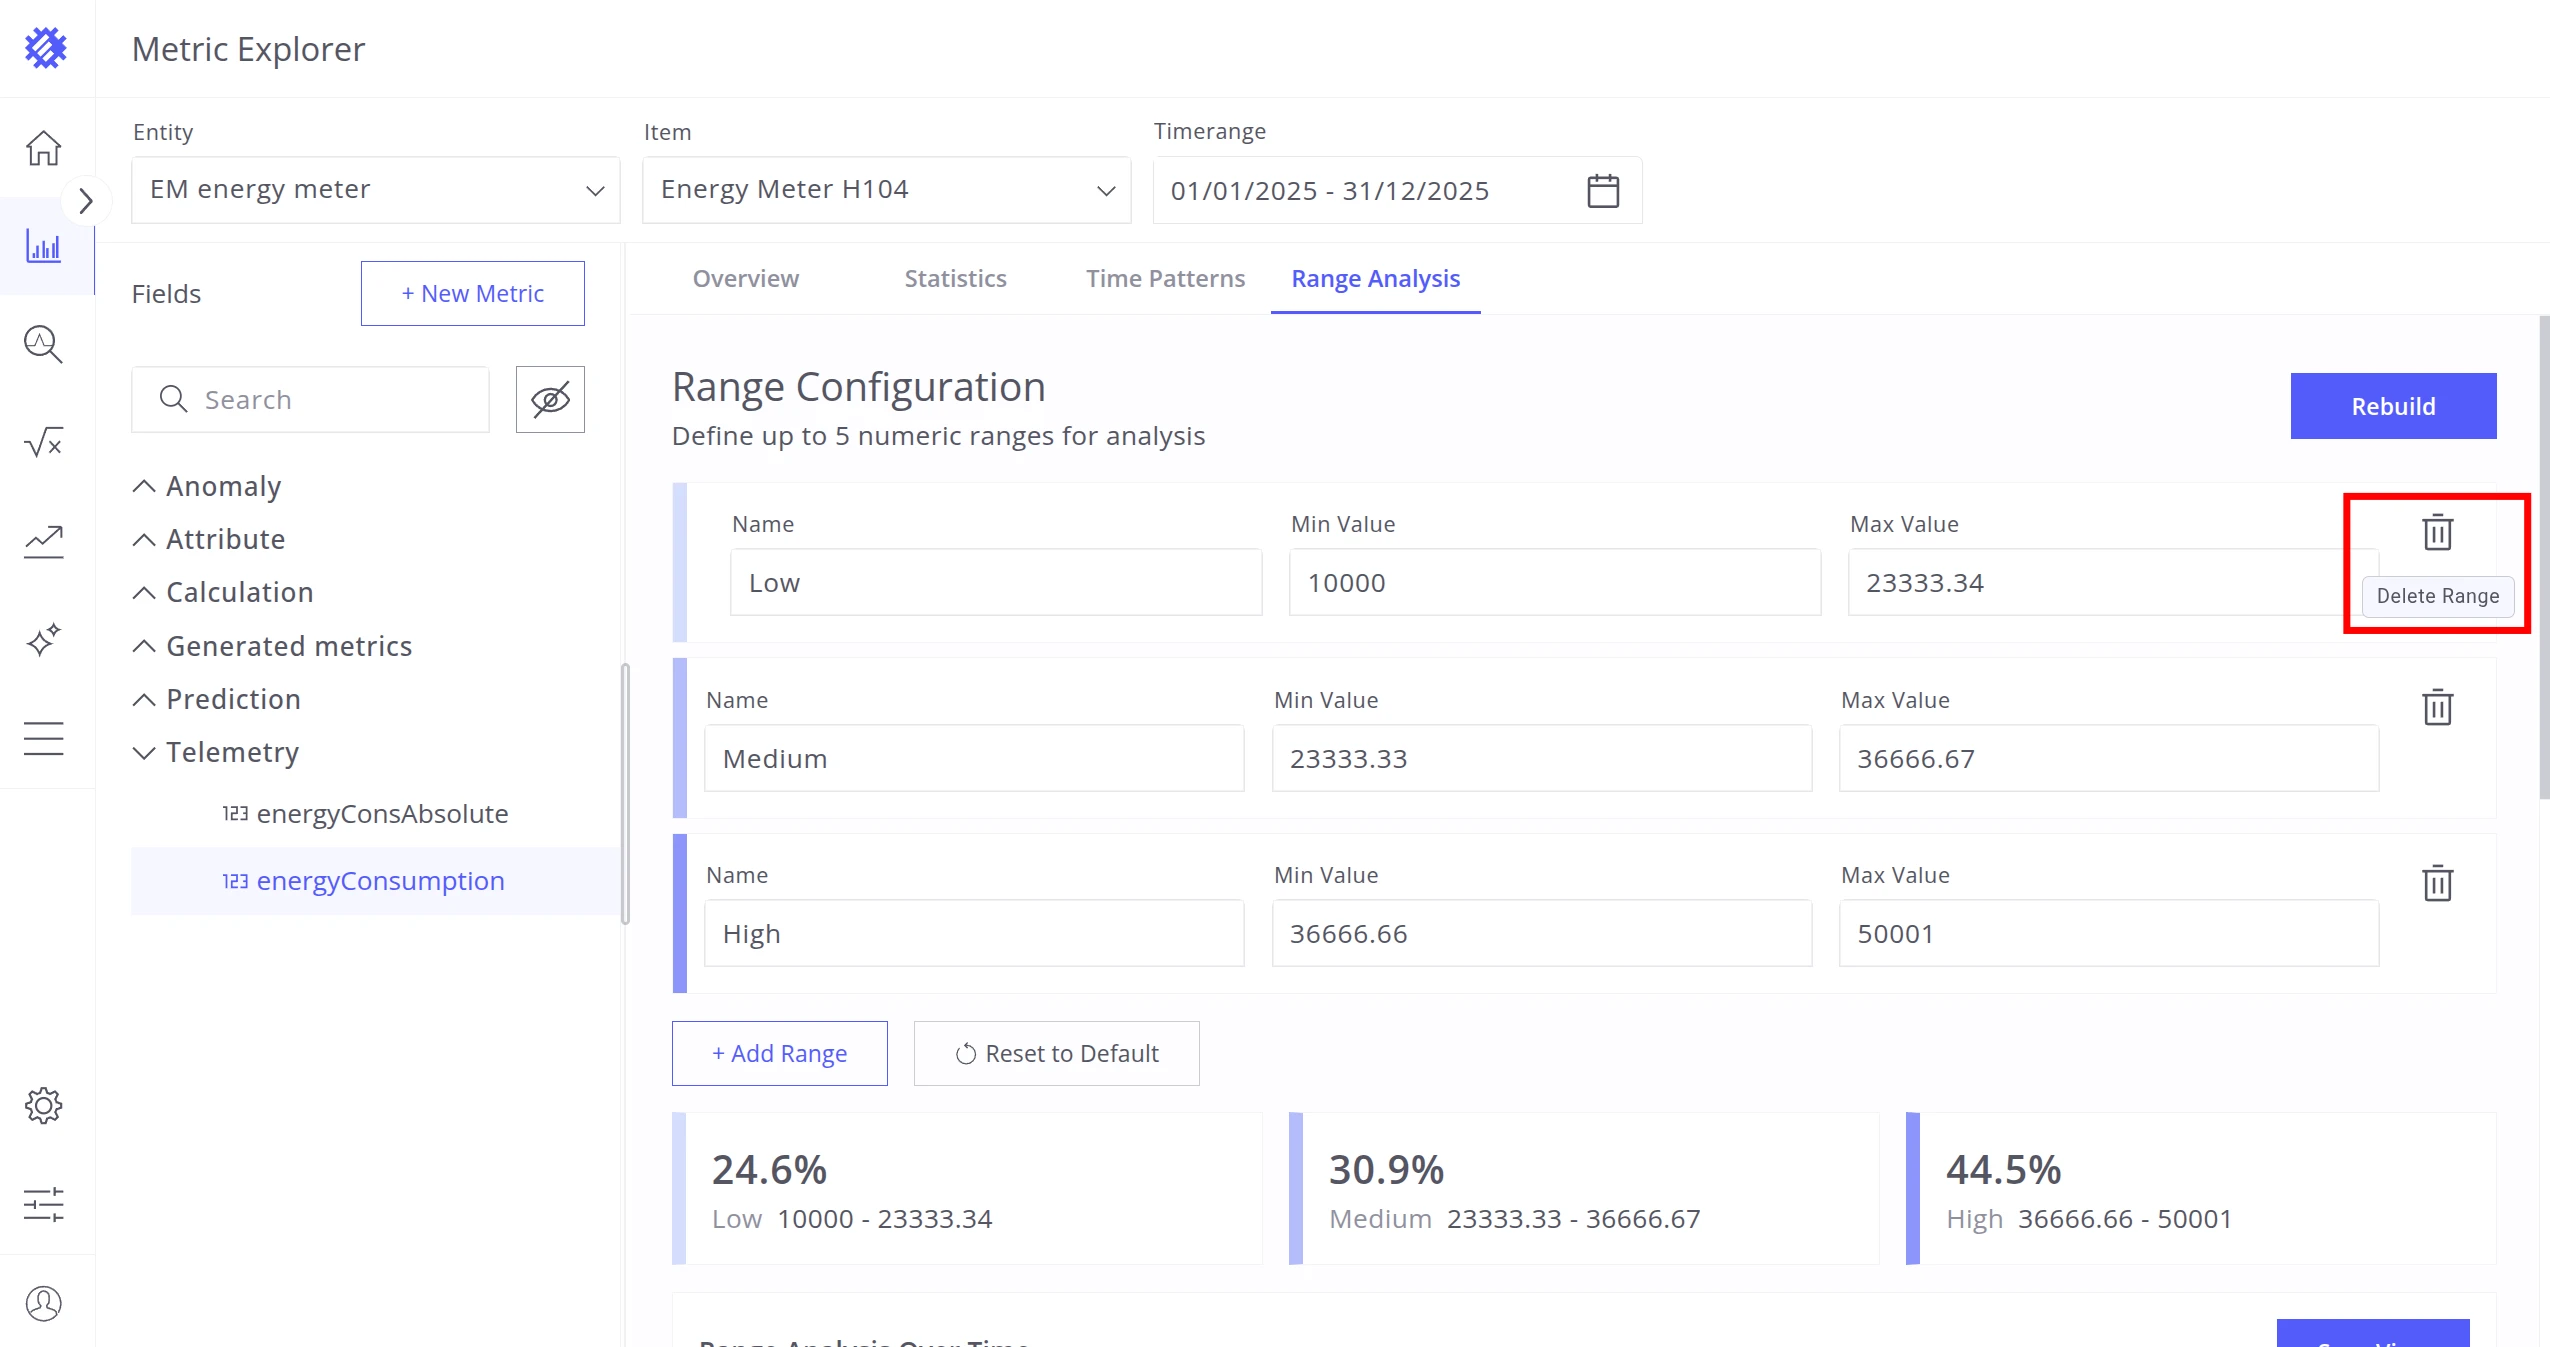
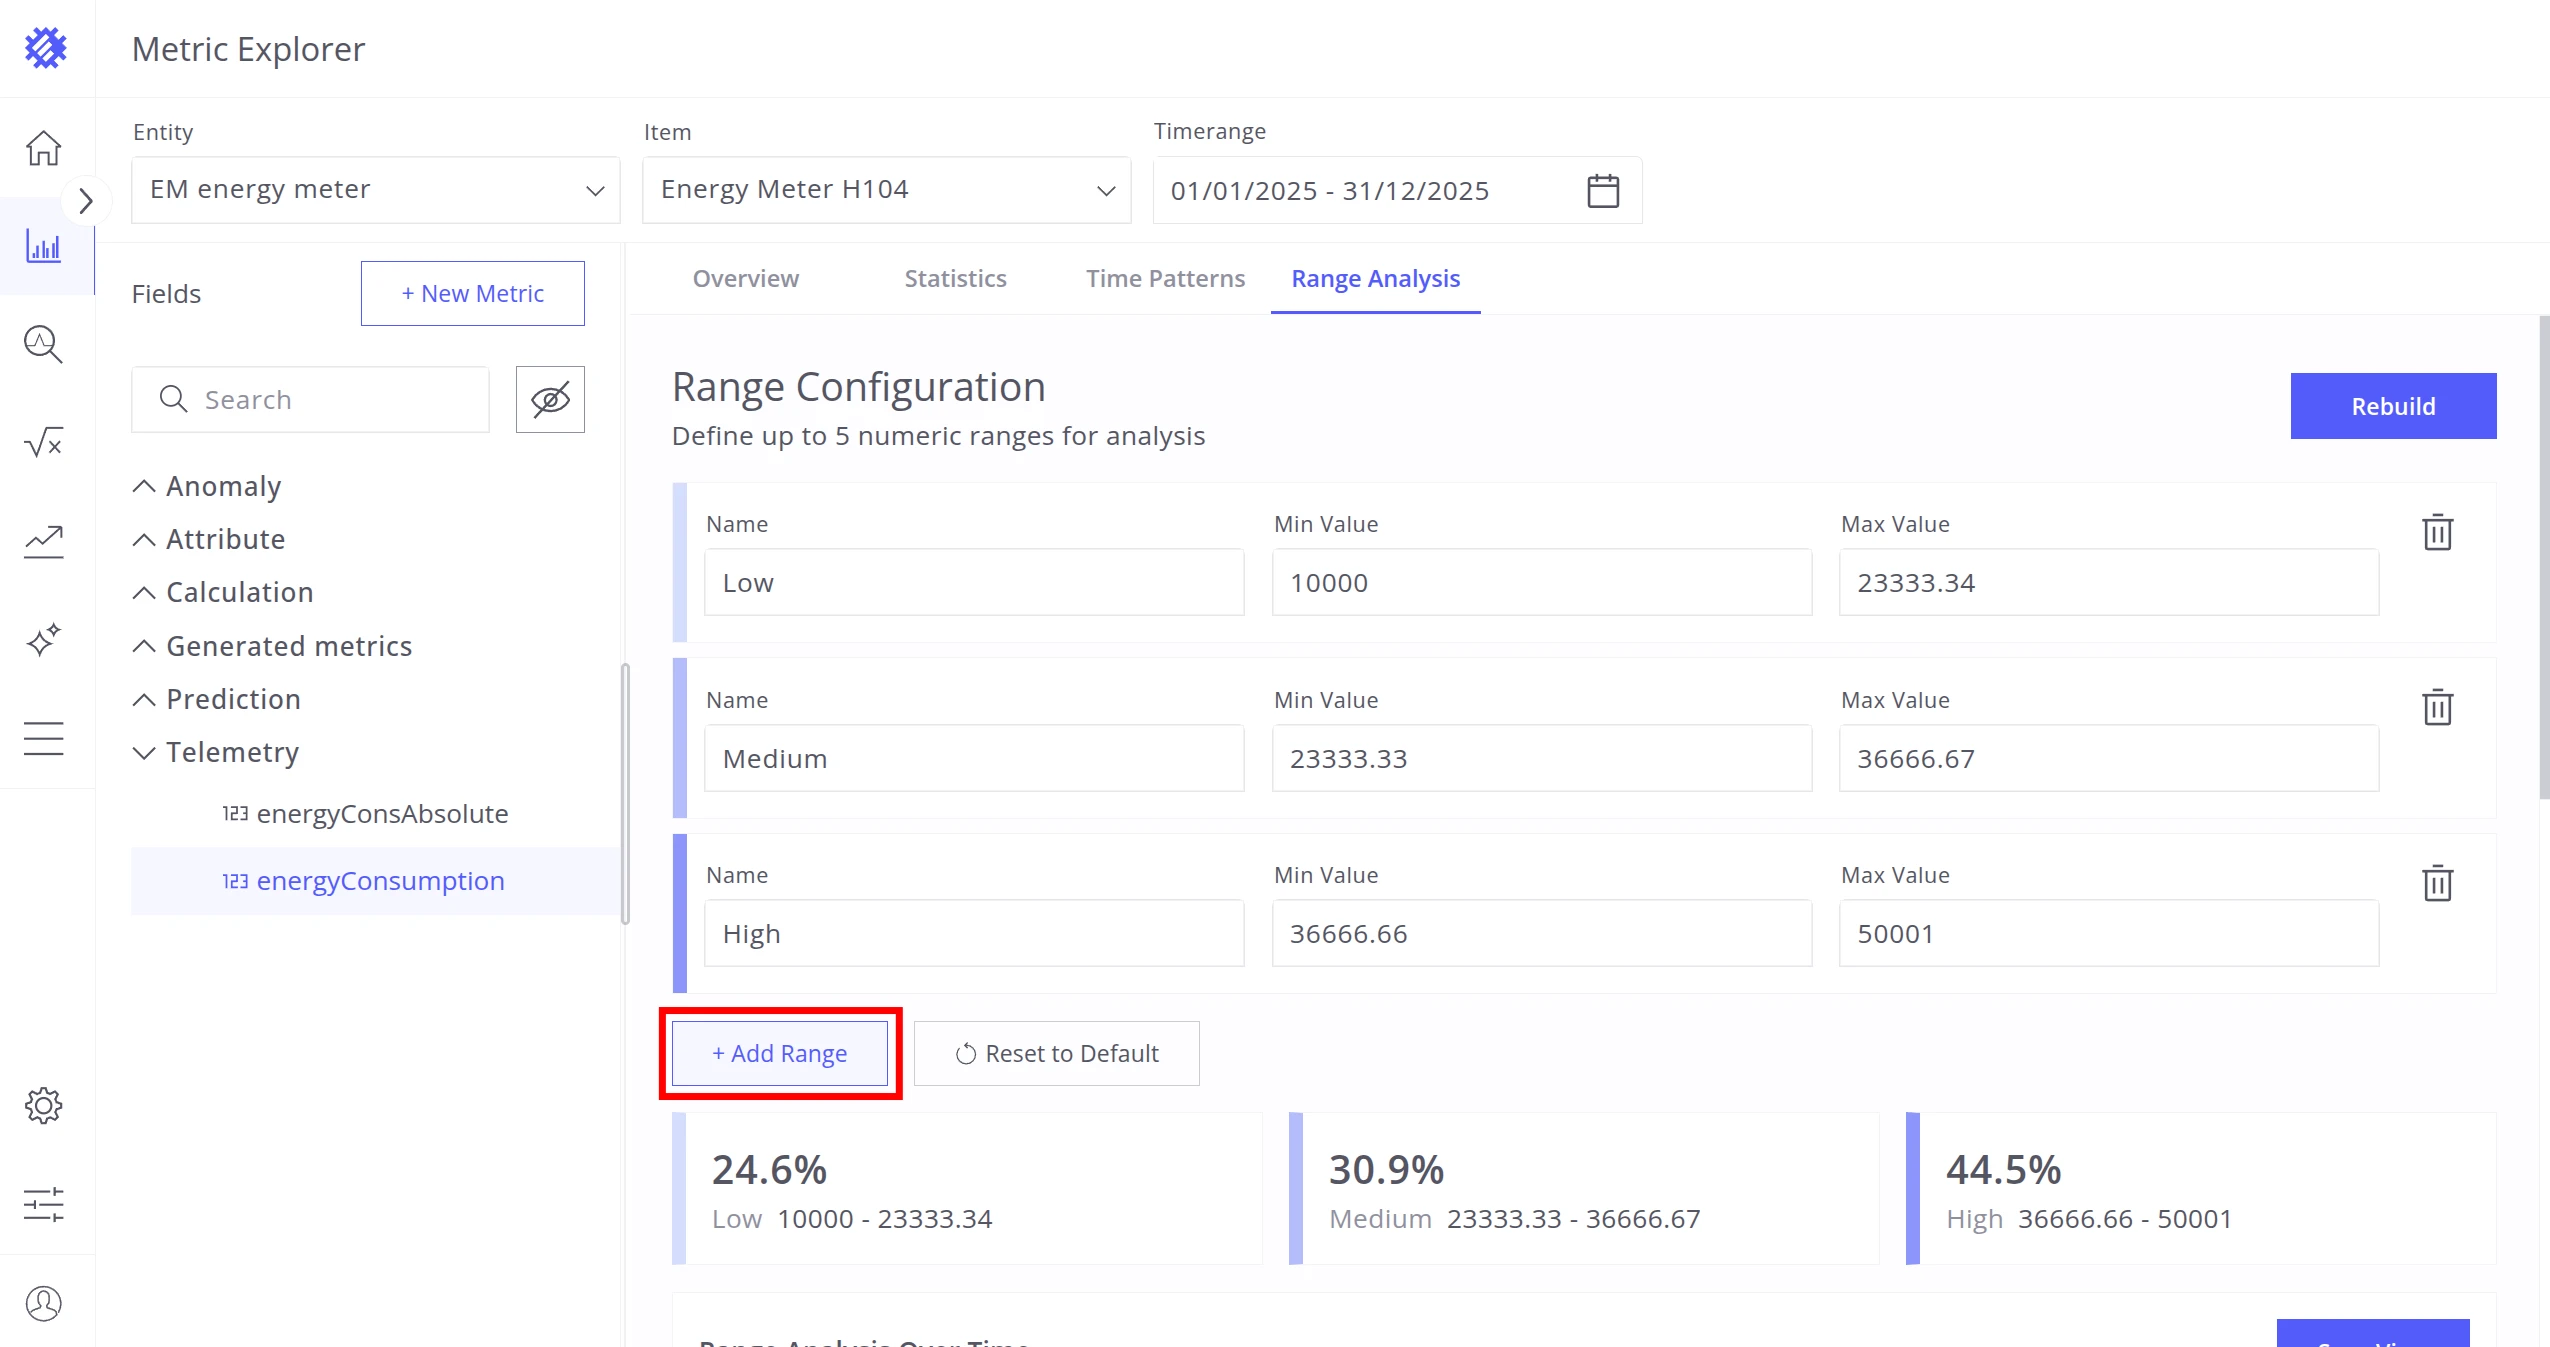
- Add or remove ranges as needed.
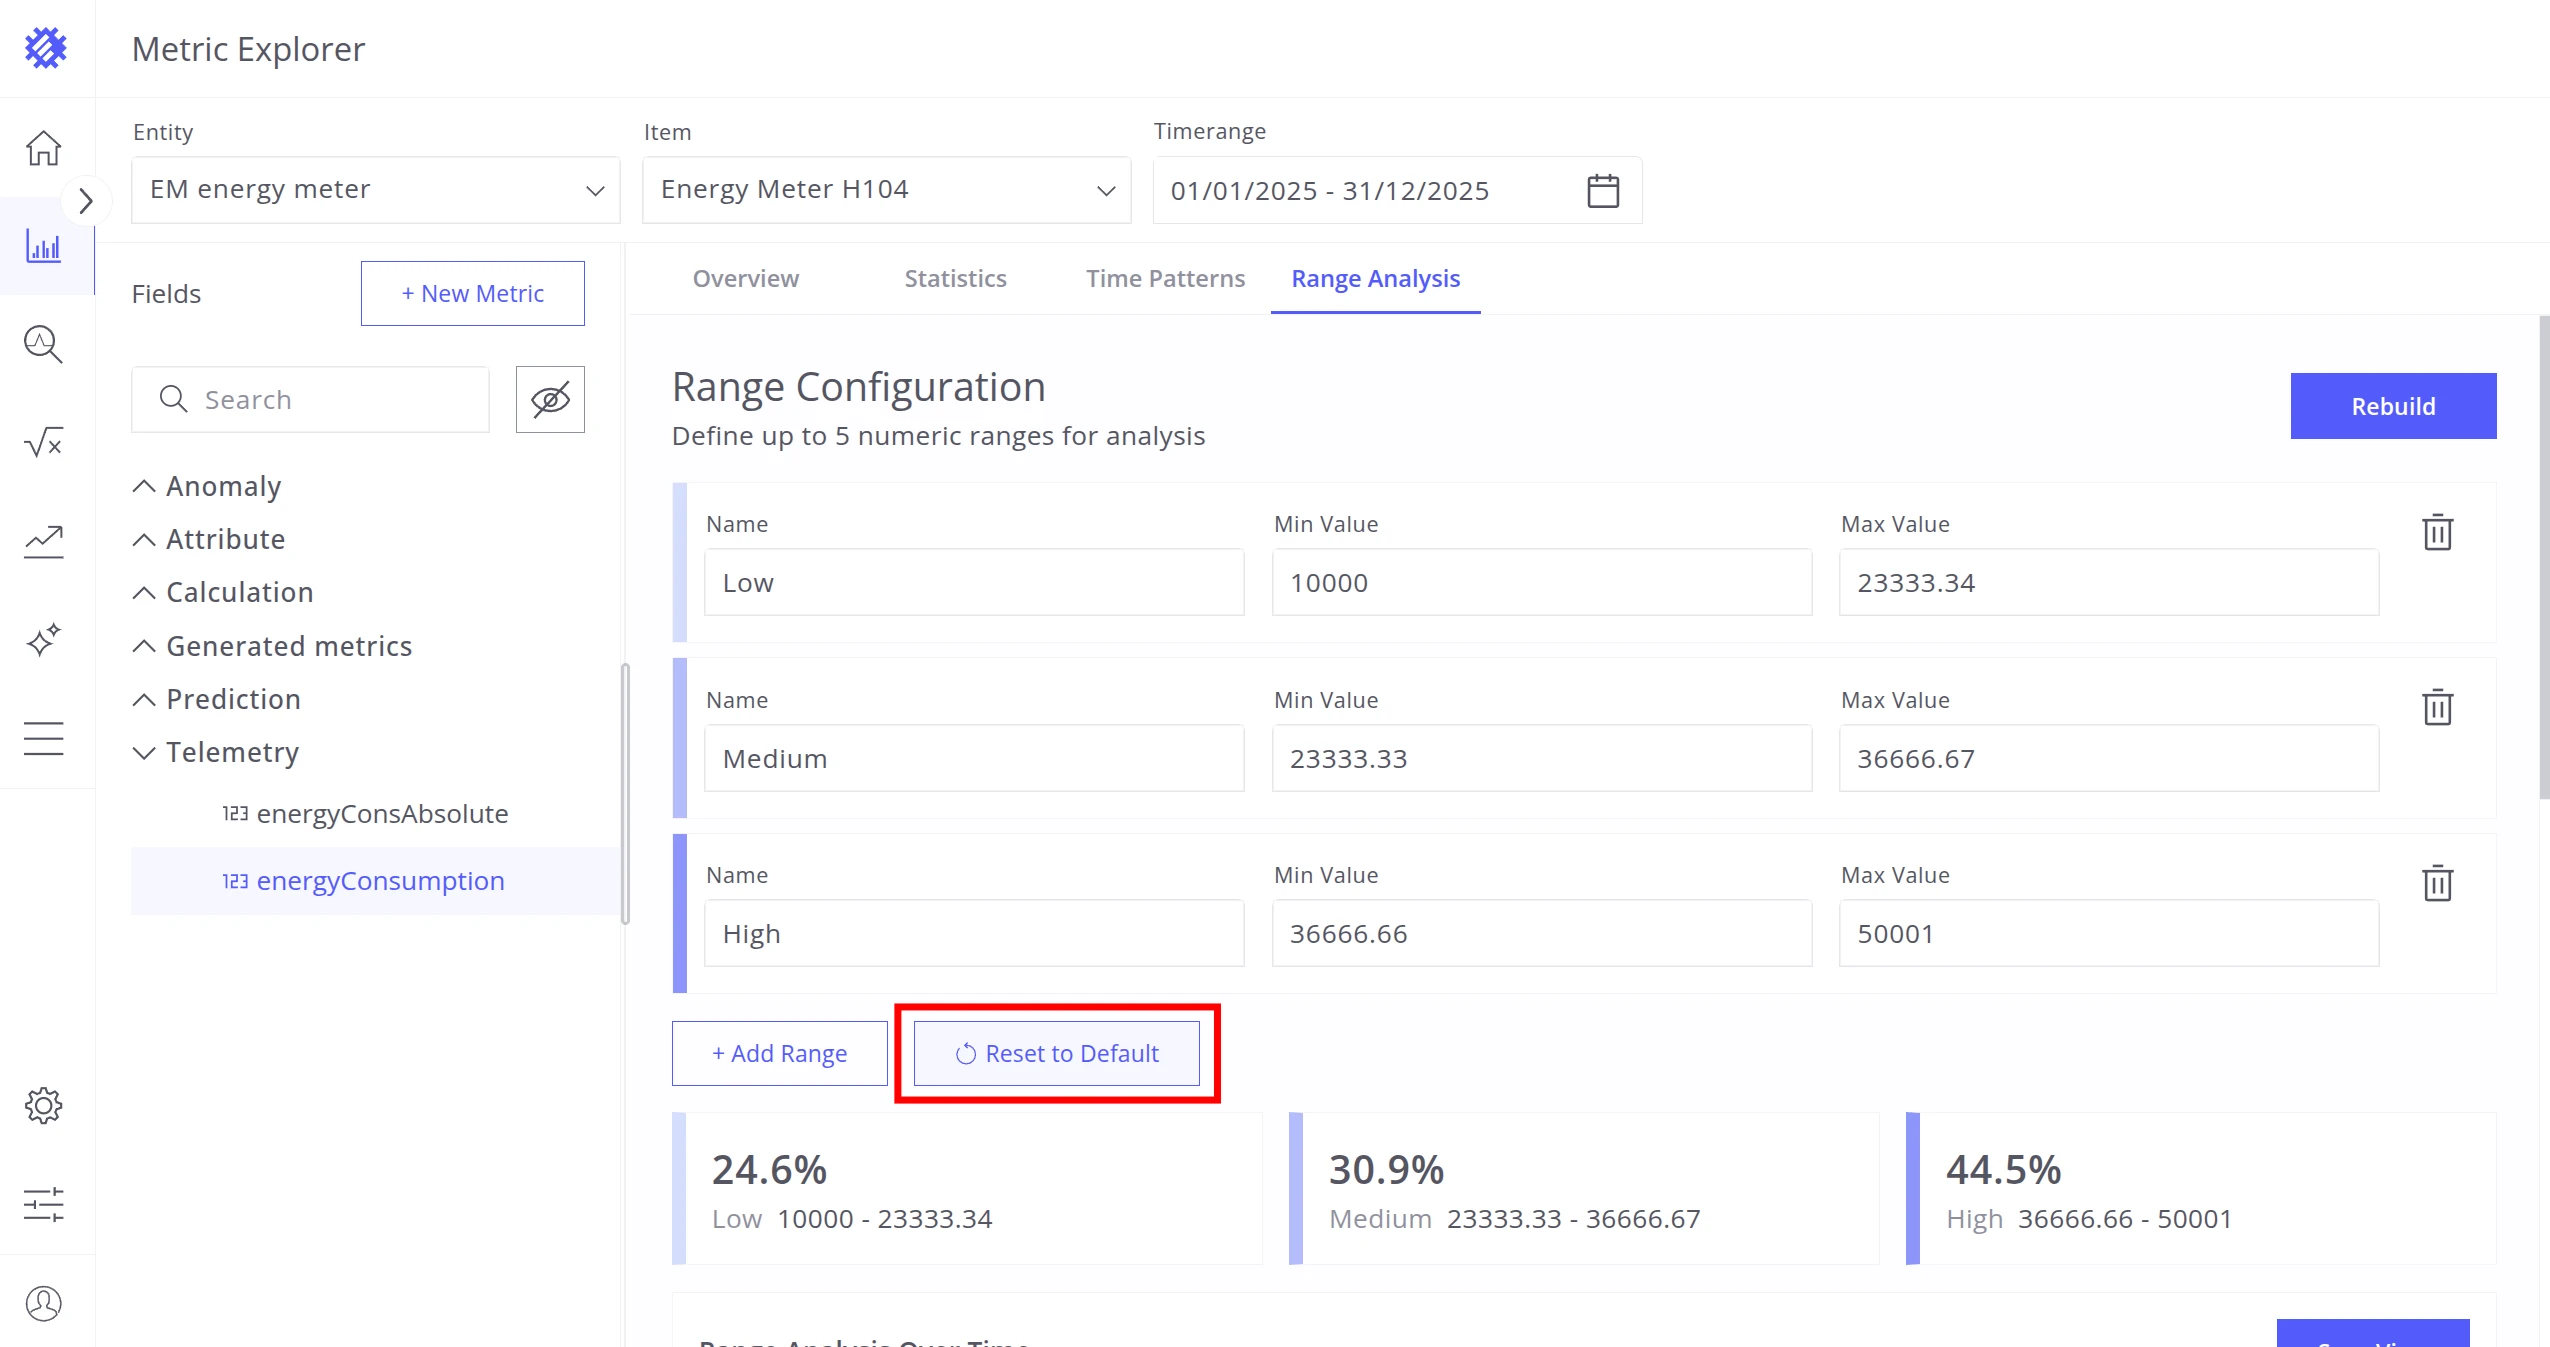
- Reset to default (three automatically calculated ranges).
After configuration, click Rebuild to generate the views:
| View | Description |
|---|---|
| Summary Cards | Total duration or percentage spent in each range. |
| Charts | Duration or percentage grouped by time. |
| Range Summary | Most frequent range and the analysis period. |
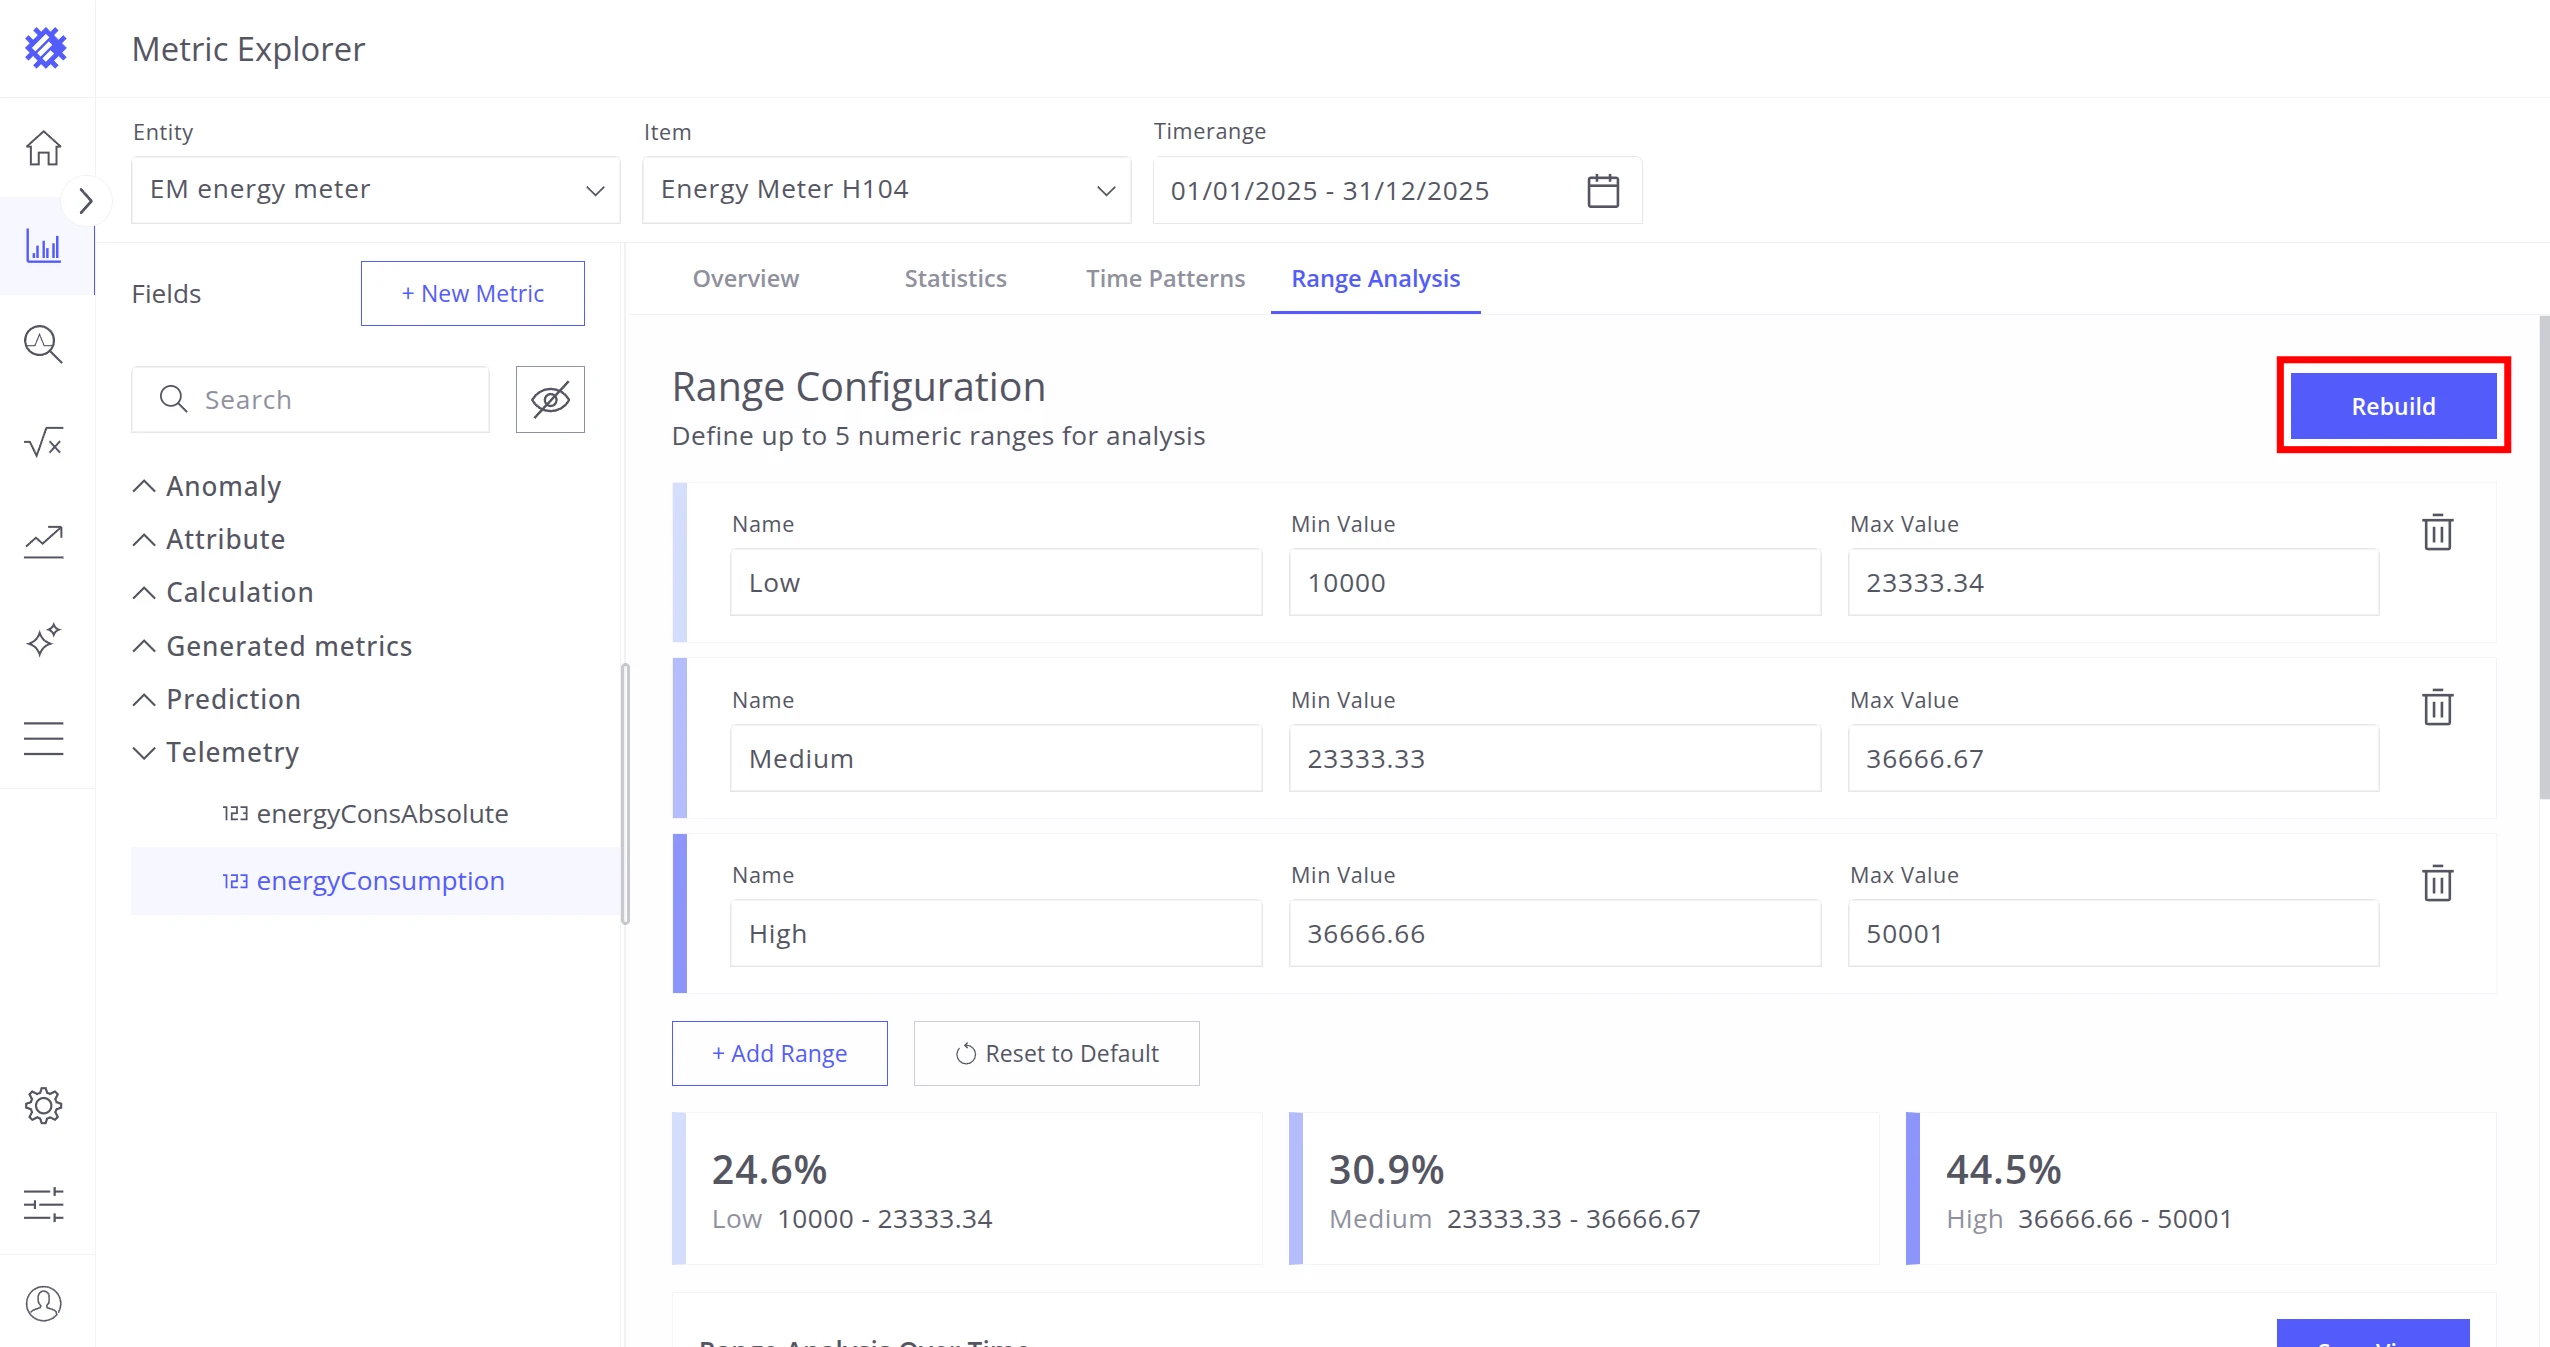
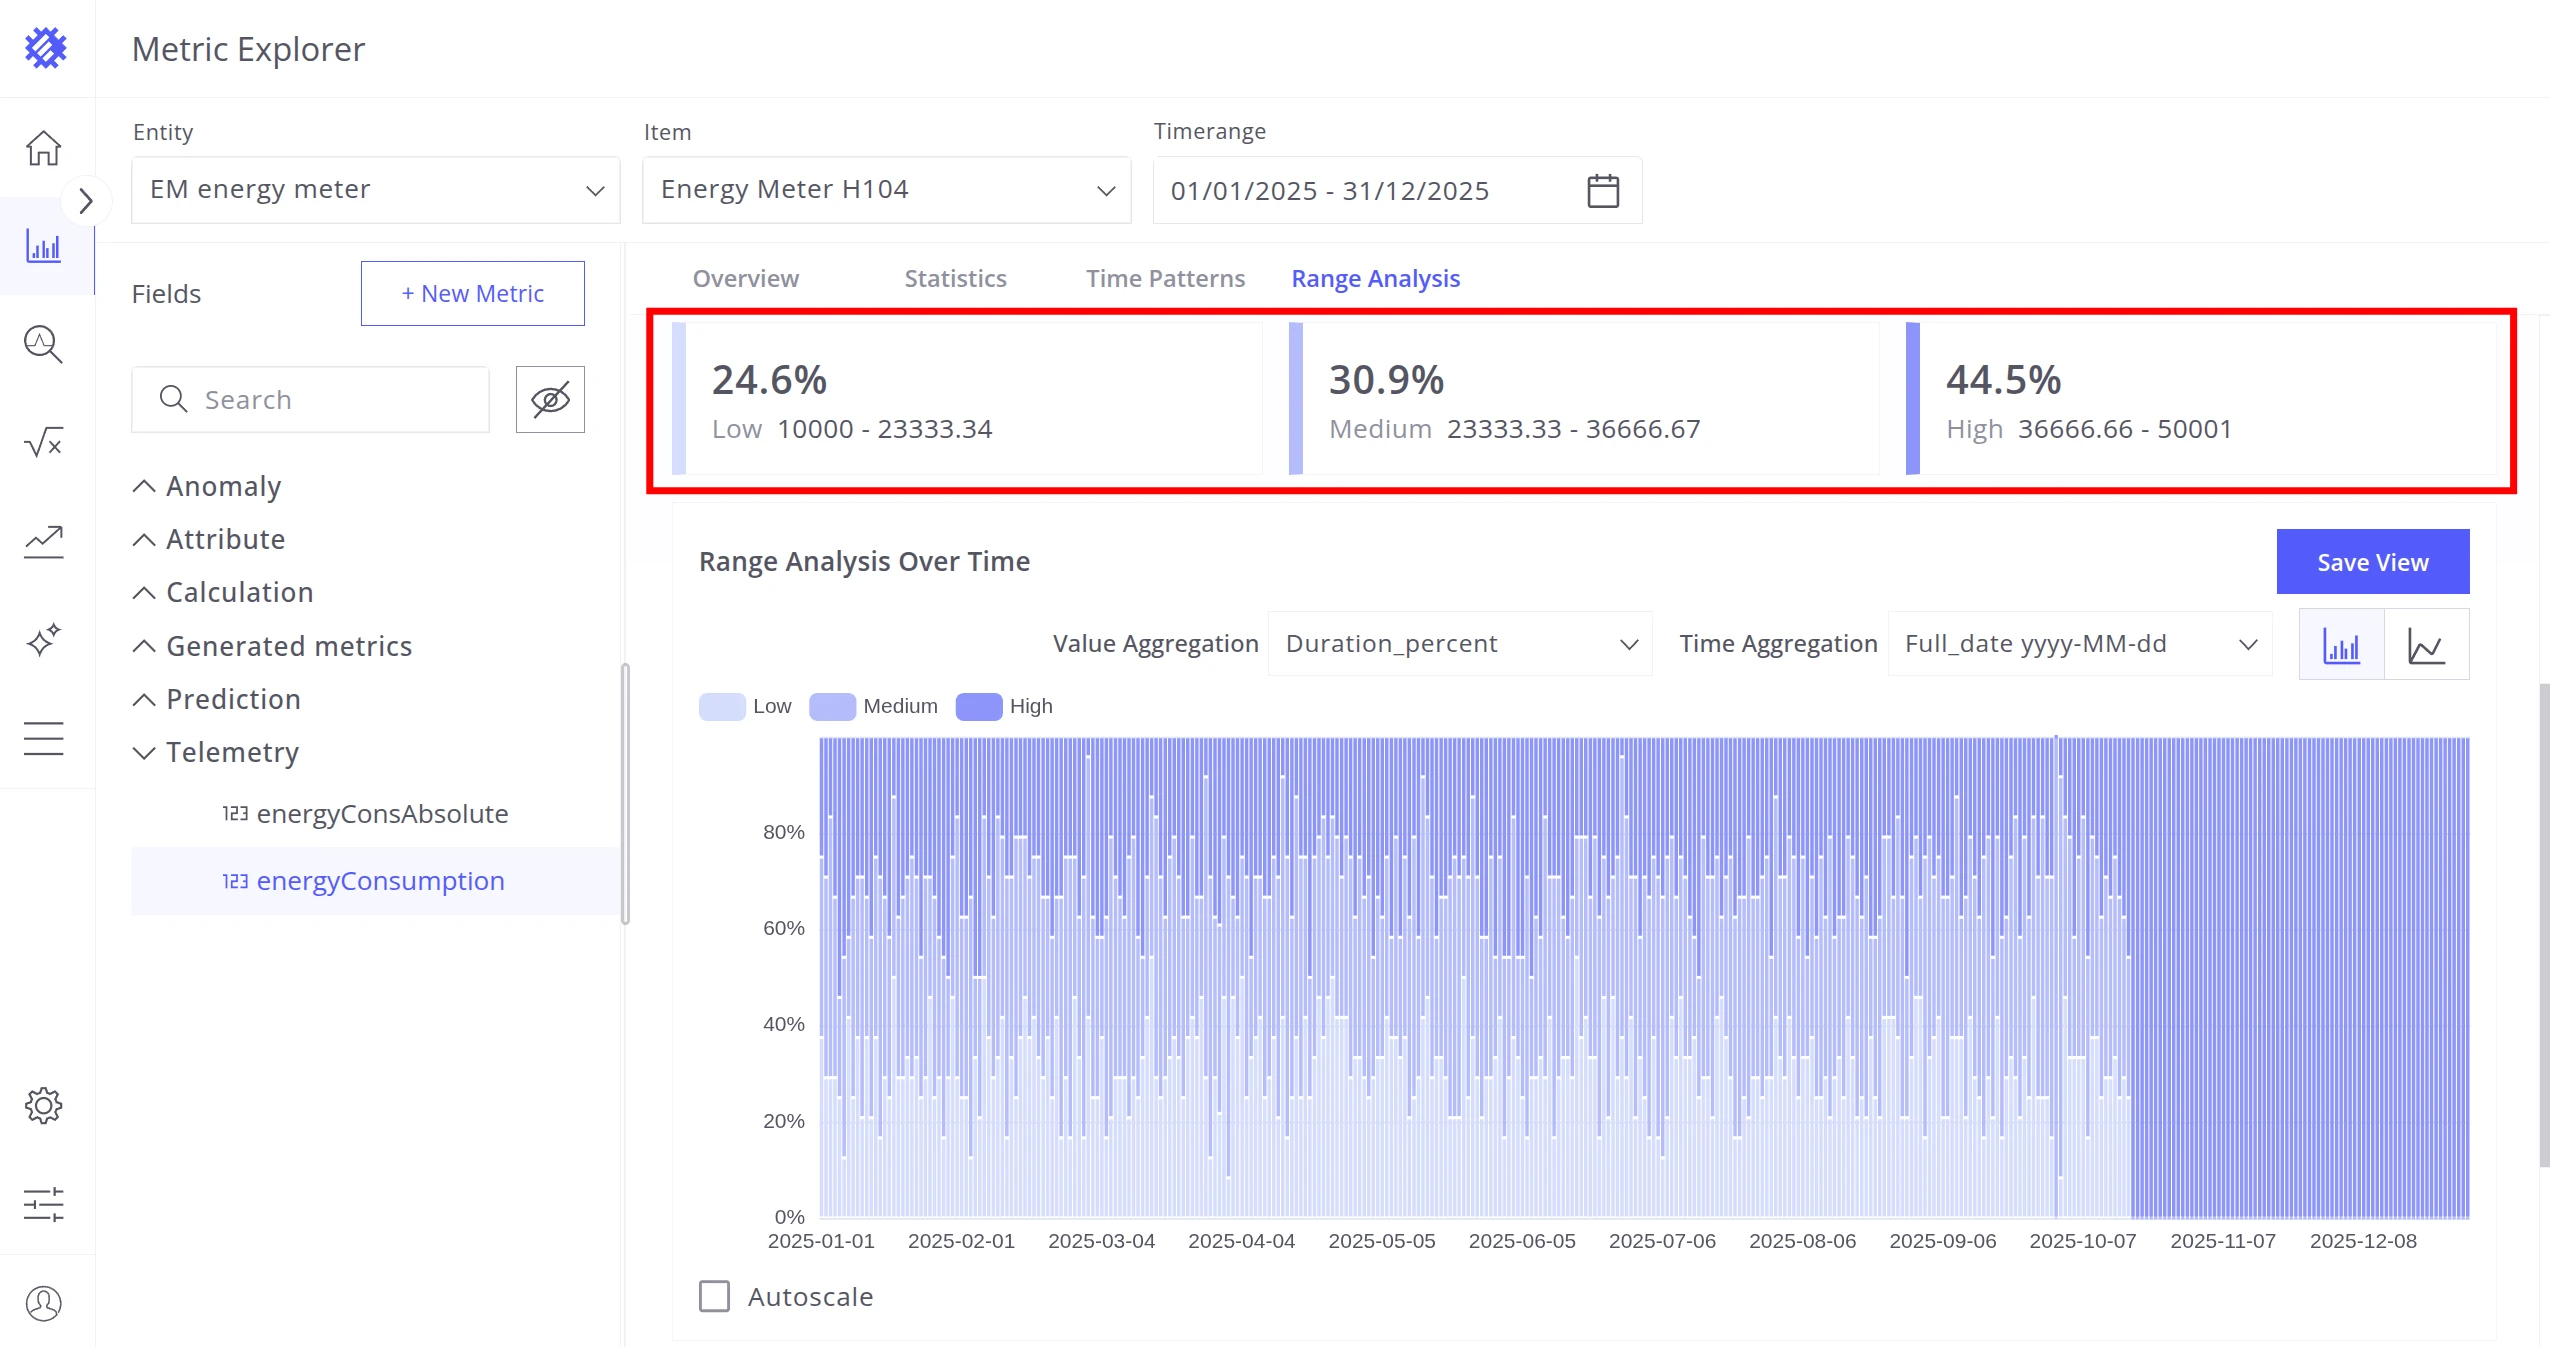
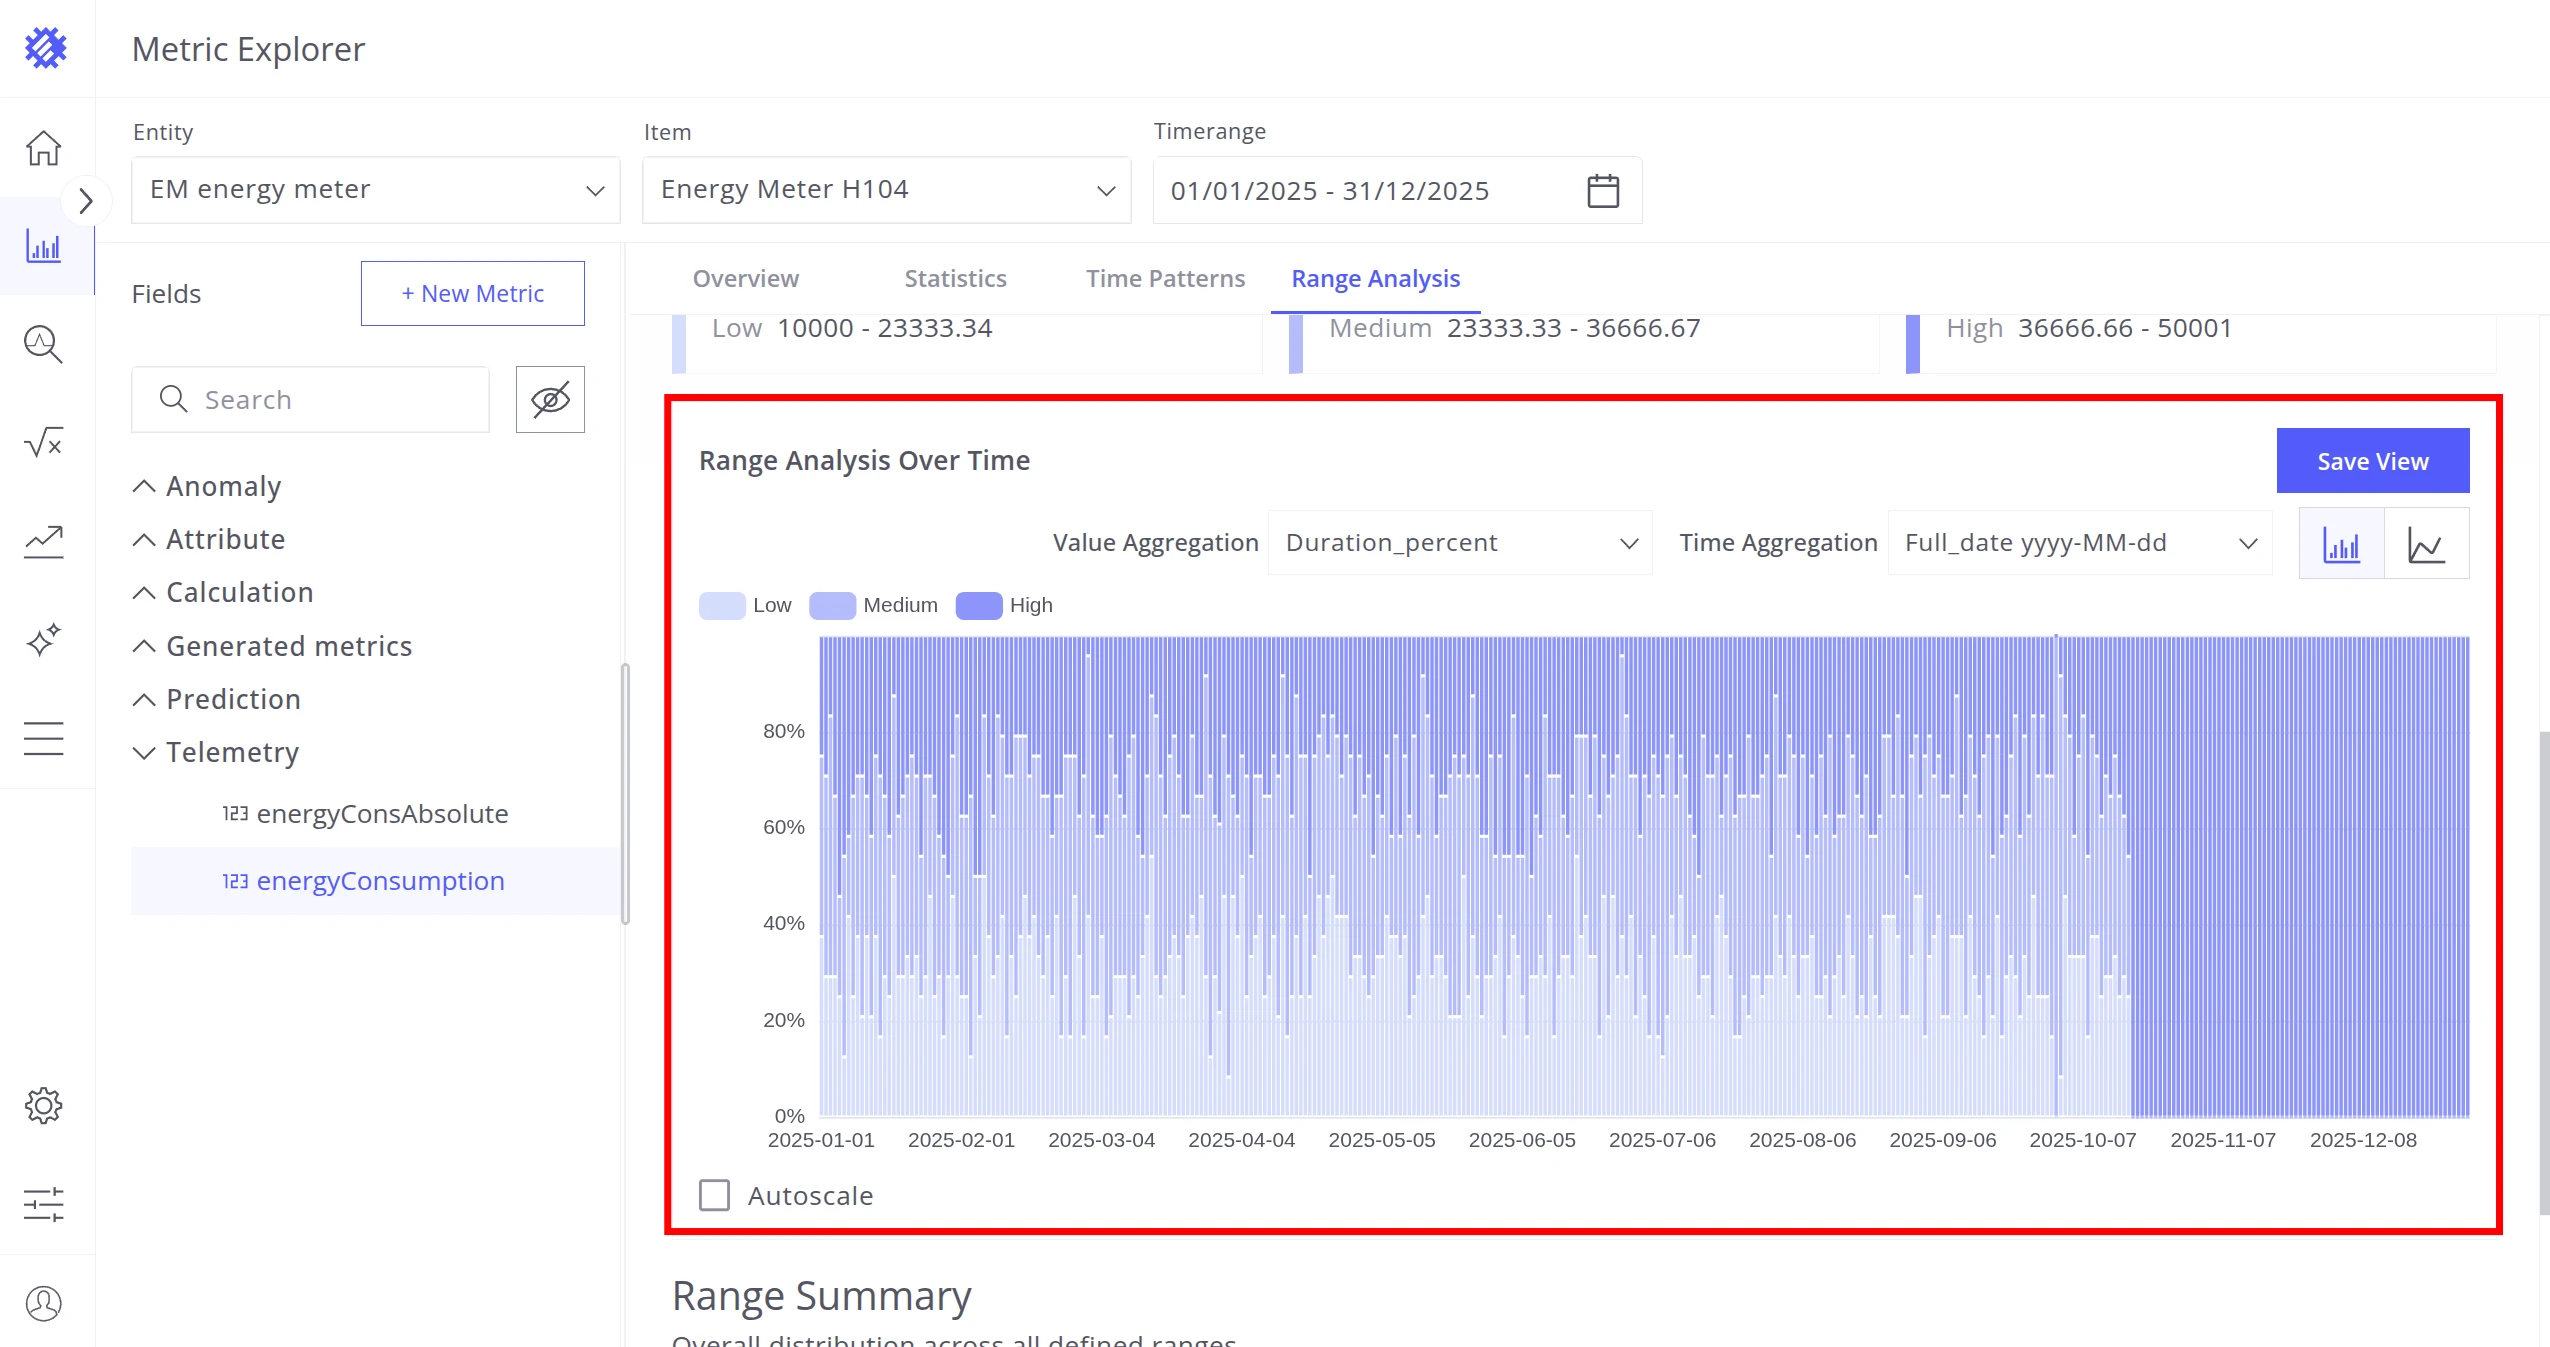
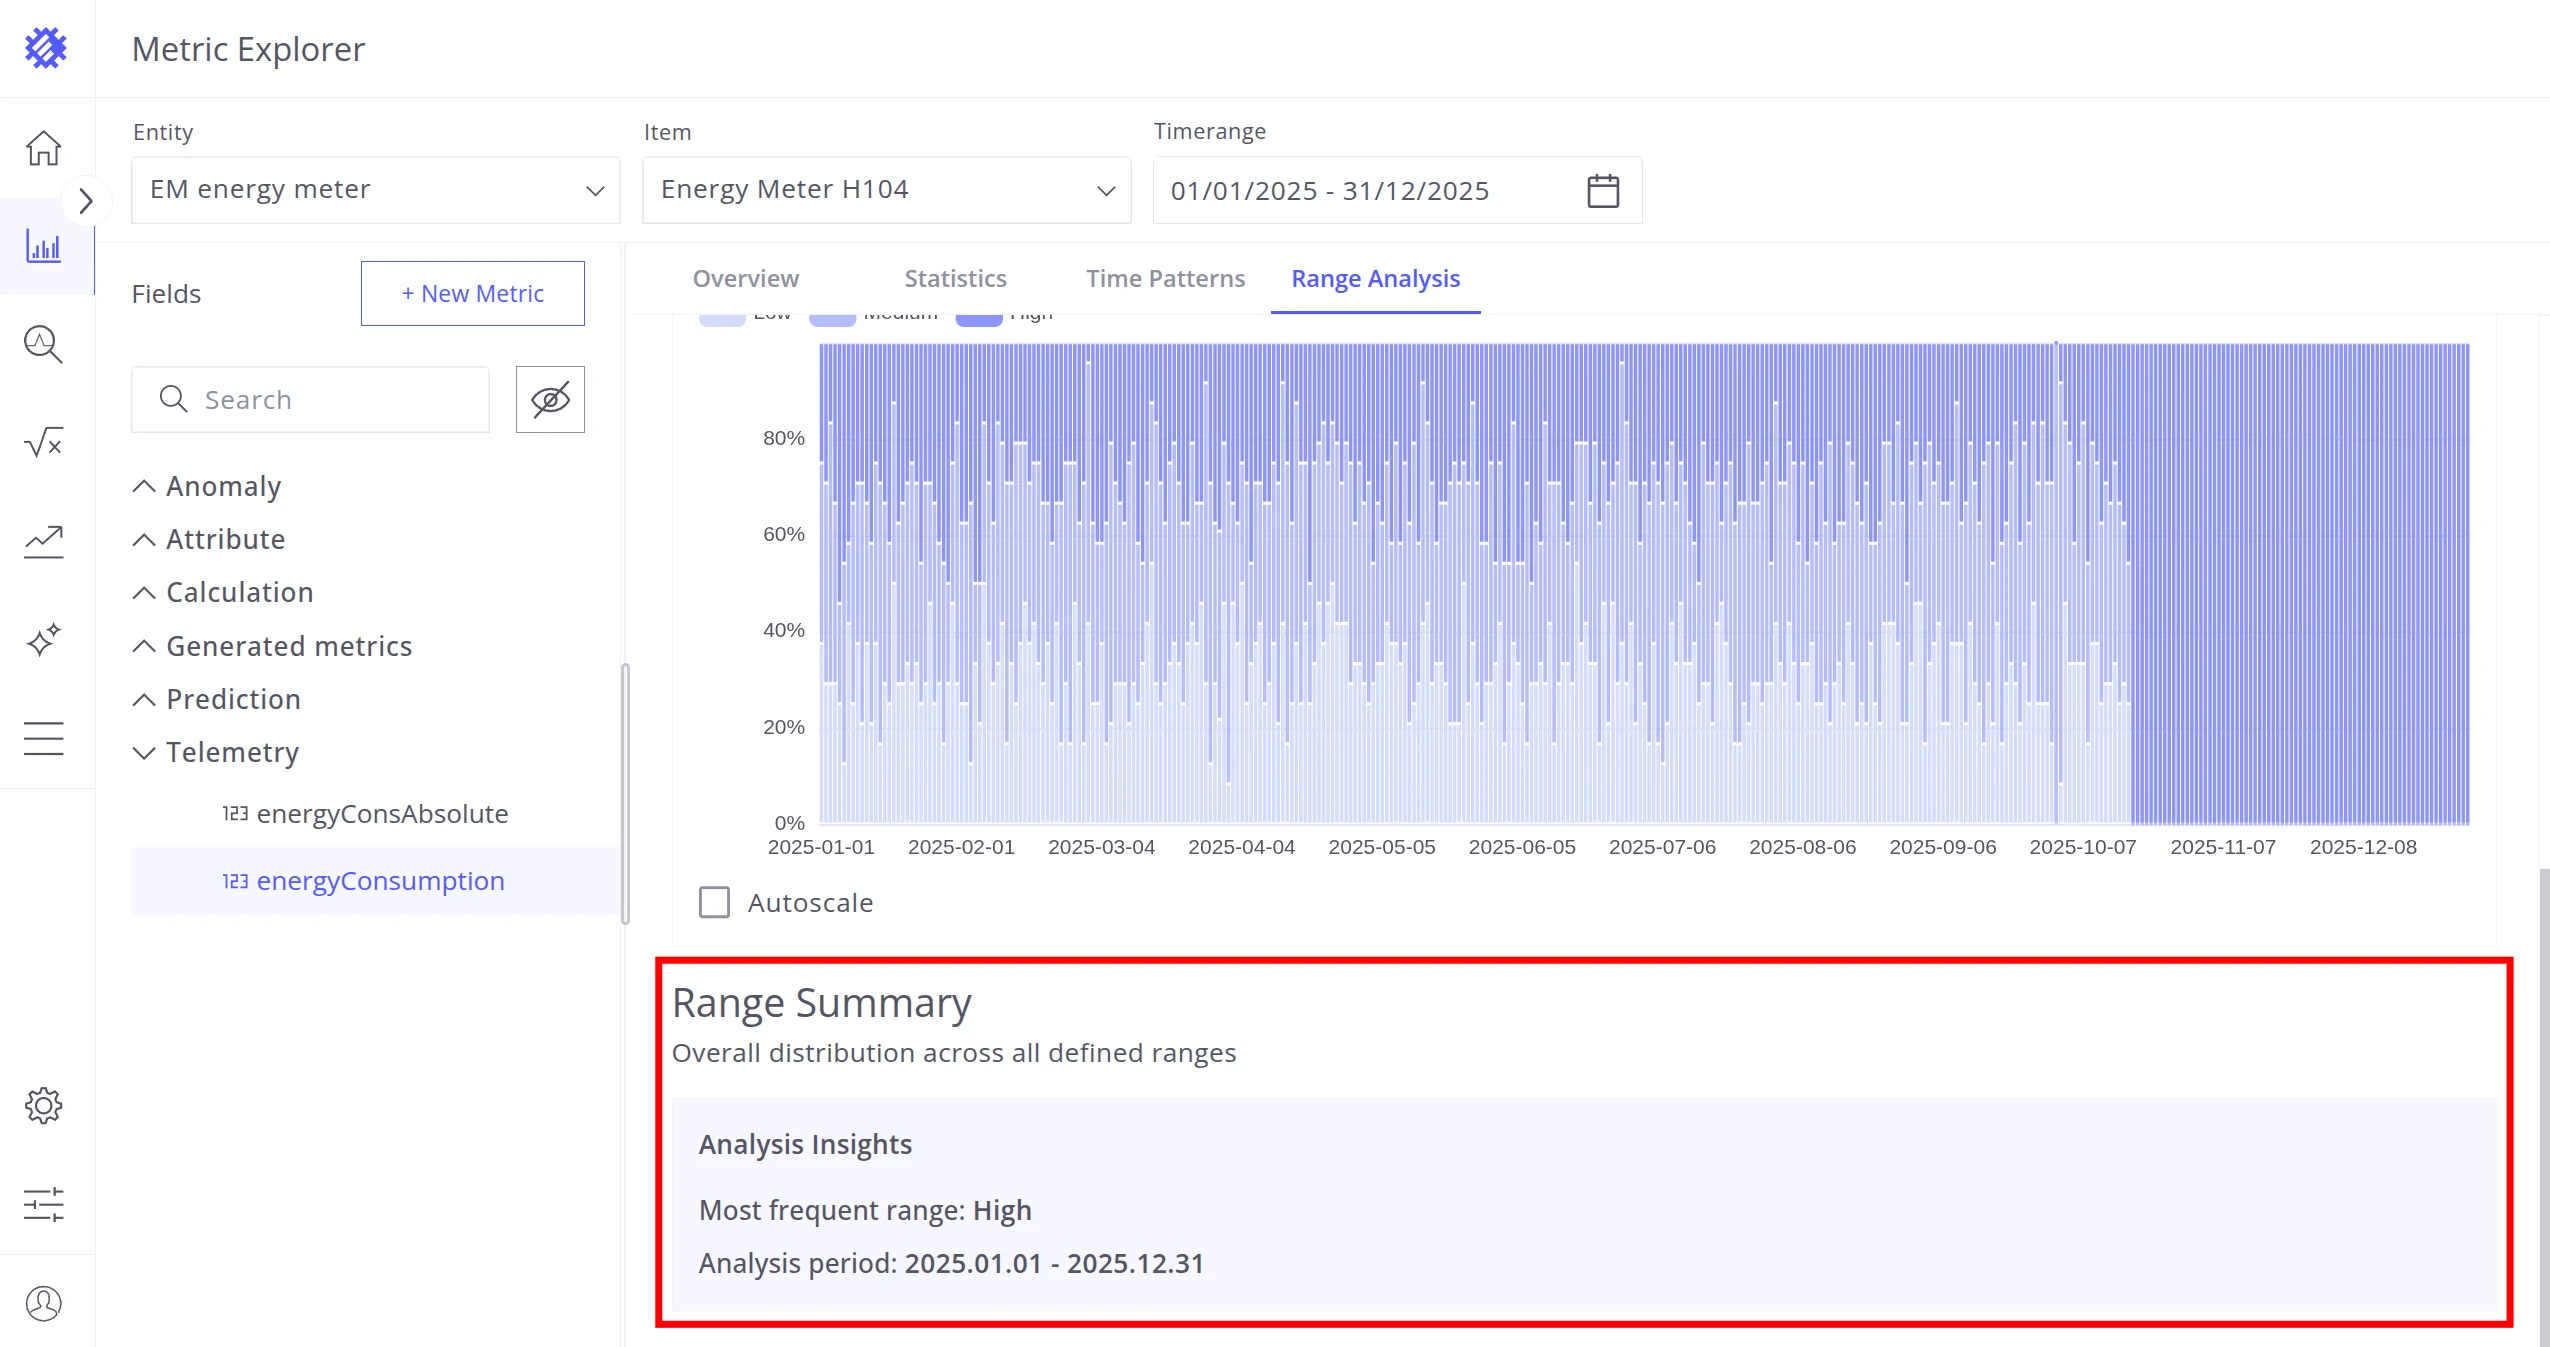
Chart customization options:
| Option | Choices |
|---|---|
| Value Aggregation | Duration or duration percentage. |
| Time Aggregation | Select the time unit. |
| Chart Type | Line Chart or Stacked Bar. |
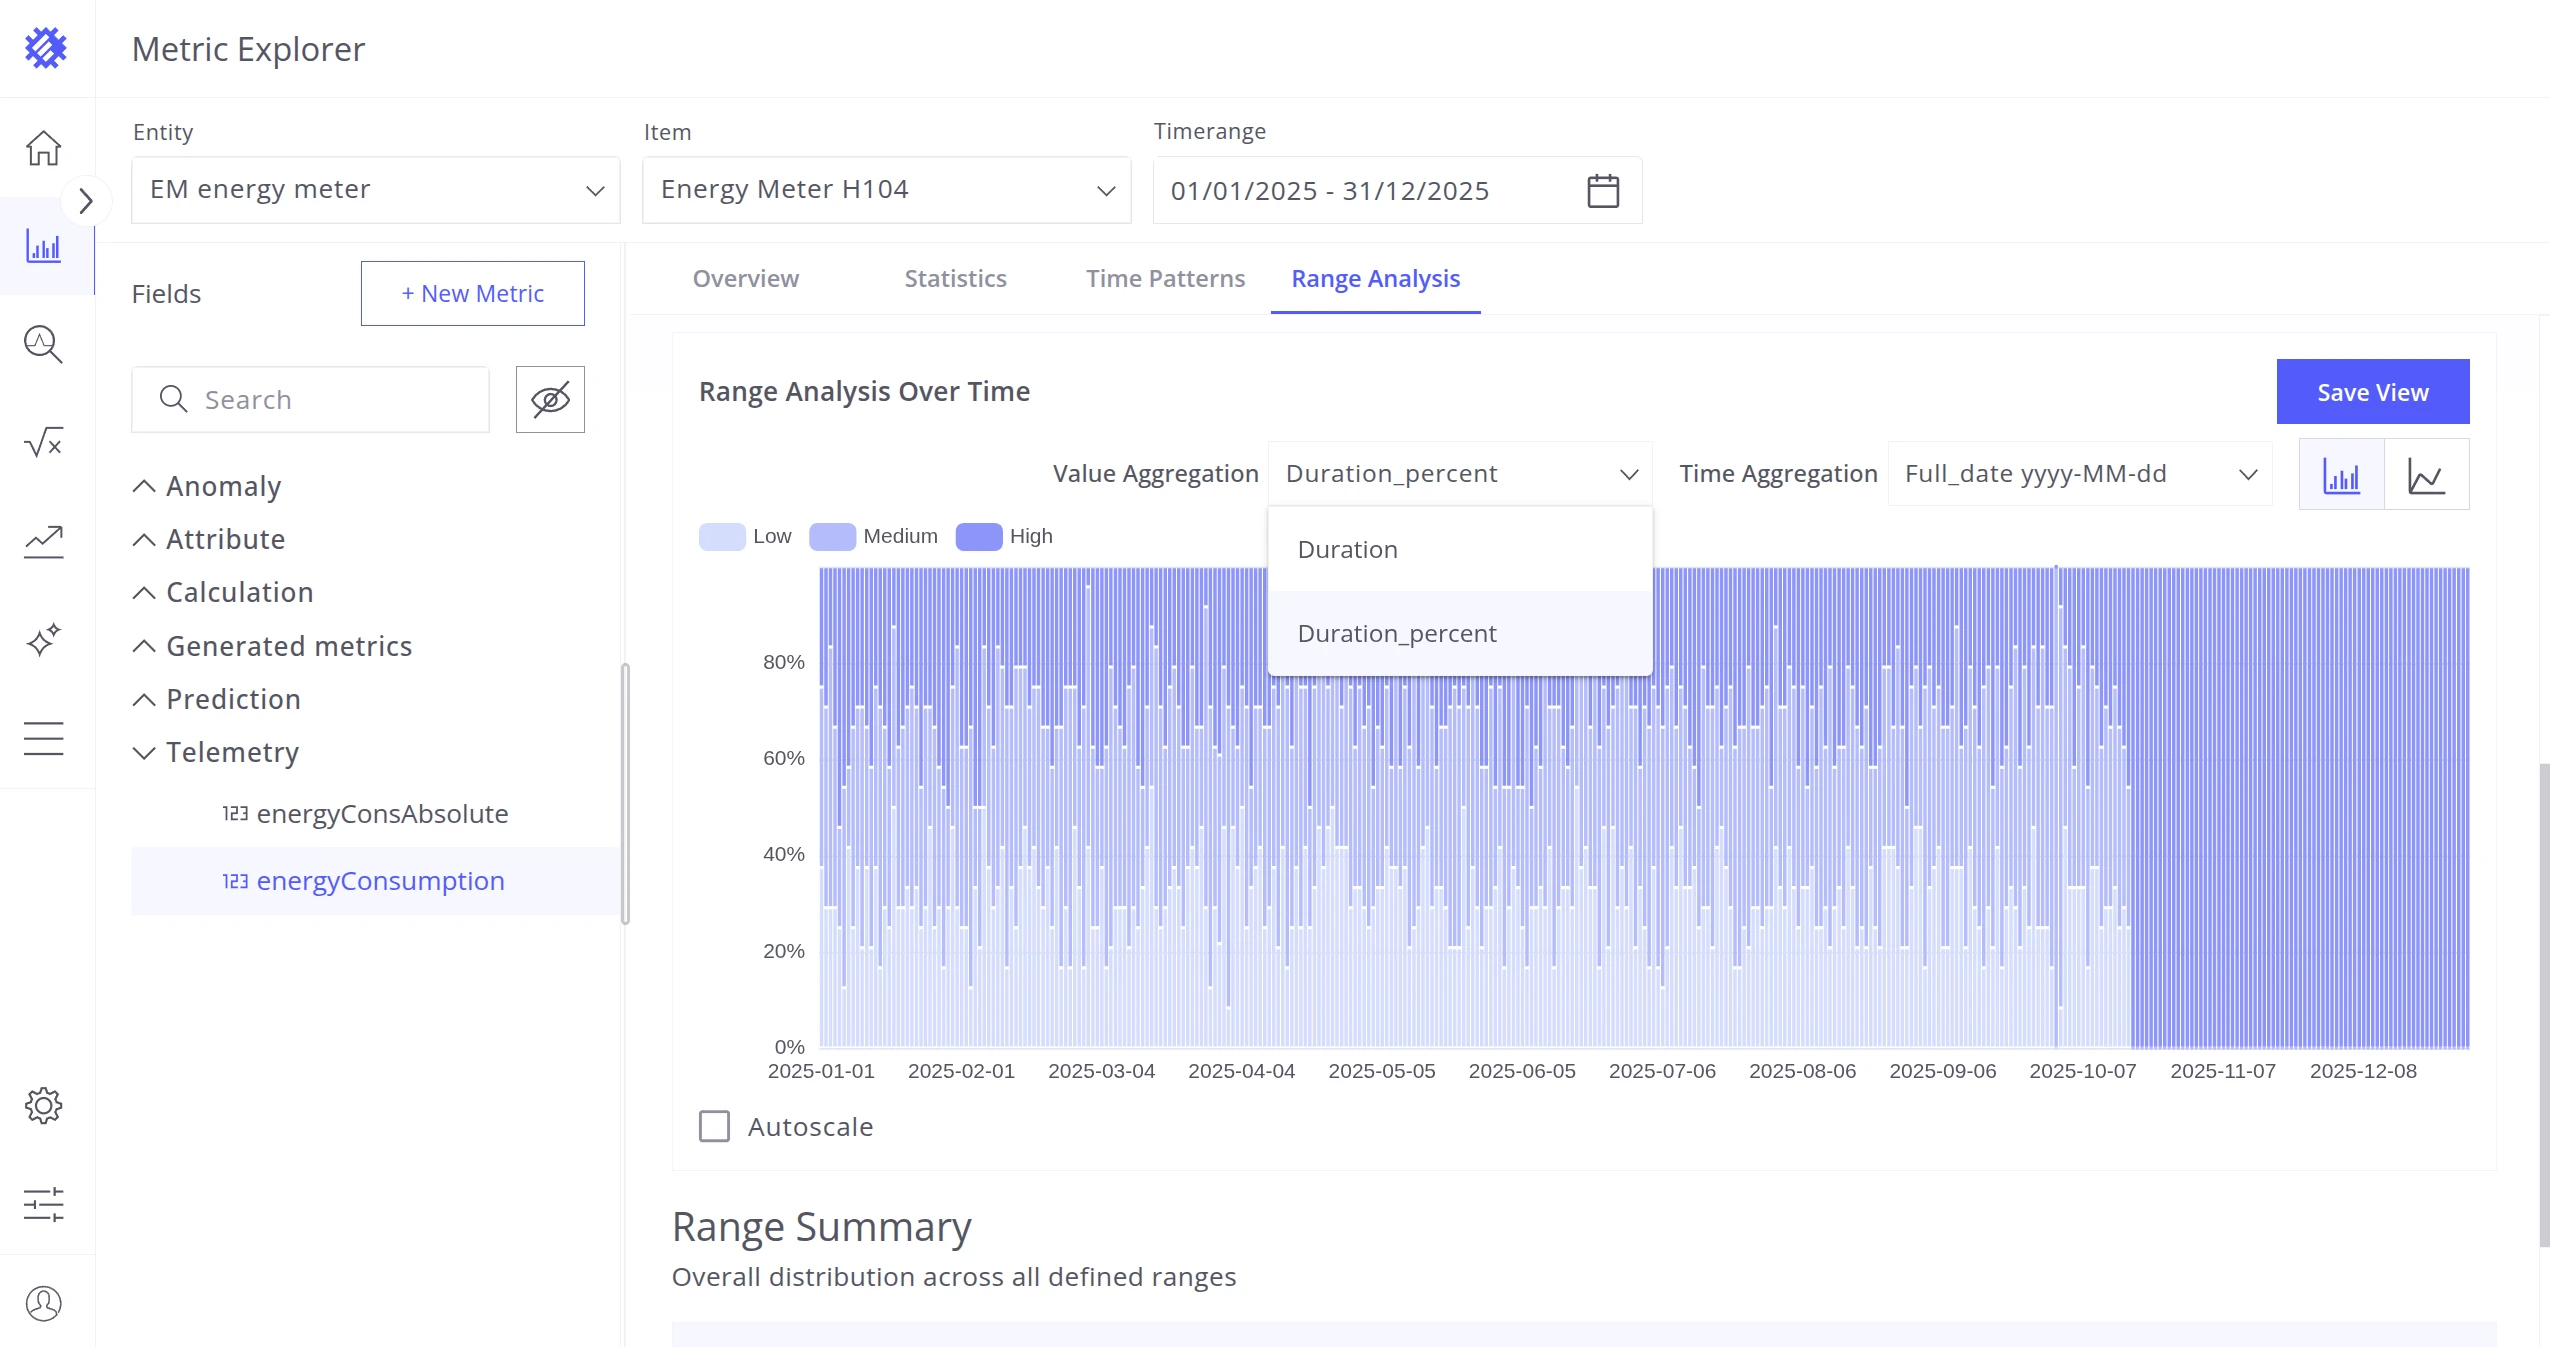
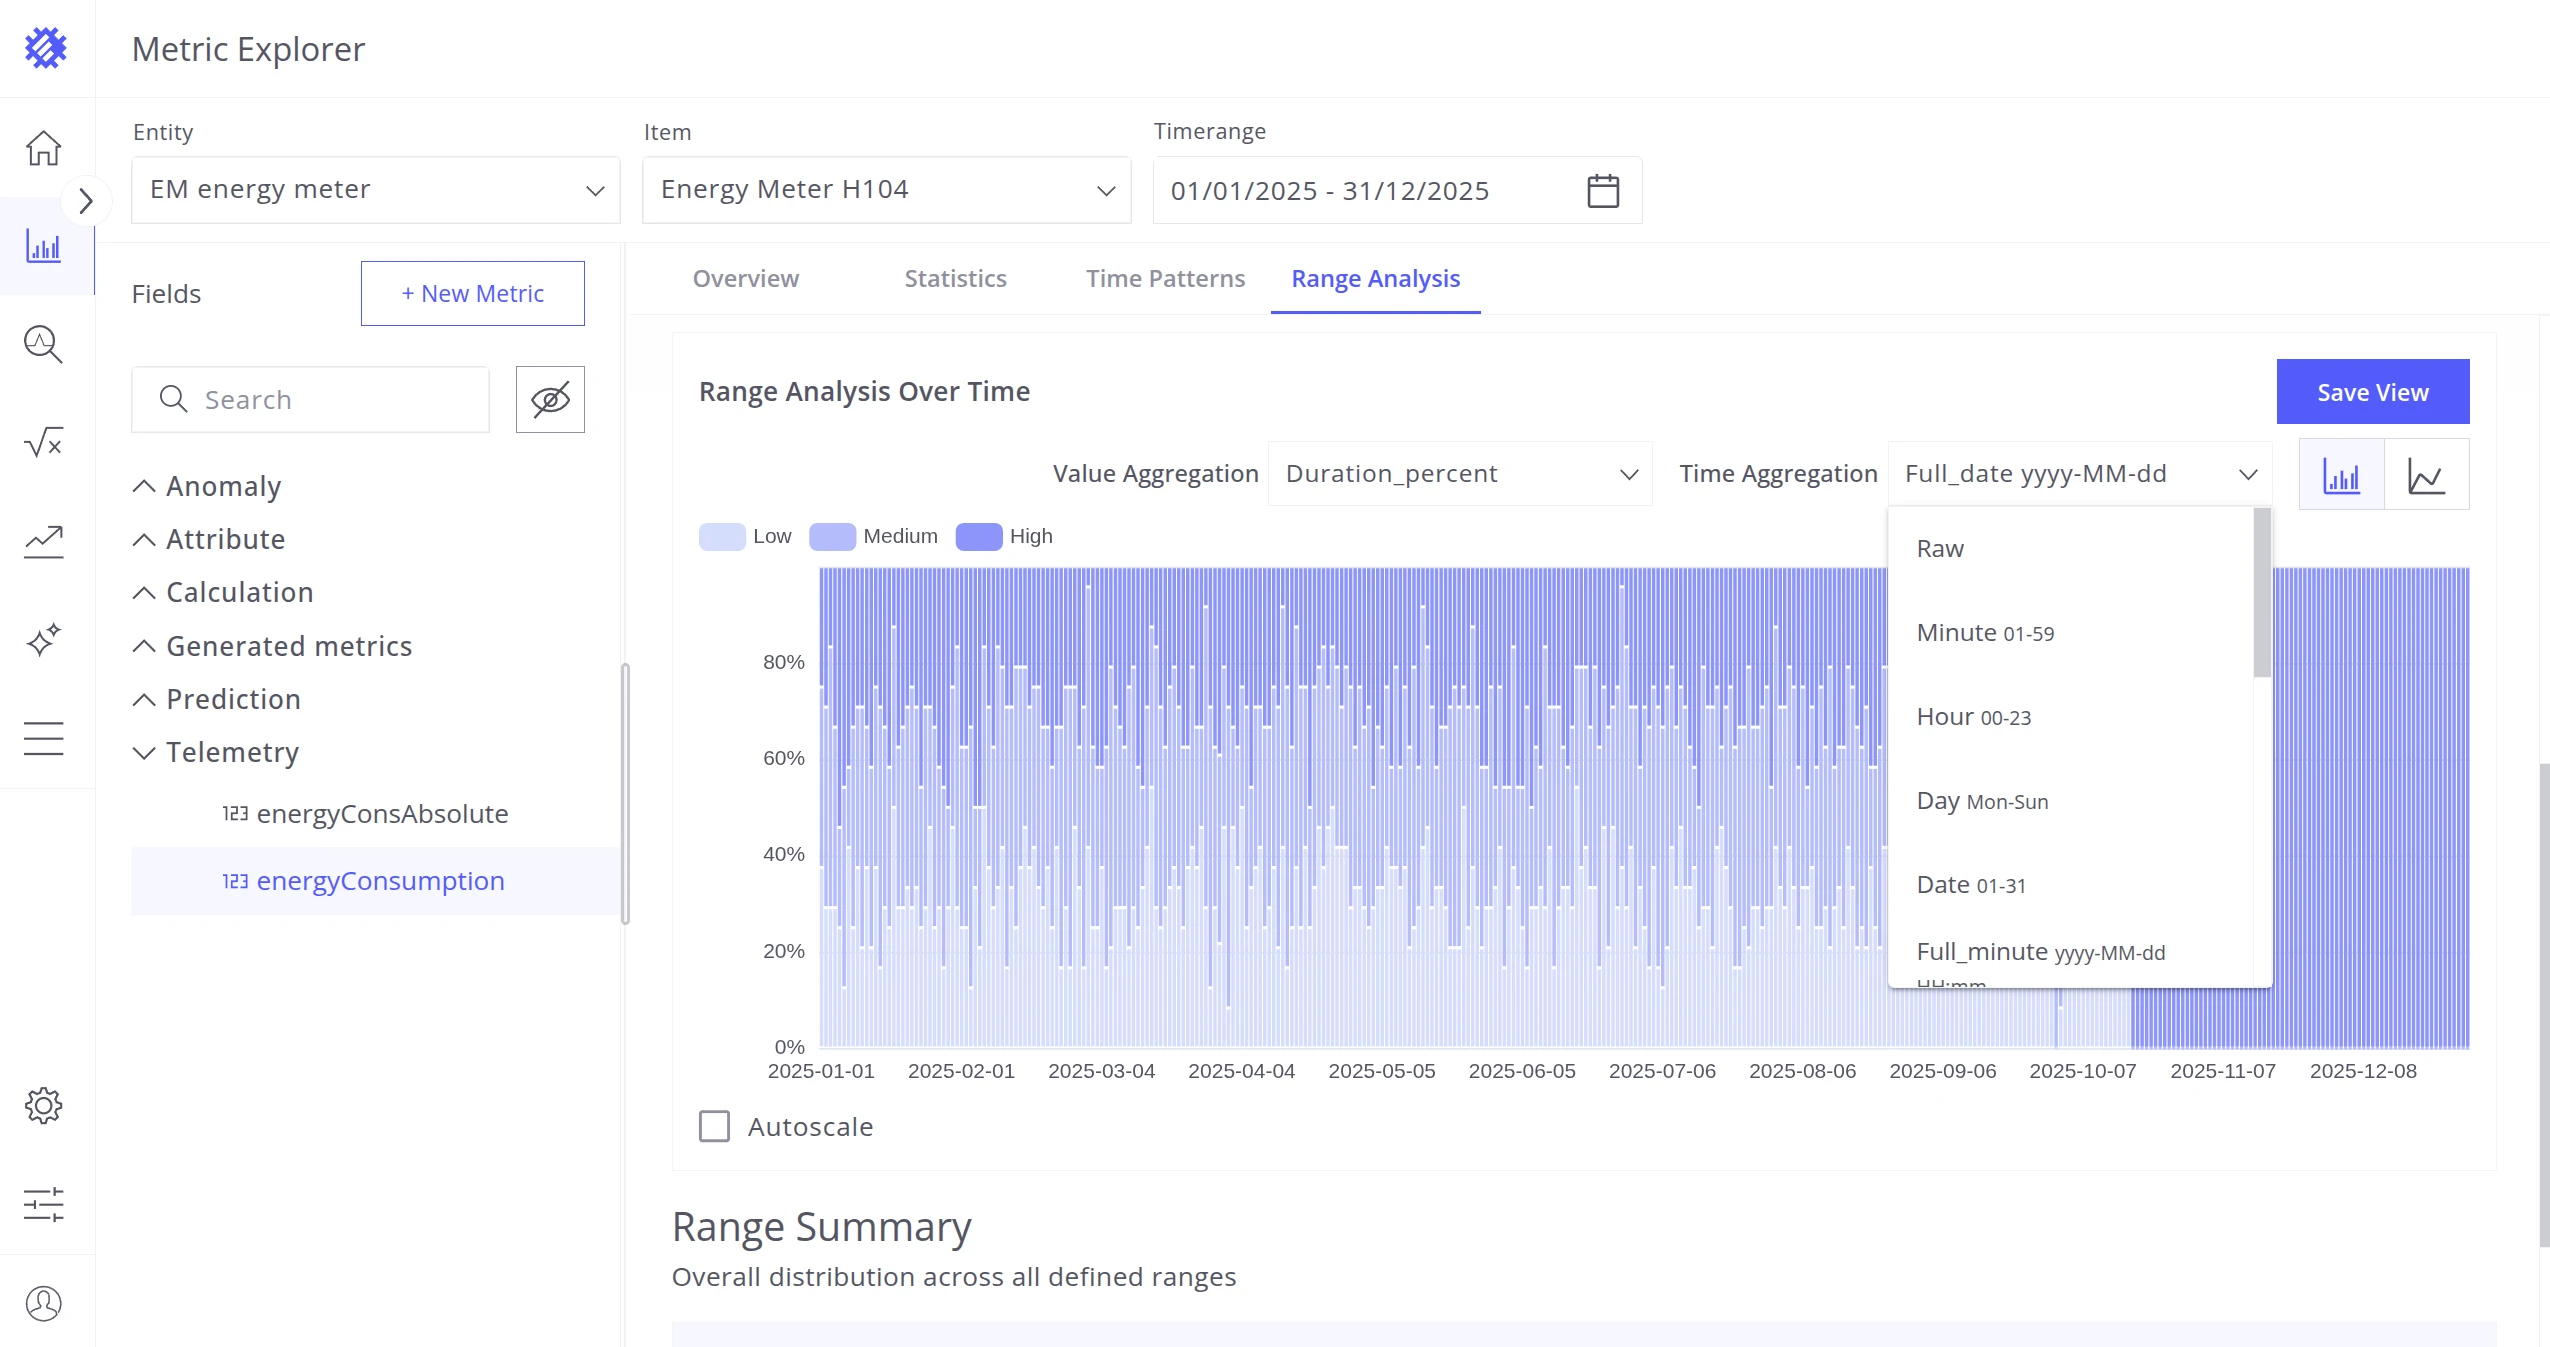
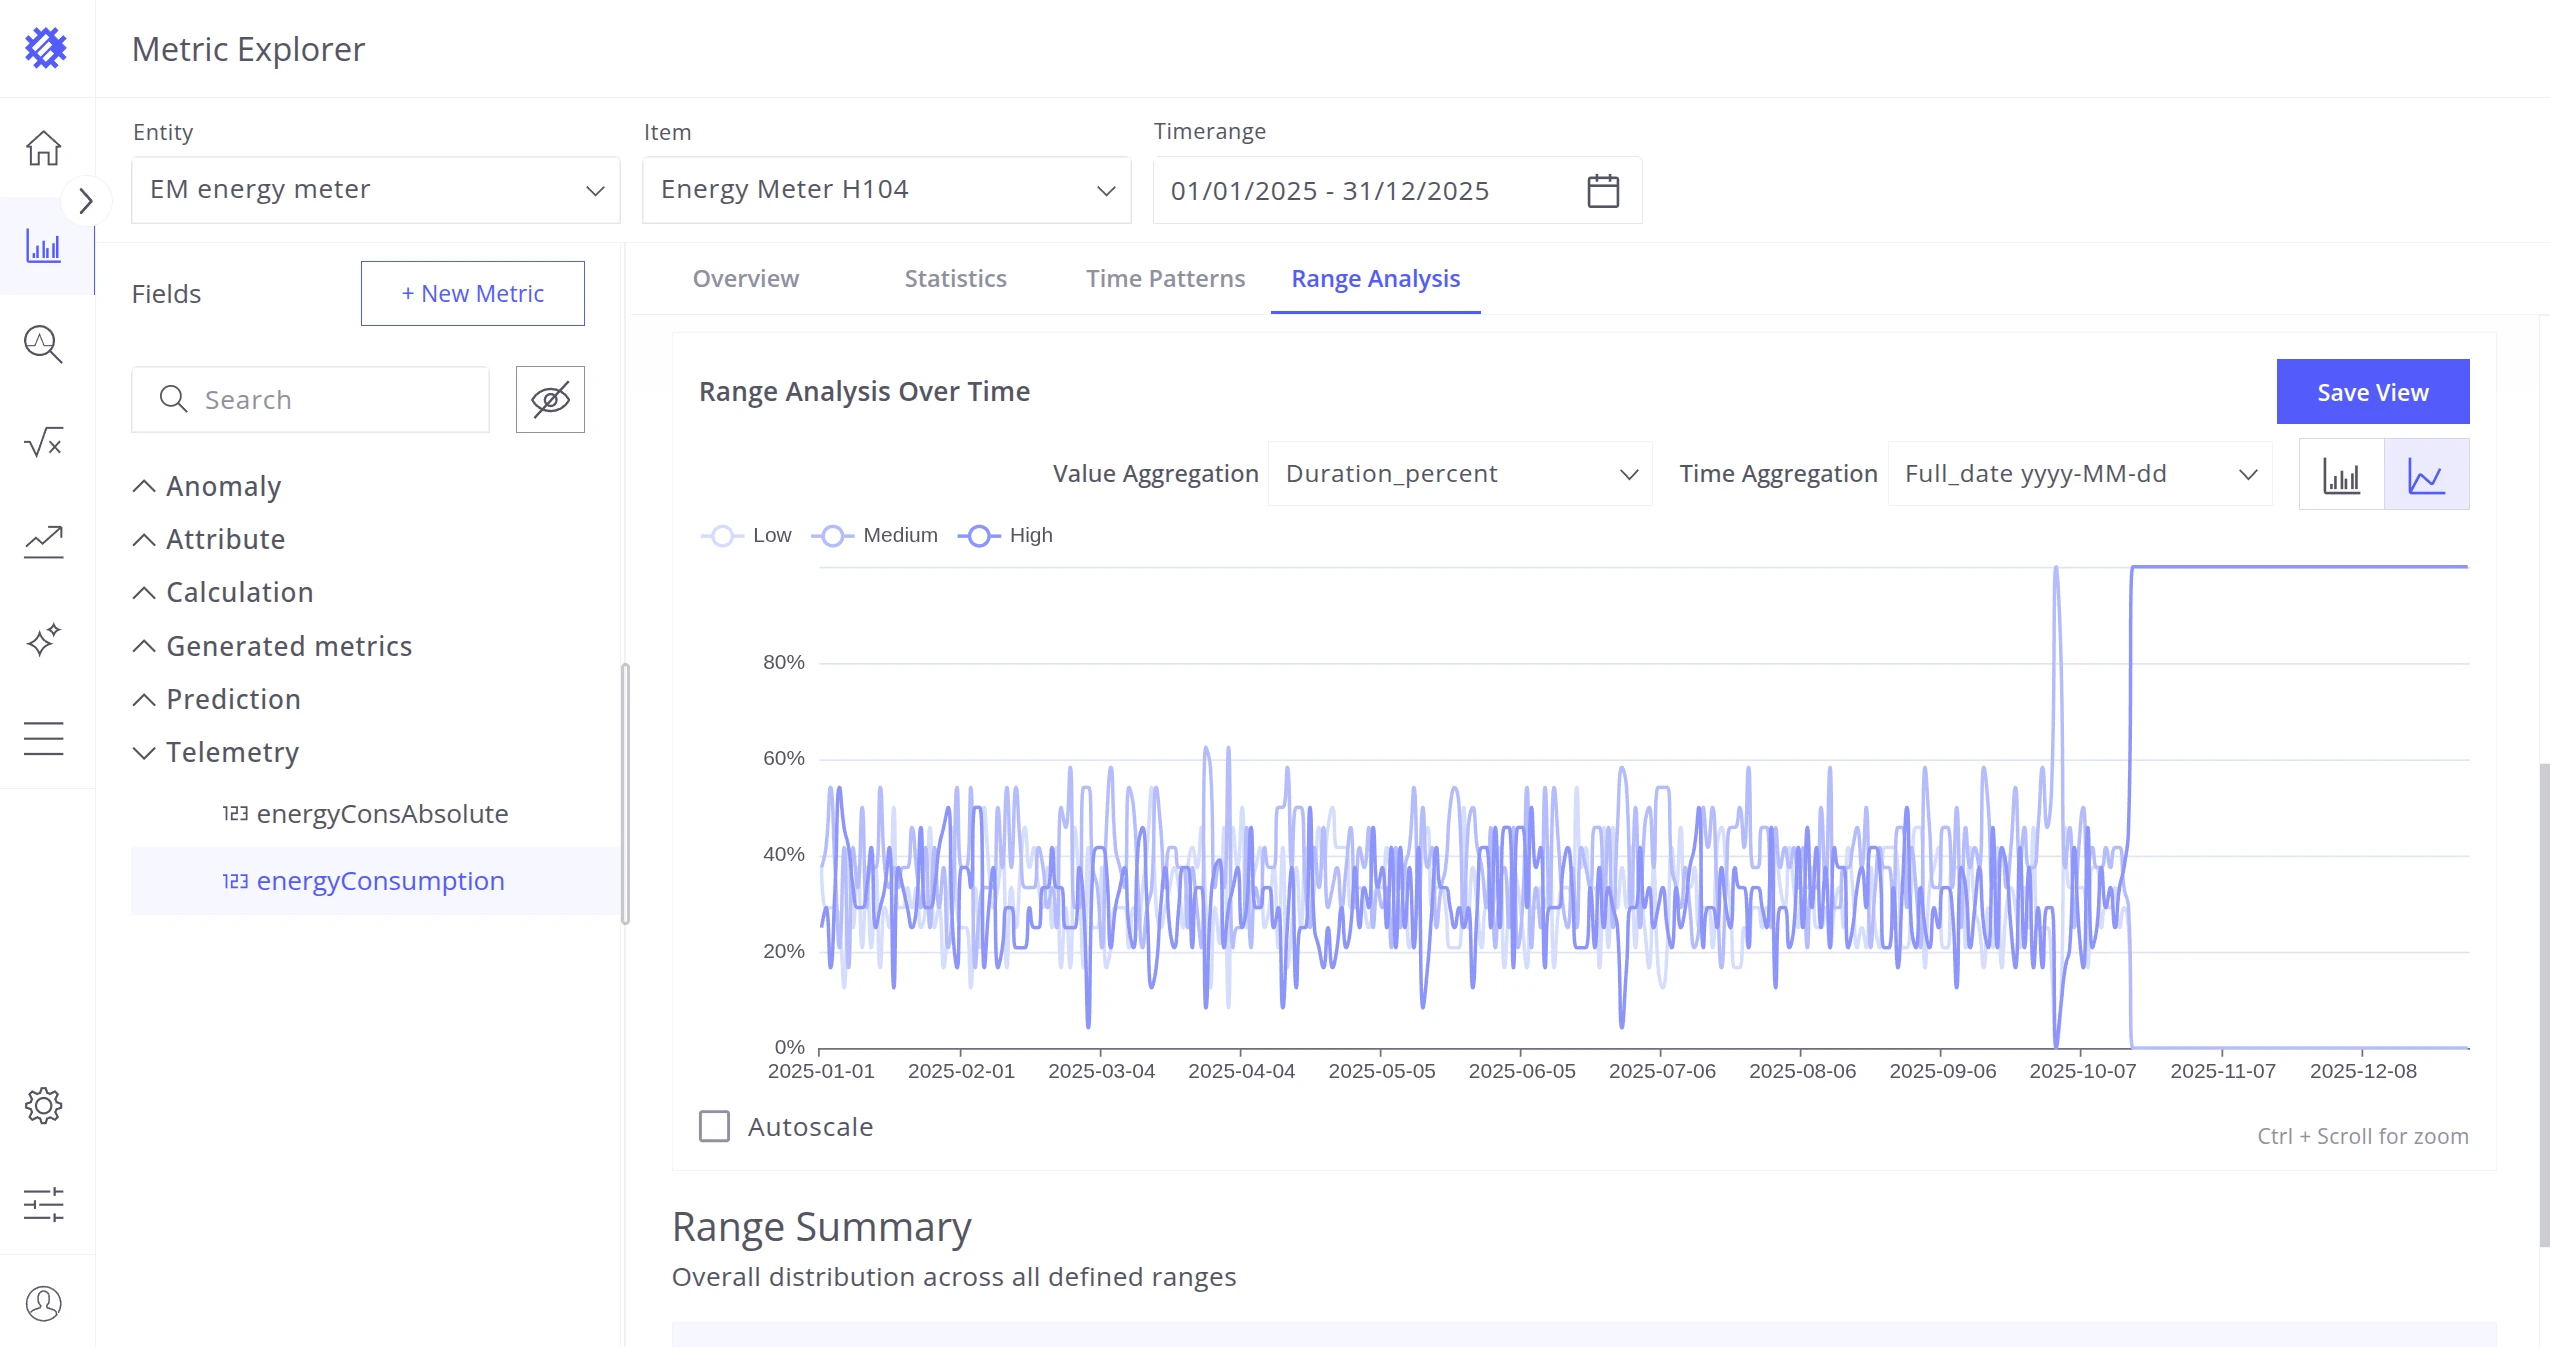
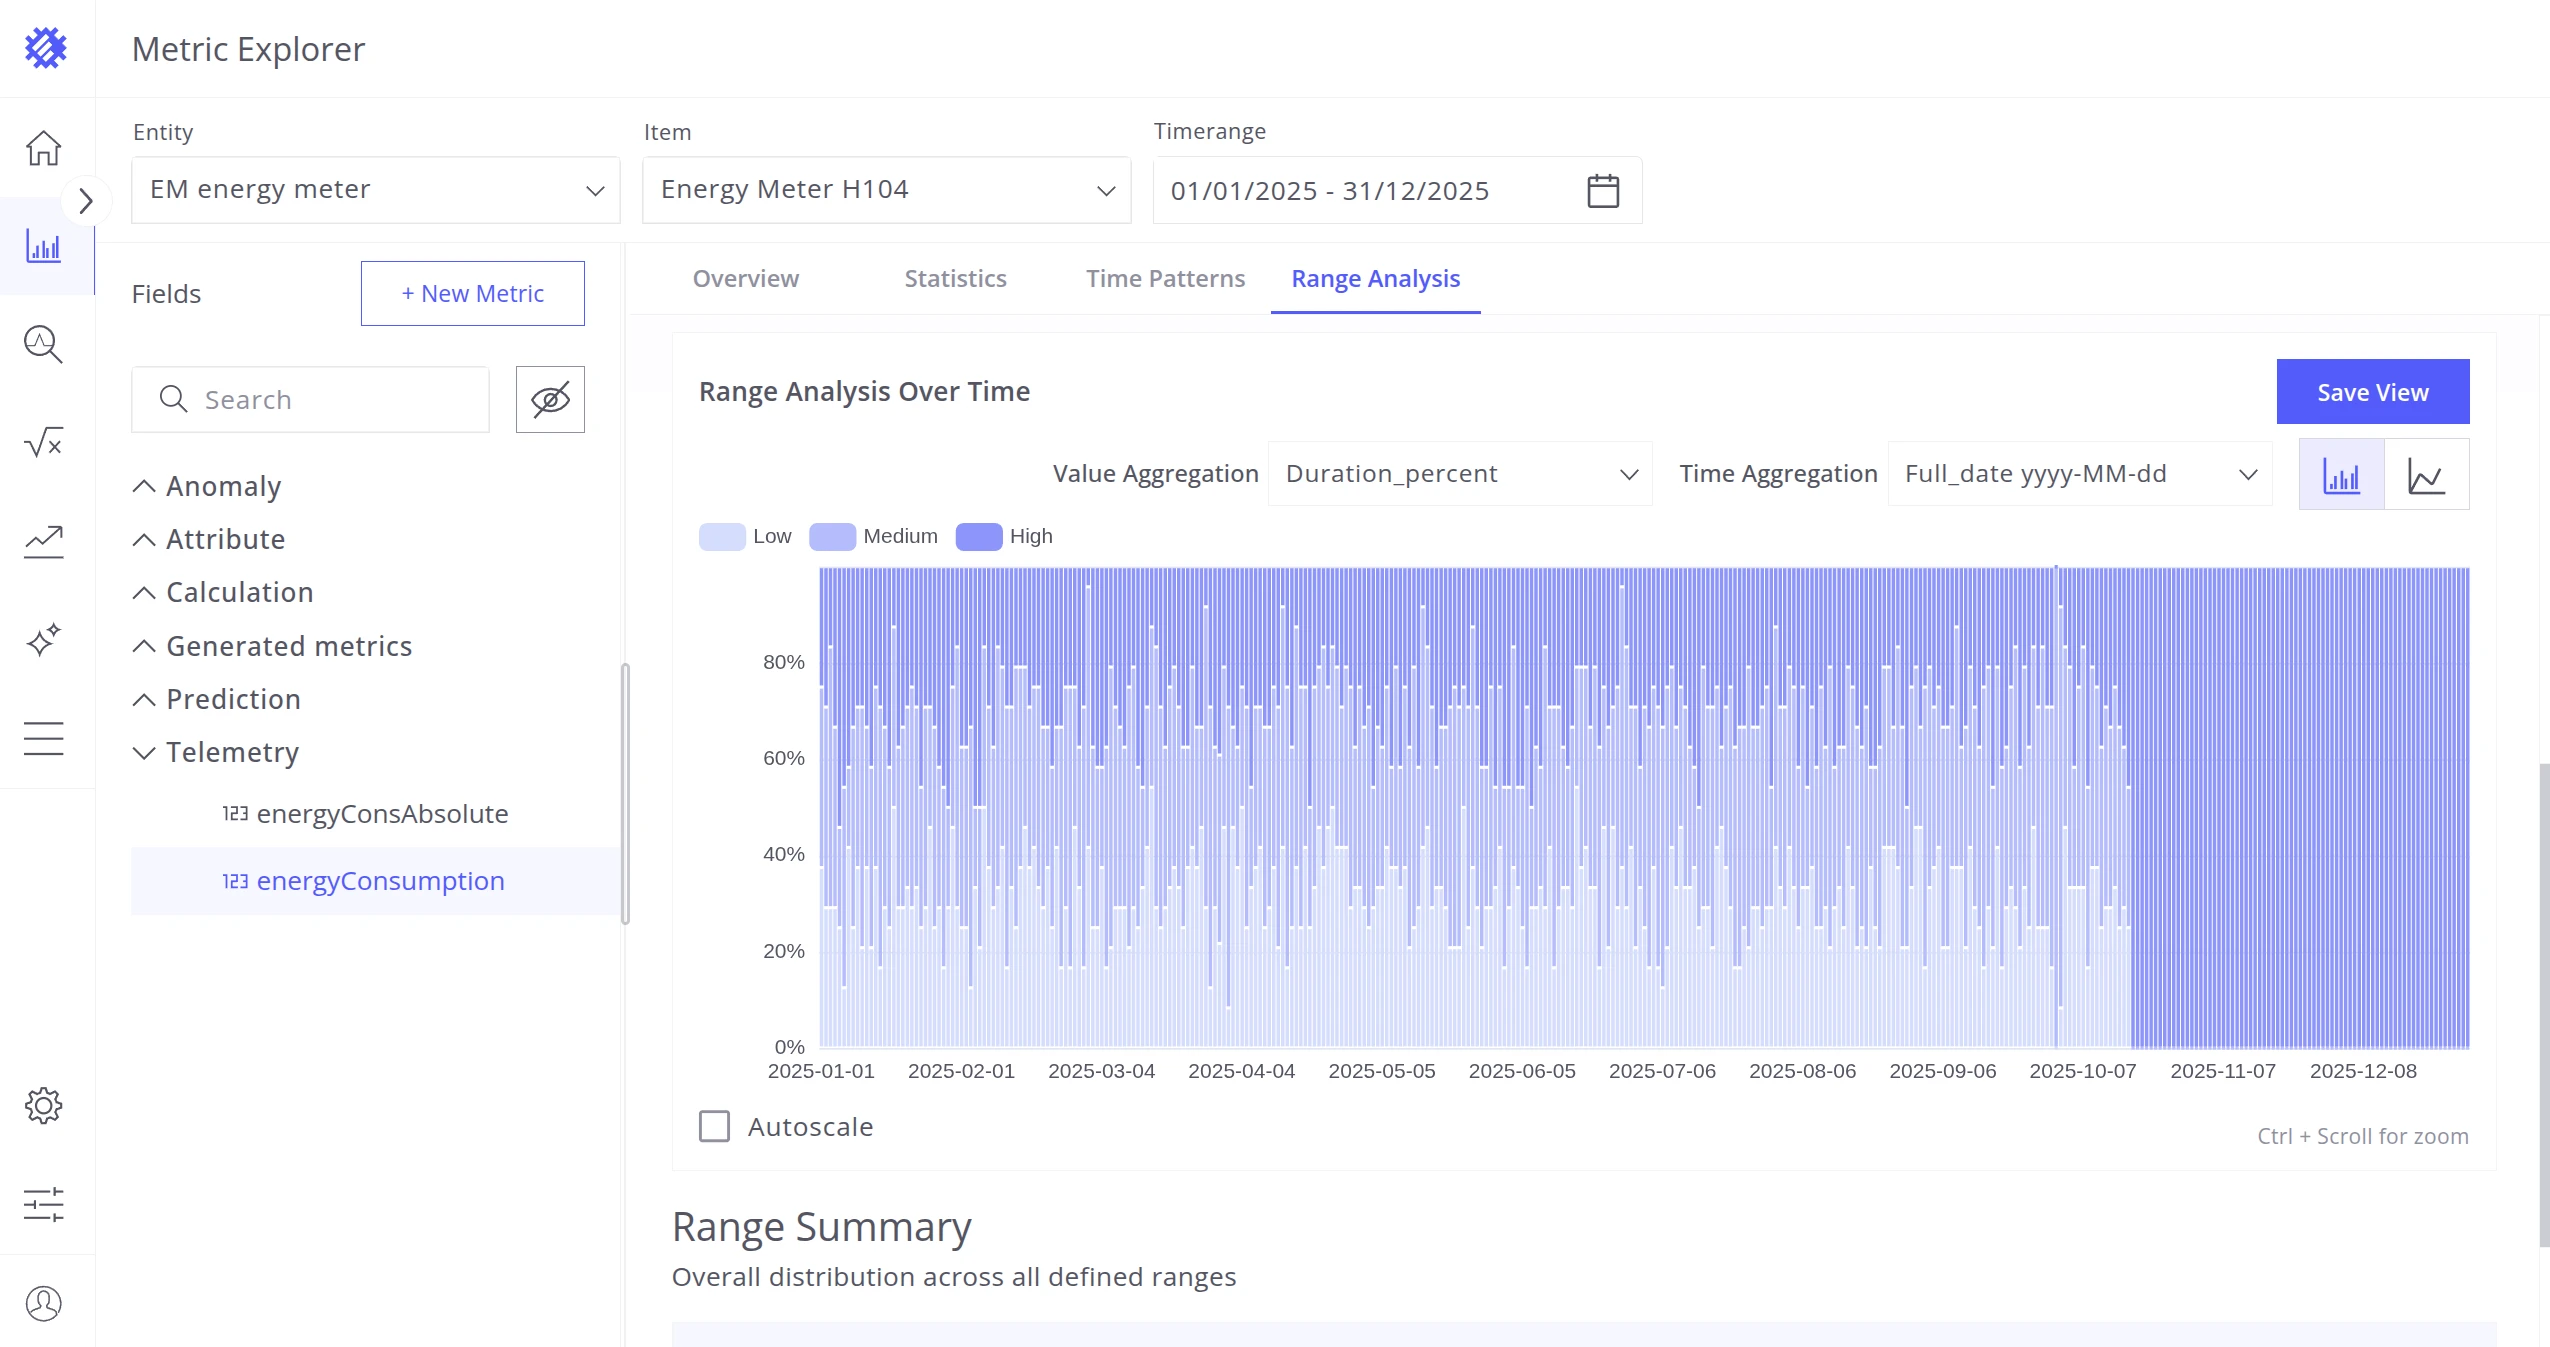
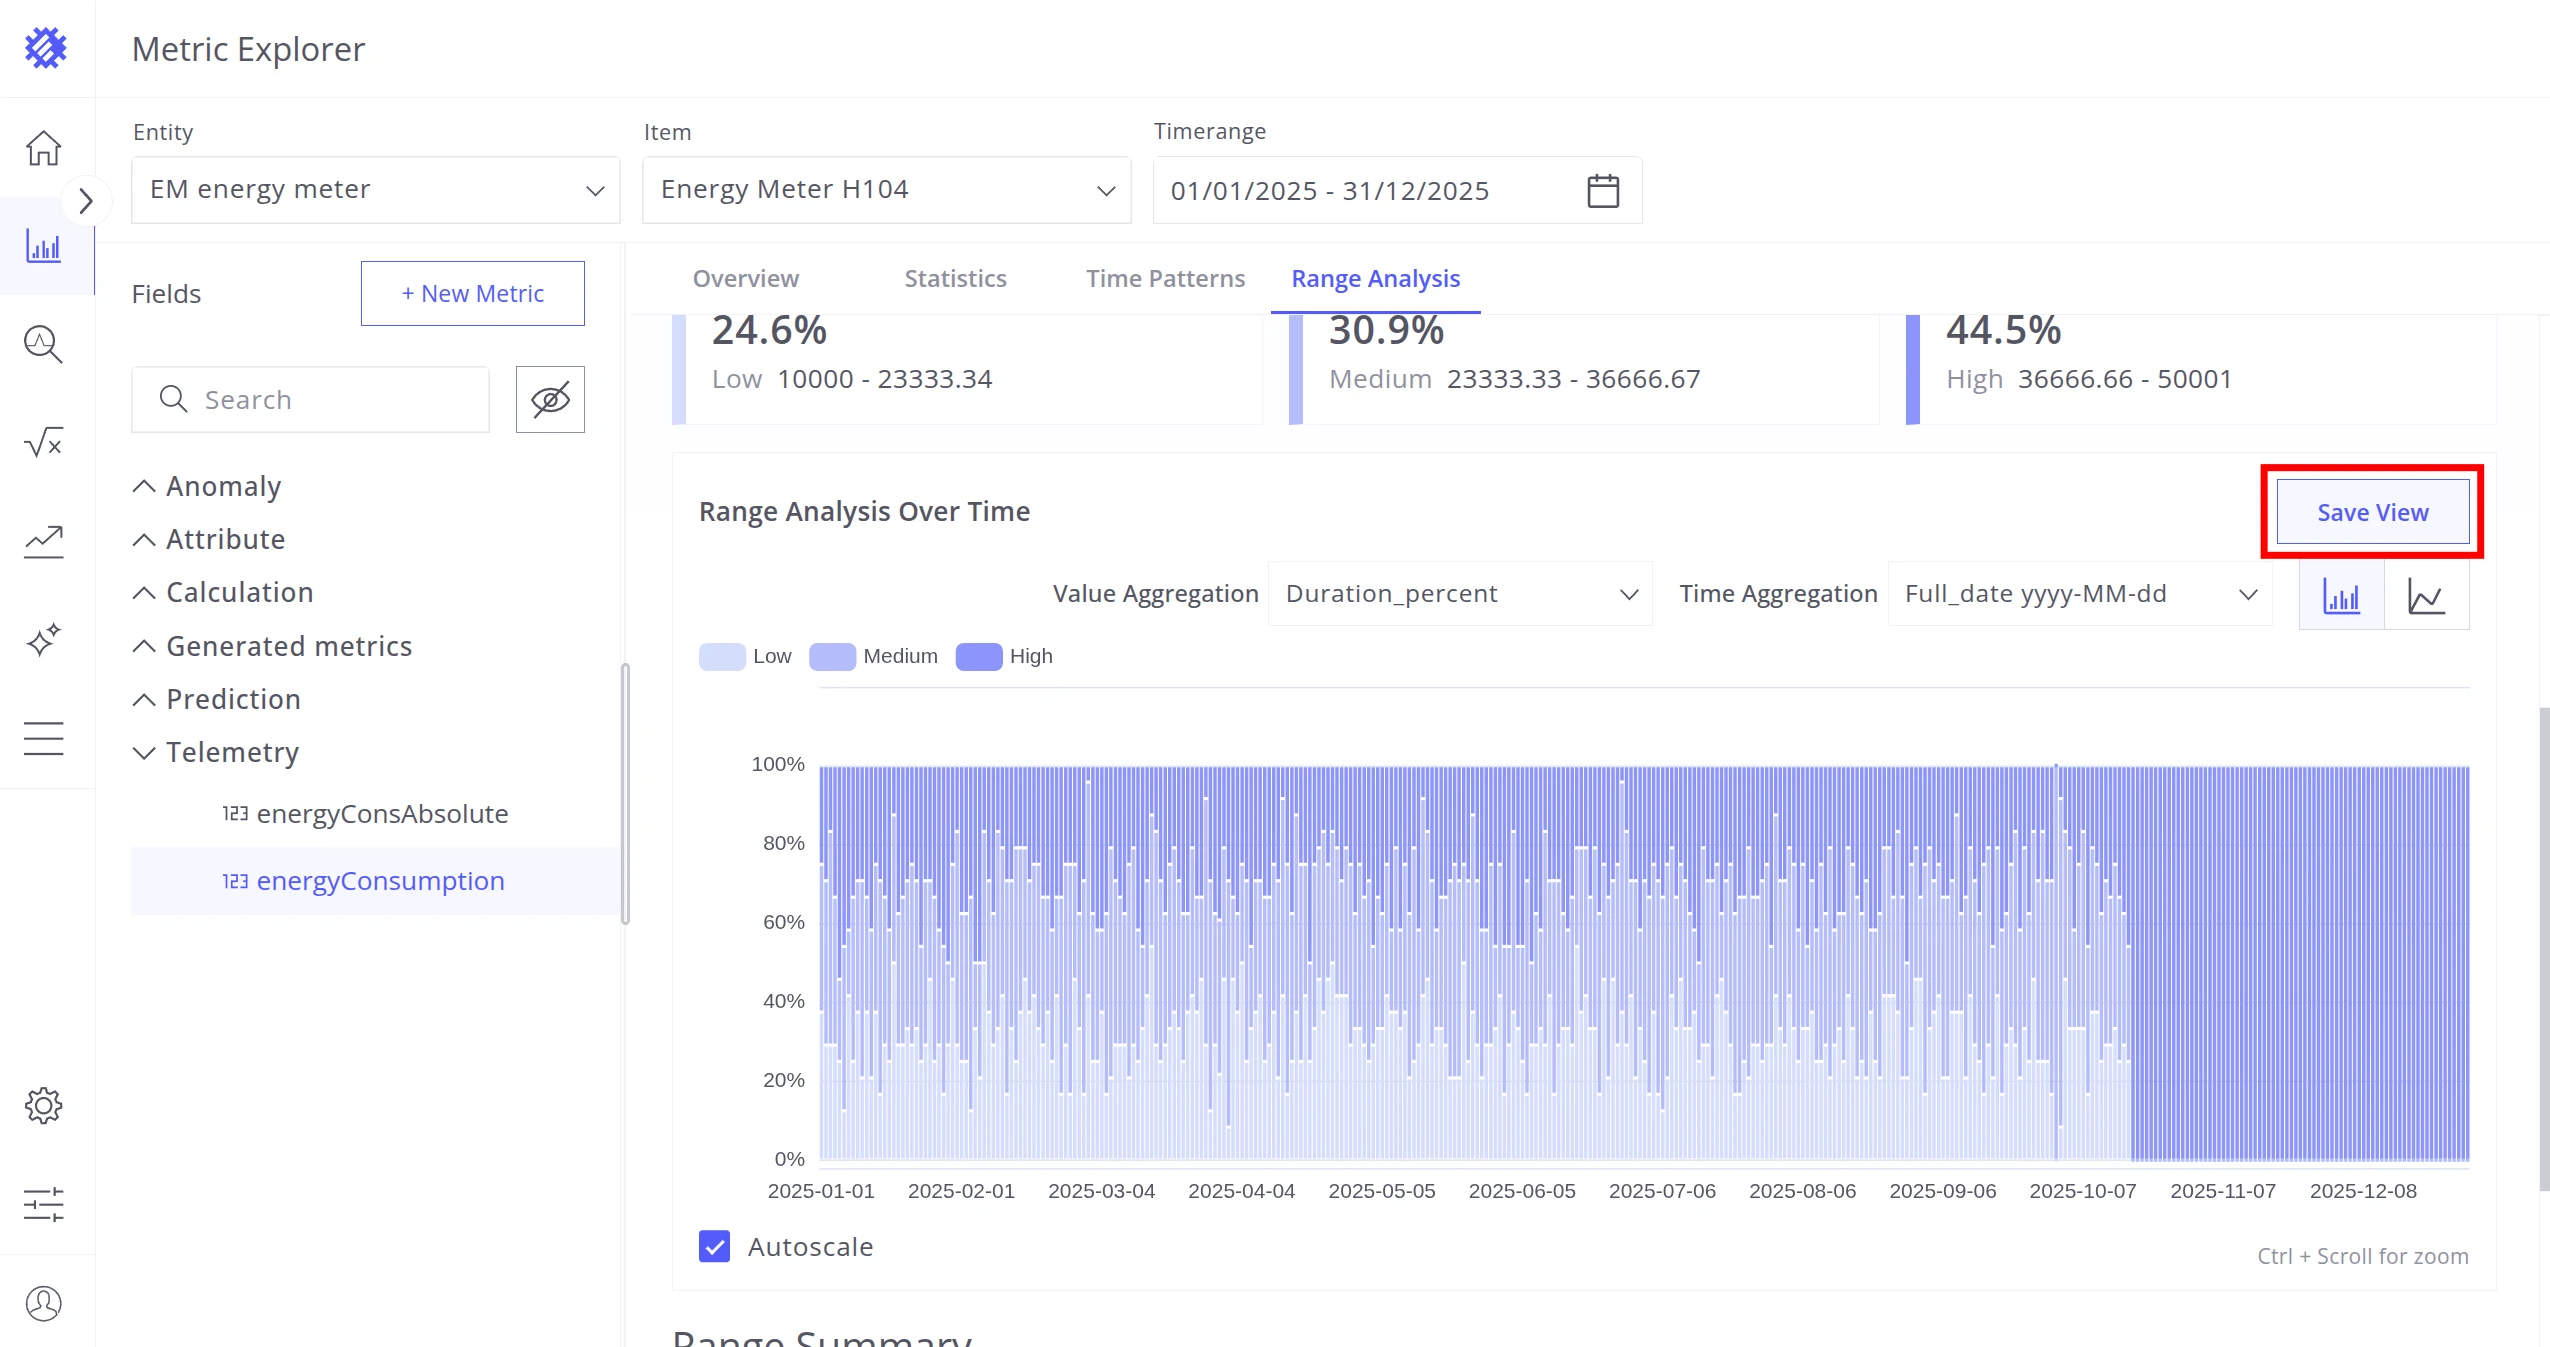
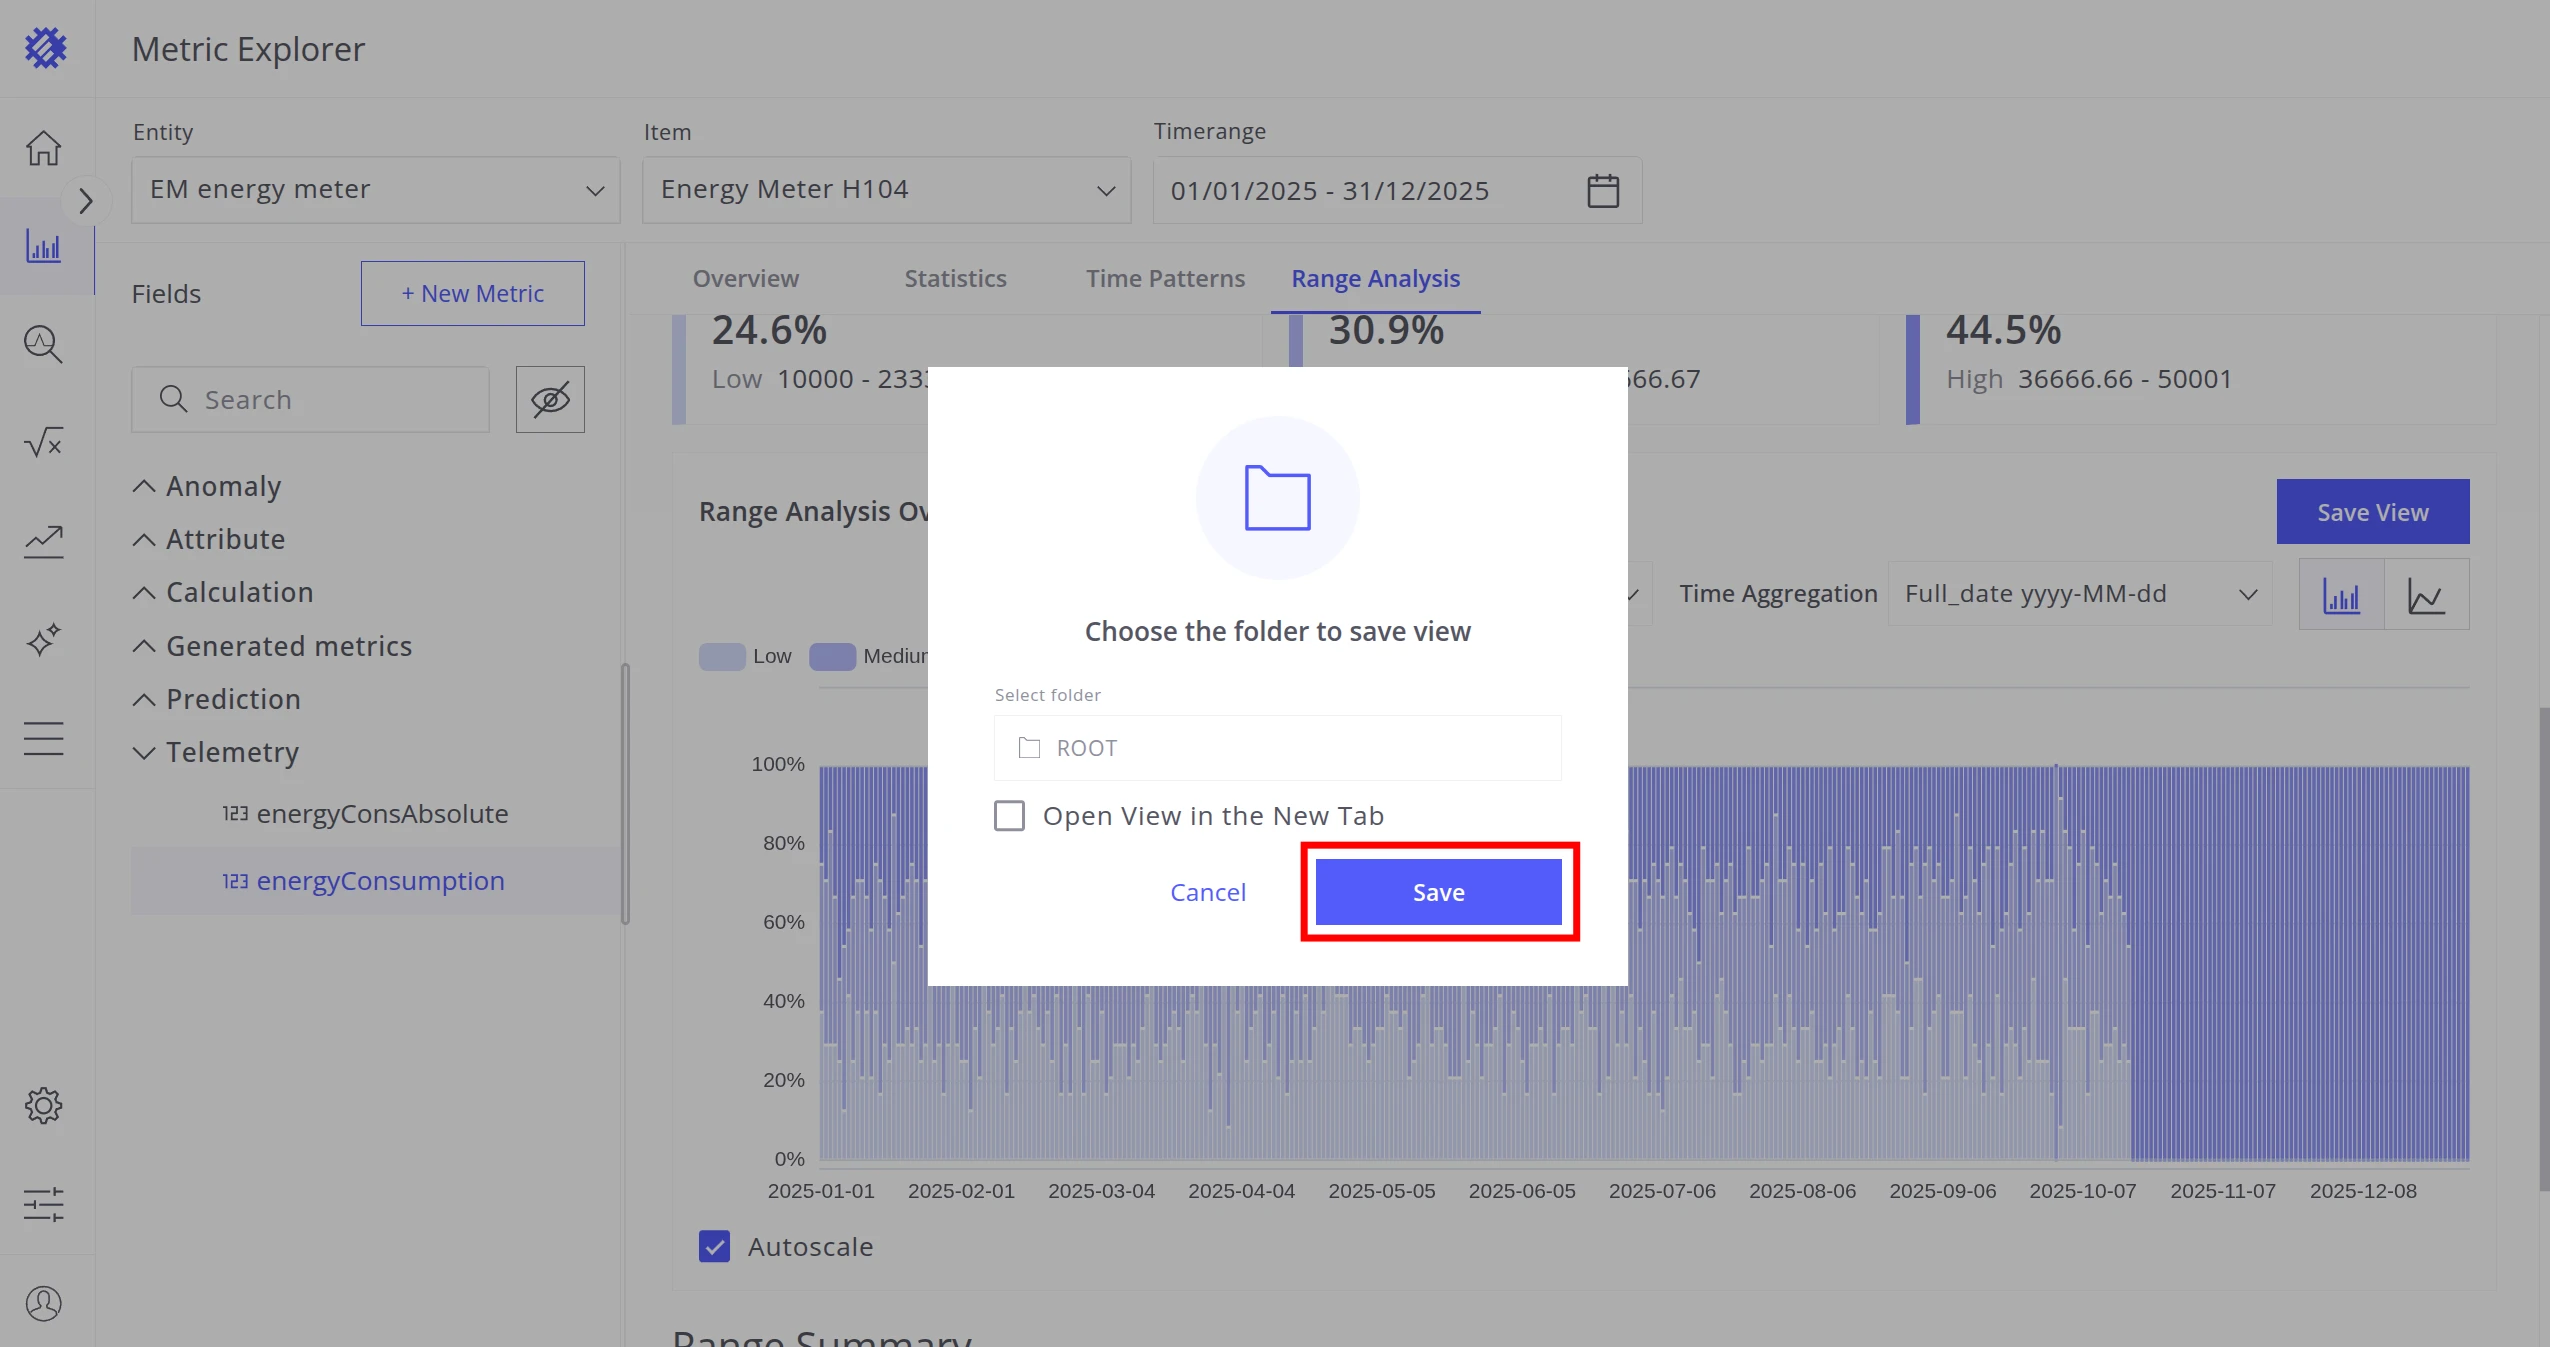
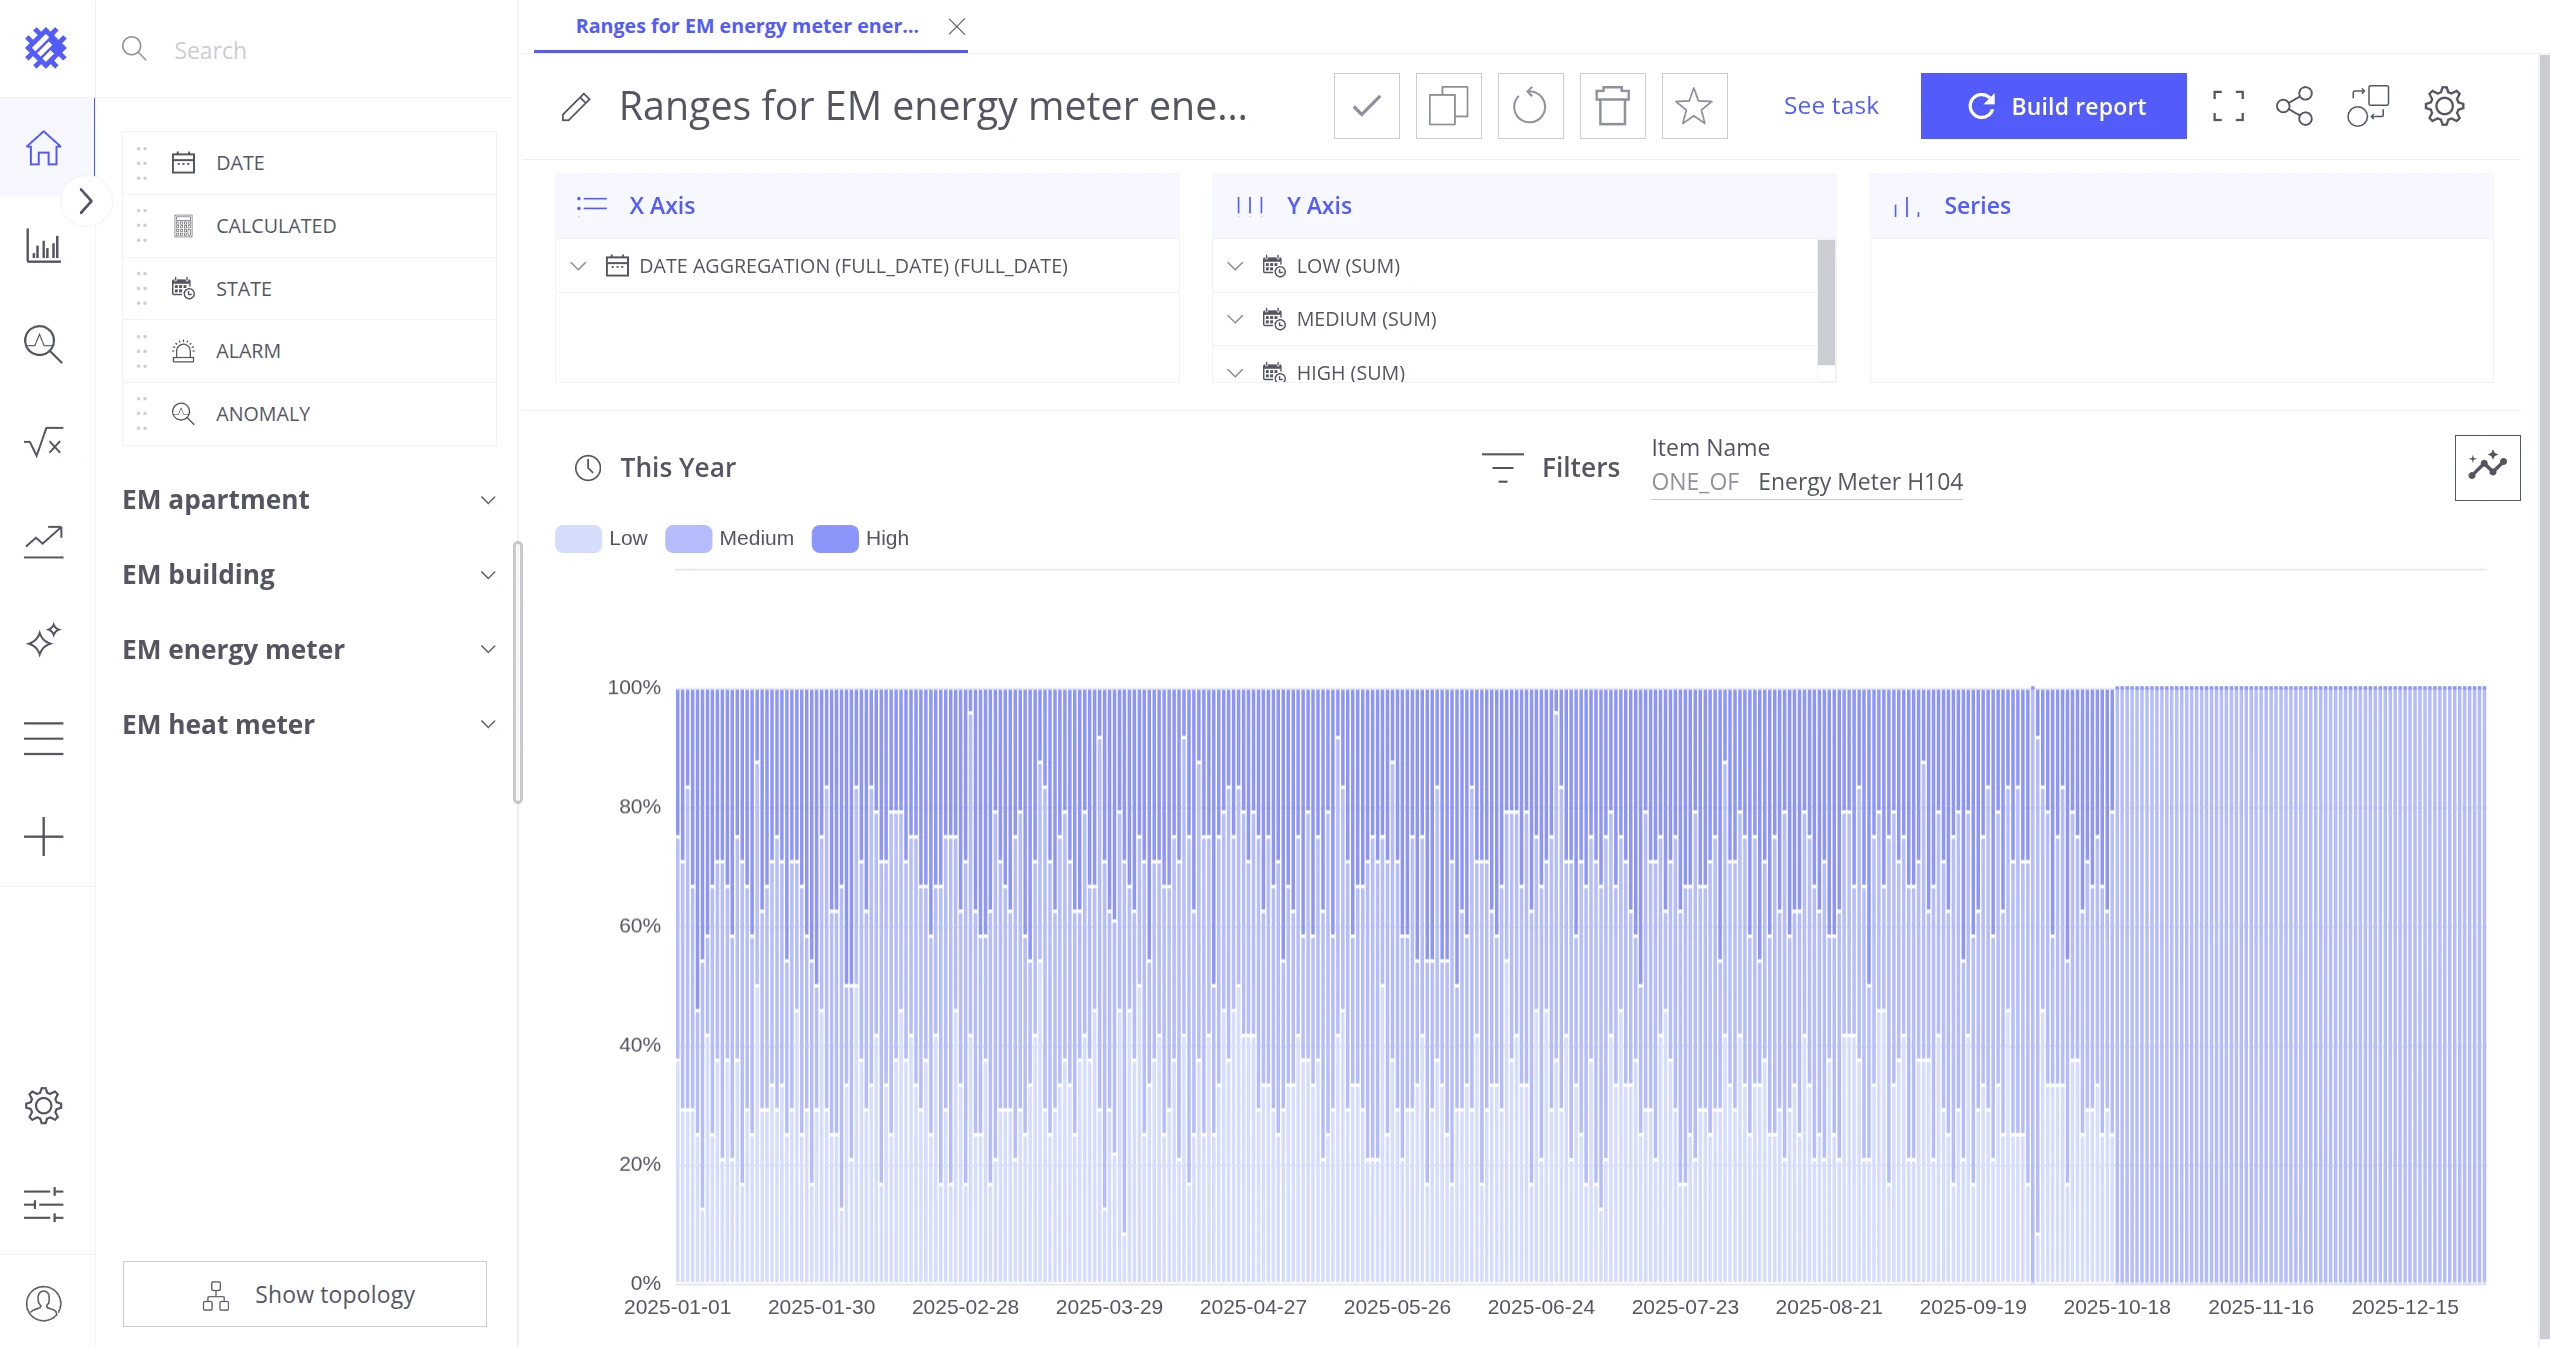
You can save a range configuration as a View using the Save View button, then embed it into a ThingsBoard dashboard. See Add View on Dashboard for details.
Was this helpful?