States
State fields let you classify device or asset readings into named states — such as Low, Moderate, or Critical — and then measure how much time was spent in each state. You write a JavaScript condition that returns true when the entity is in that state, and Trendz aggregates the duration across your chosen time window.
Simple State
Section titled “Simple State”In this example a Machine device reports how many details it produces. The goal is to track the production rate by splitting time into three states:
| State | Condition |
|---|---|
| Low Production | produced details < 75 |
| Moderate Production | produced details between 75 and 110 |
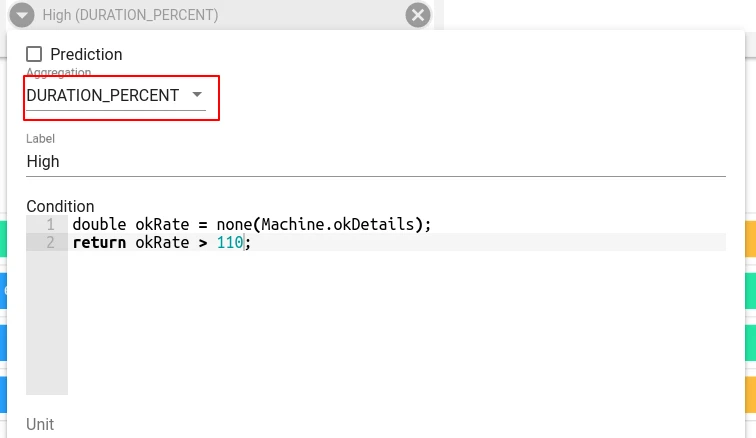
| High Production | produced details > 110 |
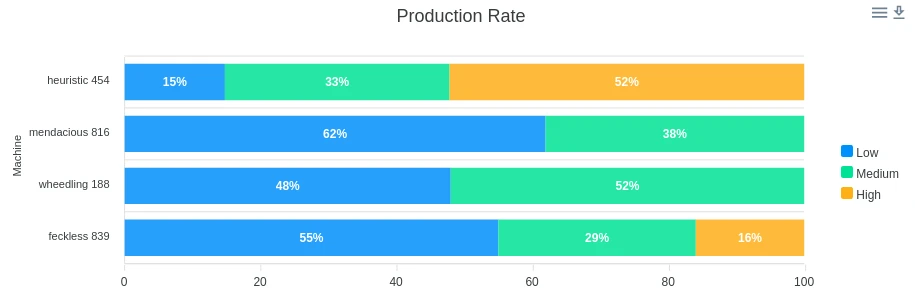
The condition for Low Production:
var okRate = none(Machine.okDetails);return okRate < 75;Steps to create this view:
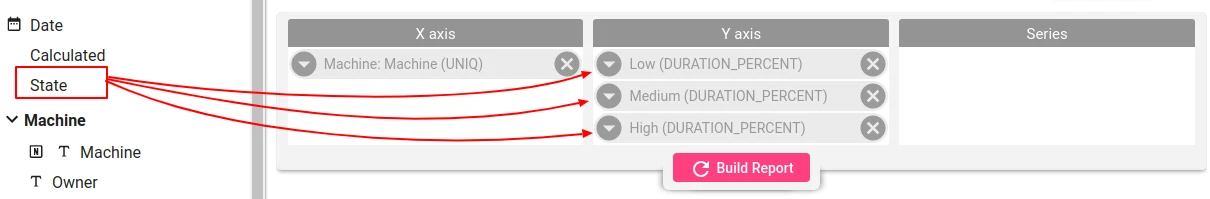
- Create a Bar chart.
- Add Date (RAW) to the X-axis.
- Add a State field; rename it Low Production.
- Set field aggregation to DURATION_PERCENT.
- Write the formula for Low Production.
- Repeat steps 3–5 for Moderate Production and High Production.
- In view settings, enable Stack mode, 100% Stacked Bar, and Labels.
State with Multiple Fields
Section titled “State with Multiple Fields”States can combine readings from multiple telemetry fields. In this example the goal is to find when machines enter a Critical state — high pressure combined with low rotation speed — and visualise how often this happens hour-by-hour across the week.
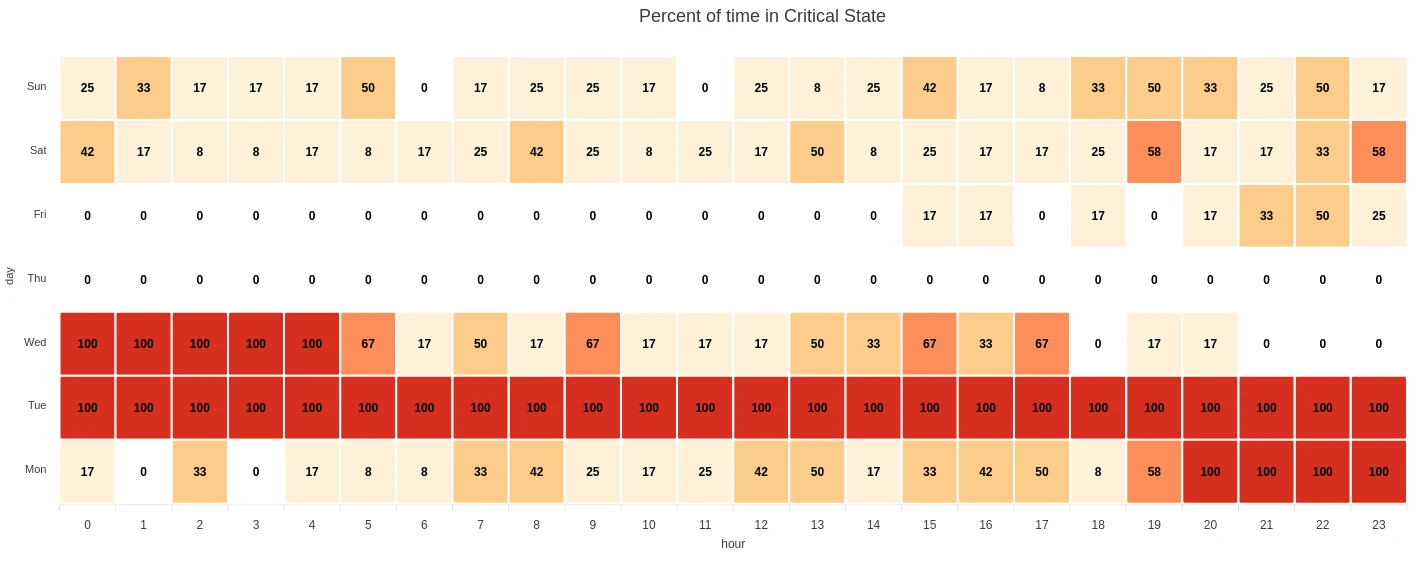
The condition for Critical state:
var pressure = none(Machine.pressure);var speed = none(Machine.rotationSpeed);return pressure > 700 && speed < 35;Steps to create this view:
- Create a Heatmap chart.
- Add a State field; rename it Critical.
- Set field aggregation to DURATION_PERCENT.
- Write the formula for Critical state.
- Set the By field to hour vs day of week.
State Aggregation
Section titled “State Aggregation”Two aggregation functions are available for state fields:
| Aggregation | Description |
|---|---|
| Duration | Total time spent in the state within a group, expressed in hours, minutes, or seconds. |
| Duration Percent | Percentage of the group’s total time that was spent in the state: (time_in_state / group_total_time) × 100. |
Reading Field Values in a Condition
Section titled “Reading Field Values in a Condition”To access a telemetry or attribute value inside a state formula, call an aggregation function:
var temp = none(Machine.temperature);none— the aggregation function (required).Machine— the entity name (asset type or device type).temperature— the field name.
All three parts are required. You cannot read a raw field value without an aggregation function.
For attributes, entity names, or owner names, use uniq() instead of none().
To compare a text field against a known value:
var currentState = none(machine.status);return "running" === currentState;Missing values
Section titled “Missing values”State is determined by the last received telemetry value. If no new data point arrives during an interval, Trendz assumes the most recently seen value is still in effect.
For example, if the condition is temperature > 25 and the last reading was 26, the state remains active until a new reading of ≤ 25 is received. Gaps in telemetry do not automatically end the state.
Execution
Section titled “Execution”State formulas are evaluated server-side by Trendz. They are not executed in the browser. Only visualization views support state fields — they cannot be used inside Calculation Fields or Prediction models.
Language
Section titled “Language”State field formulas can be written in JavaScript (ECMAScript 5.1) or Python (3.8+). You can use any standard language constructs: variable declarations, arithmetic, comparisons, logical operators, and string methods.
Was this helpful?