- Overview
- Architecture
- Integration Entity
- TBMQ (MQTT Broker) Component
- TBMQ Integration Executor Component
- Kafka (Internal Communication Layer)
- Downlink topic
- Uplink Topic
- Uplink Notifications Topic
- Integration Lifecycle
- Integration Message Processing Topic
- Message Delivery Error Handling & Retry Mechanism
- Hot Reinitialization of Failed Integrations
- Integration Metrics Overview
- Scalability and Fault Tolerance
- Supported Integration Types
- Roadmap
| Available since TBMQ Version 2.1.0 |
Overview
Integrations in TBMQ are the data bridges that allow you to forward MQTT messages from connected clients to external systems such as HTTP endpoints, Kafka brokers, or other MQTT brokers. This enables seamless data flow between IoT devices and the broader data infrastructure, allowing the MQTT broker to act as a central integration point in your architecture.
Why Use Integrations?
Integrations make MQTT data useful outside the broker. They help you:
- Bridge MQTT messages to external systems for processing, storage, or analytics.
- Enable interoperability between MQTT and other protocols.
- Build complex event-driven workflows across different platforms.
- Maintain modularity and scalability in your IoT architecture.
High-Level Design
At a high level, the integration flow in TBMQ works like this:
- MQTT clients connect to the TBMQ broker using MQTT or MQTTS and publish messages.
- When a message matches an integration topic filter (MQTT subscription), TBMQ sends the message to the TBMQ Integration Executor using Kafka.
- The Integration Executor receives the message, processes it, and forwards it to the correct external system, such as:
- An HTTP endpoint over HTTP or HTTPS.
- Another MQTT broker over MQTT or MQTTS.
- A Kafka broker using the Kafka binary protocol over TCP or TLS.

New microservice
TBMQ uses a dedicated microservice called TBMQ Integration Executor (shortened as “TBMQ IE”) to manage and run integrations.
With this feature, TBMQ supports two service types defined by the TB_SERVICE_TYPE environment variable:
- tbmq – the core MQTT broker service;
- tbmq-integration-executor – the integration execution service (tbmq-ie).
The Integration Executor service listens for integration events and messages from TBMQ (via Kafka), processes them based on the integration configuration, and forwards the data to the external system. You can deploy multiple Integration Executor microservices within your TBMQ cluster to ensure scalability and fault isolation.
This architecture ensures clear separation of concerns, high availability, and improves scalability and system performance.
Deployment Options
In TBMQ, integrations can only be deployed using Integration Executor microservice.
Why Not Embedded in the TBMQ?
We intentionally do not embed integration logic inside the TBMQ broker. This decision provides several key benefits:
- Isolation: Failures or slow responses from external systems (e.g., HTTP endpoints) do not affect MQTT message processing in the broker.
- Scalability:
tbmq-ieinstances can be scaled independently based on load, without impacting the performance of the broker. - Resilience: Each Integration Executor can restart or fail independently without interrupting the core MQTT services.
- Extensibility: New integration types or improvements can be added to the Integration Executor without changing the broker itself.
- Clear separation of responsibilities: The broker handles MQTT protocol logic, while the Integration Executor focuses on data delivery to external systems.
Architecture
In this section, you’ll learn how TBMQ and the Integration Executor communicate internally, how data flows between components, and how the system remains scalable and fault-tolerant under load.
Integration Entity
Integration objects have corresponding entities that are stored in the TBMQ’s PostgreSQL database. They are mainly used for the TBMQ Web UI - to view and manage the integrations. Each integration entity includes basic fields like:
- Type – HTTP, Kafka, or MQTT.
- Name – a human-readable name.
- Enabled – whether the integration is enabled or disabled.
- Status – actual status of the integration:
- Disabled: Not active.
- Active: Running and processing messages.
- Failed: Encountered connection failure.
- Pending: Waiting for validation and activation.
- Configuration – contains connection details and parameters for the external system.
- Topic filters – define MQTT-based subscriptions and act as triggers. When a broker receives a message matching a topic filter, the integration is triggered and forwards it to the configured external system.
You can configure multiple integrations with different types, topic filters, and target systems. Each integration operates independently and can be enabled or disabled at any time.
An example of MQTT integration (partial configuration):
1
2
3
4
5
6
7
8
9
10
11
12
13
14
15
16
17
18
{
  "id": "3e3abdb2-12f9-4850-a654-50a0c8dbbed6",
  "name":"MQTT integration",
  "type":"MQTT",
  "enabled":true,
  "configuration":{
    "topicFilters":[
      "tbmq/#"
    ],
    "clientConfiguration":{
      "host":"10.7.3.148",
      "port":1883
    }
  },
  "status":{
    "success":true
  }
}
TBMQ (MQTT Broker) Component
The core TBMQ service (TB_SERVICE_TYPE=tbmq) is responsible for handling MQTT protocol logic, including client connections, subscriptions, and message routing.
It also manages integration entities by processing create, update, and delete requests and storing them in the database.
Additionally, it sends integration validation requests (for validating configuration or connection checks) to TBMQ IE and publishes integration configuration events to TBMQ IE.
Finally, it matches incoming MQTT messages against integration subscriptions and forwards them to TBMQ IE when applicable.
The broker is stateless with respect to Integration Executor and can be scaled horizontally to handle increasing MQTT traffic.
TBMQ Integration Executor Component
The Integration Executor (TB_SERVICE_TYPE=tbmq-integration-executor) is a standalone microservice responsible for receiving and processing validation requests from TBMQ, then sending back responses.
It also manages the full integration lifecycle based on configuration events (create, update, or delete).
Additionally, it executes integration logic, including retry mechanisms, timeout handling, and backpressure control.
It delivers MQTT messages to the configured external system, such as HTTP, Kafka, or MQTT.
It also sends lifecycle, error, and statistics integration events back to TBMQ.
This component operates independently of the broker and can be scaled separately. It ensures that delays or failures in external systems do not affect the broker’s ability to process MQTT traffic.
Kafka (Internal Communication Layer)
Kafka acts as the bridge between the TBMQ brokers and Integration Executors. It enables reliable delivery of integration-related events between services. It also provides buffering of messages in case of component downtime, processing delays, or spikes in load. Additionally, it supports scalable and parallel processing by allowing multiple broker and executor instances to work concurrently.

TBMQ and its Integration Executor microservices communicate asynchronously over Kafka using multiple dedicated topics. Each topic serves a specific purpose and allows for decoupled, reliable, and scalable data flow between the components.
- tbmq.ie.downlink.$integrationType — Compact topic used to send integration configurations and validation requests from TBMQ to IE ($integrationType can be ‘http’, ‘mqtt’, or ‘kafka’).
- tbmq.ie.uplink — Topic for sending lifecycle events, statistics, and errors from IE back to TBMQ.
- tbmq.ie.uplink.notifications.$serviceId — Topic used for sending validation responses and other one-off replies to the correct TBMQ node (identified by $serviceId).
- tbmq.msg.ie.$integrationId — Per-integration message processing topic used to forward MQTT messages from TBMQ to the IE ($integrationId is the UUID of the integration entity).
Downlink topic
TBMQ uses Kafka compact topics for downlink communication. Each integration type has its own dedicated topic:
tbmq.ie.downlink.httptbmq.ie.downlink.mqtttbmq.ie.downlink.kafka
These topics are used to deliver integration configuration data when an integration is created, updated, or deleted. They are also used to trigger connection and validation requests to test the connectivity to the external system and validate the configuration before activation.
How It Works
- Integration lifecycle events (create, update, delete) are published to the relevant downlink compact topic, based on integration type (e.g.,
tbmq.ie.downlink.httpfor HTTP integration). - Kafka’s log compaction mechanism keeps only the most recent configuration per integration ID, discarding outdated messages.
- On startup or partitions reassignment, the
tbmq-ieinstance enters restoration mode:- Seeks to the beginning of the assigned topic partitions.
- Restores the latest state of all relevant integrations from the compacted records.
- Skips all validation requests since they were already processed in the past.
- Once the end of the partition is reached the restoration is complete, it transitions to real-time mode and begins normal operation.
- Integrations are only initialized after their latest configurations are fully restored from Kafka.
- In real-time mode, new integration events are handled immediately. Validation requests are processed on the fly.
- On shutdown or partitions revocation, the
tbmq-ieinstance stops the affected integrations and cleans up underlying resources such as protocol clients and connections.
Benefits of This Approach
Resilience ensures that TBMQ IE can fully recover after restarts without requiring external configuration stores. Consistency guarantees that it always works with the latest valid configuration, avoiding stale or conflicting states. Scalability is achieved through a stateless service design, with all configuration state persisted in Kafka. Reduced Load means that only changed configurations are written, eliminating the need to resend the full configuration set repeatedly.
This pattern provides a durable, distributed configuration source backed by Kafka, enabling reliable and scalable integration execution across multiple TBMQ IE instances.
Why Separate Topics?
Although downlink topics are not used for message processing (which is useful for parallel processing), separating them by integration type provides several key benefits:
- Executor Specialization: You can assign specific Integration Executor instances to process only certain integration types using the
TB_SERVICE_INTEGRATIONS_SUPPORTEDandTB_SERVICE_INTEGRATIONS_EXCLUDEDenvironment variables. - Targeted Consumption: Executors subscribe only to topics they are configured to handle.
- Improved Isolation: Different integration types often have different configuration payloads and validation logic. Dedicated topics ensure that only relevant messages are received by each executor.
- Operational Simplicity: Easier to debug and monitor traffic per integration type.
- Flexible Scaling: Each topic can be tuned individually (e.g., partitions, retention) based on the specific load characteristics of each integration type.
This design empowers admins to deploy specialized executor instances — for example, running only HTTP integrations in one pool and Kafka in another — giving you flexibility, isolation, and efficiency at scale.
Uplink Topic
This topic is used by Integration Executors to send important events back to the TBMQ broker. This includes:
- Lifecycle events (e.g., integration started or stopped).
- Errors (to report failed message deliveries to external systems).
- Statistics (such as success/failure processing counts).
All messages received on this topic are stored in the TBMQ database as Event entities and used for internal tracking, diagnostics, and administrative visibility.
Uplink Notifications Topic
These node-specific topics are used by Integration Executors to send direct replies to specific TBMQ nodes, typically in response to one-time operations. The topic is dynamically constructed using the target node’s service ID. For example, they are used to reply to “Check Connection” requests and to send validation results or error details back to the initiating TBMQ node.
This mechanism ensures that responses are routed to the correct instance in clustered environments and maintains accurate request-response correlation.
Integration Lifecycle
The lifecycle of an integration in TBMQ includes its creation, update, deletion, execution, monitoring, and error handling.
Integrations can be managed either through the TBMQ Web UI or via the REST API.
When a create or update request is received, TBMQ sends a validation request to the Integration Executor. The IE then validates the configuration based on the integration type and responds with the result.
This validation process ensures the configuration of the integration is correct before the integration is saved and activated. You can also manually test the integration connectivity with the external system using the “Check Connection” button on the UI or via the REST API.
Validation Scenarios
Scenario 1: Integration Executor not running — Timeout

The Integration Executor is not running, so the broker waits for a response until a timeout occurs. Result: Timeout exception. The integration will not be saved.
Scenario 2: Integration Executor running — Configuration Error

The Integration Executor is running, but the integration configuration is invalid. Result: Failure. The integration will not be saved.
Scenario 3: Integration Executor running — Success

The Integration Executor is running and the configuration is valid. Result: Success. Once validation succeeds, the integration entity is saved in the database, the integration subscriptions are persisted in the Subscription Trie, and integration configuration event is sent to the Integration Executor for processing.
Integration Message Processing Topic
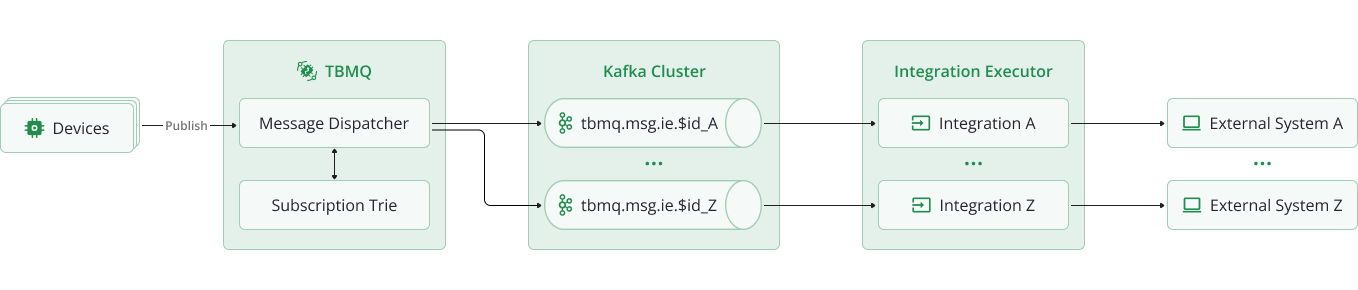
TBMQ uses a dedicated Kafka topic for each integration to deliver MQTT messages to the Integration Executor (tbmq-ie).
When an MQTT client publishes a message, the TBMQ broker first checks if any integration has a topic filter in Subscription Trie matching the message topic.
If a match is found, TBMQ creates an integration event by serializing the message and publishes it to that integration’s own Kafka topic
(tbmq.msg.ie.$integrationId). The Integration Executor, that is managing that integration and subscribed to that Kafka topic,
consumes the message, processes it, and forwards it to the configured external system.
The executor may also log the result or report back to TBMQ for monitoring purposes.
This decoupled, event-driven flow allows TBMQ to offload integration message handling entirely to the executor service. As a result, the broker never waits for external responses, preserving low-latency MQTT performance even when external systems are slow or unavailable.
Each integration has its own Kafka topic, which enables full isolation of message flow. Messages for different integrations are processed independently, in separate threads (Kafka consumers), allowing parallel execution and fine-grained error control.
Even when an integration is disabled, TBMQ continues publishing matching messages to its Kafka topic. This ensures no message loss, as the executor will resume processing once the integration is re-enabled. Kafka’s retention policies and buffering capabilities provide additional resilience in high-load or temporary-failure scenarios.
This architecture ensures reliable, scalable, and fault-tolerant message processing without impacting core broker performance. Several key benefits:
- High throughput and non-blocking broker performance.
- Clean separation of concerns between message routing and message delivery.
- Full control over retry, backpressure, and error handling per integration.
What Happens If an Integration Stays Disabled for a Long Time?
To avoid unused topics consuming storage indefinitely, TBMQ includes an automatic cleanup mechanism.
If an integration remains disabled for an extended period, its dedicated Kafka message topic will be deleted automatically, along with any undelivered messages it contains.
However, there’s no need to take manual action — when the integration is re-enabled, TBMQ will recreate the topic automatically and resume normal message processing.
You can control the cleanup behavior using the following environment variables. By default, the cleanup task runs every 3 hours and removes topics associated with integrations that have been inactive for more than 1 week.
1
2
3
4
5
6
7
cleanup:
  # The parameter to specify the period of execution cleanup task for disconnected integrations. Value set in seconds. Default value corresponds to three hours
  period: "${INTEGRATIONS_CLEANUP_PERIOD_SEC:10800}"
  # Administration TTL (in seconds) for cleaning up disconnected integrations.
  # The cleanup removes integration topics that persist messages.
  # The current value is set to one week. A value of 0 or negative disables this TTL
  ttl: "${INTEGRATIONS_CLEANUP_TTL_SEC:604800}"
This approach ensures that inactive integrations do not waste resources while still allowing for automatic recovery when they’re reactivated. Additionally, Kafka topic retention settings can be customized to fine-tune storage limits and control how long messages are retained per topic.
Message Delivery Error Handling & Retry Mechanism
When an integration message fails to be processed (e.g., due to a timeout, unreachable external system, or malformed request),
the Integration Executor handles the error based on the configured acknowledgment and retry strategy for the tbmq.msg.ie.$integrationId topic.
These behaviors are controlled via the following configuration block:
1
2
3
4
5
6
7
8
9
10
11
12
integration-msg:
  # Interval in milliseconds to poll messages from 'tbmq.msg.ie' topics
  poll-interval: "${TB_IE_MSG_POLL_INTERVAL:1000}"
  # Timeout in milliseconds for processing the pack of messages
  pack-processing-timeout: "${TB_IE_MSG_PACK_PROCESSING_TIMEOUT:30000}"
  ack-strategy:
    # Processing strategy for 'tbmq.msg.ie' topics. Can be: SKIP_ALL, RETRY_ALL
    type: "${TB_IE_MSG_ACK_STRATEGY_TYPE:SKIP_ALL}"
    # Number of retries, 0 is unlimited. Use for RETRY_ALL processing strategy
    retries: "${TB_IE_MSG_ACK_STRATEGY_RETRIES:5}"
    # Time in seconds to wait in consumer thread before retries
    pause-between-retries: "${TB_IE_MSG_ACK_STRATEGY_PAUSE_BETWEEN_RETRIES:1}"
Strategy Options
- SKIP_ALL (default):
- If a message fails or timed out during processing, it is skipped after logging the error.
- This ensures high throughput and avoids retry delays but sacrifices guaranteed delivery to external systems.
- RETRY_ALL:
- The executor retries failed and timed out messages in-place, up to the configured number of times (
retries). - A pause between retries is enforced (
pause-between-retries) to avoid tight retry loops. - If
retriesis set to0, the executor retries the message indefinitely.
- The executor retries failed and timed out messages in-place, up to the configured number of times (
Timeout Control
Each batch of messages (or “pack”) has a processing timeout (pack-processing-timeout) to prevent long-running tasks from blocking the entire consumer thread.
This ensures system responsiveness even under high load or slow external targets.
This approach provides a flexible balance between performance and delivery guarantees, giving admins control over retry behavior, failure tolerance, and system resilience.
Hot Reinitialization of Failed Integrations
In addition to message-level retries, TBMQ supports automatic reinitialization of failed integrations through a periodic background check.
1
2
3
4
5
reinit:
  # Enable/disable integrations hot reinitialization. This process is done for integrations with state 'FAILED'
  enabled: "${INTEGRATIONS_REINIT_ENABLED:true}"
  # Checking interval in milliseconds for reinit integrations. Defaults to 5 minutes
  frequency: "${INTEGRATIONS_REINIT_FREQUENCY_MS:300000}"
If an integration enters the FAILED state (for example, due to broken connections or configuration issues), the Integration Executor will periodically attempt to reinitialize it.
This process checks all failed integrations every frequency milliseconds.
If the issue is resolved, such as the remote system becoming reachable, the integration is restored automatically without requiring manual intervention.
This feature ensures long-running integrations remain self-healing and robust in dynamic environments.
Integration Metrics Overview
The Integration Executor (tbmq-ie) collects and reports detailed metrics that give visibility into the health, performance, and behavior of all configured integrations.
These metrics are logged periodically and can be exported to external monitoring systems like Prometheus or Grafana for alerting, dashboards, and historical analysis.
Below is a breakdown of the main metric categories recorded in the logs:
1. Current Integration Activity
This section logs per-integration-type counters for the current reporting interval.
Example:
1
IntegrationStatisticsKey(integrationStatisticsMetricName=START, success=true, integrationType=HTTP) = [0]
Explanation:
START: Number of times an integration startup was attempted.success=true | false: Whether the attempt succeeded or failed.integrationType: The type of integration (e.g., HTTP, MQTT, Kafka).
Additional metric types you may see:
integrationStatisticsMetricName=STOP: Number of times integration shutdown was triggered.integrationStatisticsMetricName=MSGS_UPLINK: Number of messages forwarded from the executor to external systems.
Example:
1
MSGS_UPLINK, success=true, integrationType=MQTT = [38]
-> 38 messages were successfully forwarded to an external MQTT broker.
2. Integration State Summary
This section tracks the current state of all integrations managed by the executor.
Example:
1
START, success=true, integrationType=MQTT = [1]
-> There is currently one active MQTT integration in the STARTED state.
Key points:
success=true: Number of integrations inSTARTEDstate.success=false: Number of integrations inFAILEDstate.
These values are updated whenever any integration changes state. They help admins understand the real-time health of all running integrations across types.
3. Integration Uplink Queue Stats
These metrics summarize the state of the uplink Kafka topic, which is used by the executor to send error, statistics and lifecycle events back to TBMQ.
Example:
1
2
3
4
queueSize = [0]
totalMsgs = [1]
successfulMsgs = [1]
failedMsgs = [0]
Metric descriptions:
queueSize: Number of messages currently waiting in the uplink Kafka queue.totalMsgs: Total number of messages sent to the uplink topic.successfulMsgs: Messages published successfully.failedMsgs: Messages that failed to publish.
These values help monitor the reliability and health of internal communication between executor and broker services.
4. Integration Message Processing Stats
These are per-integration-instance metrics that reflect how messages are being processed and delivered to external systems.
Example:
1
2
3
4
5
6
7
8
9
[integrationProcessor][f6e82897-dd18-4c6f-ac31-5f19ce75e2db]
totalMsgs = [38]
successfulMsgs = [38]
tmpTimeout = [0]
tmpFailed = [0]
timeoutMsgs = [0]
failedMsgs = [0]
successfulIterations = [38]
failedIterations = [0]
Metric descriptions:
[integrationProcessor][<UUID>]: The metric group for a specific integration instance.totalMsgs: Total messages received for processing.successfulMsgs: Messages successfully delivered.tmpTimeout: Messages that exceeded the processing timeout but will be retried.tmpFailed: Messages that failed but will be retried.timeoutMsgs: Messages that exceeded the processing timeout and will not be retried.failedMsgs: Messages that failed permanently after retry attempts.successfulIterations: Number of successful message batch executions (all messages in the batch processed without error).failedIterations: Number of message batch executions that resulted in one or more processing failures.
These metrics are essential for monitoring message-level reliability, troubleshooting integration issues, and ensuring timely delivery to external targets.
Scalability and Fault Tolerance
- Executor Scaling: You can run multiple instances of the
tbmq-ieservice in parallel. Kafka handles partitioning and distributes integration messages across executors automatically, enabling horizontal scaling. - Fault Isolation: Issues in external systems (e.g., a slow or unreachable HTTP endpoint) affect only the Integration Executor. The TBMQ broker continues operating normally without delay or message loss.
- Backpressure Management: Kafka acts as a message buffer. If executors become slow or temporarily overloaded, Kafka retains messages based on its configured retention policies until the executors are ready to process them.
- Resilience: Executor instances can restart or fail independently. Integrations are restored automatically using compacted configuration topics, without manual intervention.
This architecture supports modern cloud-native deployment models and ensures that TBMQ remains robust and responsive, even under heavy load or partial system failures.
Supported Integration Types
TBMQ currently supports three outbound integration types, each designed for specific use cases:
- HTTP Integration – Send MQTT messages to REST APIs or Webhooks via HTTP(S).
- MQTT Integration – Forward messages to external MQTT brokers for cross-broker communication via MQTT(S).
- Kafka Integration – Stream messages into Kafka topics for real-time processing via TCP(TLS).
Roadmap
We’re actively working on expanding integration capabilities in TBMQ. Upcoming plans include:
- New outbound integration types, such as Redis, PostgreSQL, RabbitMQ, and more.
- Inbound (source) integrations, which will allow TBMQ to receive messages from external systems — for example, Kafka integrations (acting as consumers) or MQTT integrations (acting as subscribers).
- Message transformation and filtering, enabling dynamic processing before forwarding data to external targets.
These enhancements will enable even greater flexibility in building event-driven and bi-directional IoT architectures.
Stay tuned for future updates!