- Charts
- Sessions
- Credentials
- Config
- Kafka Brokers
- Kafka Topics
- Kafka Consumer Groups
- Resource Usage Statistics
TBMQ offers user-friendly tools that enable users to monitor broker activity and conveniently access features through the Home and Monitoring pages.

Charts
At the top of the Home page, you will find a set of six charts that display essential information about the broker’s activity over the last 10 minutes:
- Incoming messages. This chart shows the number of messages published by MQTT clients to the broker.
- Outgoing messages. Here, you can view the count of messages delivered by the broker to subscribing clients.
- Dropped messages. This chart indicates messages that either lack subscribers or couldn’t be delivered to subscribers due to network issues, client disconnections, or resource limitations.
- Sessions. The number of current MQTT sessions is represented in this chart.
- Subscriptions. This chart displays the number of current subscriptions.
- Network traffic. This chart demonstrates the size of processed data, sent or received by the MQTT clients.
Please note that on the Monitoring page, users have the ability to delve deeper into the chart data. They can zoom in on specific sections, set custom date ranges to display data, or open the charts in full-screen mode.

Sessions
The Sessions card provides an overview of both connected and disconnected sessions. Users can access comprehensive information about these sessions, including their status, duration, and additional details by going to the Sessions page.
Credentials
The system displays the number of Client Credentials categorized into two types: Device and Application. For more information regarding the different types of Credentials, please refer to the documentation.

Config
Contains information regarding some commonly used configuration parameters:
- Basic Authentication. To enable/disable authentication method, click on the switch button.
- X.509 Certificate Chain Authentication.
- JWT Authentication.
- SCRAM Authentication.
- TCP Port. By default, the TCP listener is enabled on the
1883port. To modify the port, you can set theLISTENER_TCP_BIND_PORTenvironment variable. - TLS Port. The SSL/TLS listener is disabled by default on port
8883. To change the default port, set theLISTENER_SSL_BIND_PORTenvironment variable. - WS Port. By default, the WS listener is enabled on the
8084port. To modify the port, you can set theLISTENER_WS_BIND_PORTenvironment variable. - WSS Port. By default, the WSS listener is disabled on the
8085port. To modify the port, you can set theLISTENER_WSS_BIND_PORTenvironment variable. - TCP Listener. Is enabled by default. To disable it, set the
LISTENER_TCP_ENABLEDenvironment variable tofalse. - TLS Listener. Is disabled by default. To enable the SSL/TLS listener, set the
LISTENER_SSL_ENABLEDenvironment variable totrue. - WS Listener. Is enabled by default. To disable it, set the
LISTENER_WS_ENABLEDenvironment variable tofalse. - WSS Listener. Is disabled by default. To enable it, set the
LISTENER_WSS_ENABLEDenvironment variable totrue. - TCP Listener Max Payload Size. This parameter defines the maximum allowed size of the payload in a TCP message. The default value is
65536bytes. To modify it, set theTCP_NETTY_MAX_PAYLOAD_SIZEenvironment variable in bytes. - TLS Listener Max Payload Size. Similar to the TCP listener, this parameter specifies the maximum allowed size of the payload in an SSL/TLS-encrypted message. The default value is
65536bytes. To change it, set theSSL_NETTY_MAX_PAYLOAD_SIZEenvironment variable in bytes. - WS Listener Max Payload Size. Specifies the maximum allowed size of the payload in a WS message. The default value is
65536bytes. To modify it, set theWS_NETTY_MAX_PAYLOAD_SIZEenvironment variable in bytes. - WSS Listener Max Payload Size. Defines the maximum allowed size of the payload in a WSS-encrypted message. The default value is
65536bytes. To change it, set theWSS_NETTY_MAX_PAYLOAD_SIZEenvironment variable in bytes.

Kafka Brokers
Displays basic information regarding the Kafka Brokers:
- Address. Address of the Kafka broker.
- Size. Size of data stored on the broker.

Kafka Topics
Displays basic information regarding the Kafka Topics:
- Name. Name of Kafka topic.
- Partitions. Number of partitions in the topic.
- Replicas. Replication factor of the topic.
- Size. Size of the topic.

Kafka Consumer Groups
Displays basic information regarding the Kafka Consumer Groups (CG):
- ID. Consumer Group ID.
- State. State of the CG. Can be
STABLE,PREPARING_REBALANCE,COMPLETING_REBALANCE,EMPTY,DEADorUNKNOWN. - Members. Number of consumers in the CG.
- Lag. Sum of all consumers lags within the group. Consumer lag is the delta between the consumer’s last committed offset and the producer’s end offset.

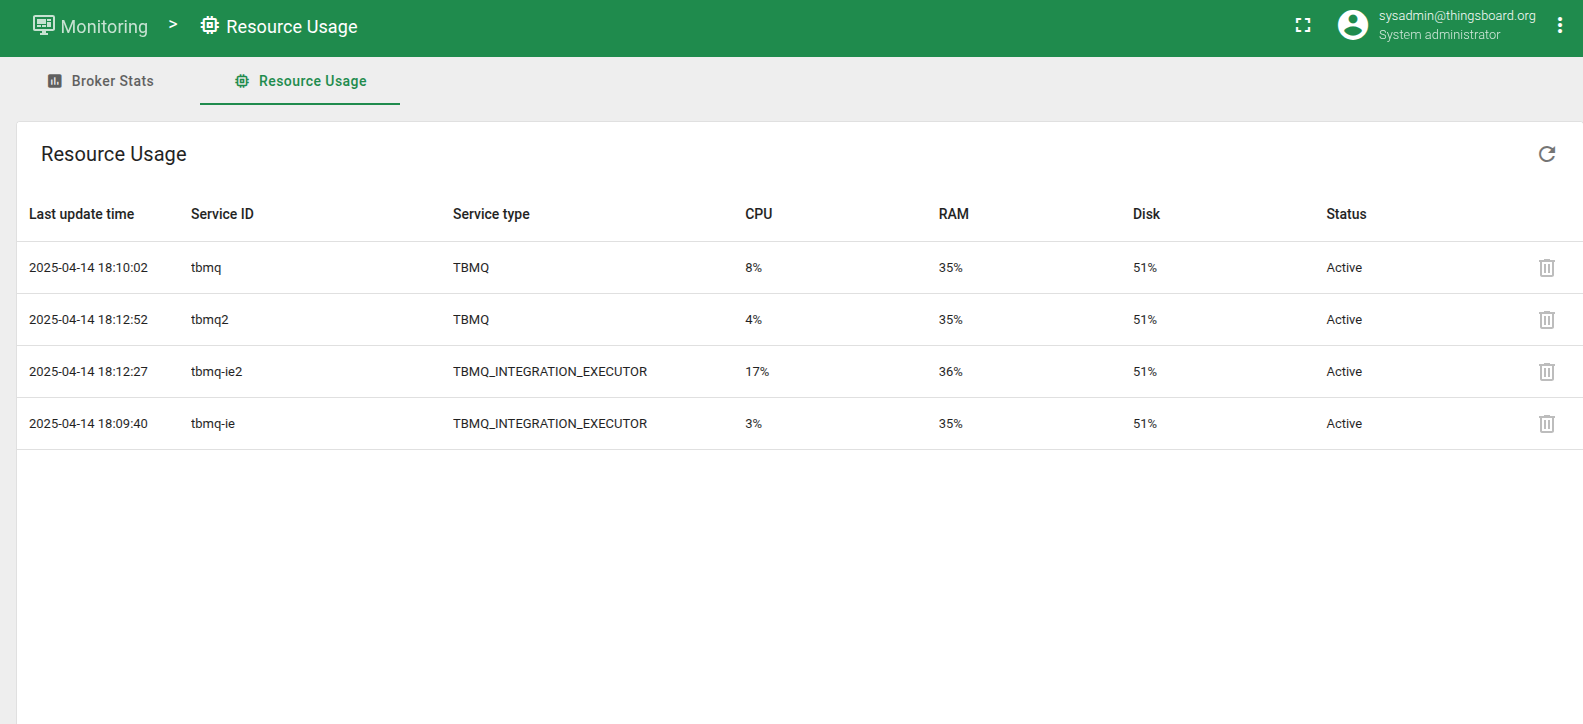
Resource Usage Statistics
TBMQ provides runtime resource usage statistics for each service instance. These metrics help monitor system behavior and support debugging or optimization across different environments (VMs, containers, physical machines).
System metrics are collected using the OSHI Java library, which retrieves hardware and operating system statistics directly from the host environment.
System metrics are collected and saved periodically. By default, system information is updated every 60 seconds. The interval is defined in the configuration:
1
2
# Persist frequency of system info (CPU, memory usage, etc.) in seconds
persist-frequency: "${STATS_SYSTEM_INFO_PERSIST_FREQUENCY_SEC:60}"
The Resource Usage table includes the following info about each service:
- Last update time. Timestamp of the most recent metrics update.
- Service ID. Identifier of the service instance.
- Service type. Type of service (e.g., TBMQ, Integration Executor).
- CPU. CPU load in percentage (hover to see the number of available CPU cores).
- RAM Physical memory usage in percentage (hover to see total memory in GB).
- Disk. Disk space usage in percentage (hover to see total disk capacity in GB).
- Status. Indicates how recent the last update was.
Active- Reported less than 1 hour ago.Inactive- Reported between 1 hour and 1 week ago.Outdated- Reported more than 1 week ago.
TBMQ tracks all registered services in Redis using the key tbmq:service:registry.
Each Service ID, used later to fetch resource usage data, is stored in this key as part of a Redis hash.
Services are automatically added to the registry on their first launch, and the stored metadata helps identify which services are currently available for system metrics reporting.
The key is not managed by TTL and entries are stored indefinitely. TBMQ does not automatically remove services from the registry, even if they stop running.
You can manually delete a service from the UI (or using REST API) using the “Delete” button that is available only when the service status is Outdated.