Remote Configuration
Remote Configuration is a powerful feature of ThingsBoard IoT Gateway that allows you to manage and configure your gateway directly from the ThingsBoard web interface. This feature is especially useful for managing multiple gateways or when physical access to the gateway is limited.
Gateway List
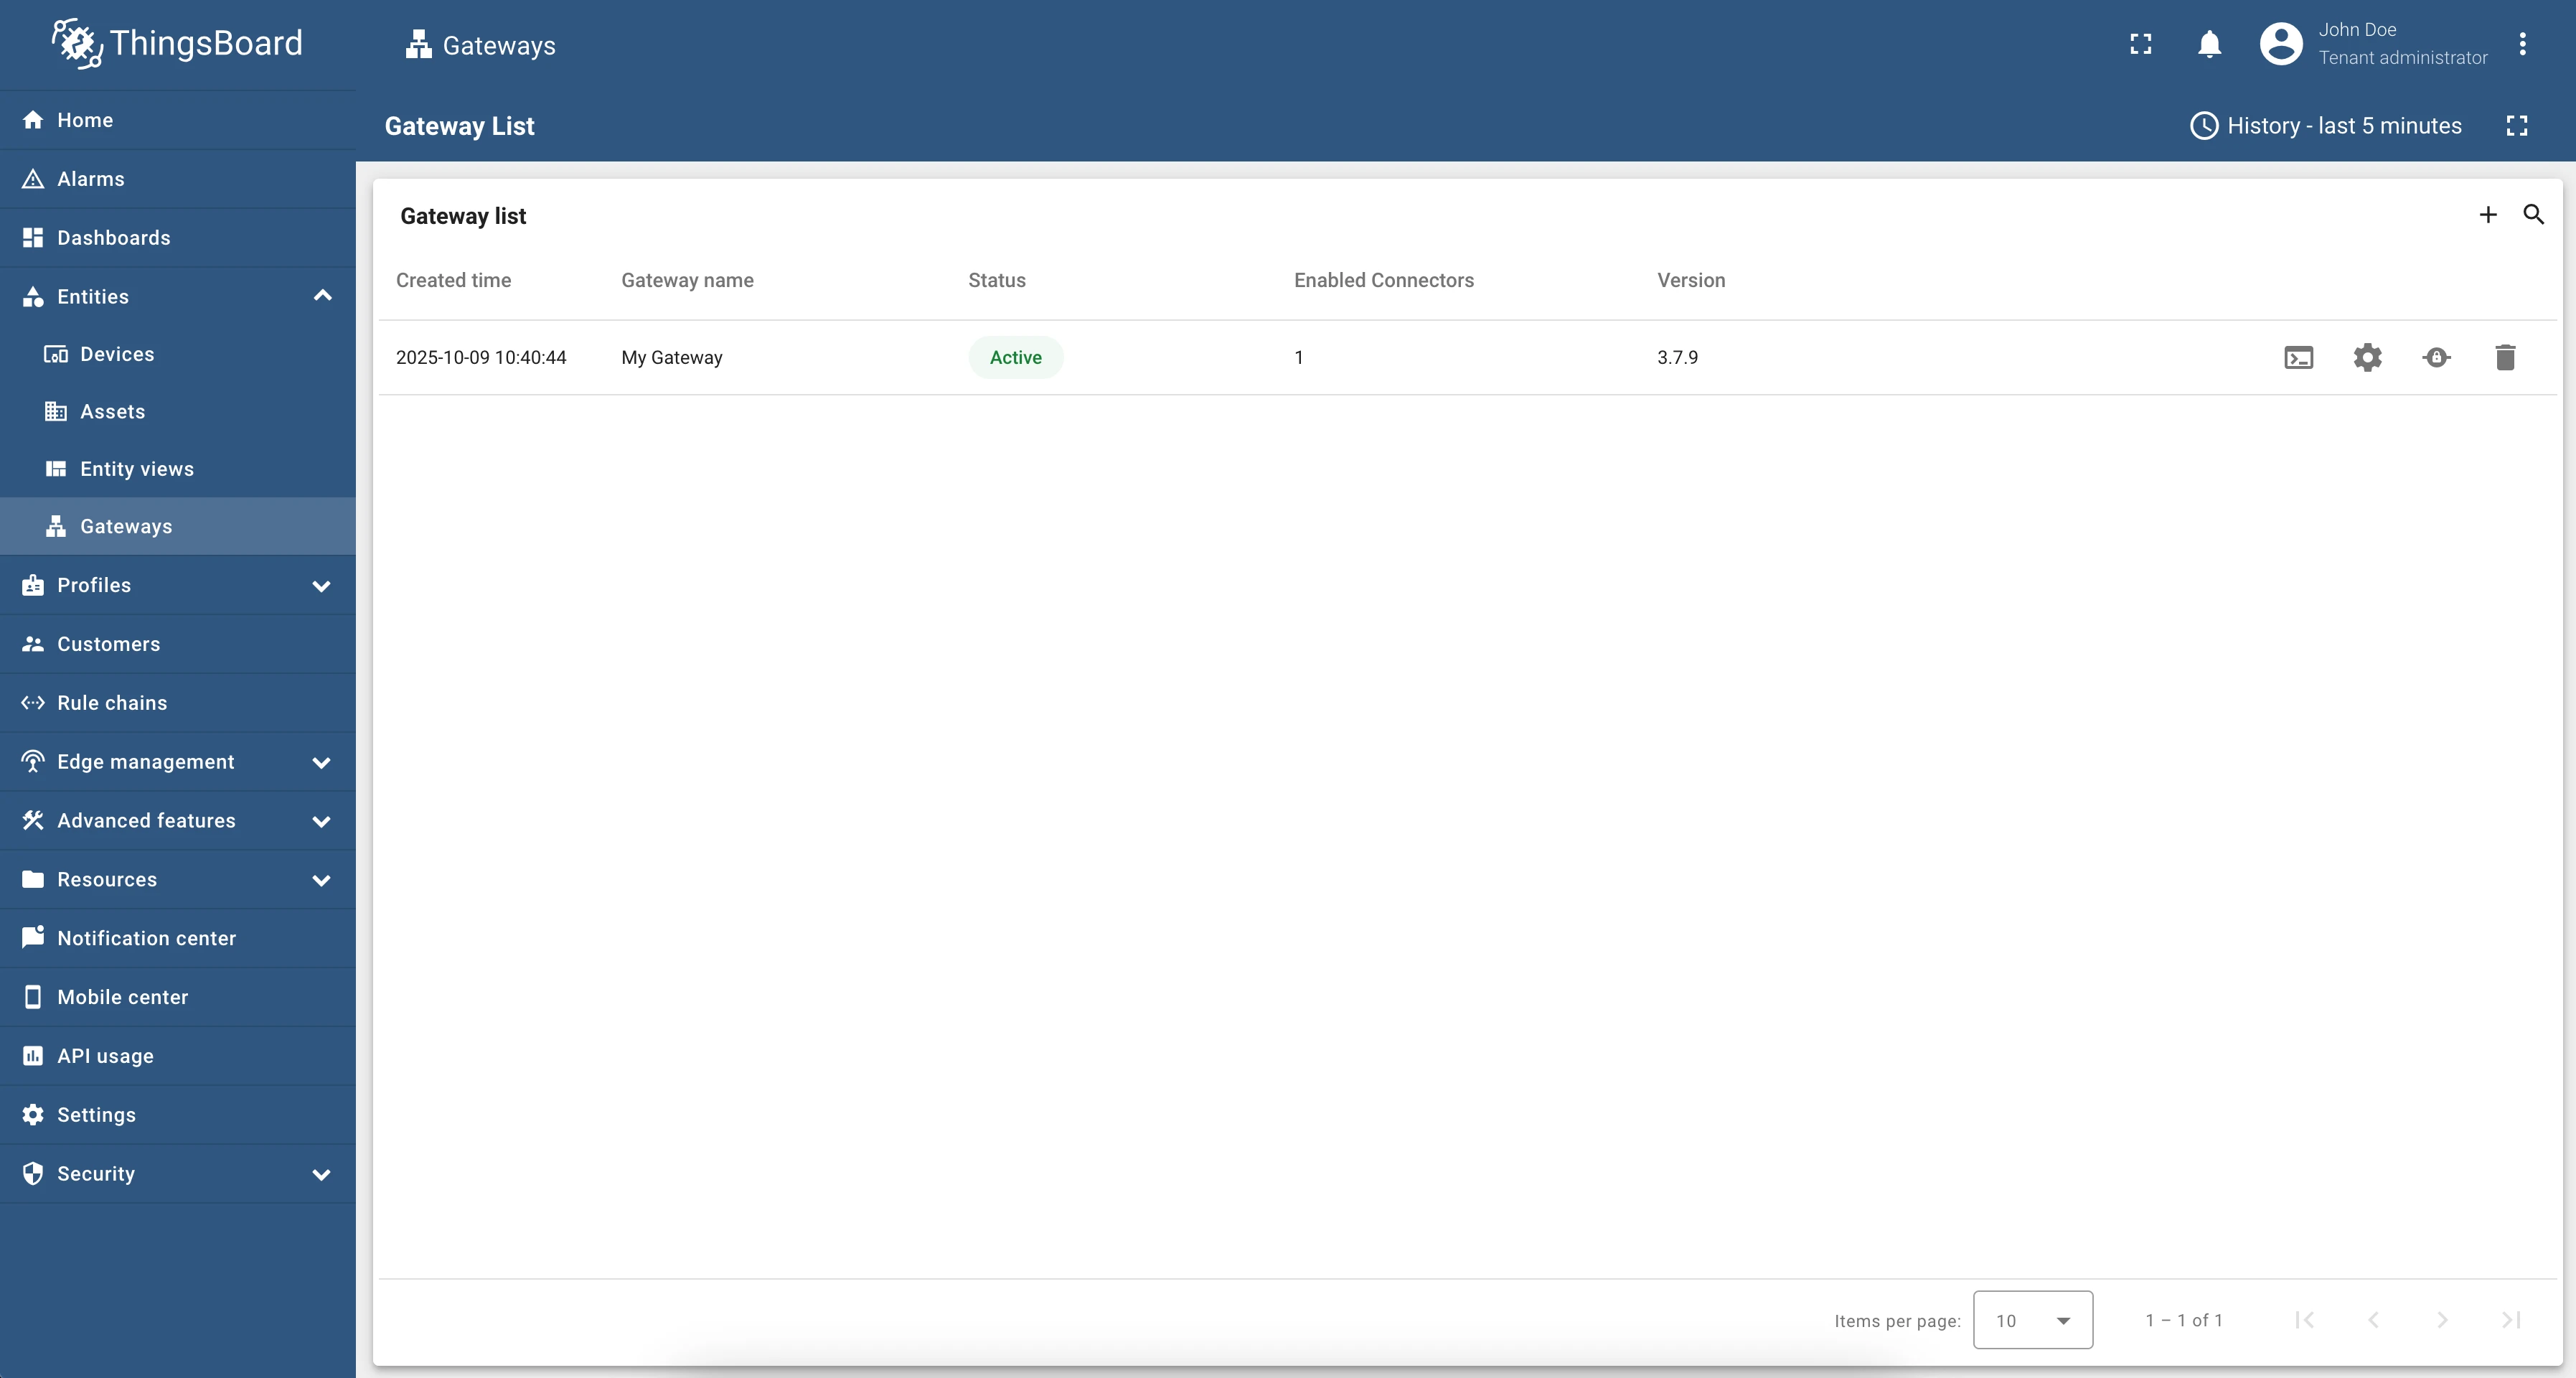
Section titled “Gateway List”Navigate to Entities > Gateways in the ThingsBoard side menu to access the gateway management page.
The gateway list displays all your gateways with the following details:
| Column | Description |
|---|---|
| Created | Date and time of creation |
| Name | Name of the gateway |
| Status | Active or Inactive |
| Connectors | Number of enabled connectors |
| Version | Gateway version |
Navigation actions available on each row:
- Launch command — opens a modal with the command to launch the gateway.
- Gateway configuration — opens a modal with general gateway settings.
- Connectors — opens the connectors management and configuration page.
- Delete gateway — opens a deletion confirmation modal.
You can also create a new gateway or sort the list by any of the columns above.
Gateway Info Page
Section titled “Gateway Info Page”Click on any gateway in the list to open its detail page. The dashboard is composed of four main widgets.
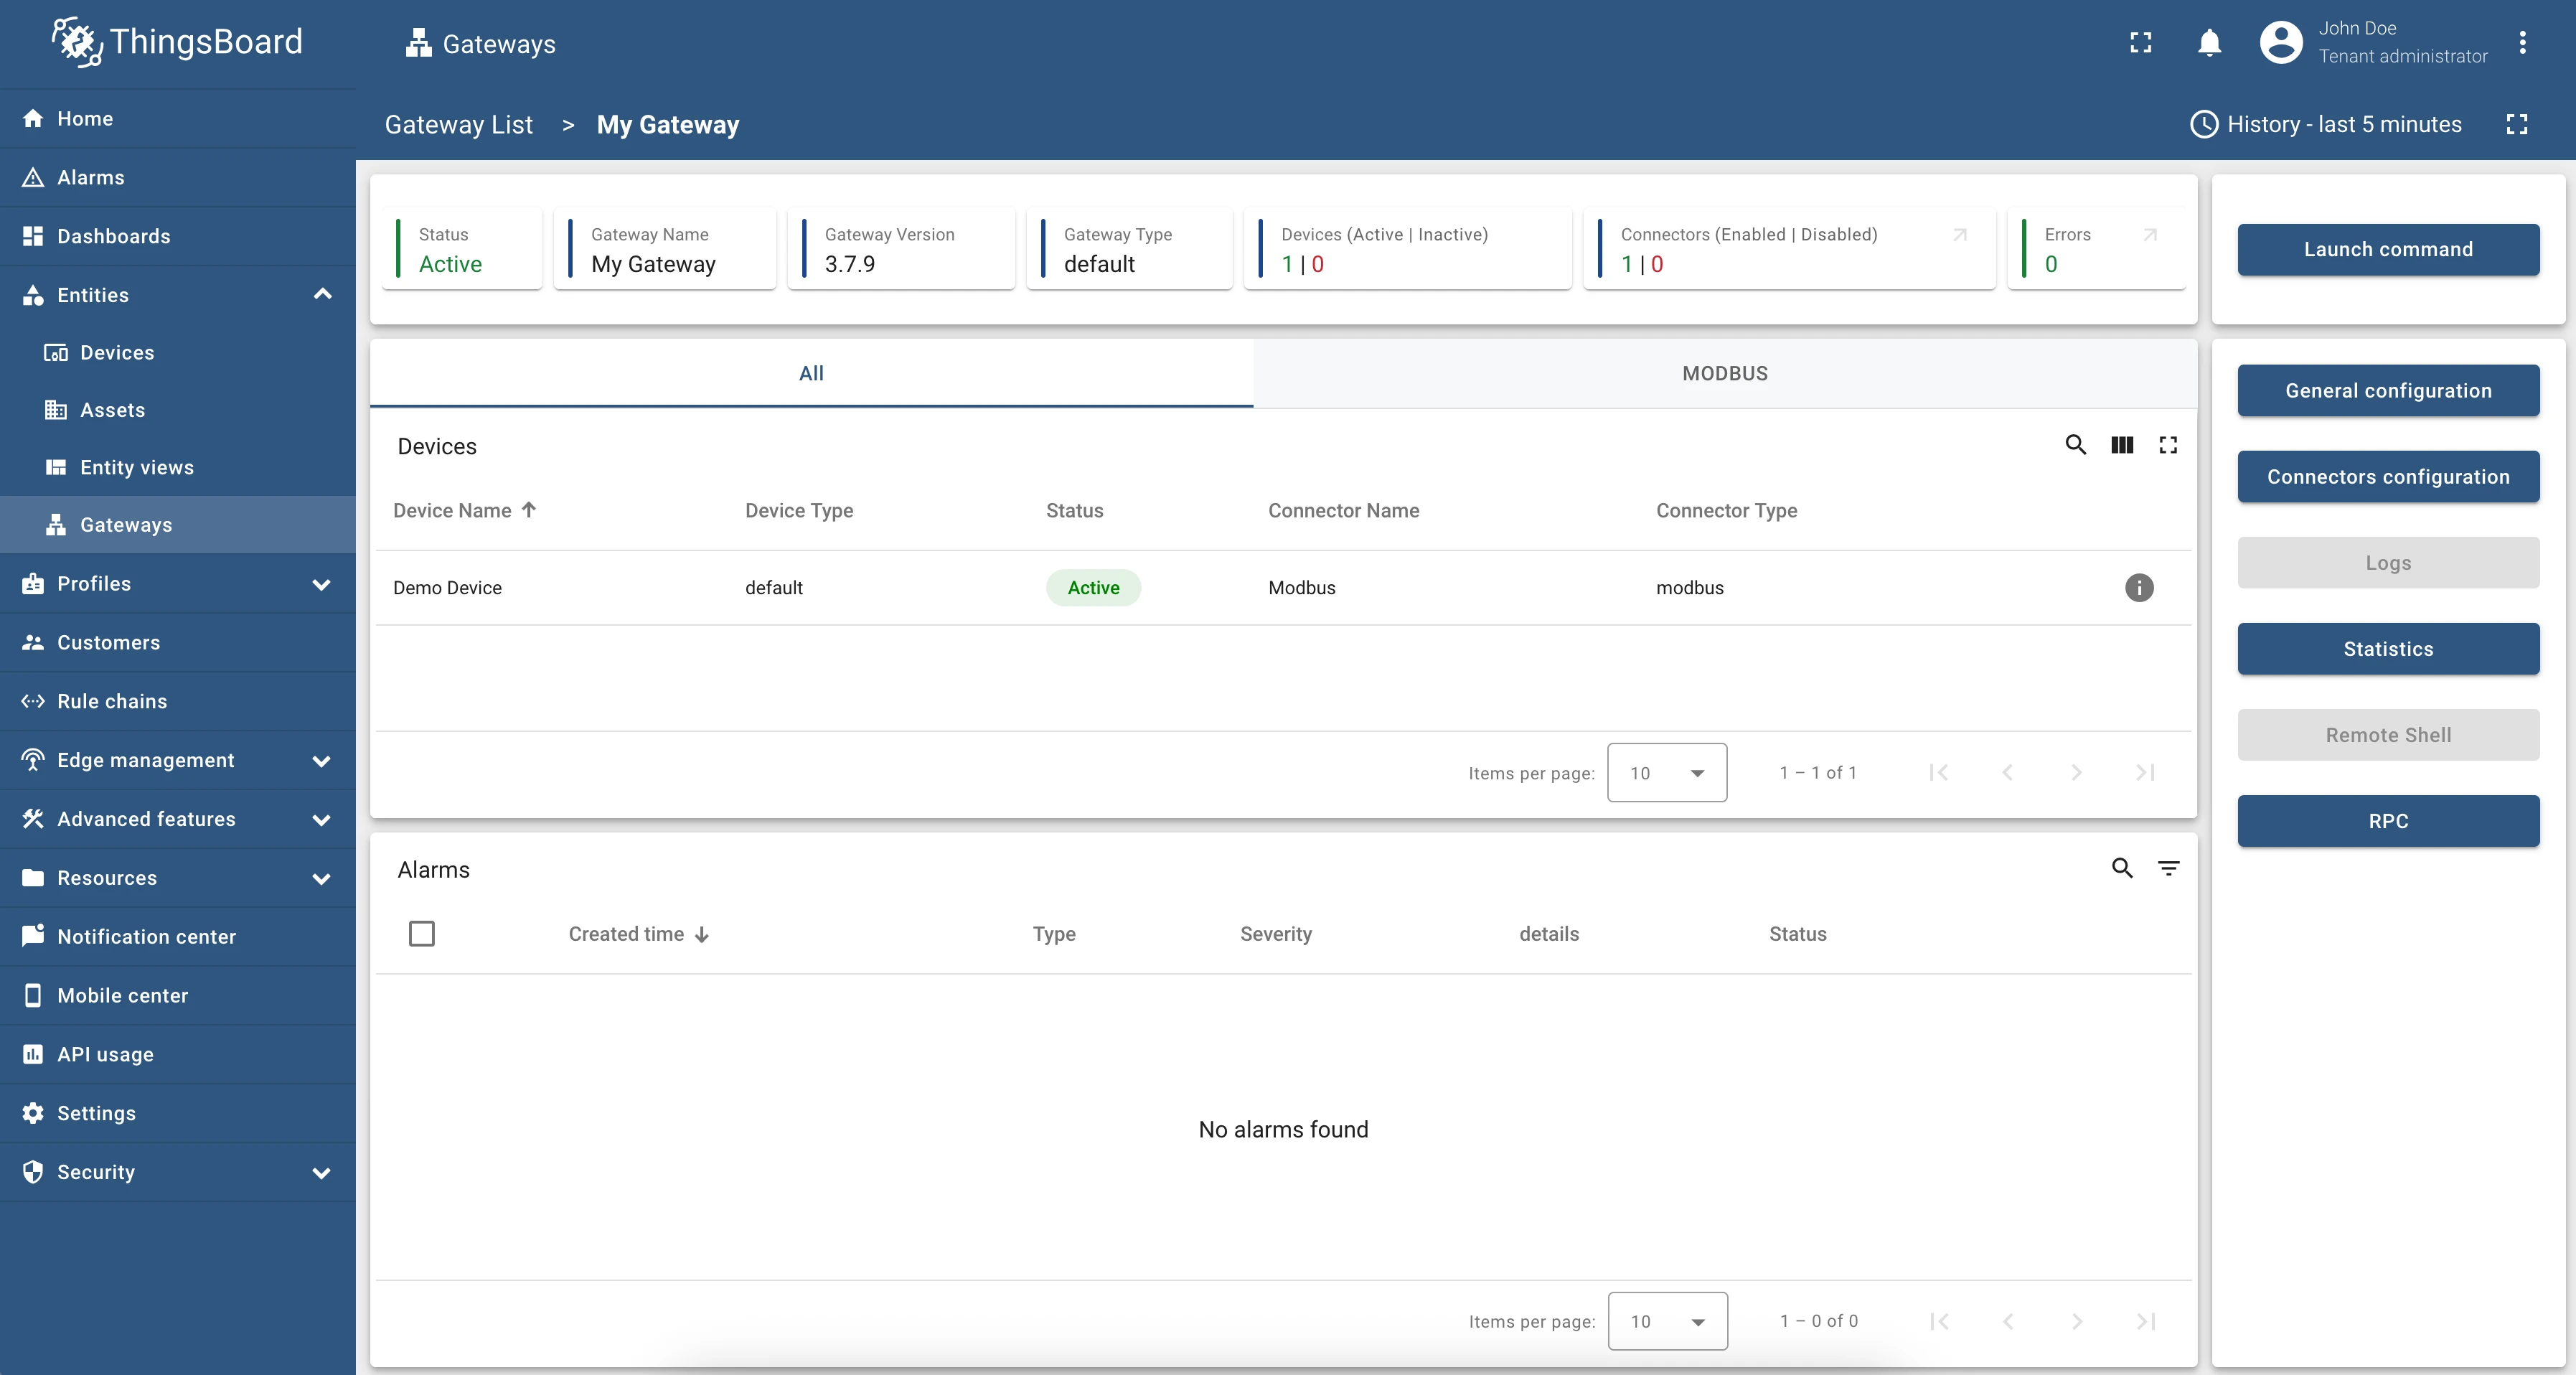
General gateway information shows the following summary cards:
- Status (Active / Inactive)
- Name of the gateway
- Type of the gateway
- Devices (Active / Inactive count)
- Connectors (Enabled / Disabled) with a link to the Connectors page
- Error count with a link to the Logs page

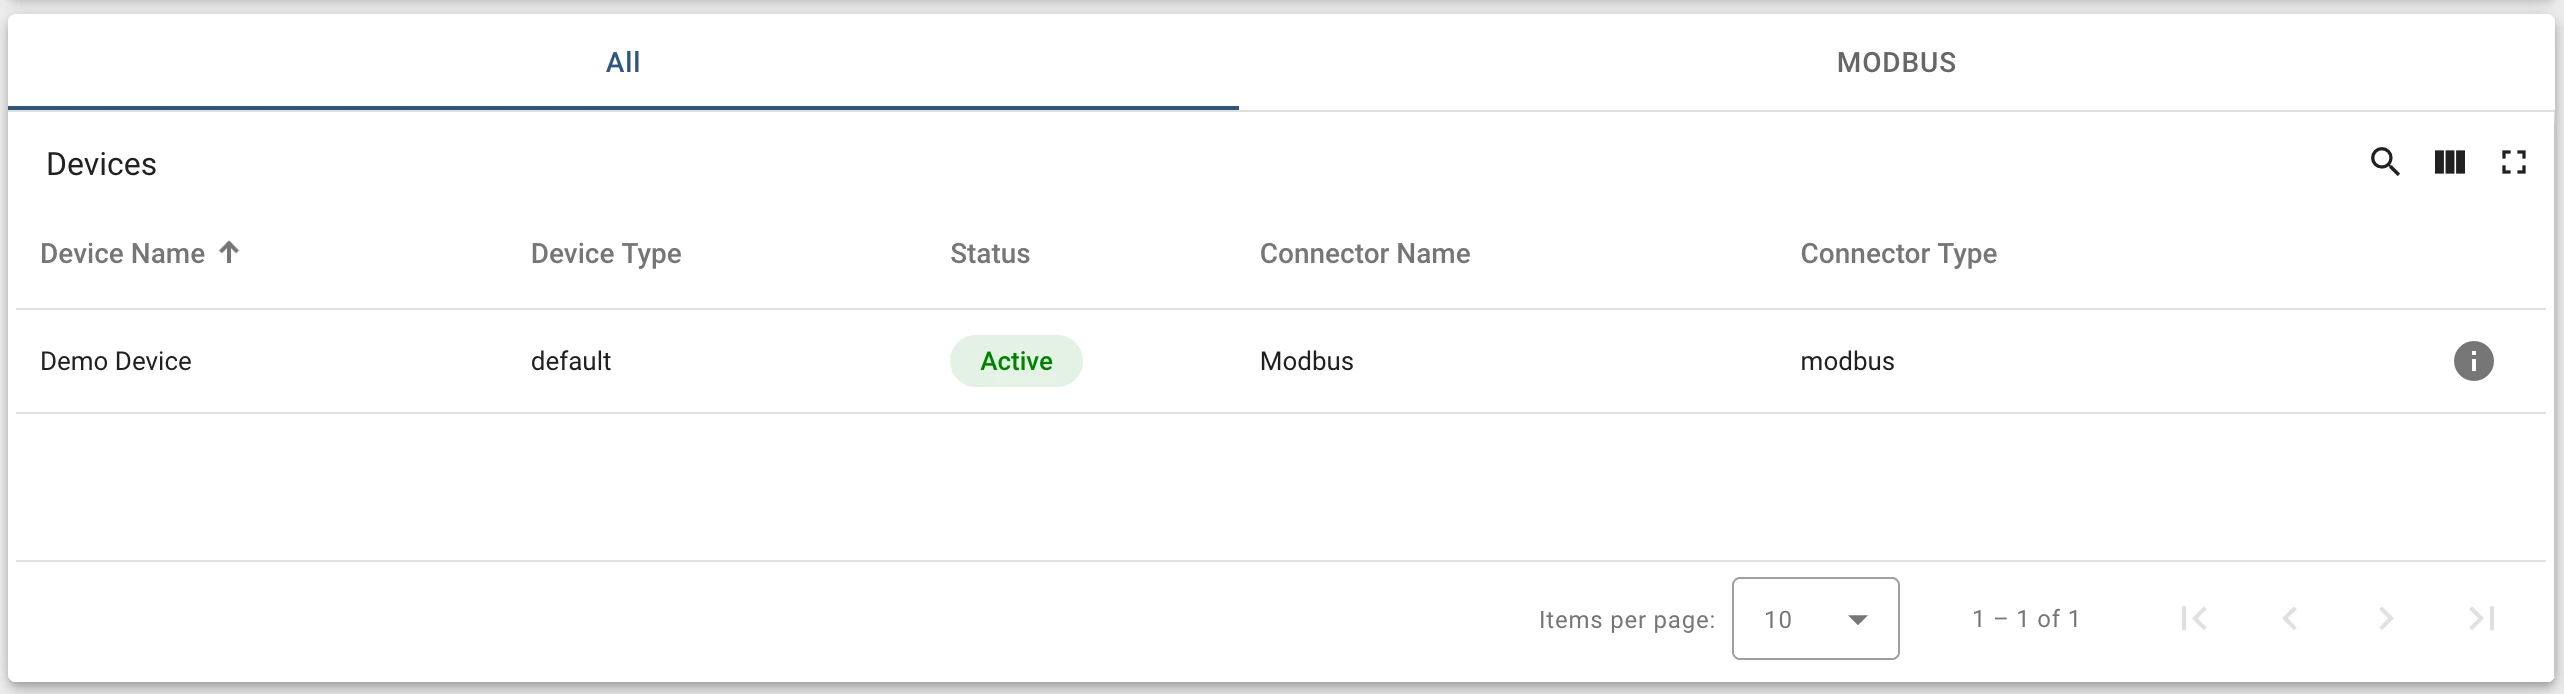
Devices is a table with basic information about all devices connected through the gateway:
- Device name and type
- Status (Active / Inactive)
- Connector name and type
- Device info button — opens a modal with detailed device information
- Filtering and search controls
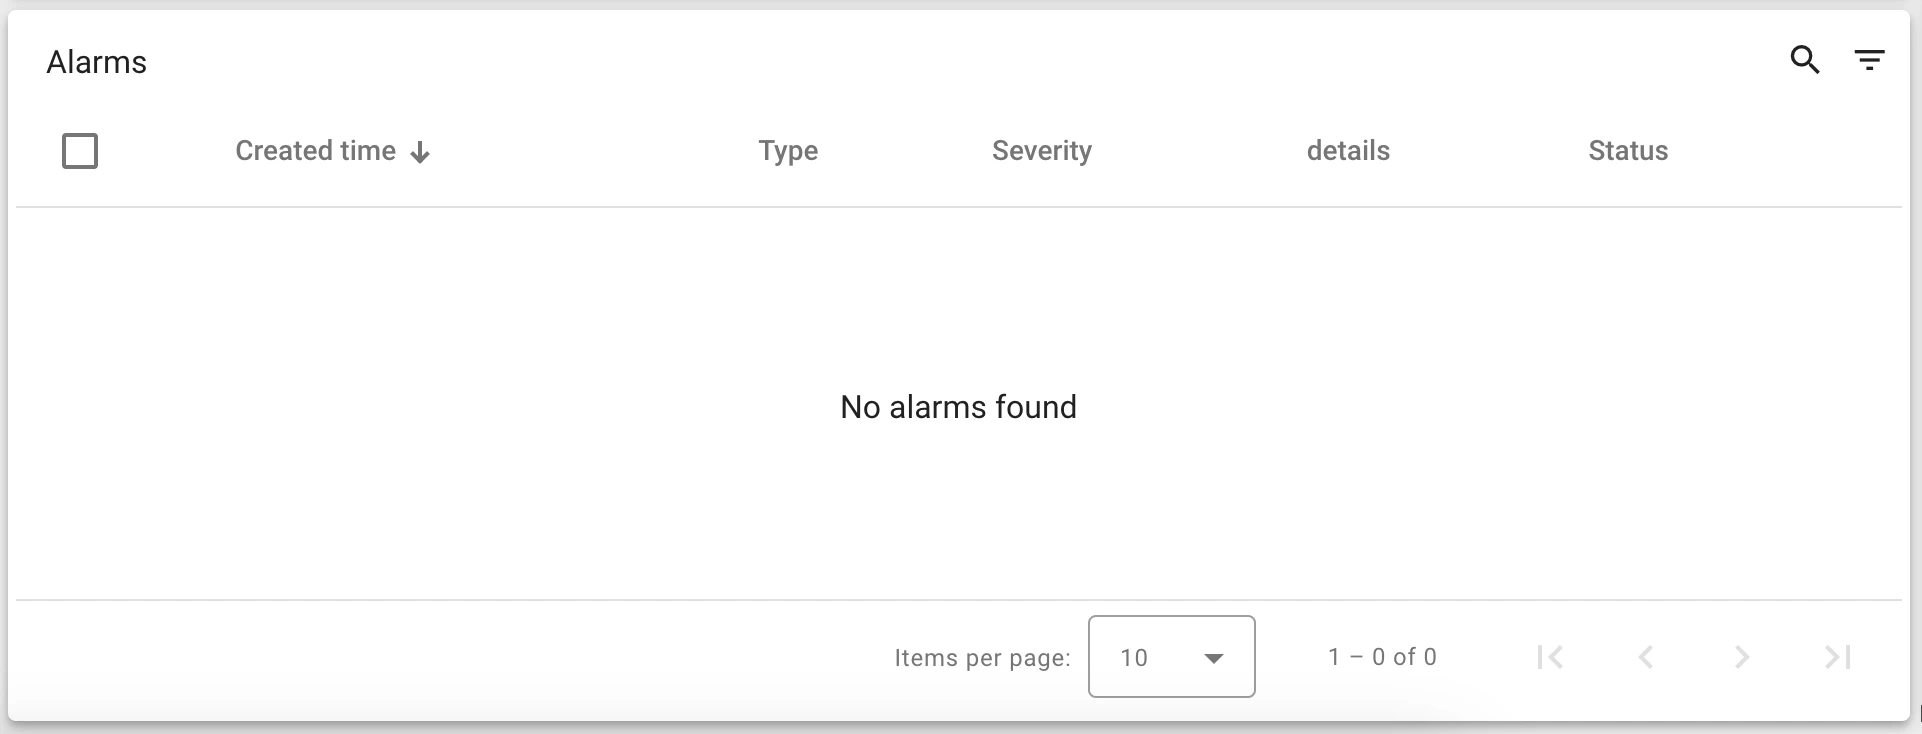
Alarms is a standard alarm widget showing all alarms related to the selected gateway.
Navigation Panel provides links to all pages for configuring, managing, and monitoring the gateway:
- Launch command — auto-generated command for launching the gateway.
- General configuration — general gateway settings.
- Connectors configuration — manage and configure connectors.
- Logs — gateway logs (active only when Remote Logging is enabled).
- Statistics — general and custom gateway statistics.
- Remote Shell — remote OS control (active only when Remote Shell is enabled).
- RPC — gateway RPC sending page.
General Configuration
Section titled “General Configuration”Click General Configuration in the Navigation Panel to open the gateway’s general settings page.
You can switch between Basic and Advanced configuration modes. Basic mode provides a user-friendly form interface; Advanced mode lets you edit the configuration JSON directly.
Basic Configuration Mode
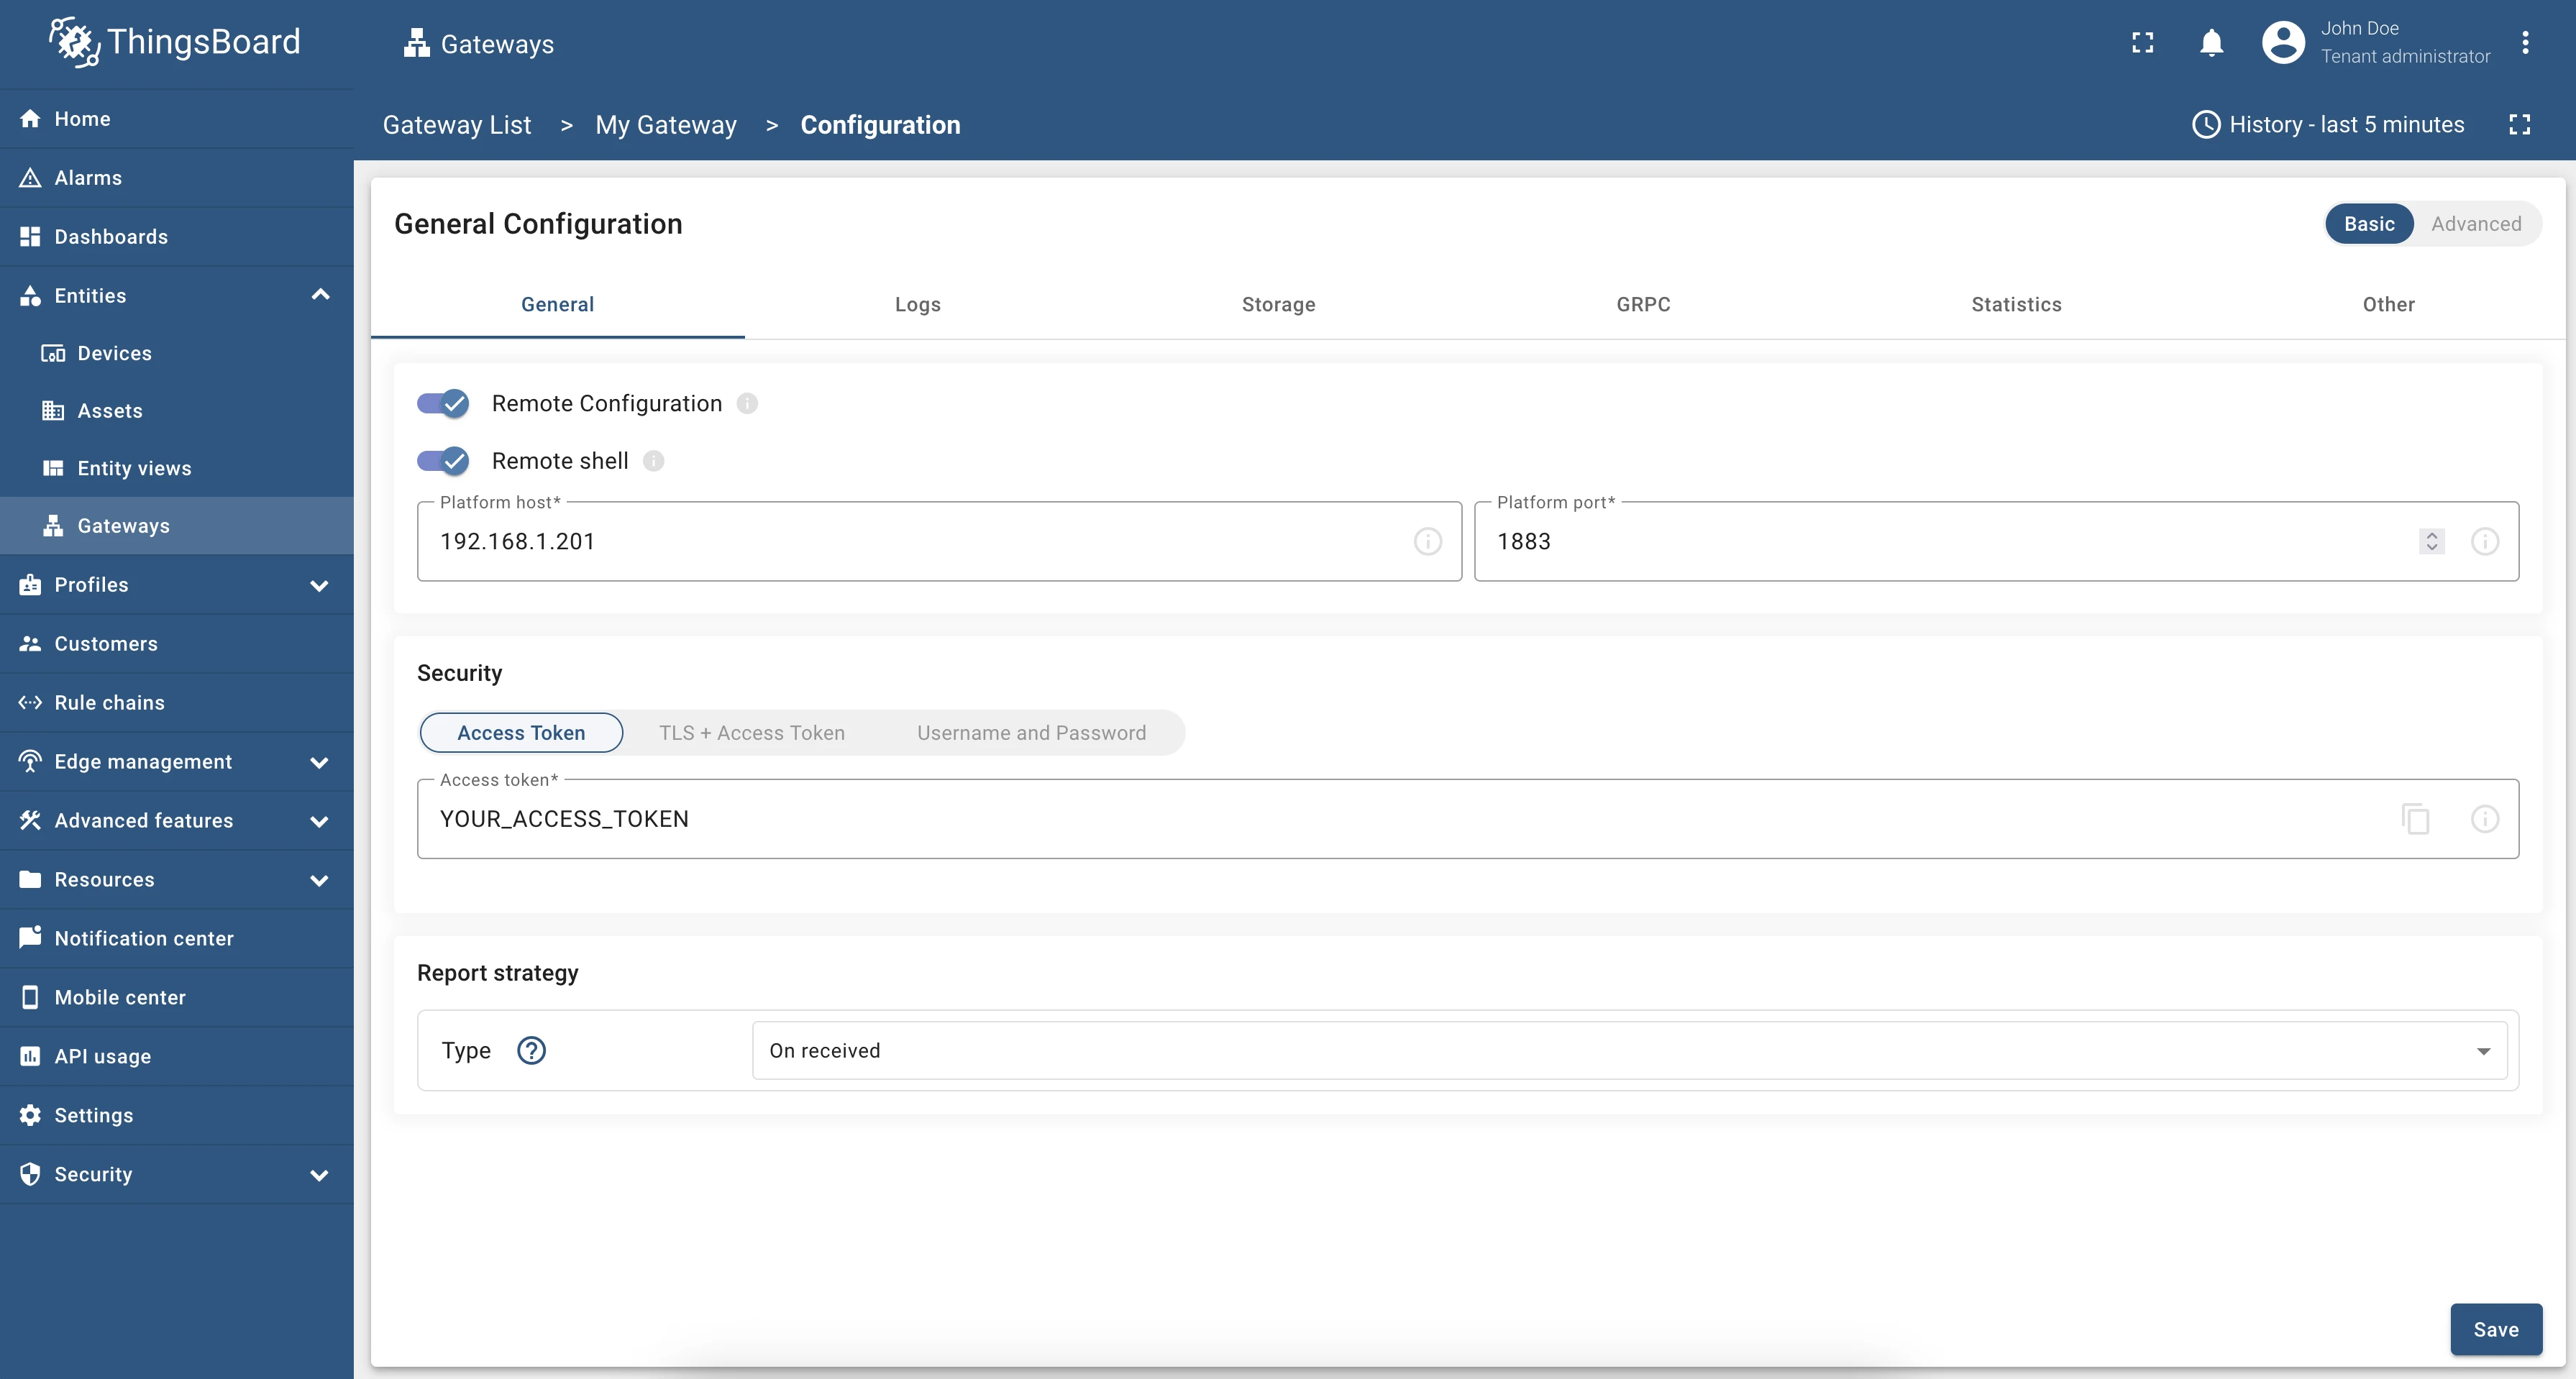
Section titled “Basic Configuration Mode”Each field has a hint tooltip accessible by hovering over the “i” icon.
The General tab contains the main connection and security settings:
- Remote Configuration — enables remote configuration and management of the gateway.
- Remote Shell — enables remote OS control from the Remote Shell widget.
- Platform host — hostname or IP address of the ThingsBoard platform server.
- Platform port — MQTT service port on the platform server.
- Security type — three types are supported for remote configuration:
- Access Token
- TLS + Access Token
- Username and Password
- TLS + Private Key (not yet supported)
- Report strategy — strategy for sending gateway status to ThingsBoard:
- On report period — sends status after each report period.
- On value change — sends status when the value changes.
- On value change or report period — combines both conditions.
- On received — sends status after receiving data from a device (default).
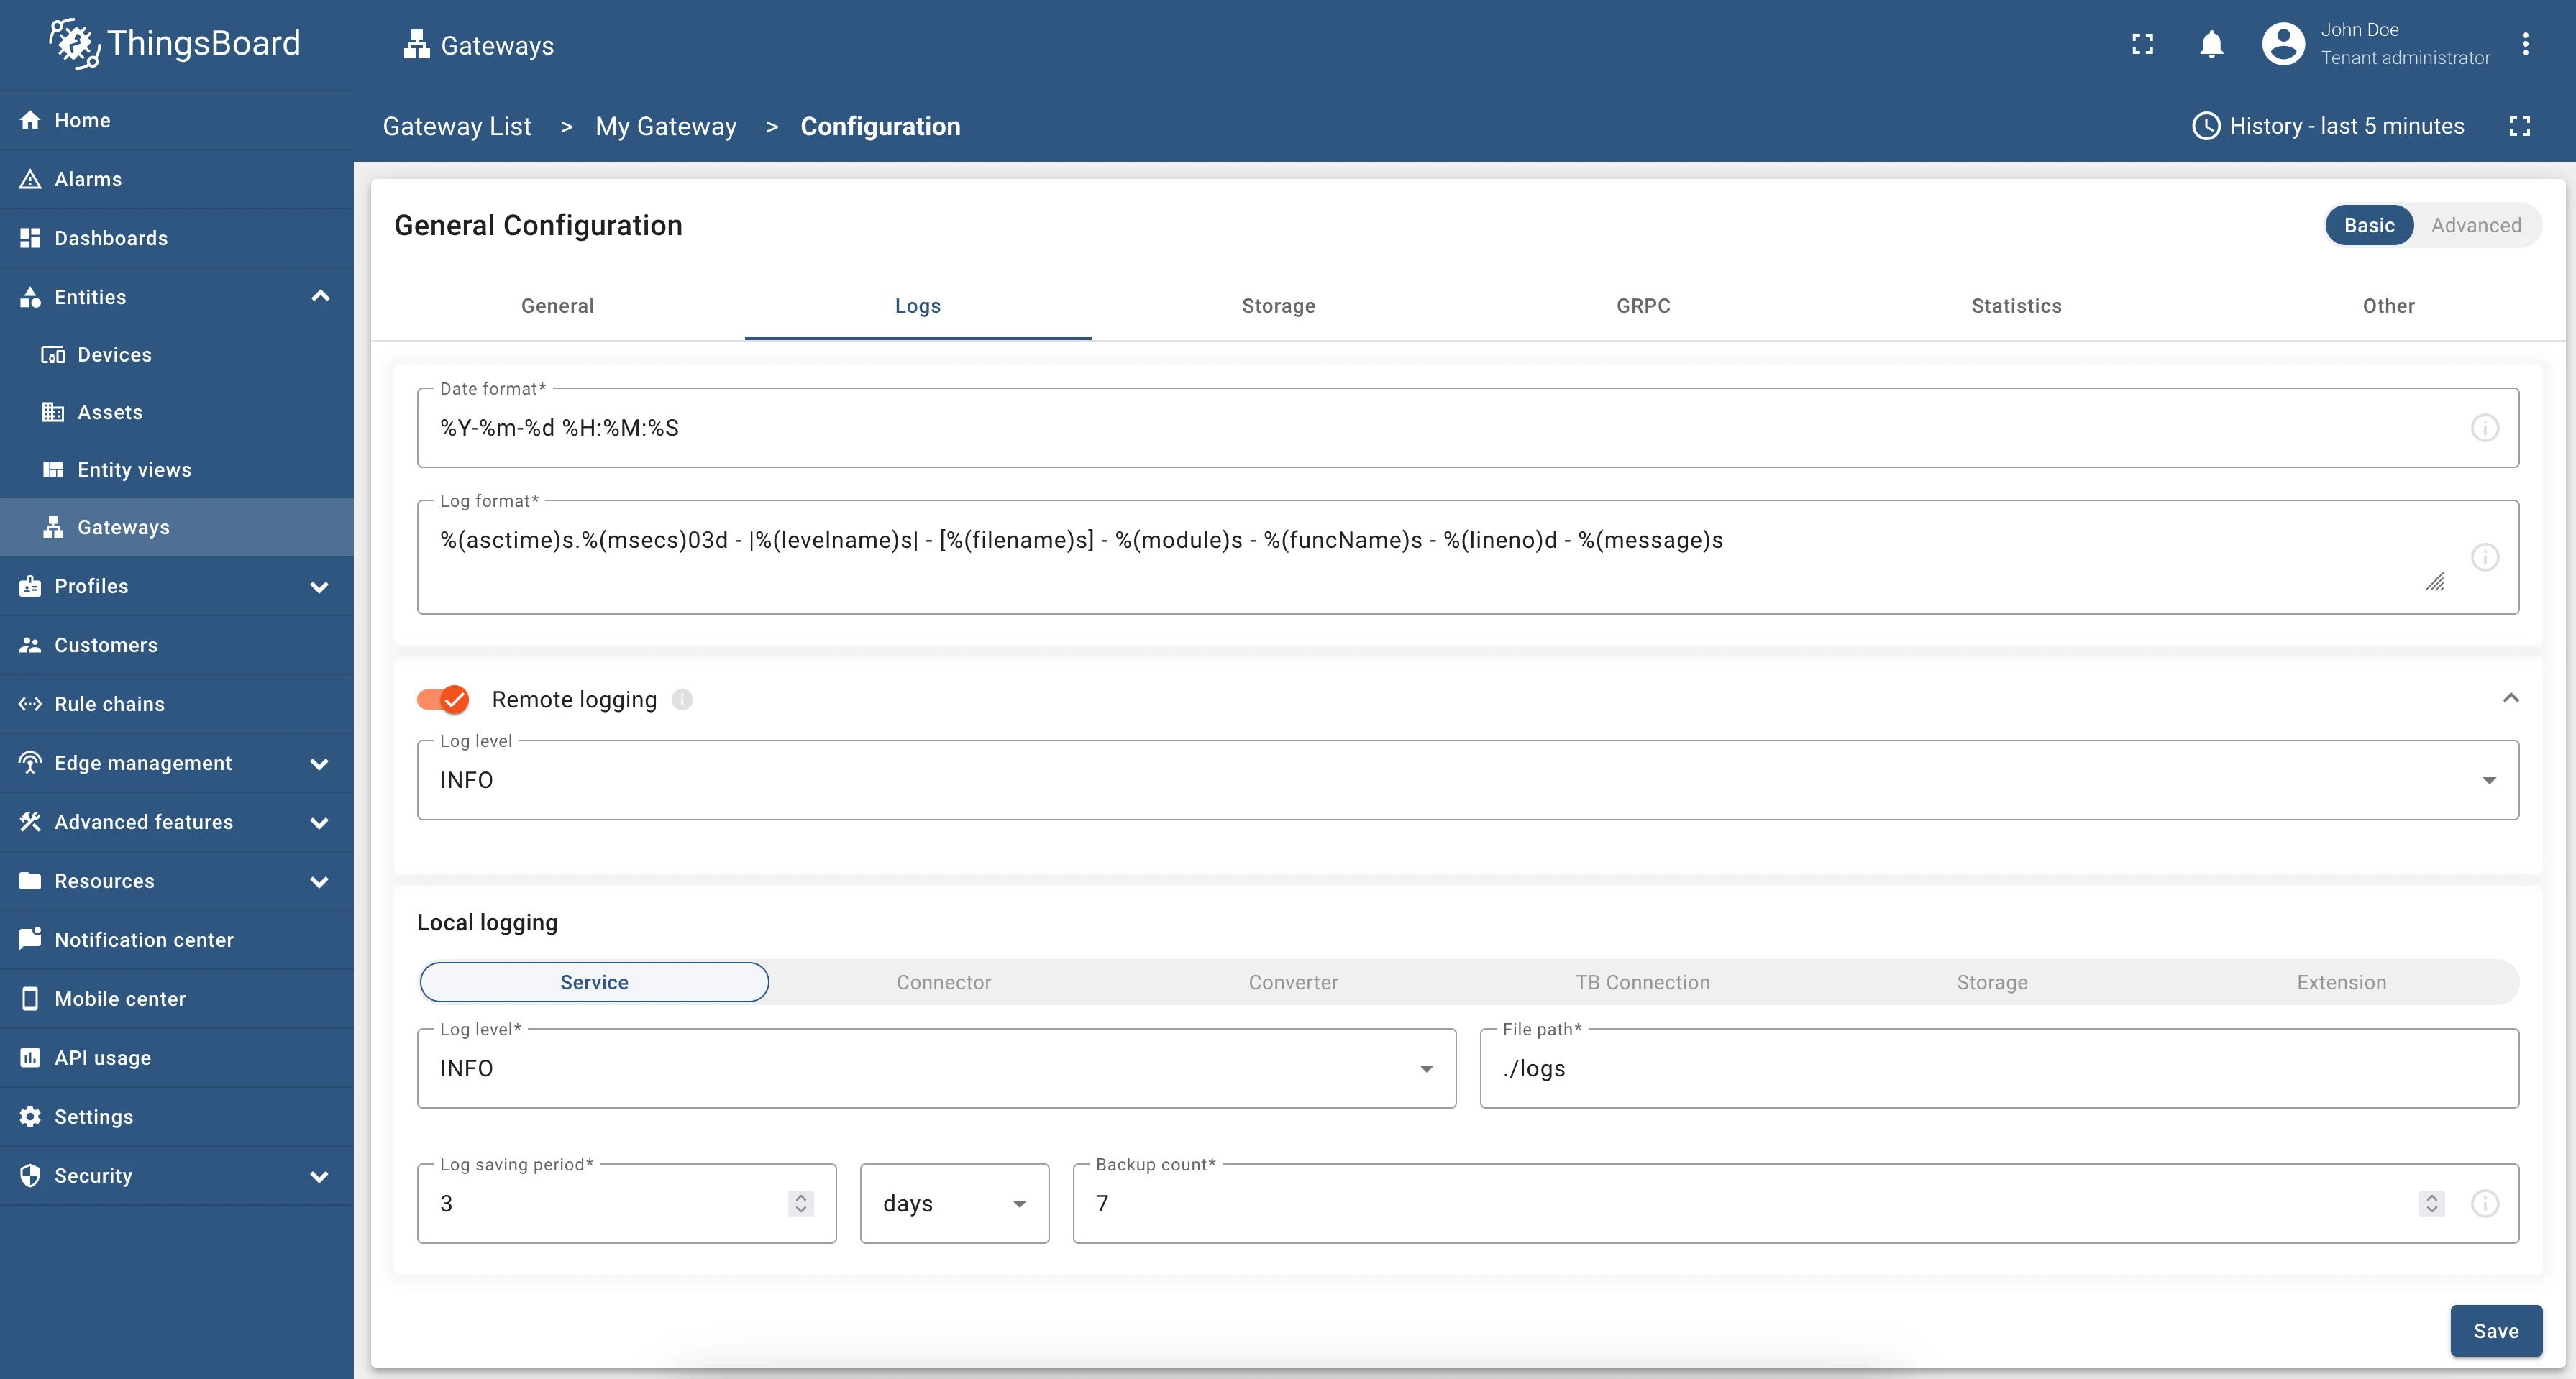
The Logs tab configures local and remote logging. It has three sections:
General log settings (standard Python logging module options):
- Date format — format of the timestamp in log messages.
- Log format — format of the full log message.
Remote logging:
- Remote logs — enables remote logging and log reading from the gateway.
- Log level — minimum level to capture remotely.
Local logging — per-logger settings for Service, Connector, Converter, TB Connection, Storage, and Extension:
- Log level — INFO, DEBUG, WARNING, ERROR, CRITICAL, TRACE, or NONE.
- File path — path to the log folder.
- Log saving period — rotation interval.
- Backup count — number of rotated log files to retain (oldest are deleted when the limit is reached).
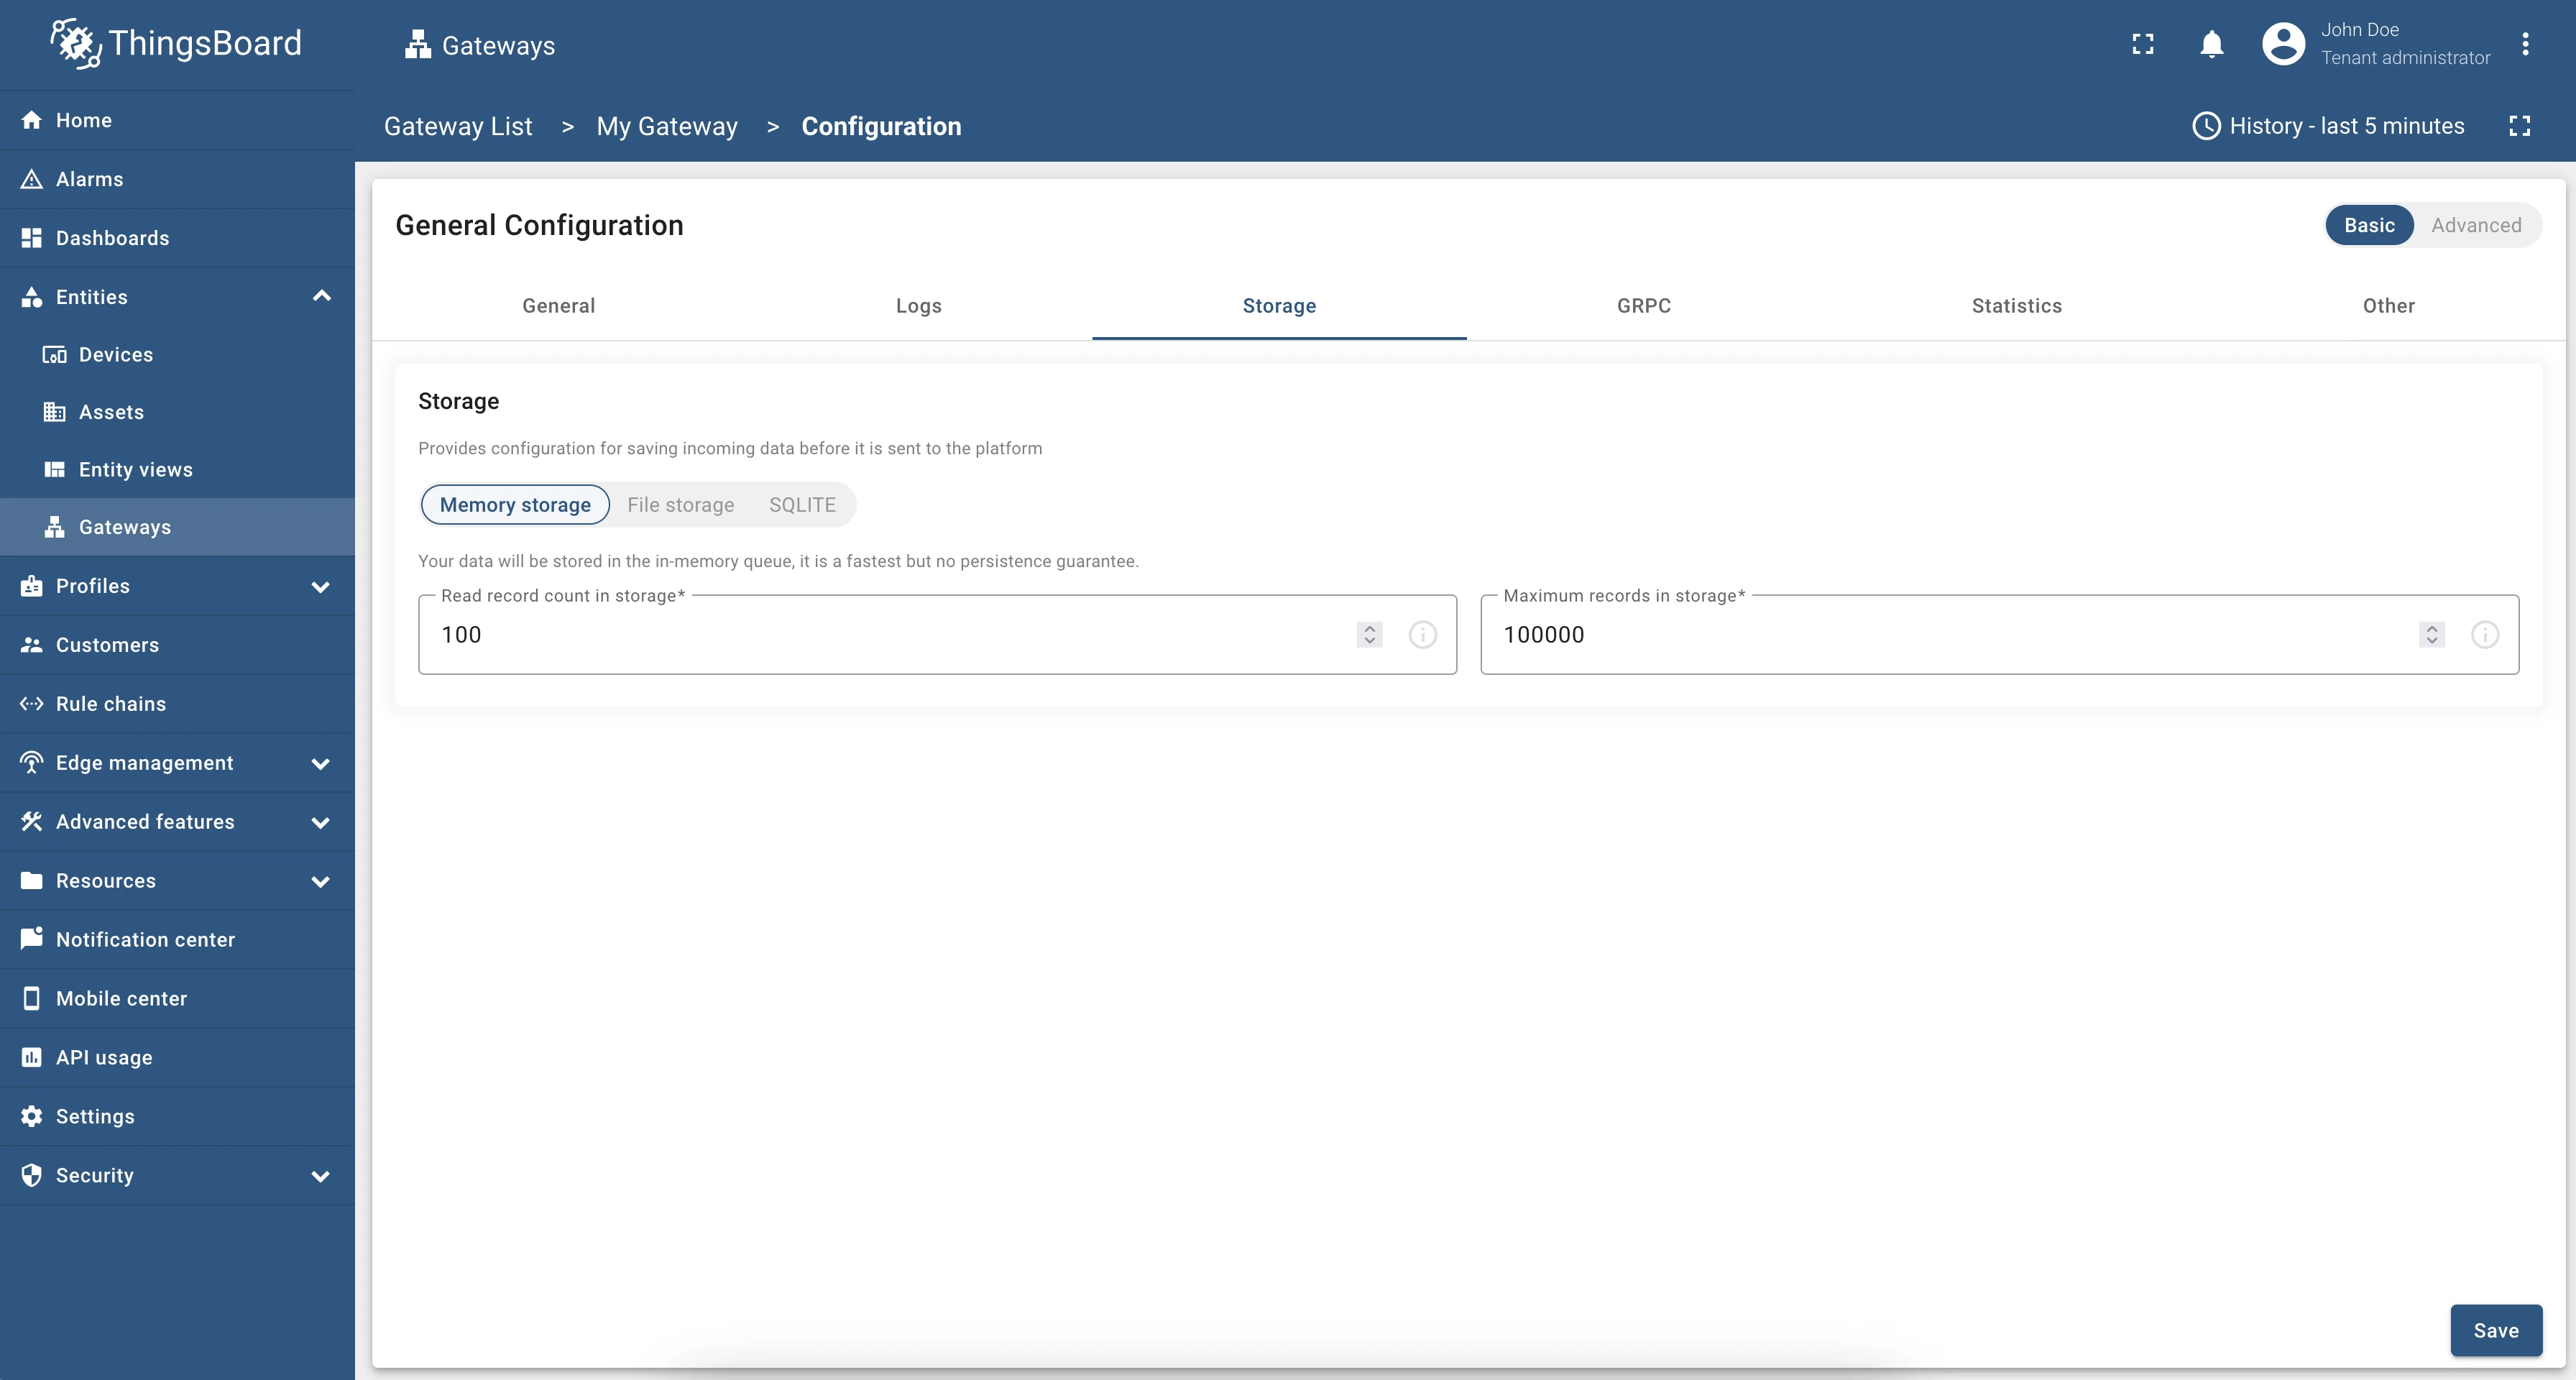
The Storage tab configures how incoming data is buffered before being sent to the platform. Three storage backends are available:
- Memory storage — data is kept in RAM.
- File storage — data is written to the hard drive.
- SQLite — data is persisted in a
.dbfile.
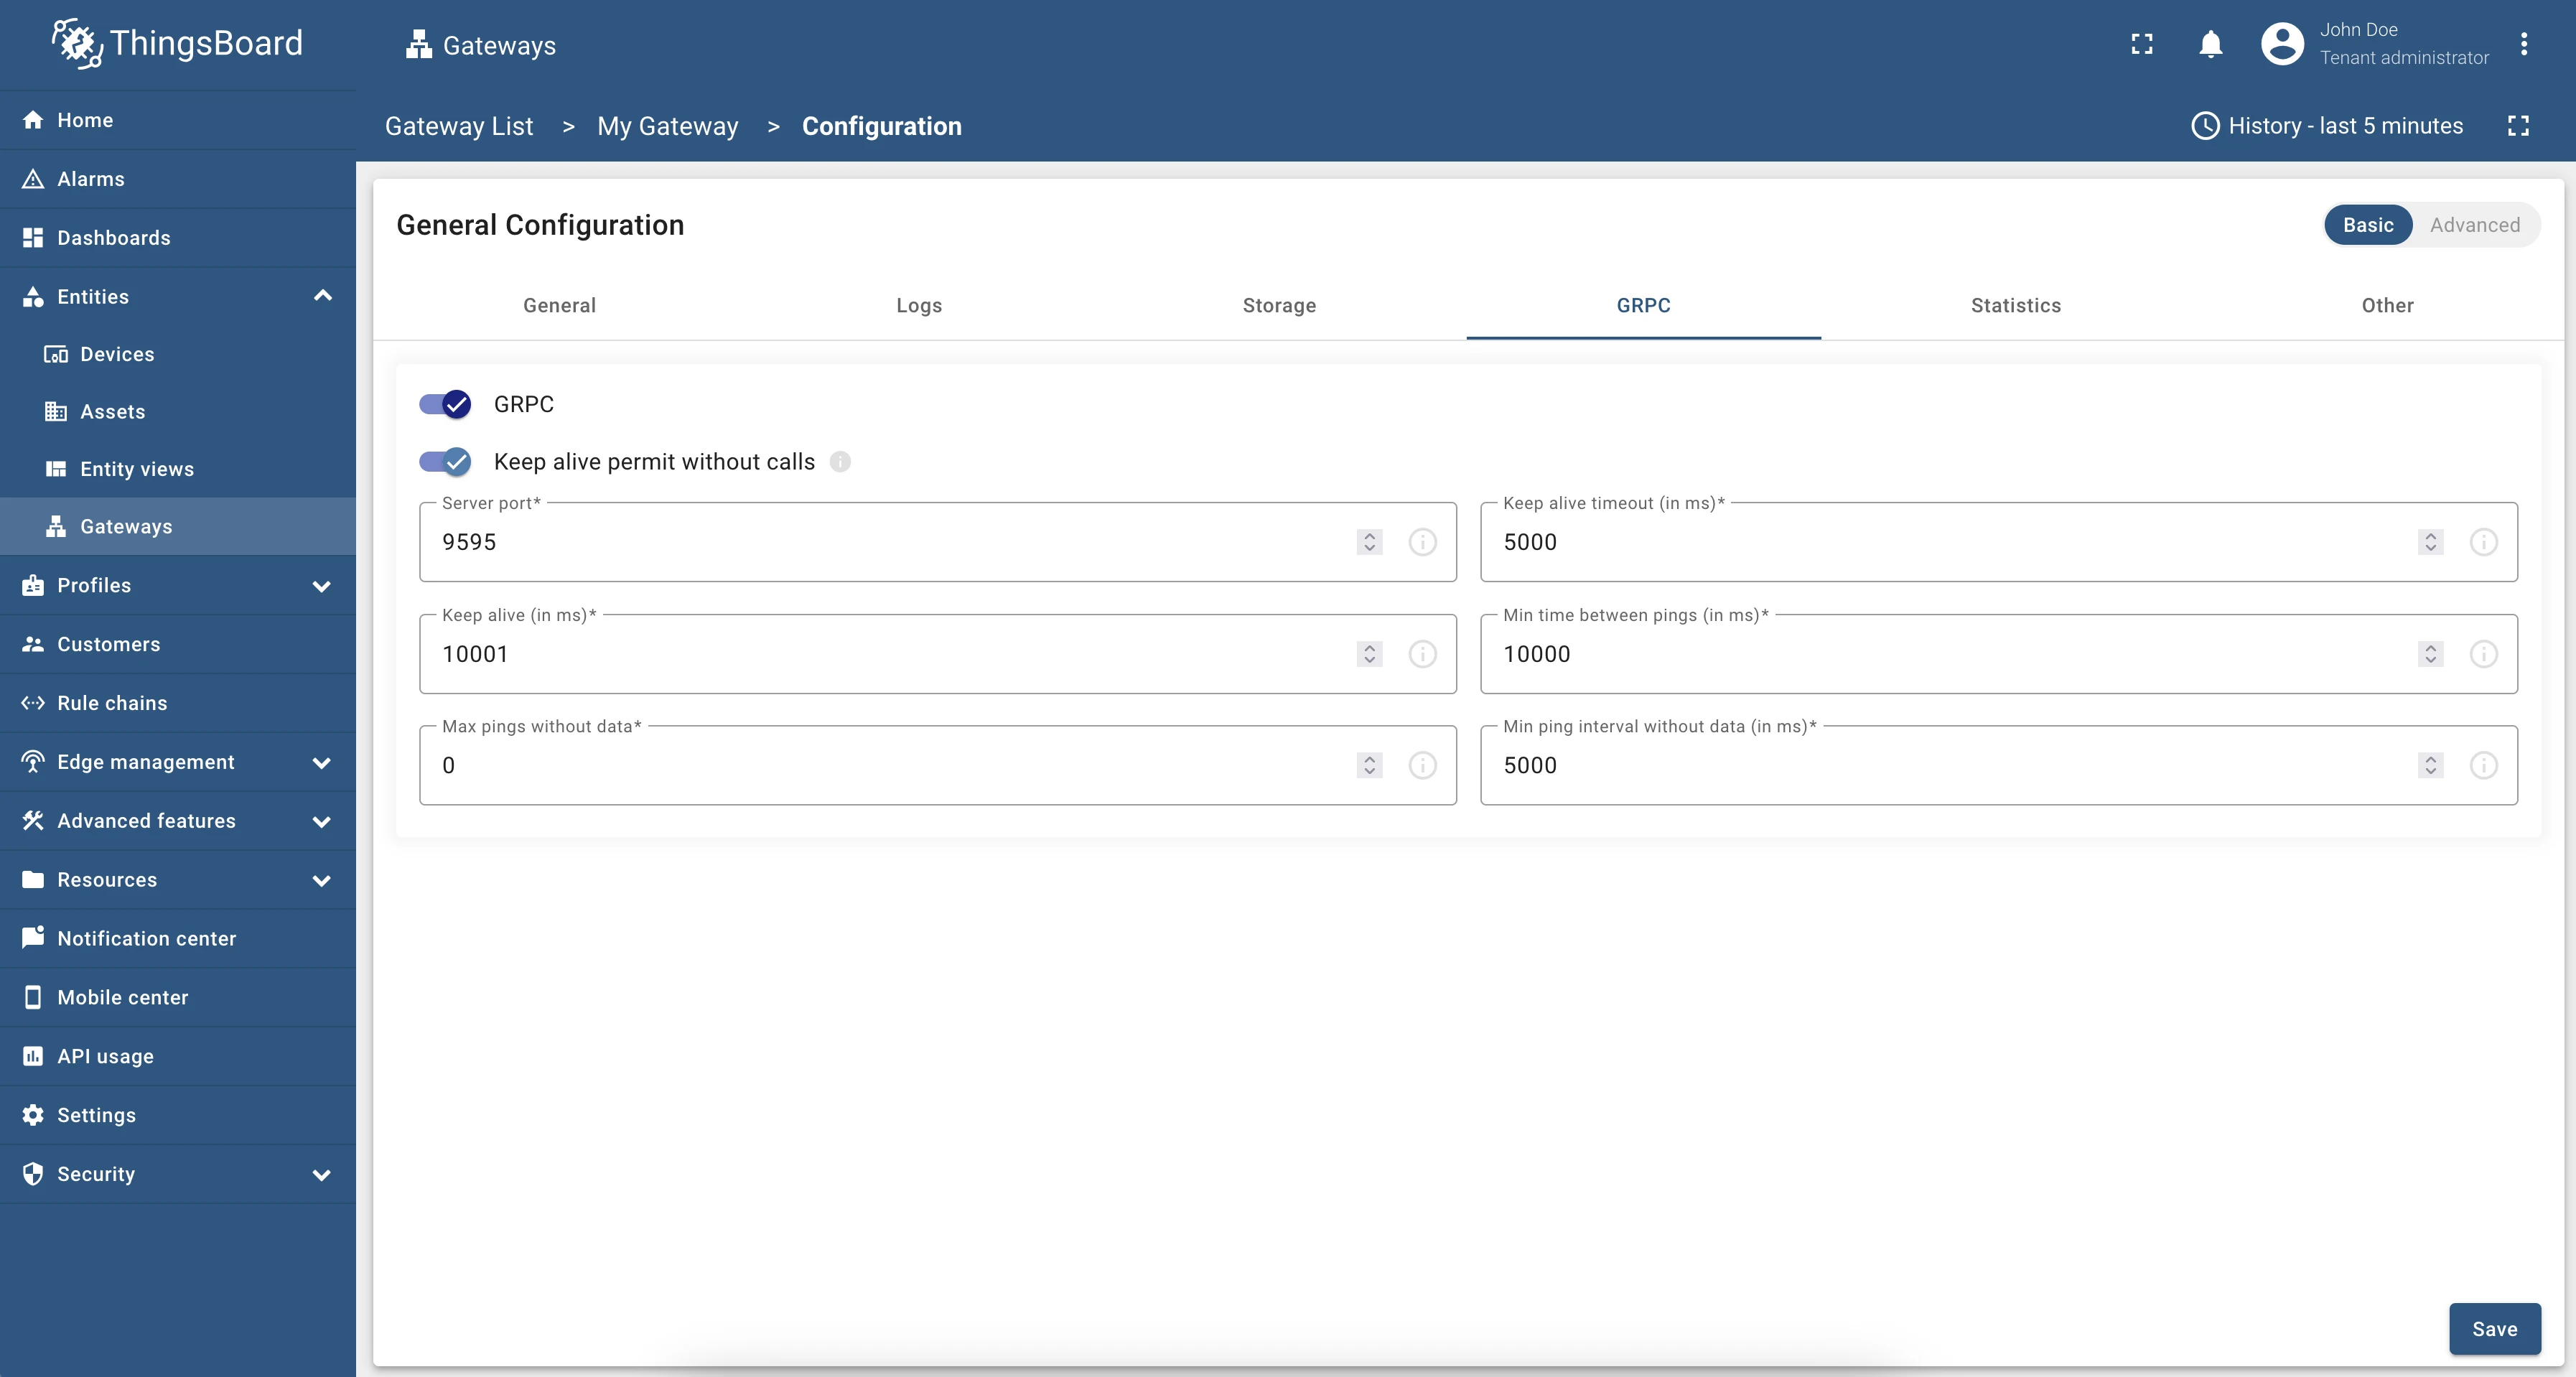
The GRPC tab configures the built-in gRPC server:
| Setting | Description |
|---|---|
| Server port | Network port for incoming gRPC connections |
| Keep alive permit without calls | Allow keepalive pings even when there are no active RPC calls |
| Keep alive | Interval (ms) between keepalive ping messages when idle |
| Max pings without data | Maximum keepalive pings without data before the connection is considered dead |
| Keep alive timeout | Time (ms) to wait for a keepalive ping response before closing the connection |
| Min time between pings | Minimum wait (ms) between outgoing keepalive pings |
| Min ping interval without data | Minimum wait (ms) between pings when no data is flowing |
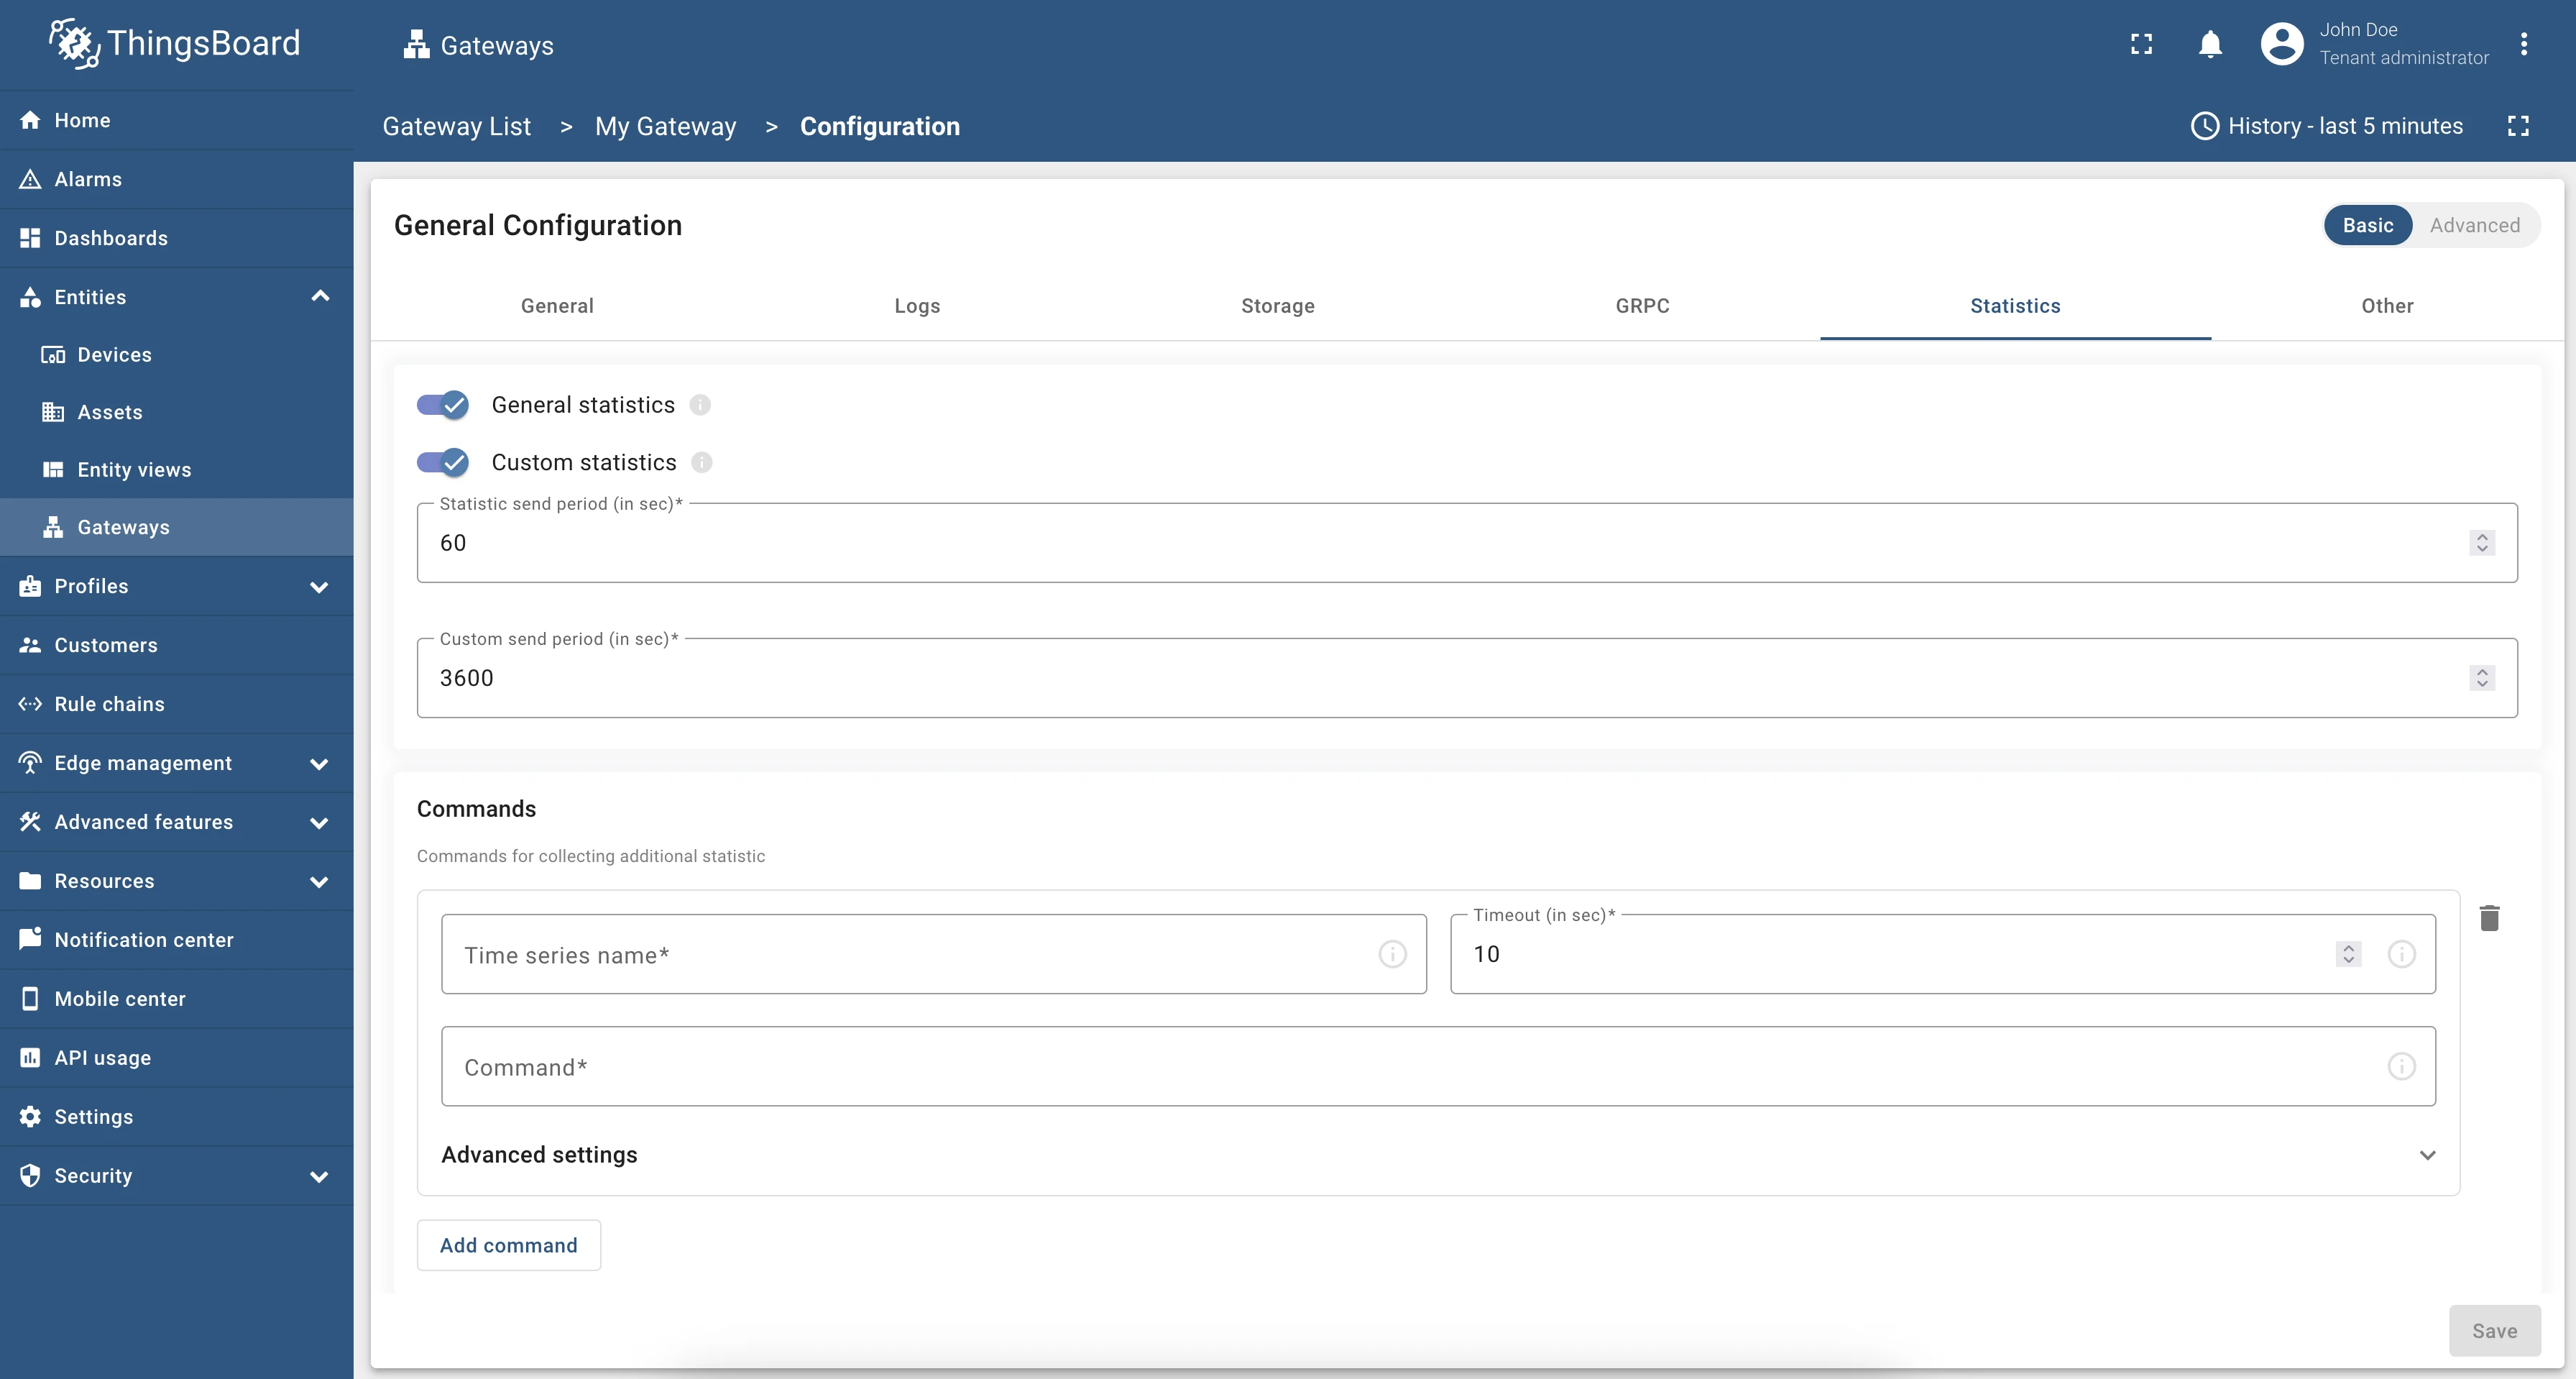
The Statistics tab enables and schedules gateway statistics collection:
- General statistics — enable/disable machine, storage, and connector statistics.
- Custom statistics — enable/disable custom command-based statistics collection.
- Statistic send period (seconds) — how often general statistics are sent.
- Custom send period (seconds) — how often custom statistics are sent.
- Commands — list of commands whose output is reported as telemetry (click Add command to add one):
- Timeseries name — telemetry key for the result.
- Timeout (seconds) — command execution timeout.
- Command — shell command whose output becomes the telemetry value (e.g.
/bin/sh -c "ipconfig getifaddr en0"). - Advanced → Install command — command to install required packages before running the main command.
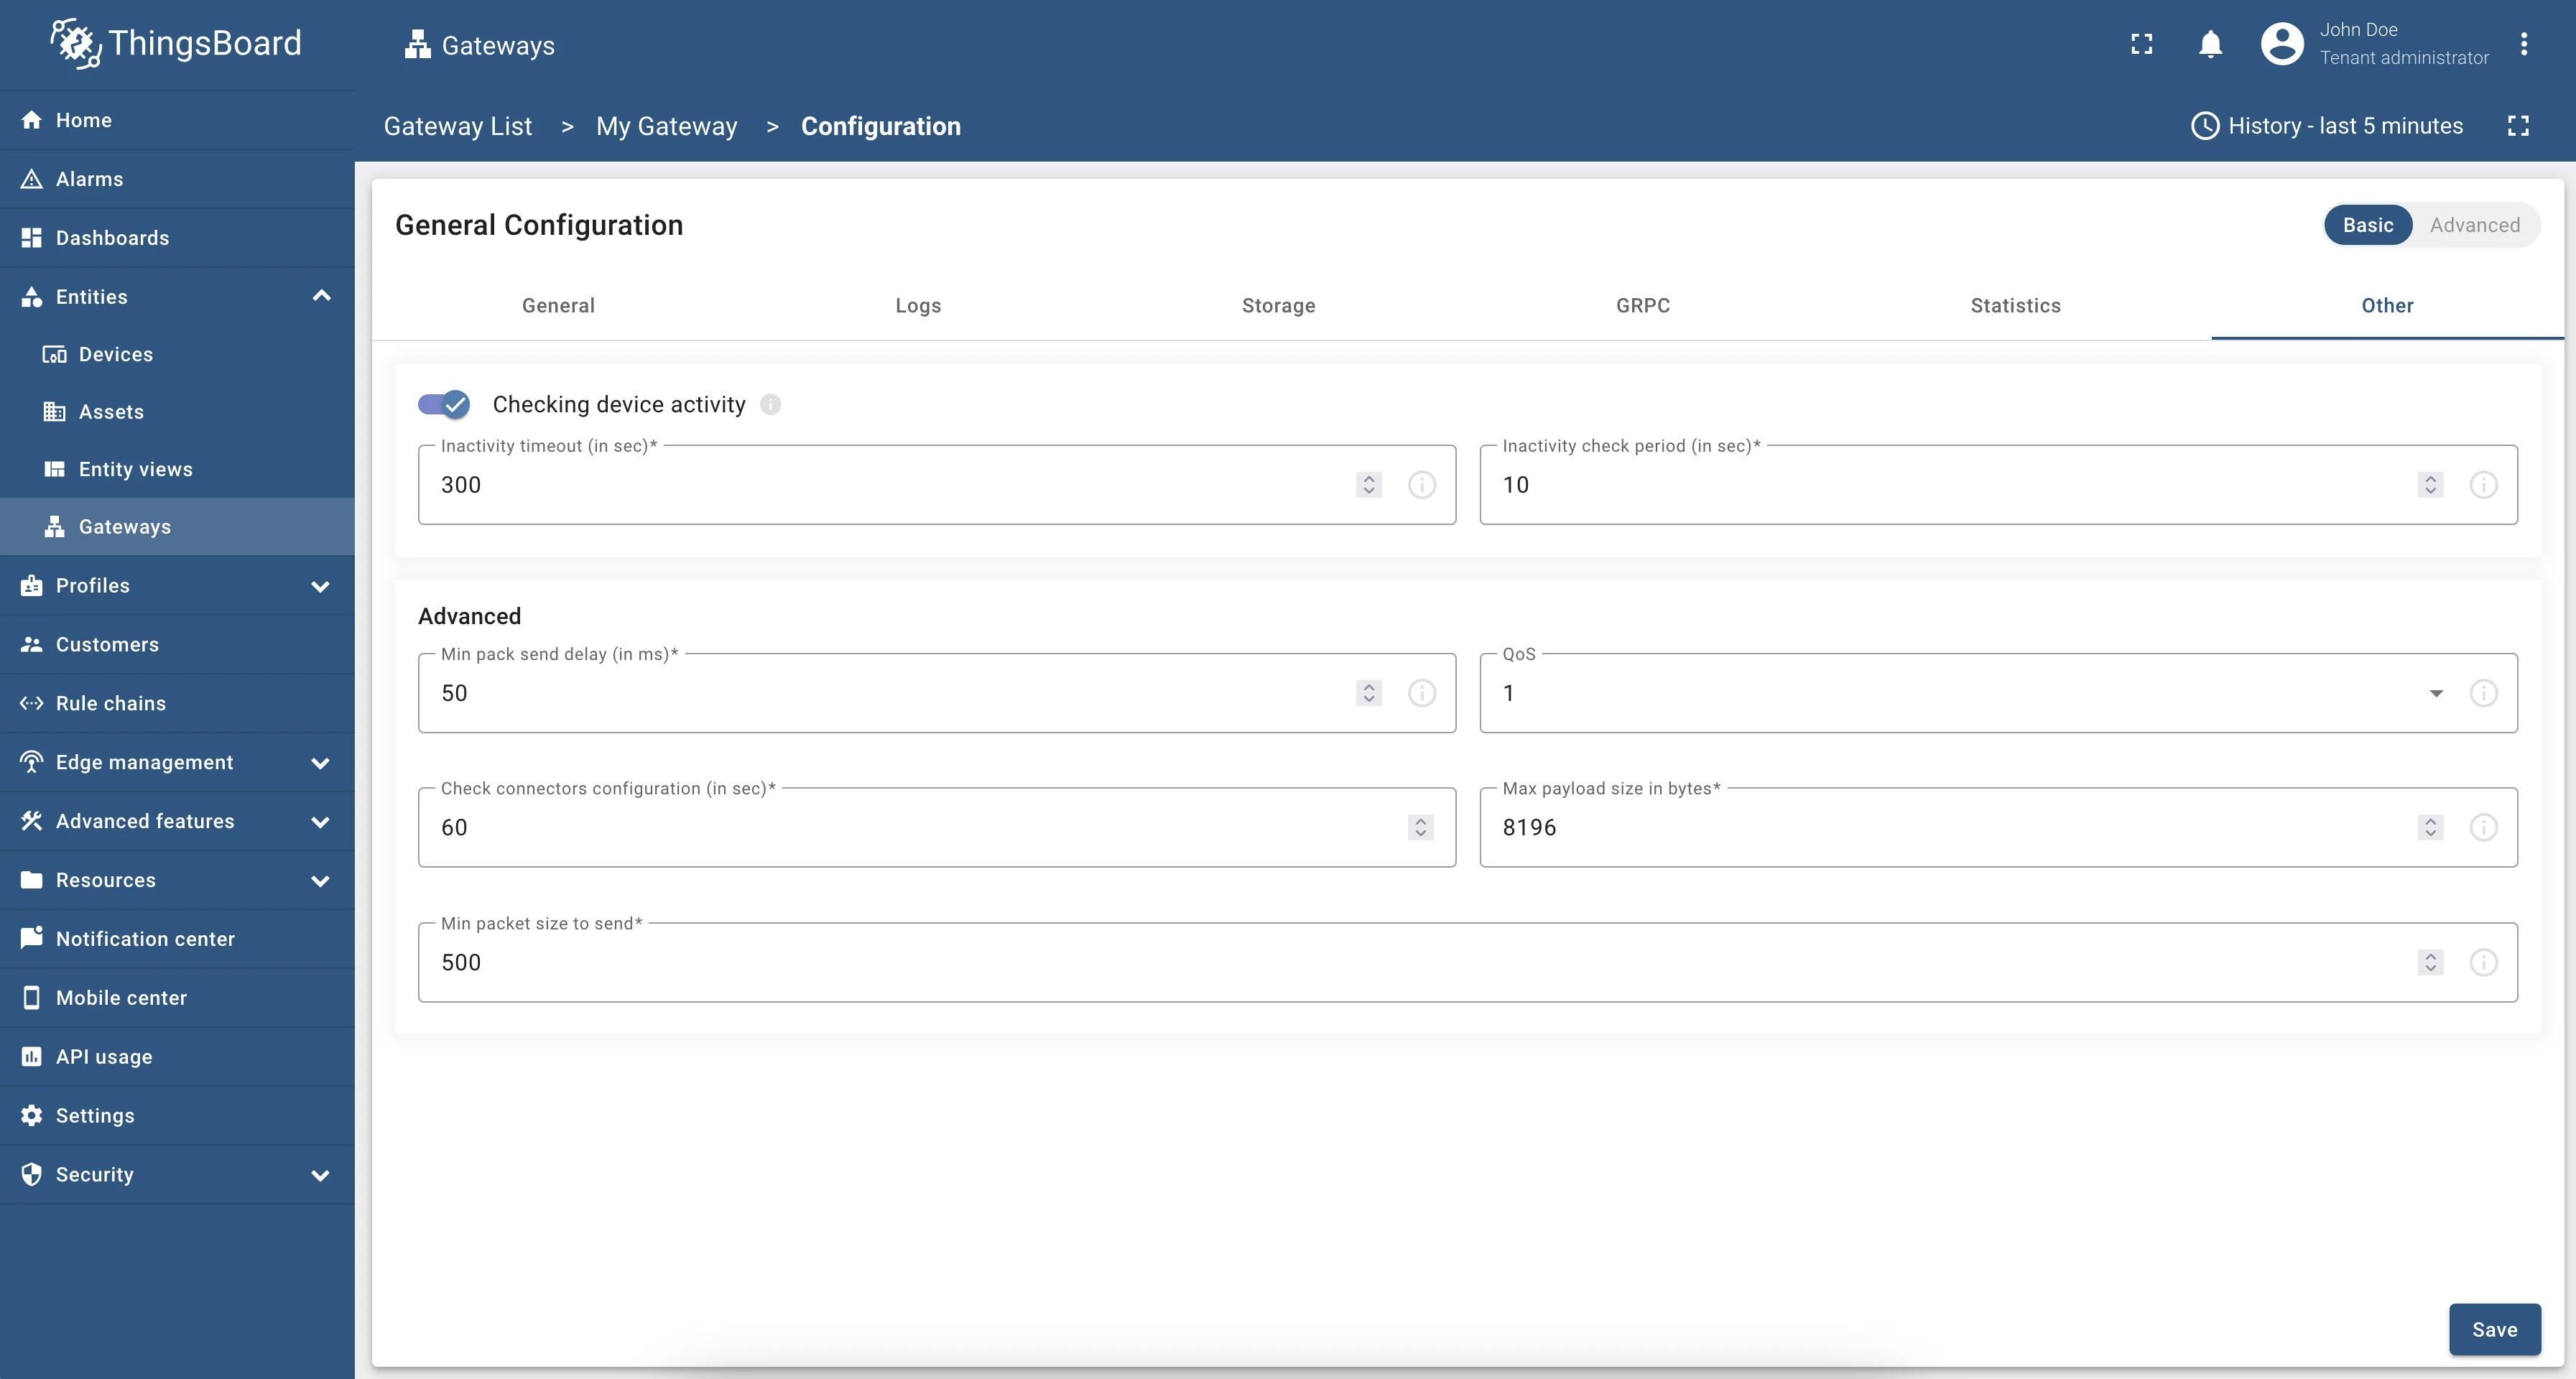
The Other tab contains additional gateway parameters:
Checking device activity:
- Inactivity timeout (seconds) — time after which an inactive device is disconnected.
- Inactivity check period (seconds) — how often device activity is checked.
Advanced:
| Setting | Description |
|---|---|
| Min pack send delay (ms) | Delay between sending packets — lower values increase CPU usage |
| QoS | MQTT quality of service: 0 (at most once) or 1 (at least once) |
| Check connectors’ configuration (seconds) | How often connector configurations are checked for changes |
| Max payload size (bytes) | Largest message the gateway will process — prevents oversized payloads |
| Min packet size to send | Minimum message size for transmission — prevents sending incomplete packets |
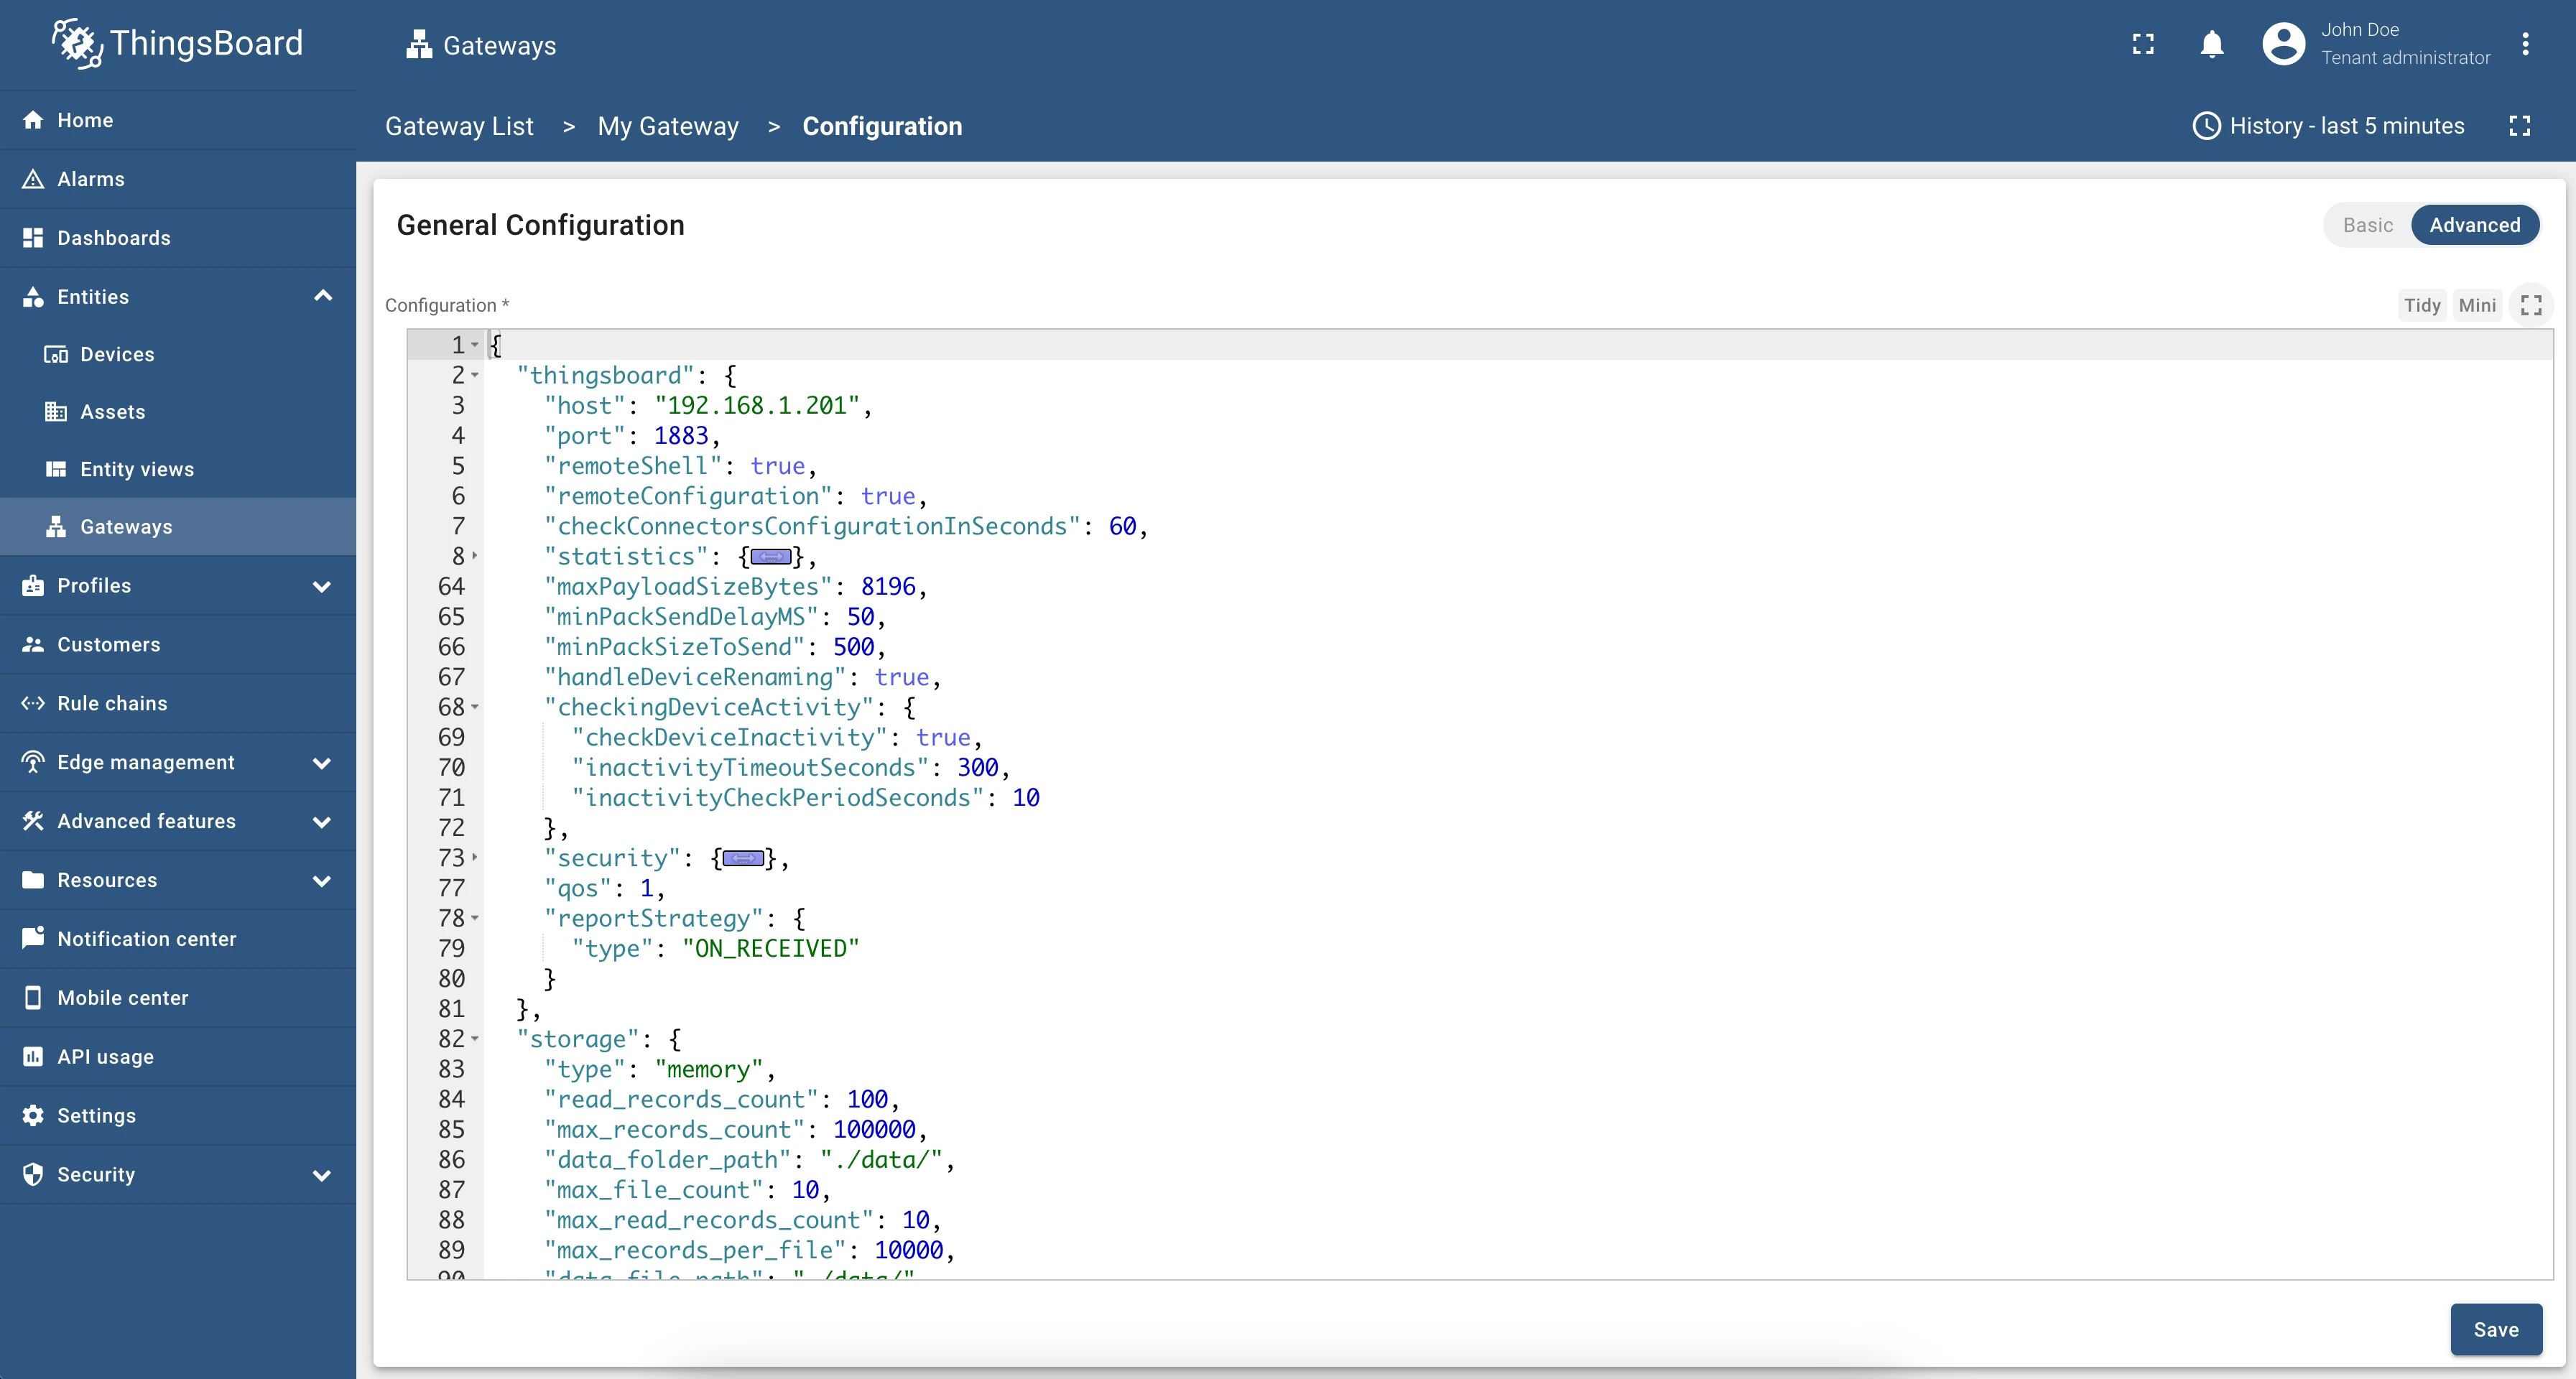
Advanced Configuration Mode
Section titled “Advanced Configuration Mode”Advanced mode lets you edit the full gateway configuration as JSON. This is useful for settings that are not exposed in the Basic mode form.
Connectors Configuration
Section titled “Connectors Configuration”Click Connectors configuration in the Navigation Panel to open the connectors management page.
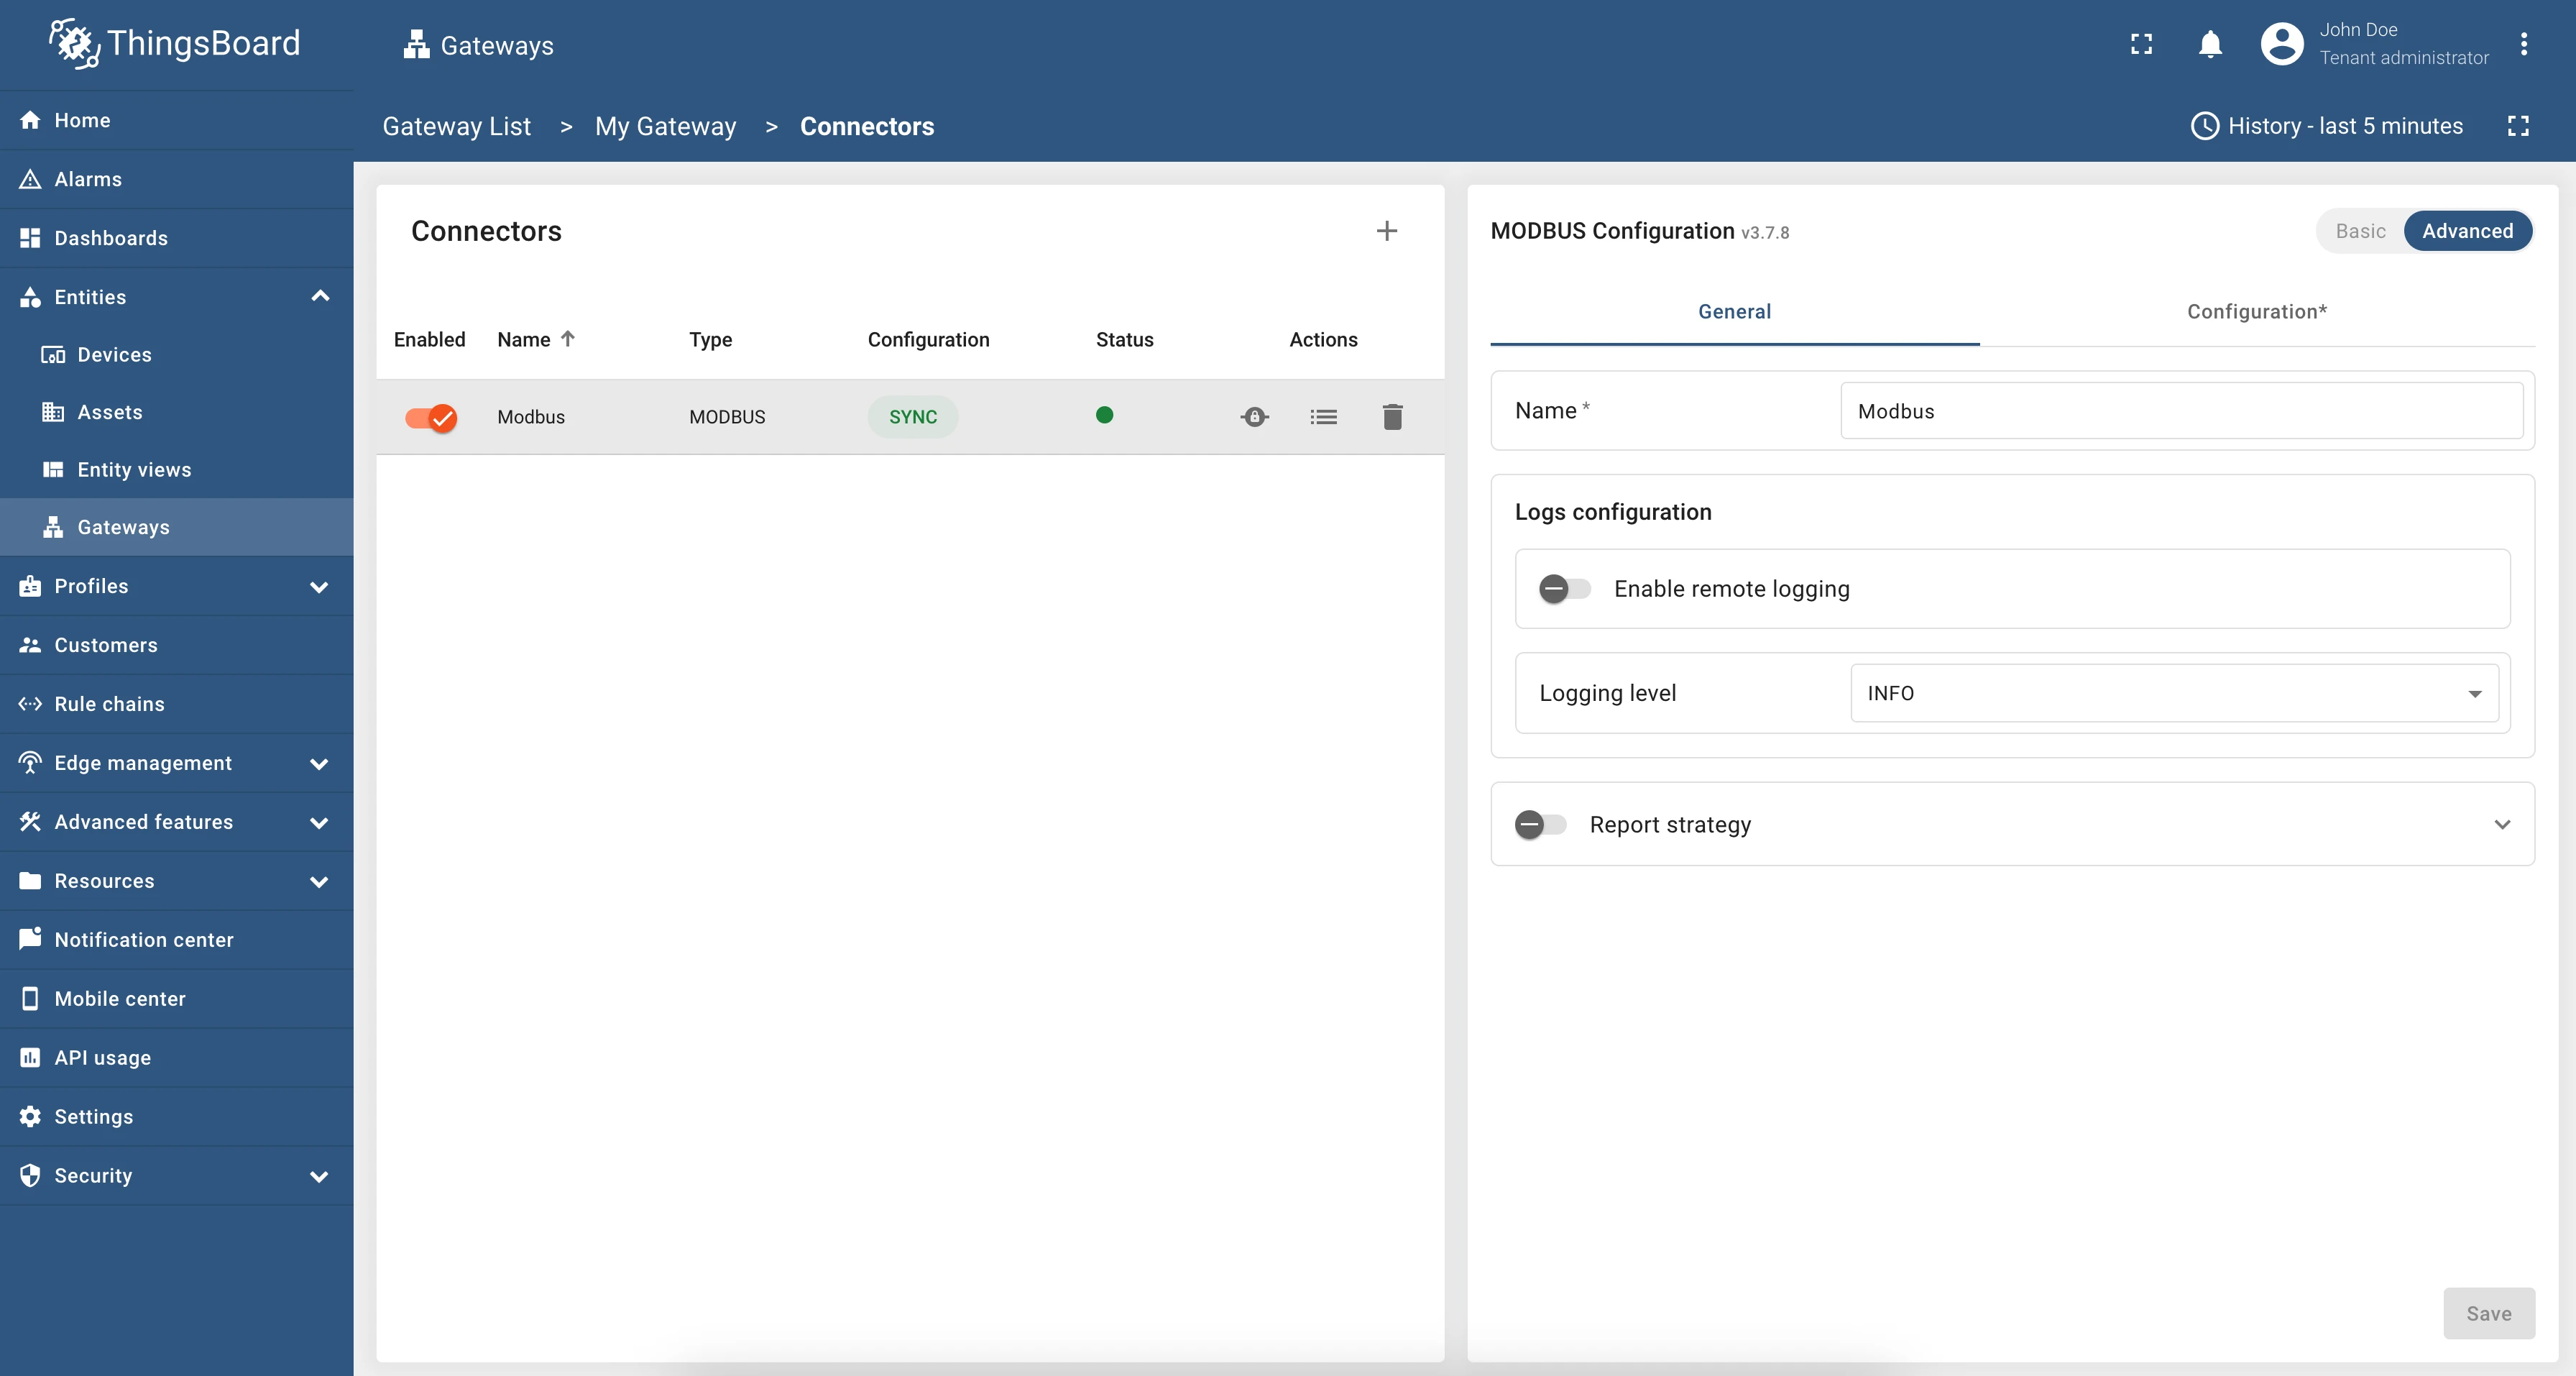
The page has two sections:
Connectors list — shows all created connectors with the following controls per row:
| Column / Action | Description |
|---|---|
| Enabled toggle | Enable or disable the connector |
| Name | Connector name |
| Type | Connector type |
| Configuration status | Whether the remote configuration is in sync with the local configuration |
| Status indicator | Green = no errors, working correctly; Red = connector not working |
| RPC | Opens the RPC dashboard for sending commands through the gateway to this connector |
| Logs | Opens the connector log dashboard |
| Delete | Removes the connector |
Connector configuration — the configuration form for the currently selected connector.
Click + in the top-right corner of the page to create a new connector.
Click Logs in the Navigation Panel to open the logs page.
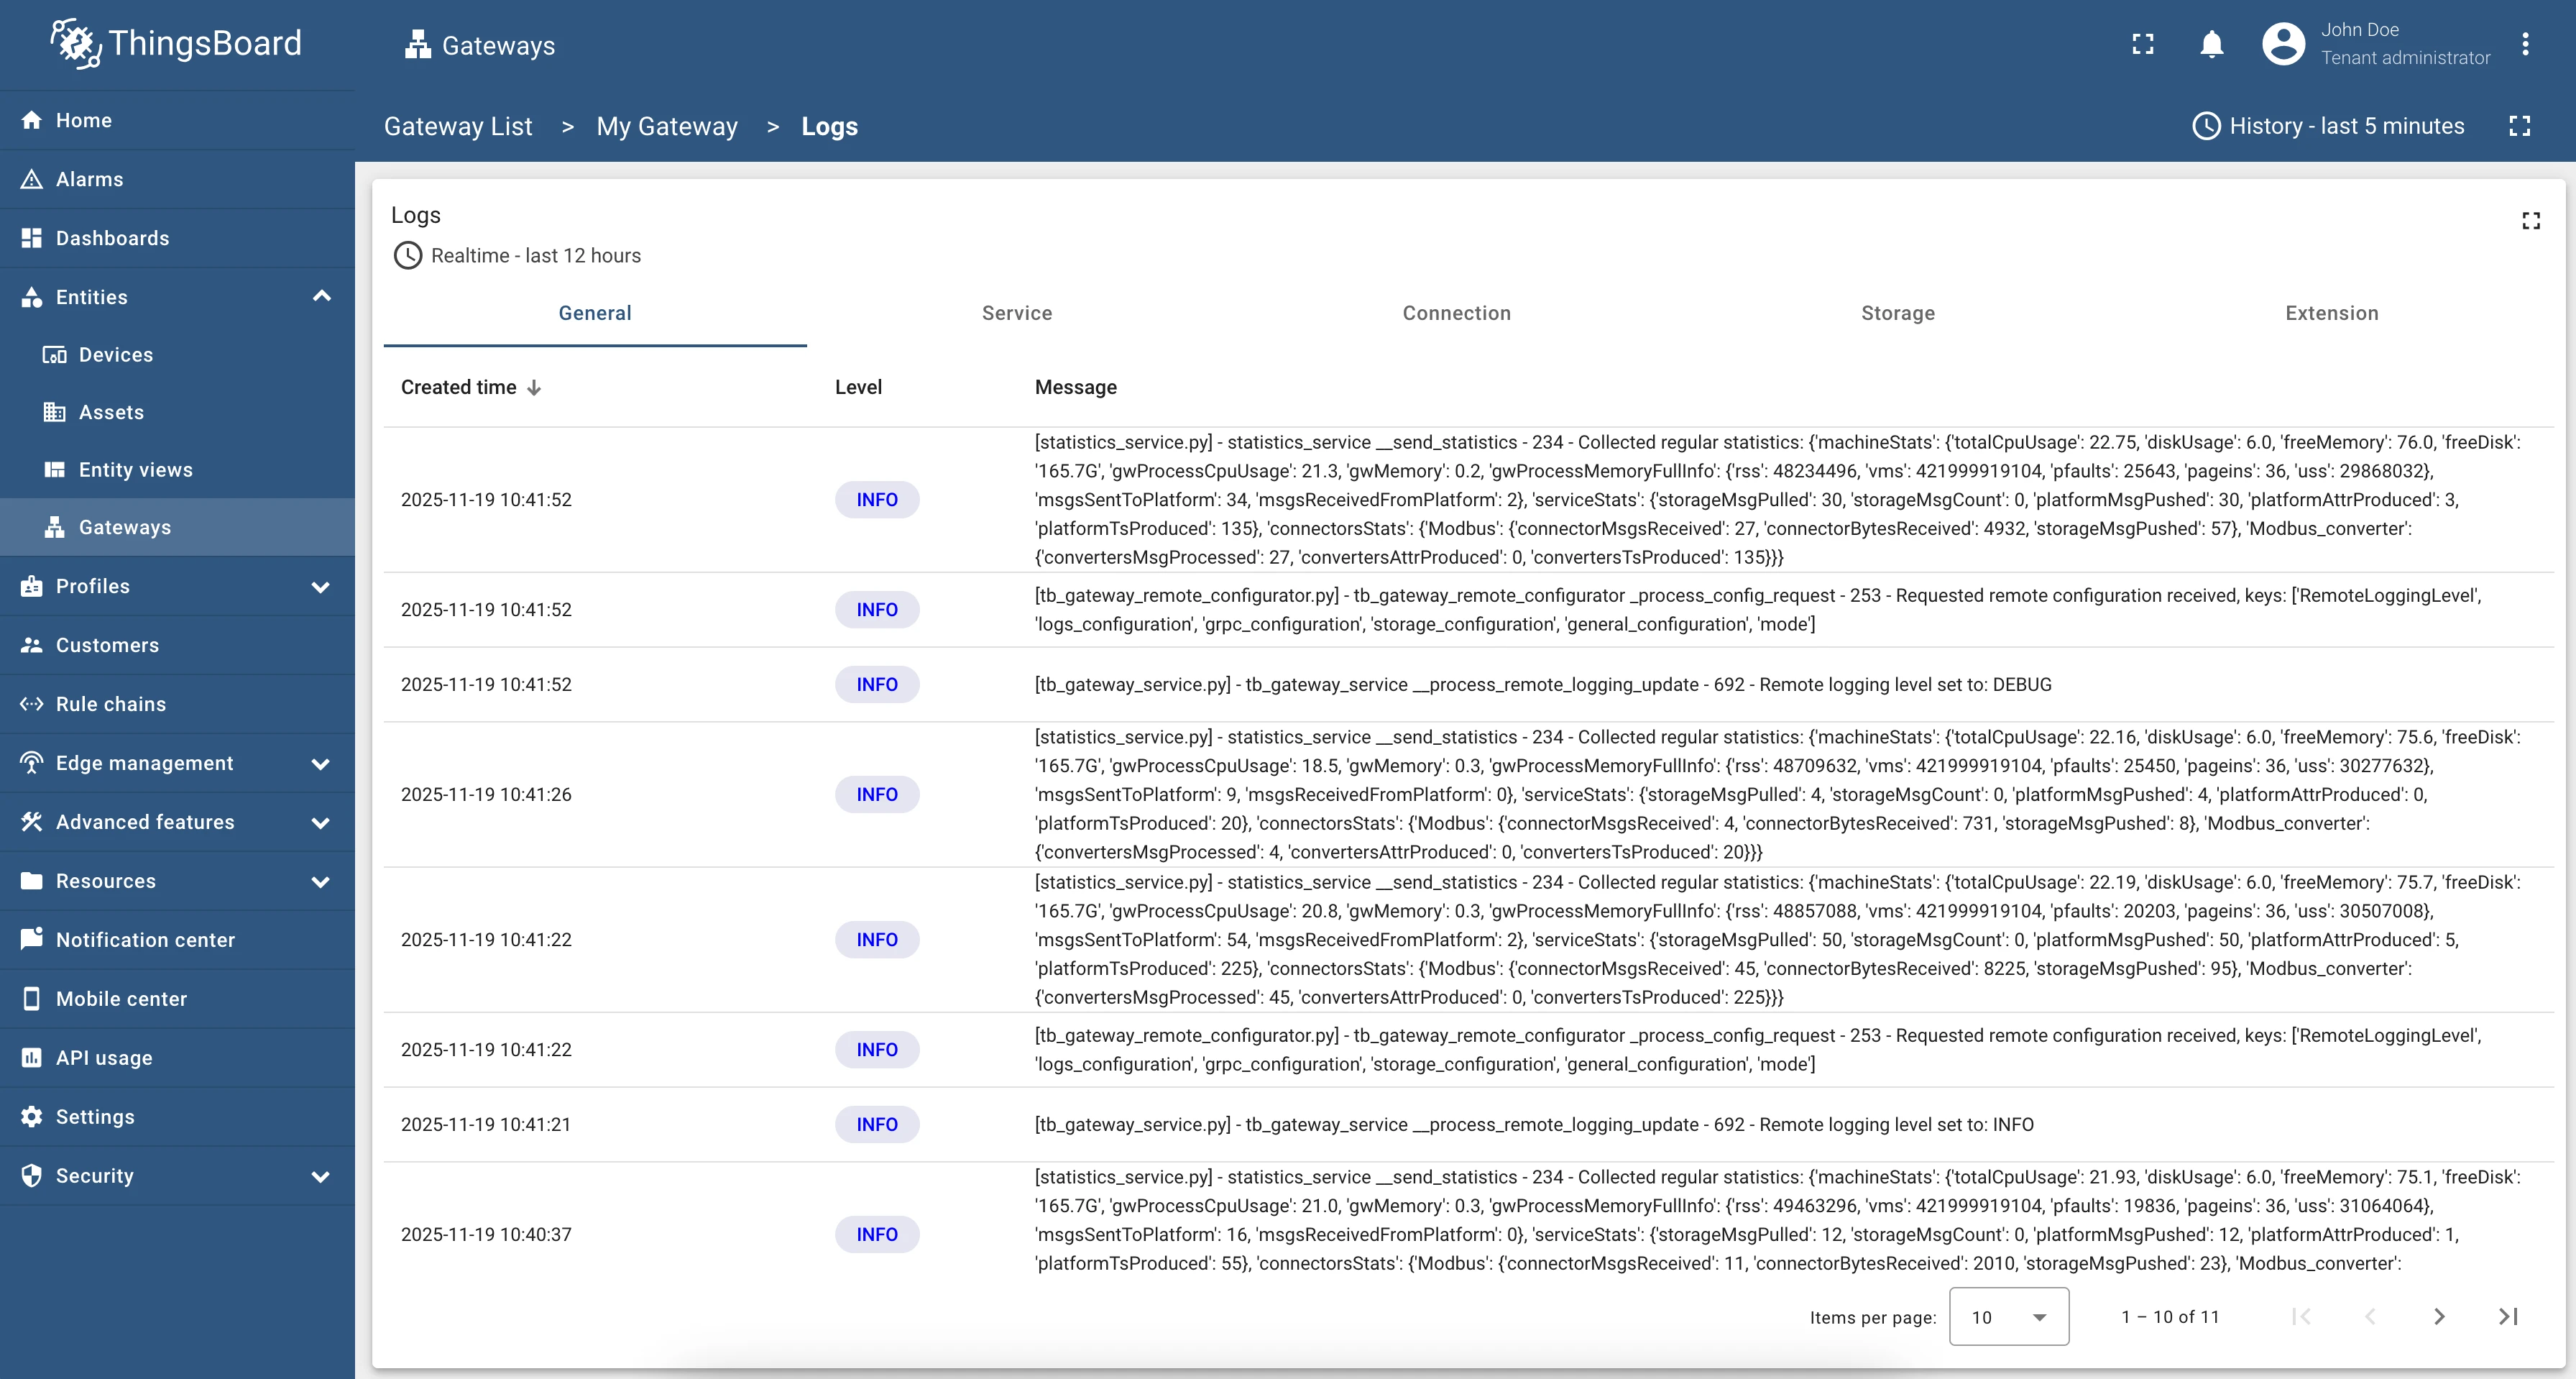
The dashboard shows real-time log entries across five log categories: General, Service, Connection, Storage, and Extension. Each entry shows:
- Created time
- Level (INFO, DEBUG, WARNING, ERROR, etc.)
- Message
Statistics
Section titled “Statistics”Click Statistics in the Navigation Panel to open the statistics page.
Use the right sidebar to switch between Storage, Machine, and Custom statistics views. The current gateway status is displayed in real time in the bottom-right corner of the page.
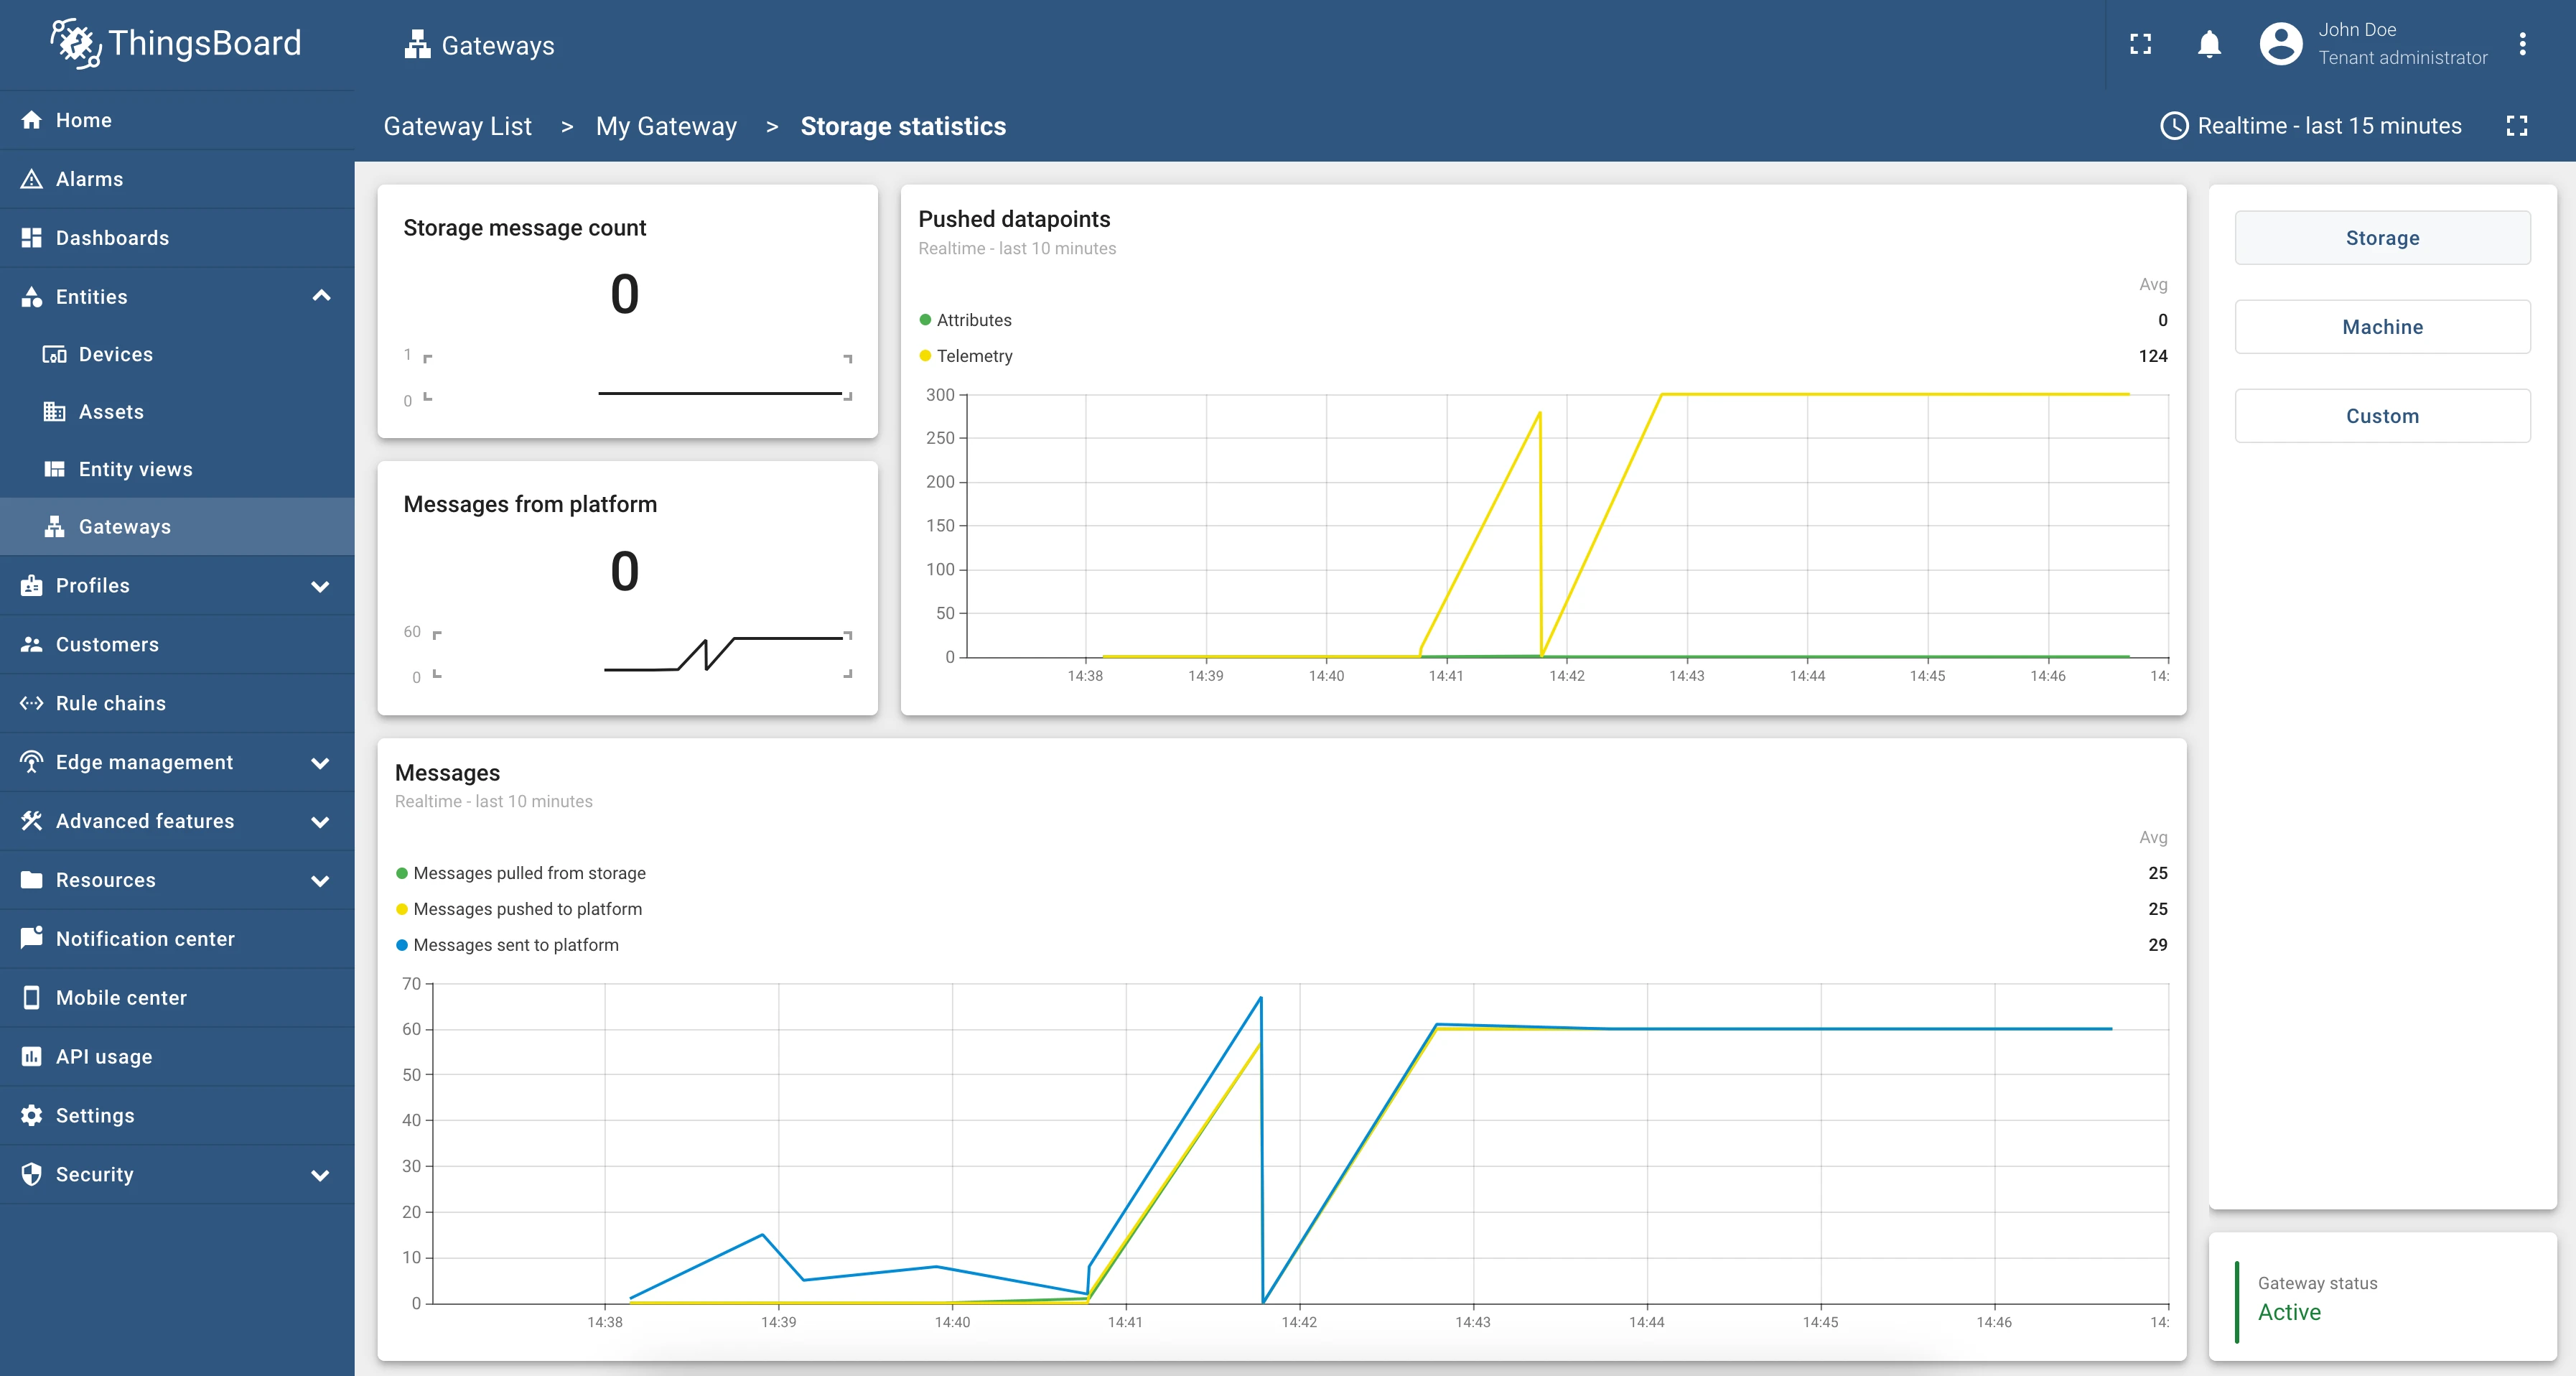
Storage Statistics
Section titled “Storage Statistics”Storage statistics show data about the gateway’s internal message buffer:
| Widget | Description |
|---|---|
| Storage message count | Total number of messages currently held in gateway storage |
| Message from platform | Total messages received from the platform |
| Pushed datapoints chart | Cumulative telemetry and attribute data points pushed to the platform |
| Messages chart | Breakdown of messages pulled from storage, pushed to platform, and sent to platform |
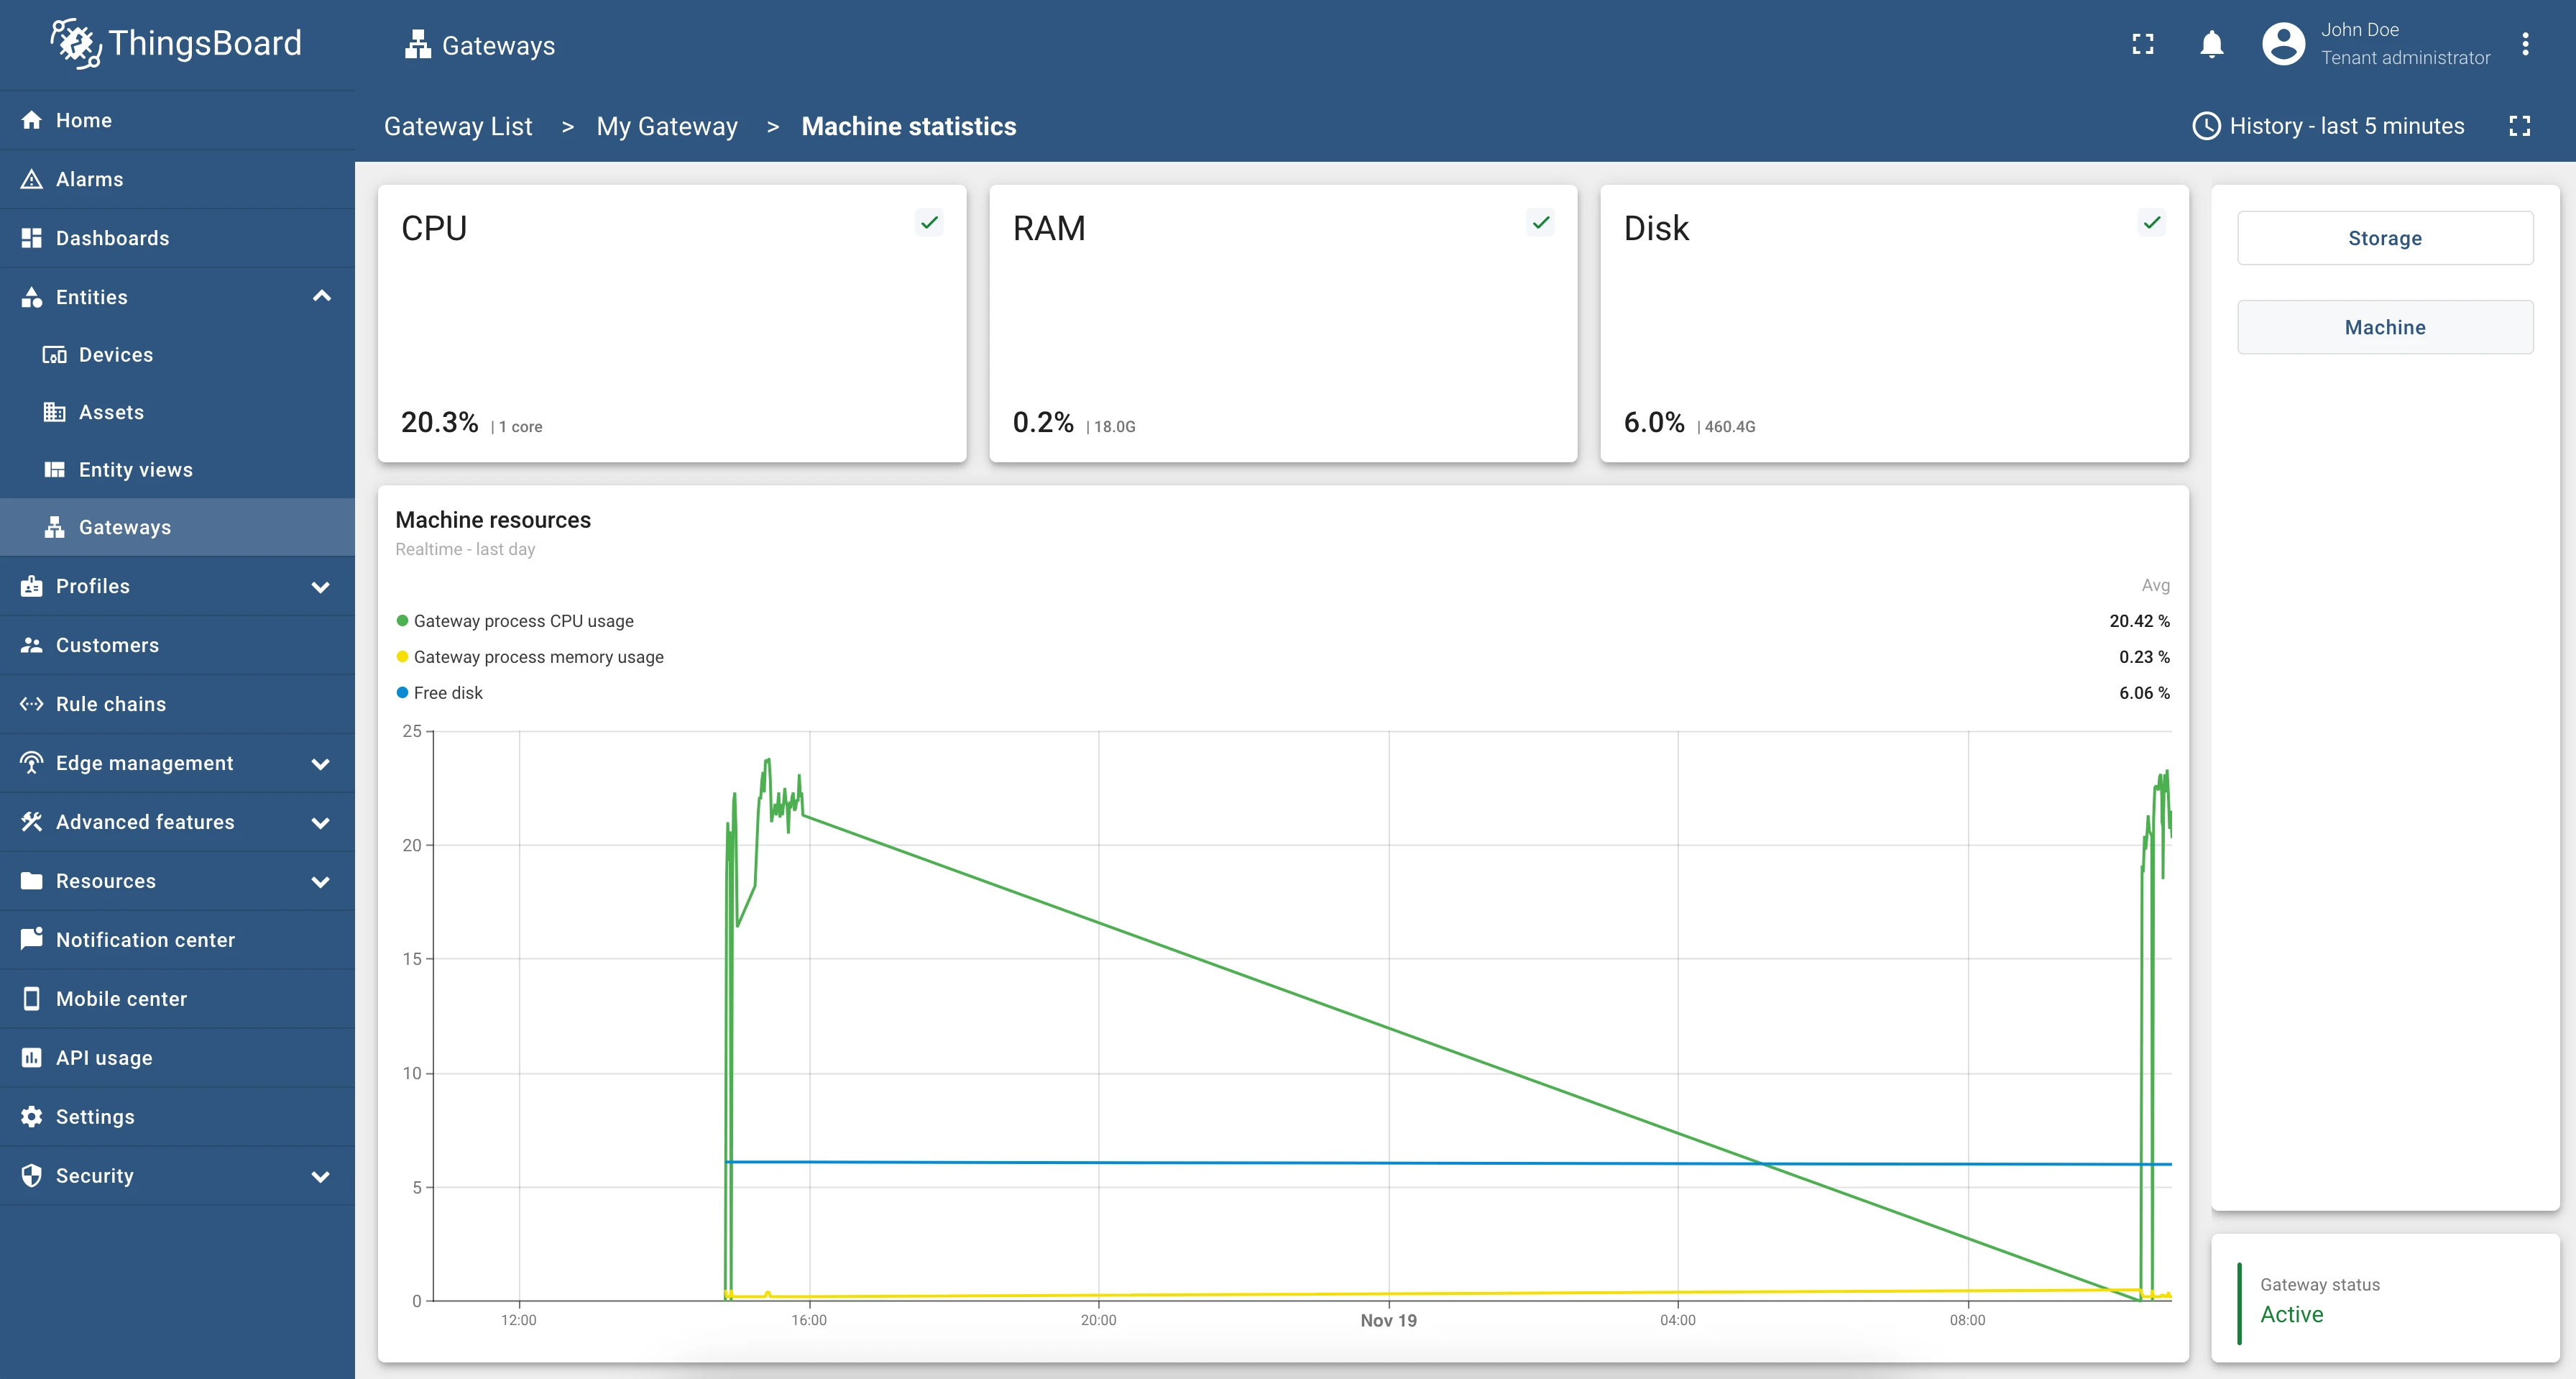
Machine Statistics
Section titled “Machine Statistics”Machine statistics show the resource utilization of the gateway host:
| Widget | Description |
|---|---|
| CPU usage | Current CPU utilization percentage |
| RAM usage | Current RAM utilization percentage |
| Disk usage | Current disk utilization percentage |
Custom Statistics
Section titled “Custom Statistics”Custom statistics display user-defined metrics configured in the Statistics tab of General Configuration (or via the Create new button in the “Time series name” field). The page renders:
- Chart widgets for numerical custom statistics
- Table widgets for string custom statistics

Remote Shell
Section titled “Remote Shell”Click Remote Shell in the Navigation Panel to open the remote shell page.
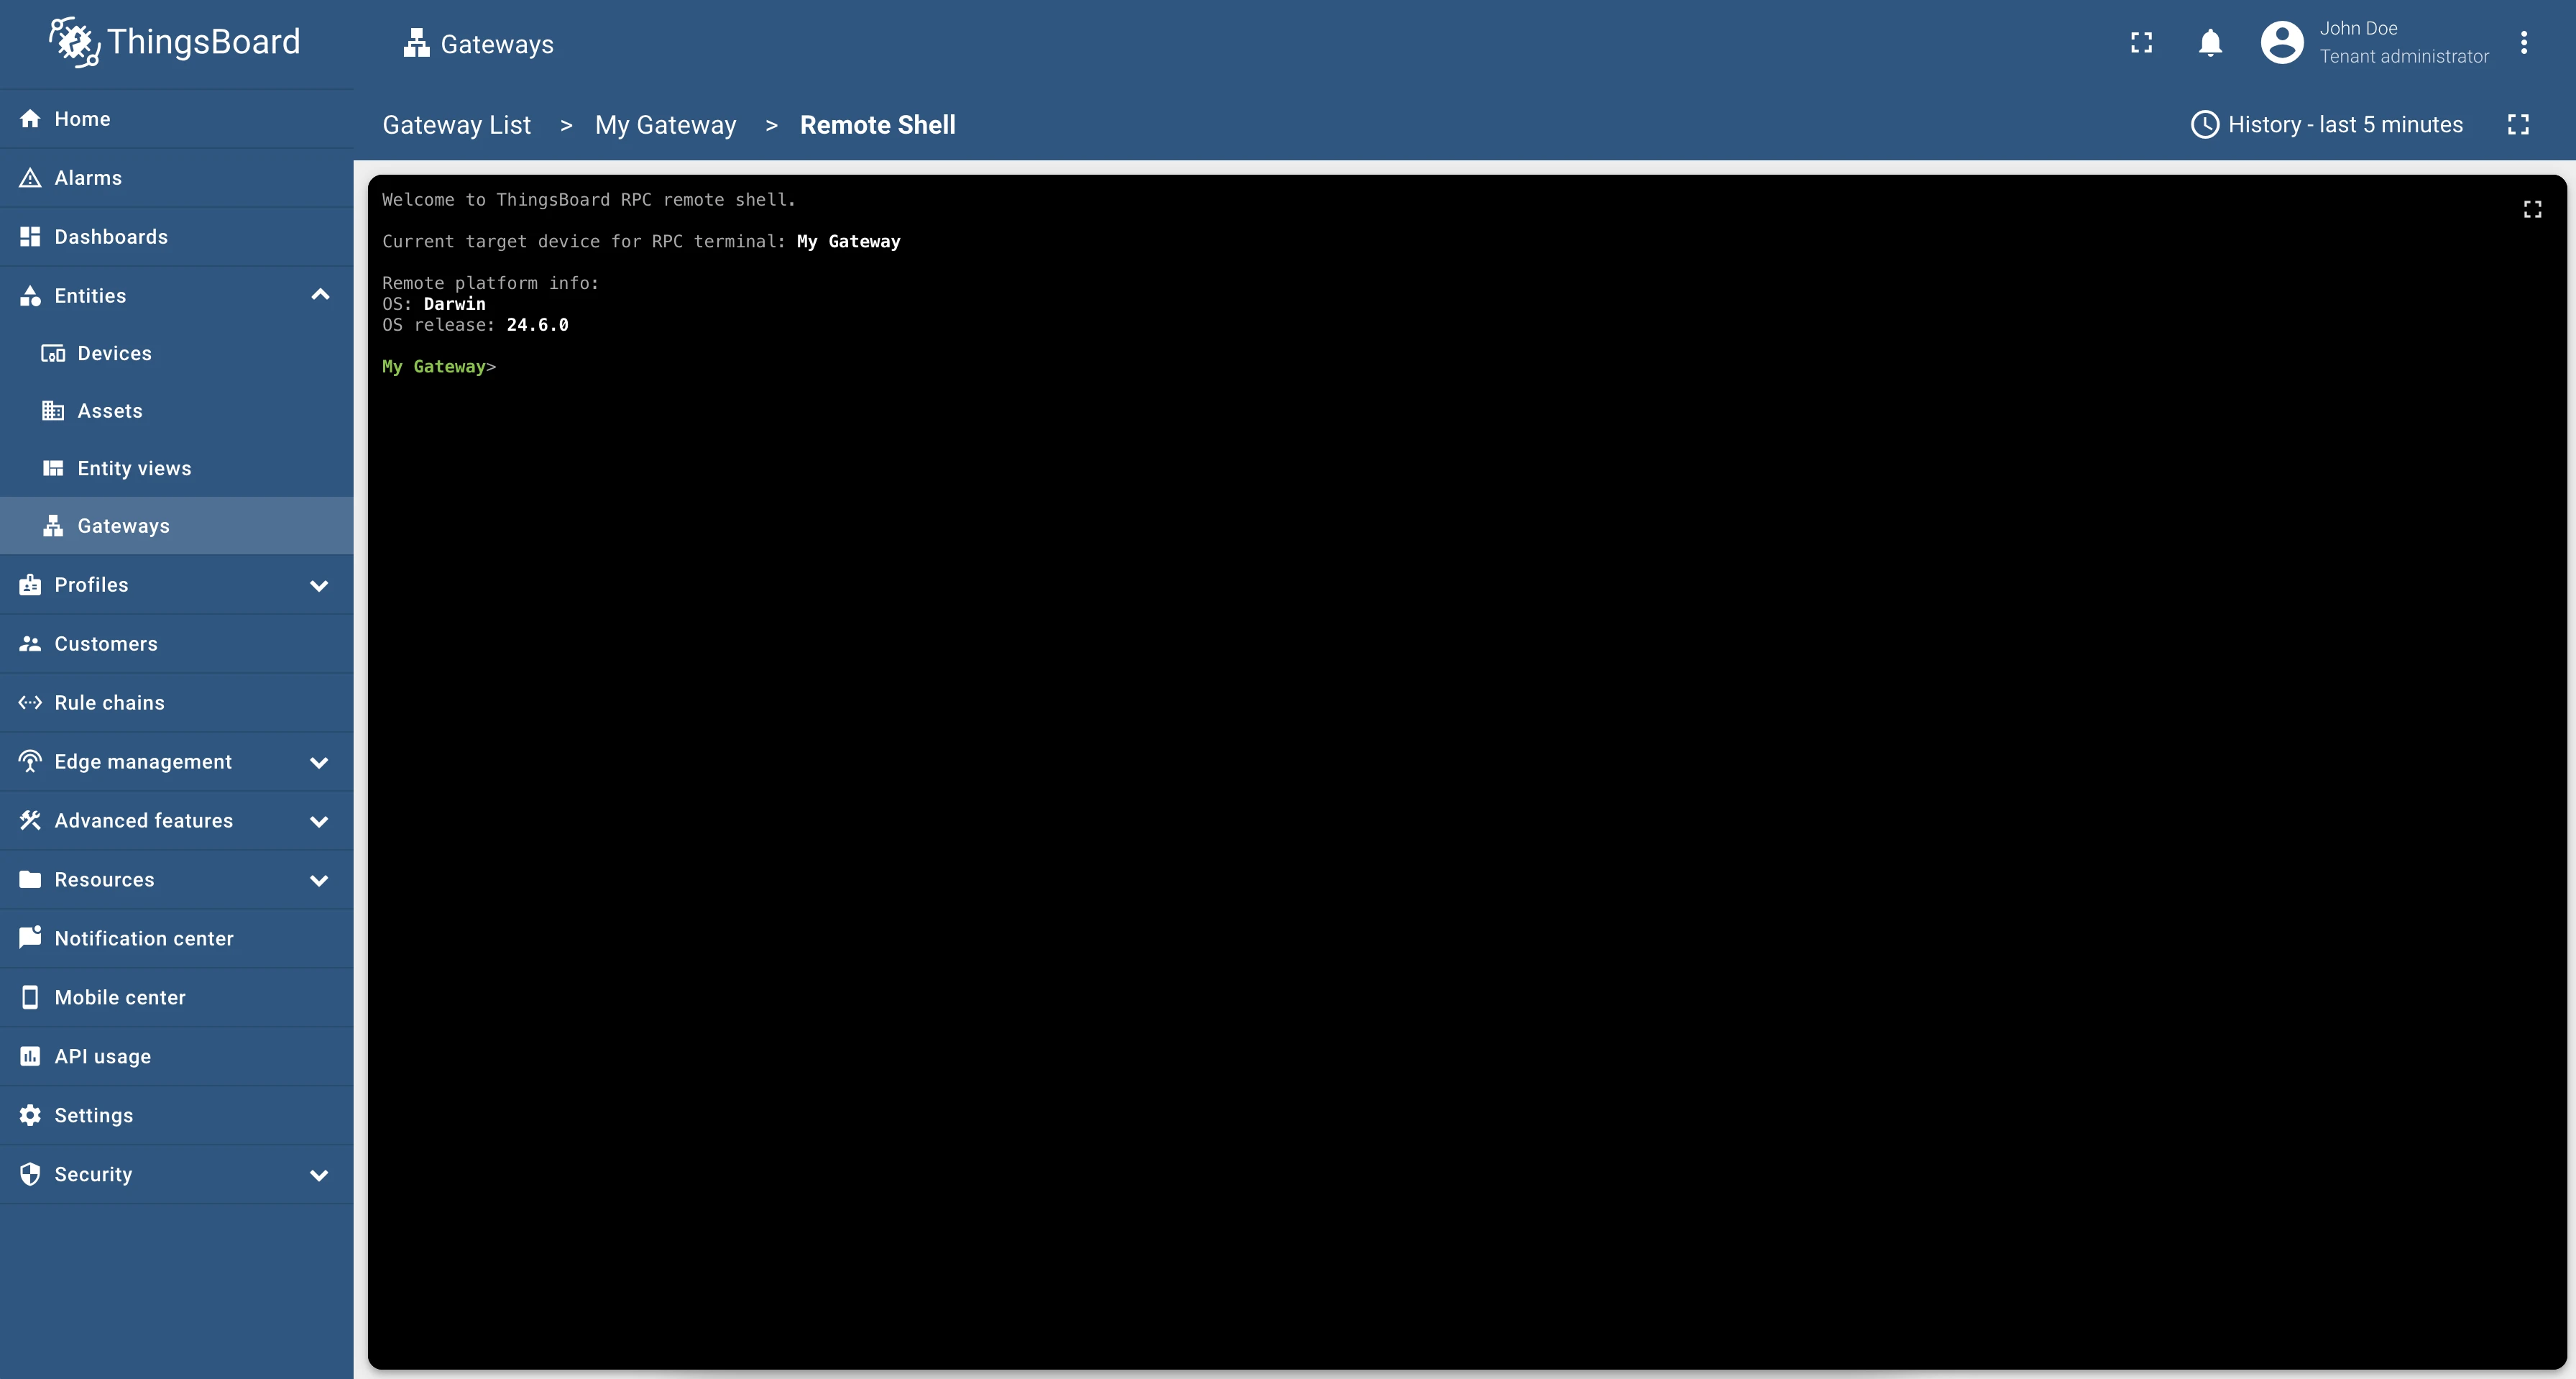
The dashboard provides a terminal widget that lets you execute OS commands on the gateway machine directly from the ThingsBoard interface.
Click RPC in the Navigation Panel to open the Gateway RPC sending page.
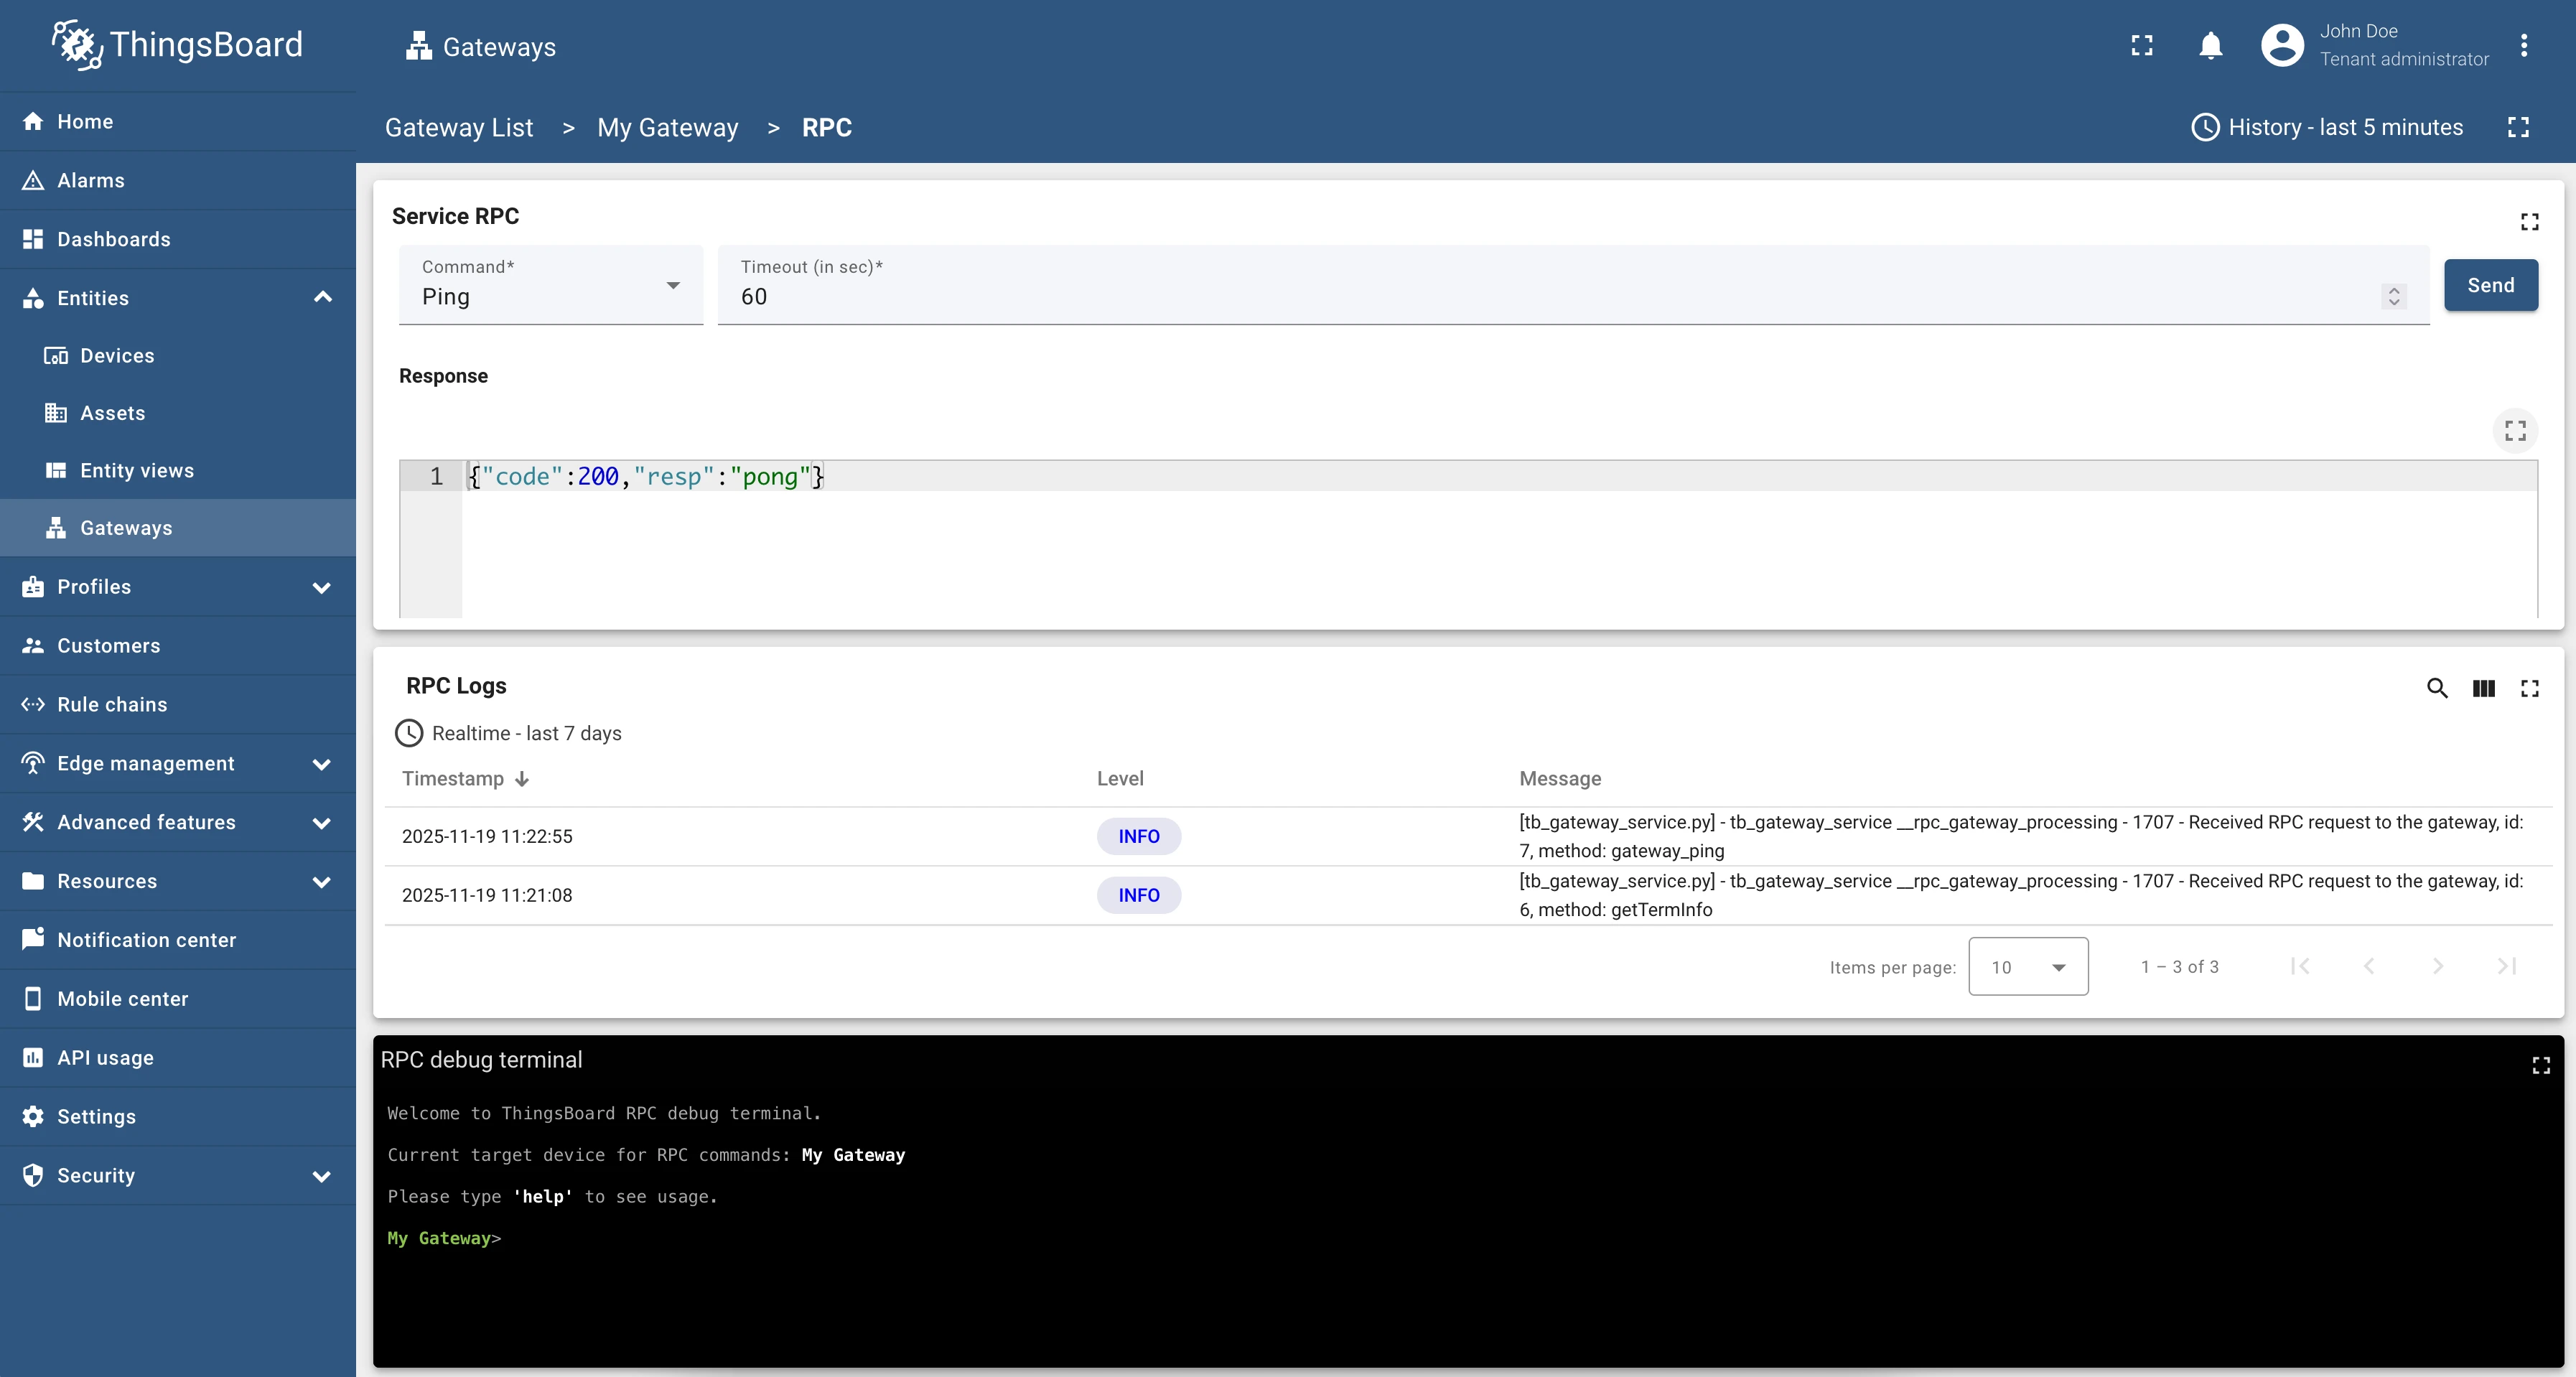
The page contains three widgets:
Service RPC — send a built-in gateway command and view its result:
| Field | Description |
|---|---|
| Command | One of the service RPC methods: Ping, Stats, Devices, Update, Version, Restart, Reboot |
| Timeout | Command execution time limit |
| Response | Output of the executed command |
RPC Logs — shows gateway logs generated while processing the sent RPC.
RPC debug terminal — a widget for interactive RPC debugging.
Was this helpful?