- Before We Begin
- Step 1. Create the report template
- Step 2. Adding report components
- Step 3: Scheduling the report for customers
- Step 4. Scheduled events result
- Importing a template from JSON
- Next steps
- Your feedback
| Available since TB Version 4.2 |
Only Professional Edition supports Reporting feature.
Use ThingsBoard Cloud or install your own platform instance.
In ThingsBoard, Reporting is a powerful and flexible tool for collecting, organizing, and automatically delivering data in the form of reports.
The reporting system is built around two key components:
- Report Template – defines the structure, content, and format of a report. A template can be in PDF or CSV format and include any supported components.
- Scheduler Event – automatically triggers report generation at a specified time and delivers it to selected recipients through available channels, such as email, Slack, or other integrations.
In short: the template defines what will be in the report, while the scheduler determines when and to whom it will be delivered.
In this guide, we'll walk through the basic steps of using Reporting in ThingsBoard, and create a report template with automated delivery configured for two different customers.
Before We Begin
To start building, you’ll just need a ThingsBoard Cloud account. You can create an account in seconds—no credit card required, and it’s free forever.
Important:
- For this example, three devices and two customers who own these devices have been created. Alarms have also been triggered on some of the devices. You'll need to do the same — otherwise, the device and alarm tables in your report will appear empty.
- If you're just getting started with the ThingsBoard platform, it is recommended that you first review the Getting Started Guide with ThingsBoard Professional Edition.
Step 1. Create the report template
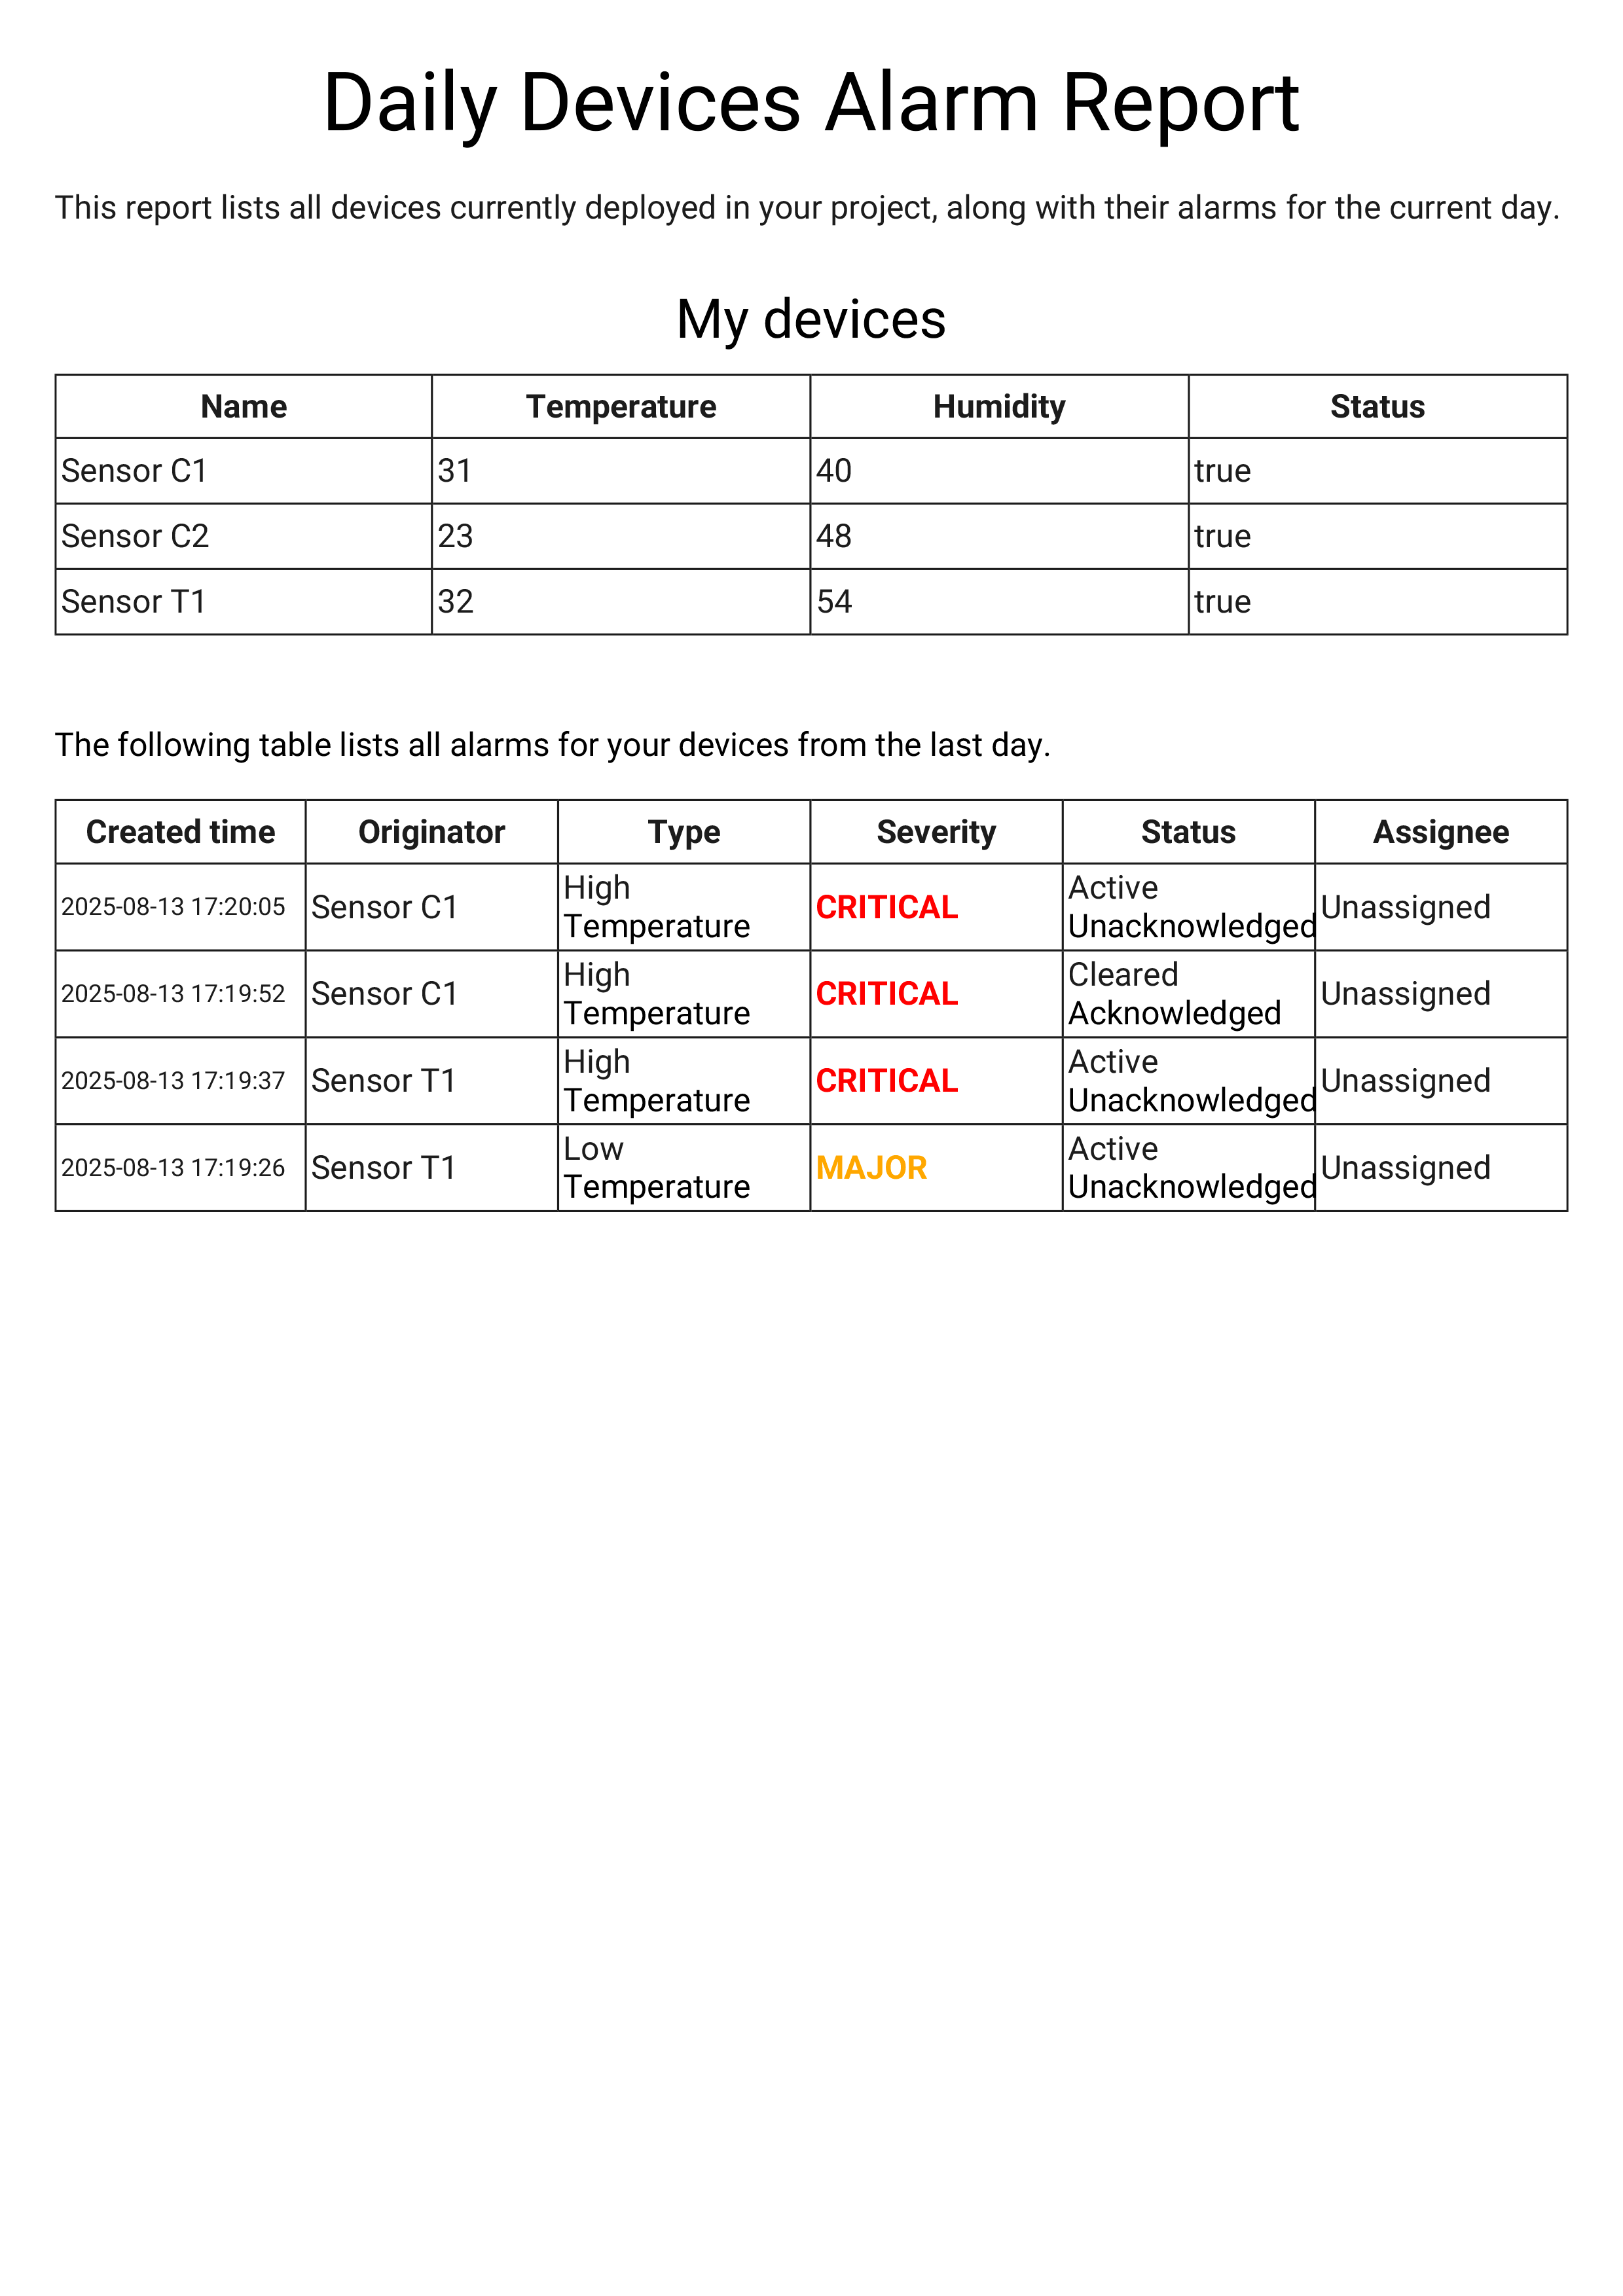
As an example, let's create a report template that includes:
- A table with all customer devices, displaying their latest telemetry values and current status.
- A table of alarms triggered on these devices over the past 24 hours.
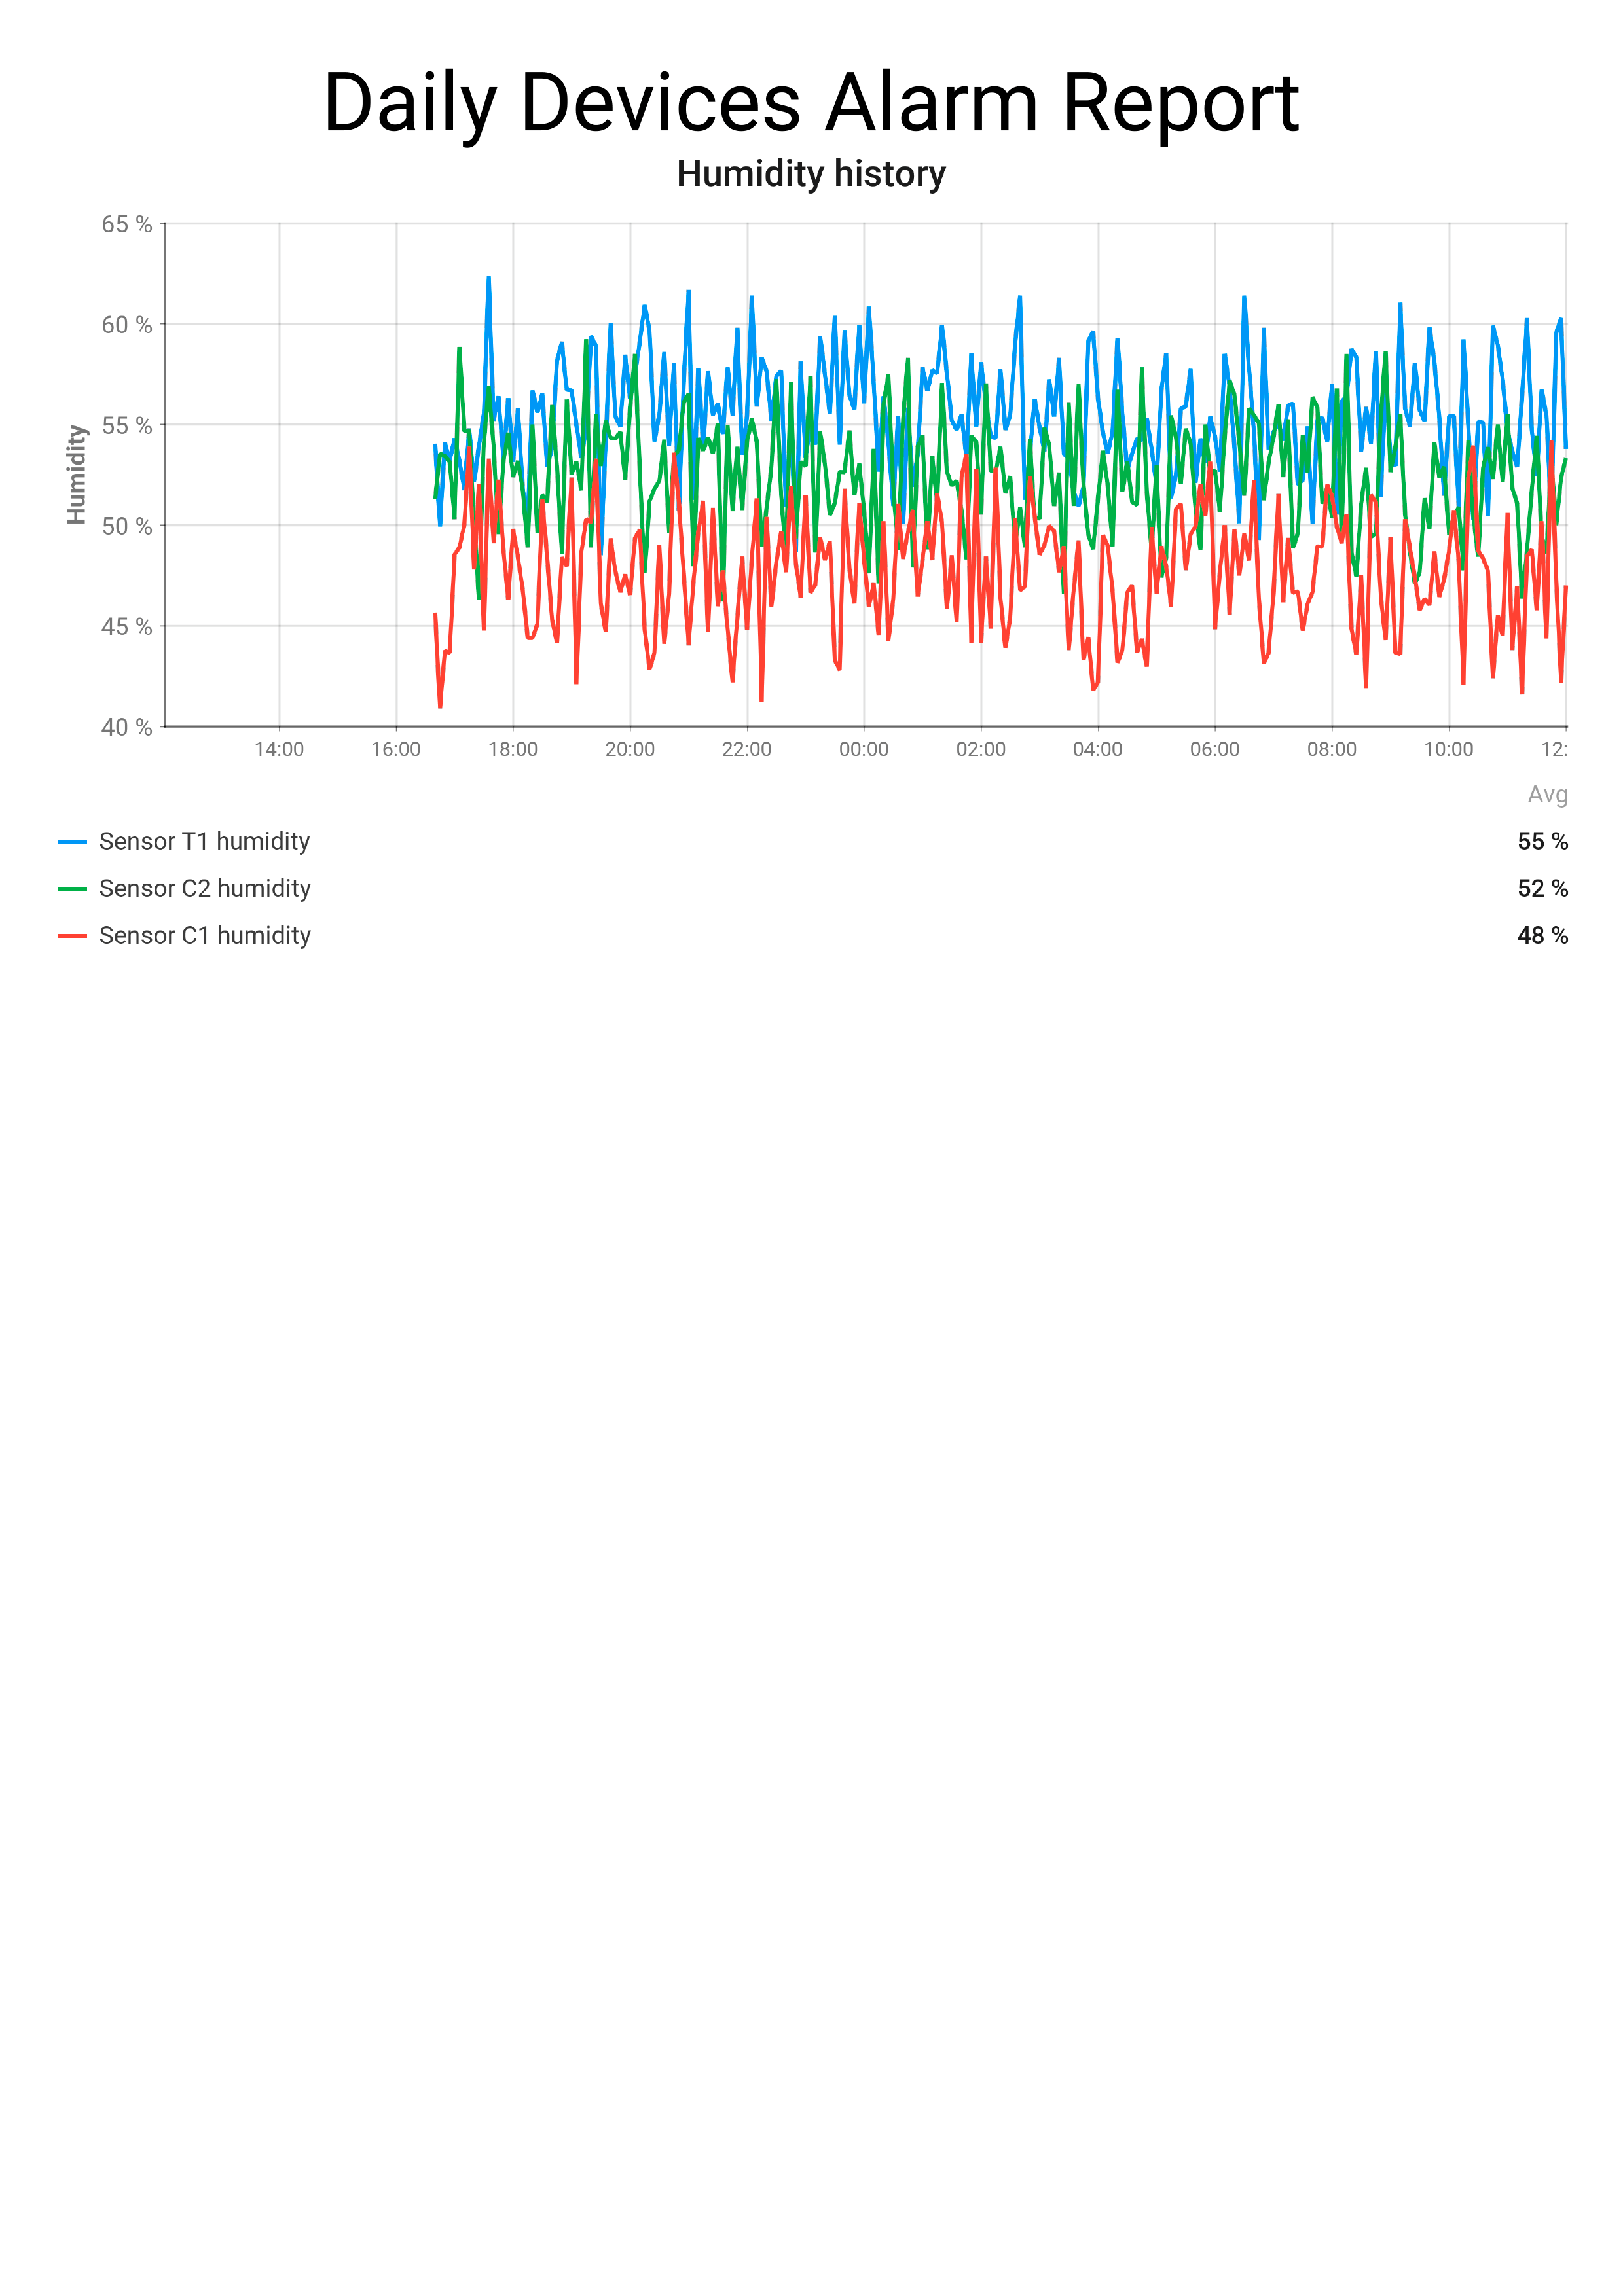
- Two separate line charts for device temperature and humidity values over the past 24 hours.
This setup provides both an up-to-date overview of device conditions and a quick reference for any issues detected today — all in one consolidated report.
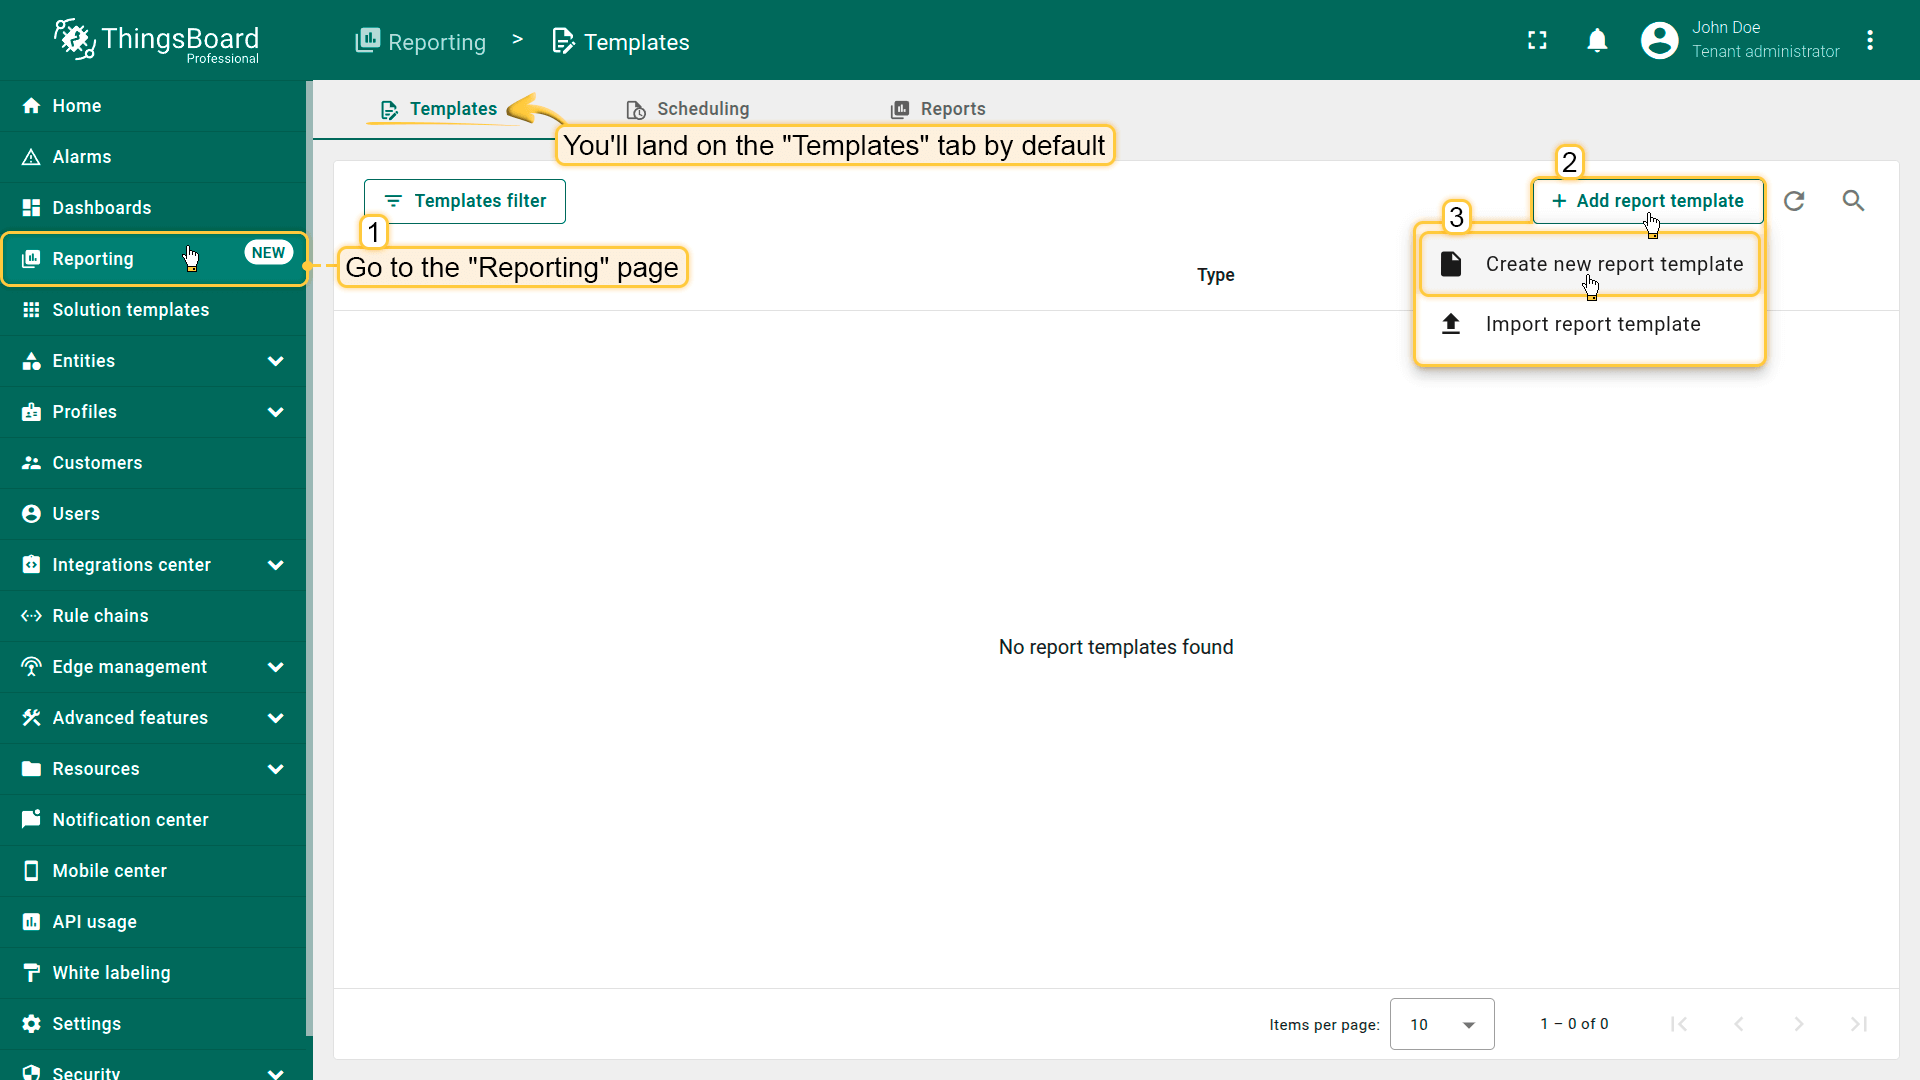
- Open the “Reporting” page from the left-hand sidebar. You'll automatically be taken to the “Templates” tab.
- Click the “+ Add report template” button in the top-right corner.
- Choose “Create new report template”.
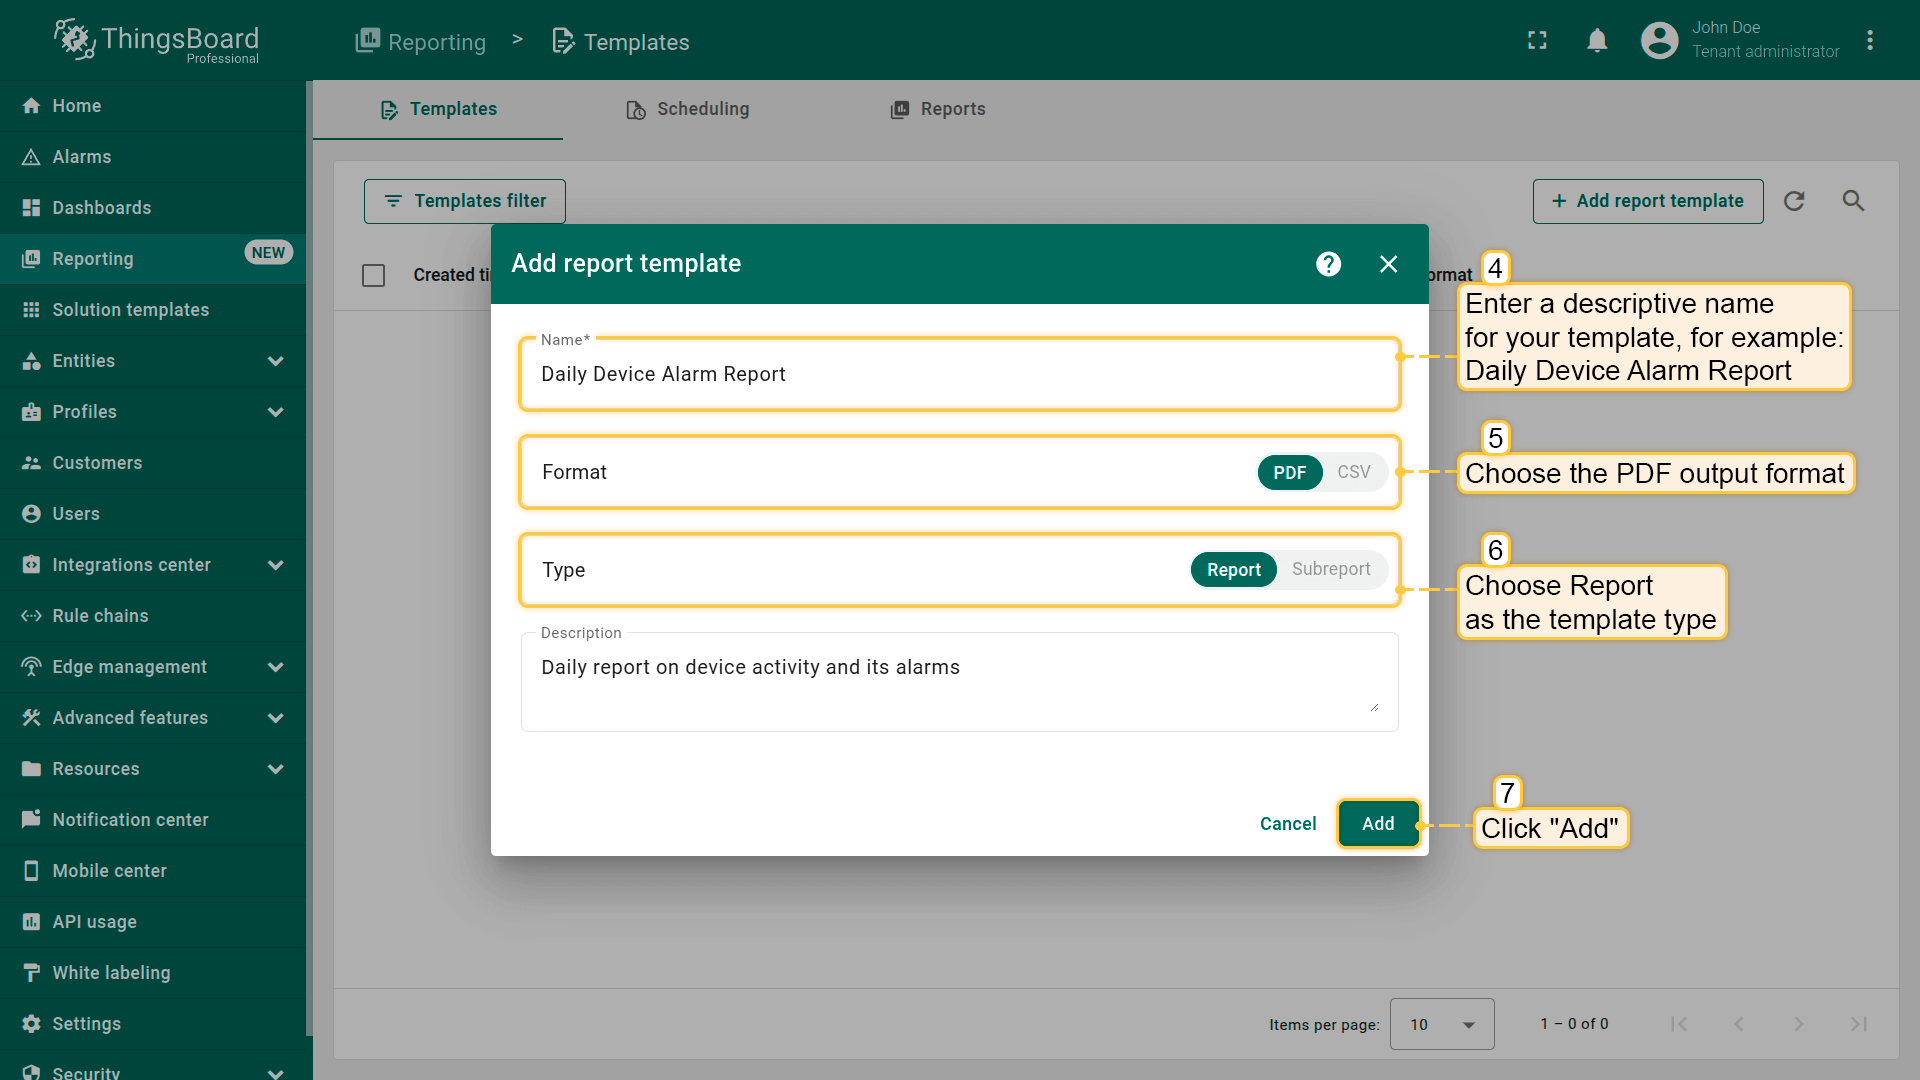
- In the popup, fill out the following:
- Name it “Daily Device Alarm Report”.
- Choose PDF report format.
- Choose Report as the template type.
- [Optional] Description: “Daily report on device activity and alarms”.
- Click “Add” to create the report template and open the Report Builder interface.
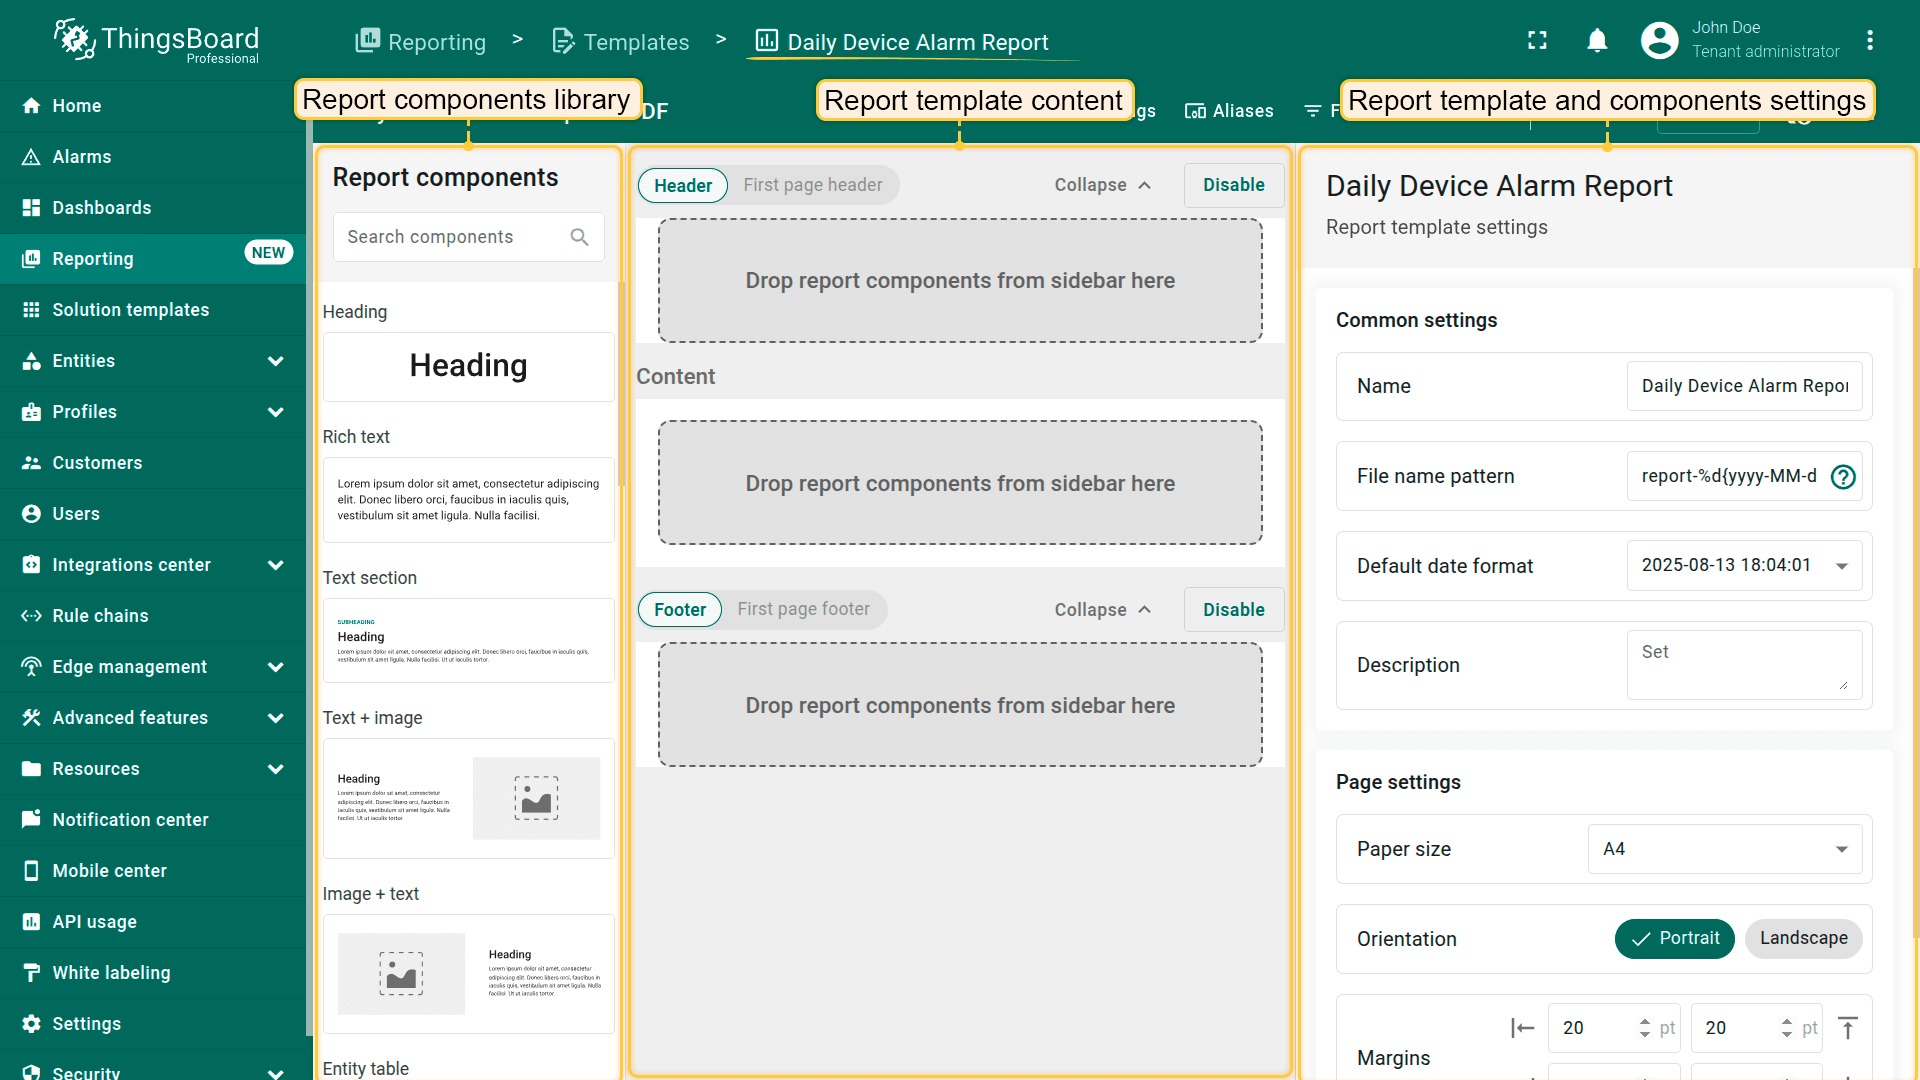
In the Report Builder you can design the structure, layout, and content of your report.
- Name it "Daily Device Alarm Report".
- Choose PDF report format.
- Choose Report as the template type.
- Click "Add" to create the report template and open the Report Builder interface.
Step 2. Adding report components
The Report Builder allows you to add and configure components that define the structure and visual layout of your report.
Components are added by dragging them from the components library into the content area.
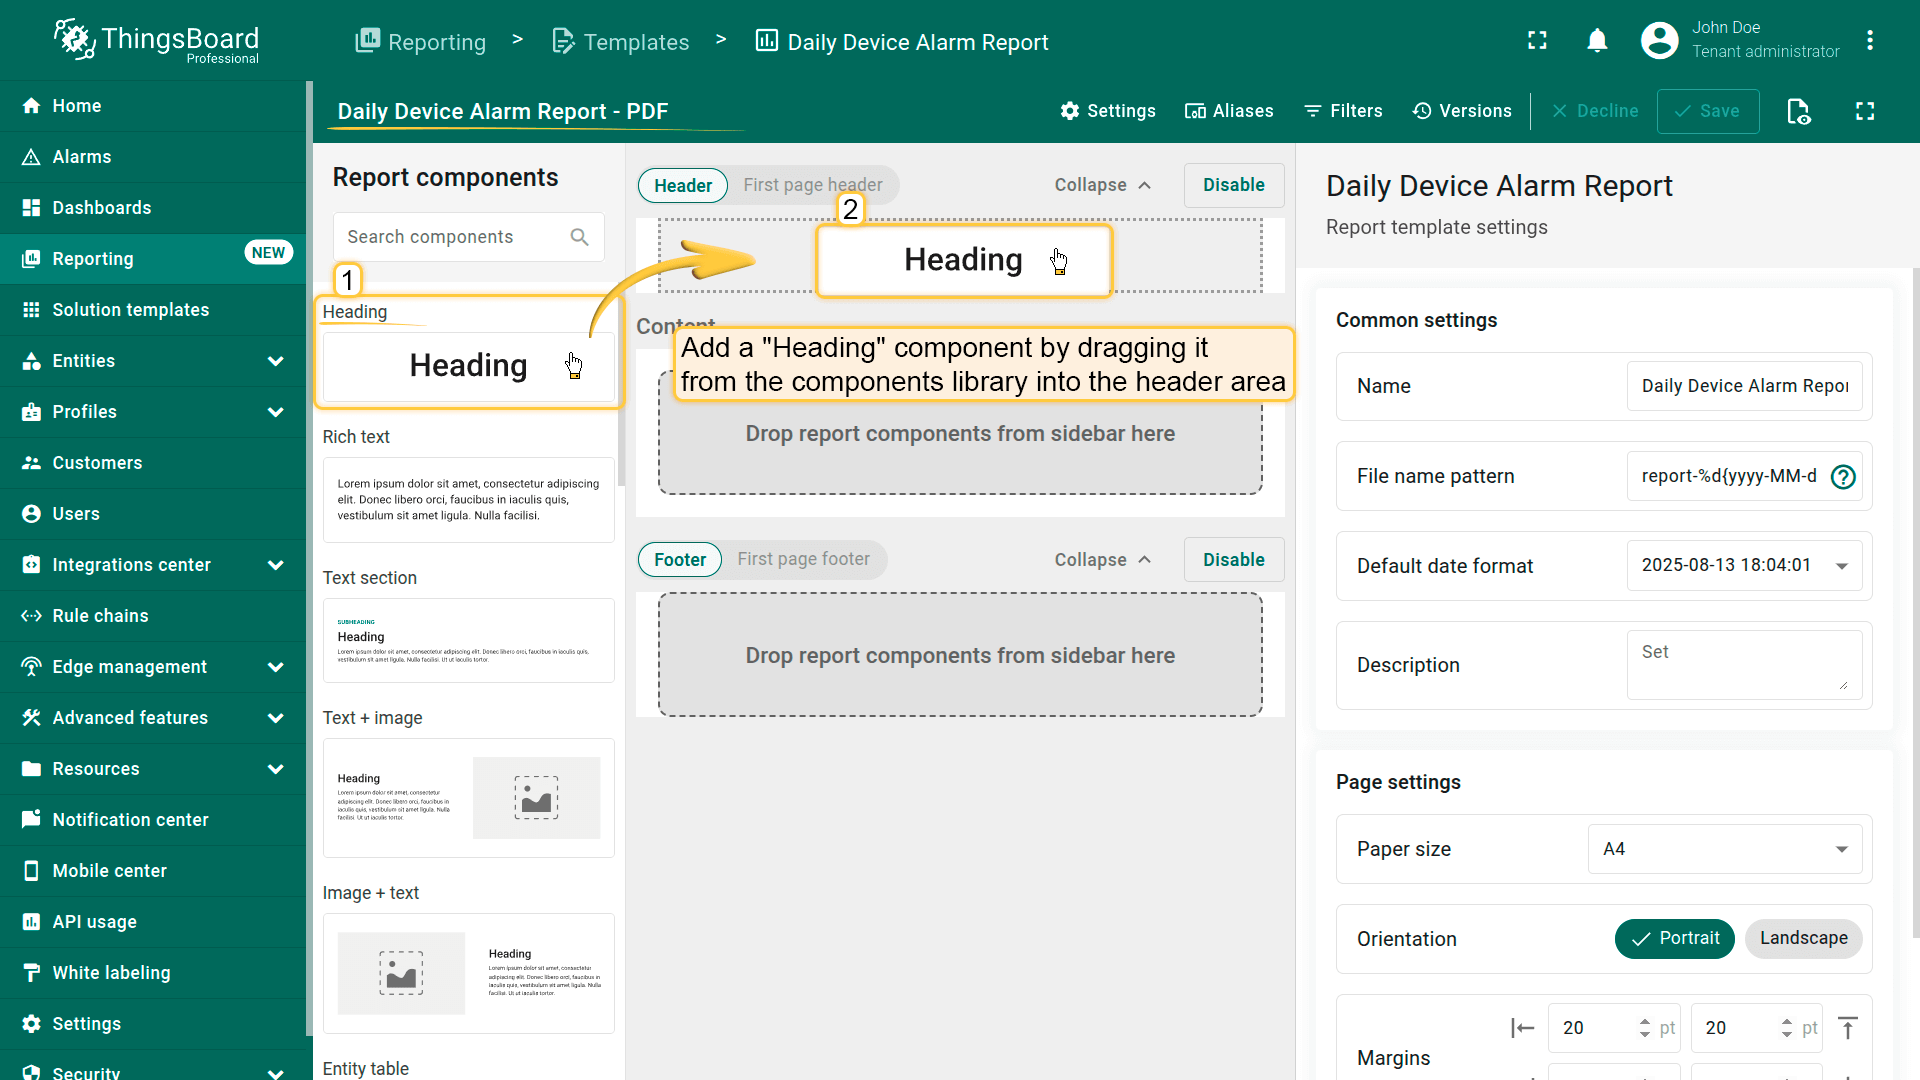
Step 2.1 “Heading” component
First, let's add the Heading component.
- Locate it in the report components library and drag it into the header area of your report.
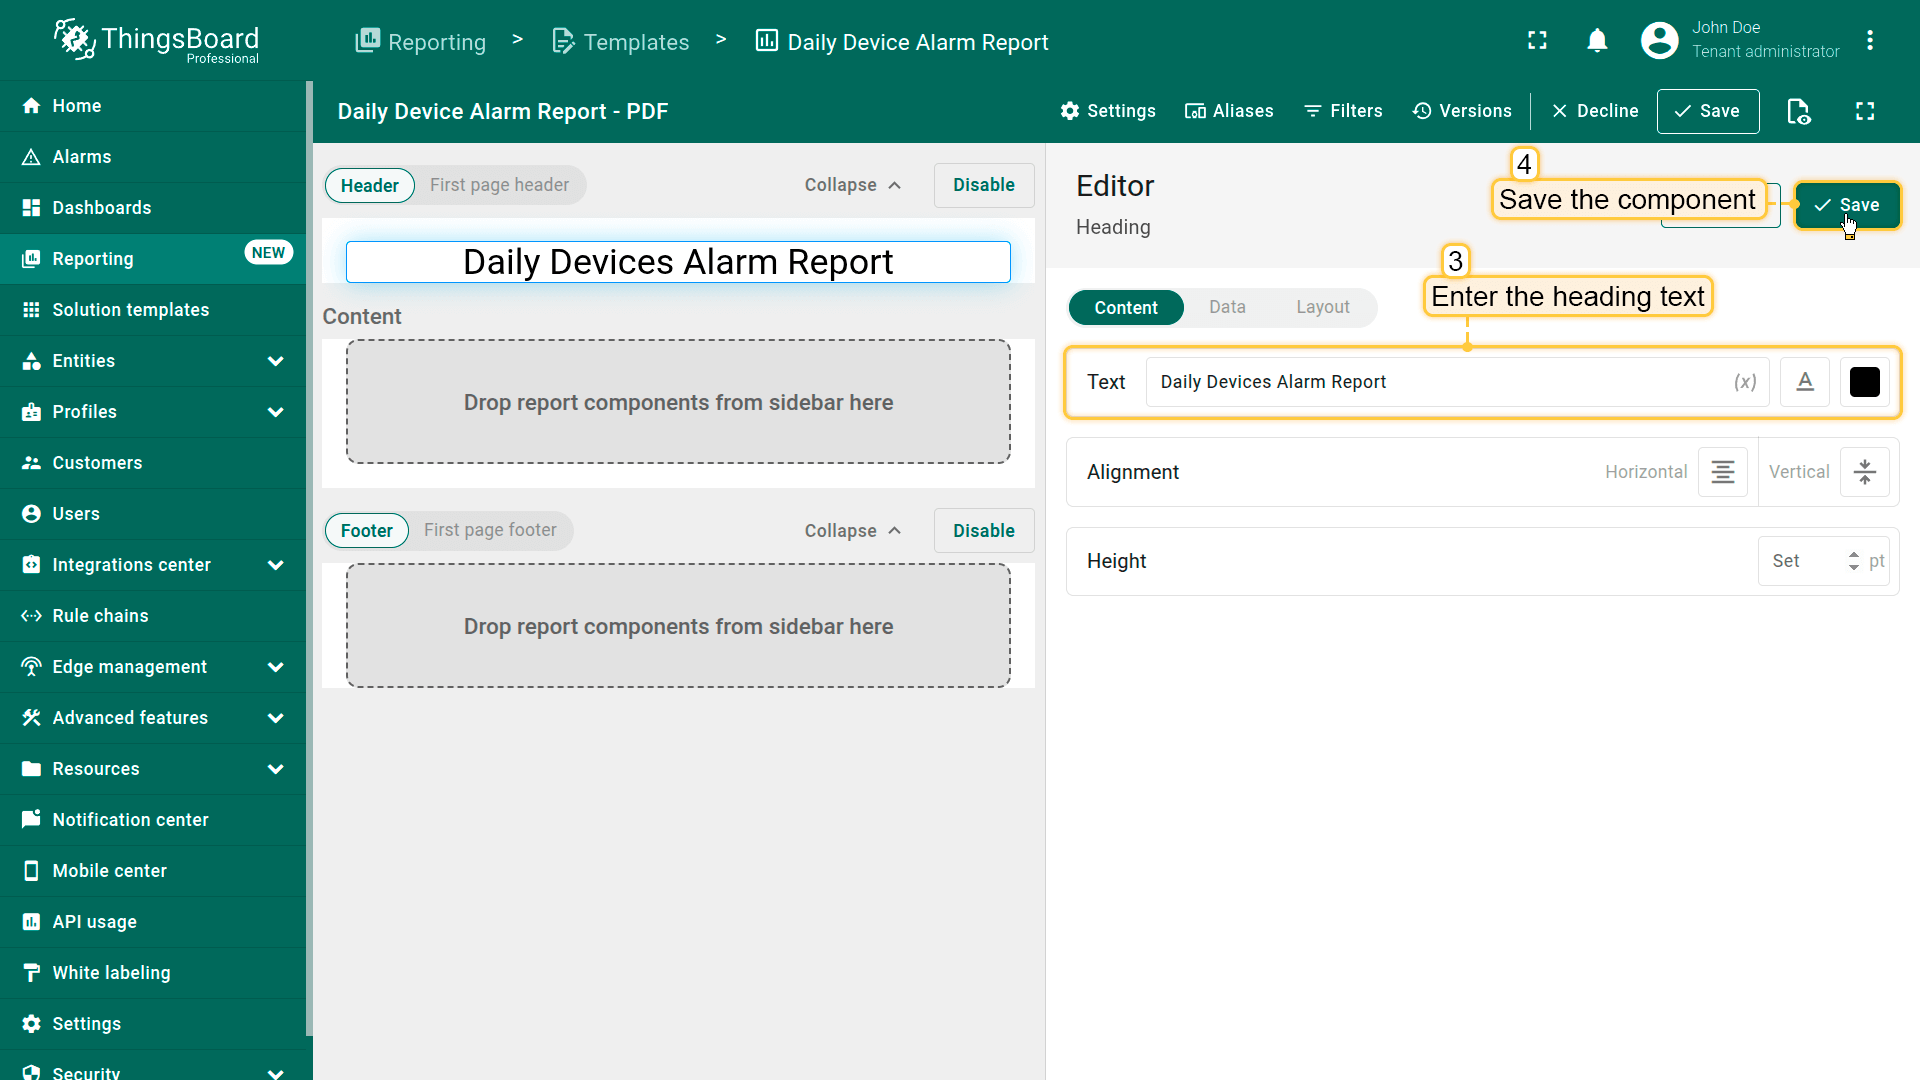
- In the editor, under the Text field, type the title you want for the heading. In this example, we'll name it the same as the report template:
1
Daily Devices Alarm Report
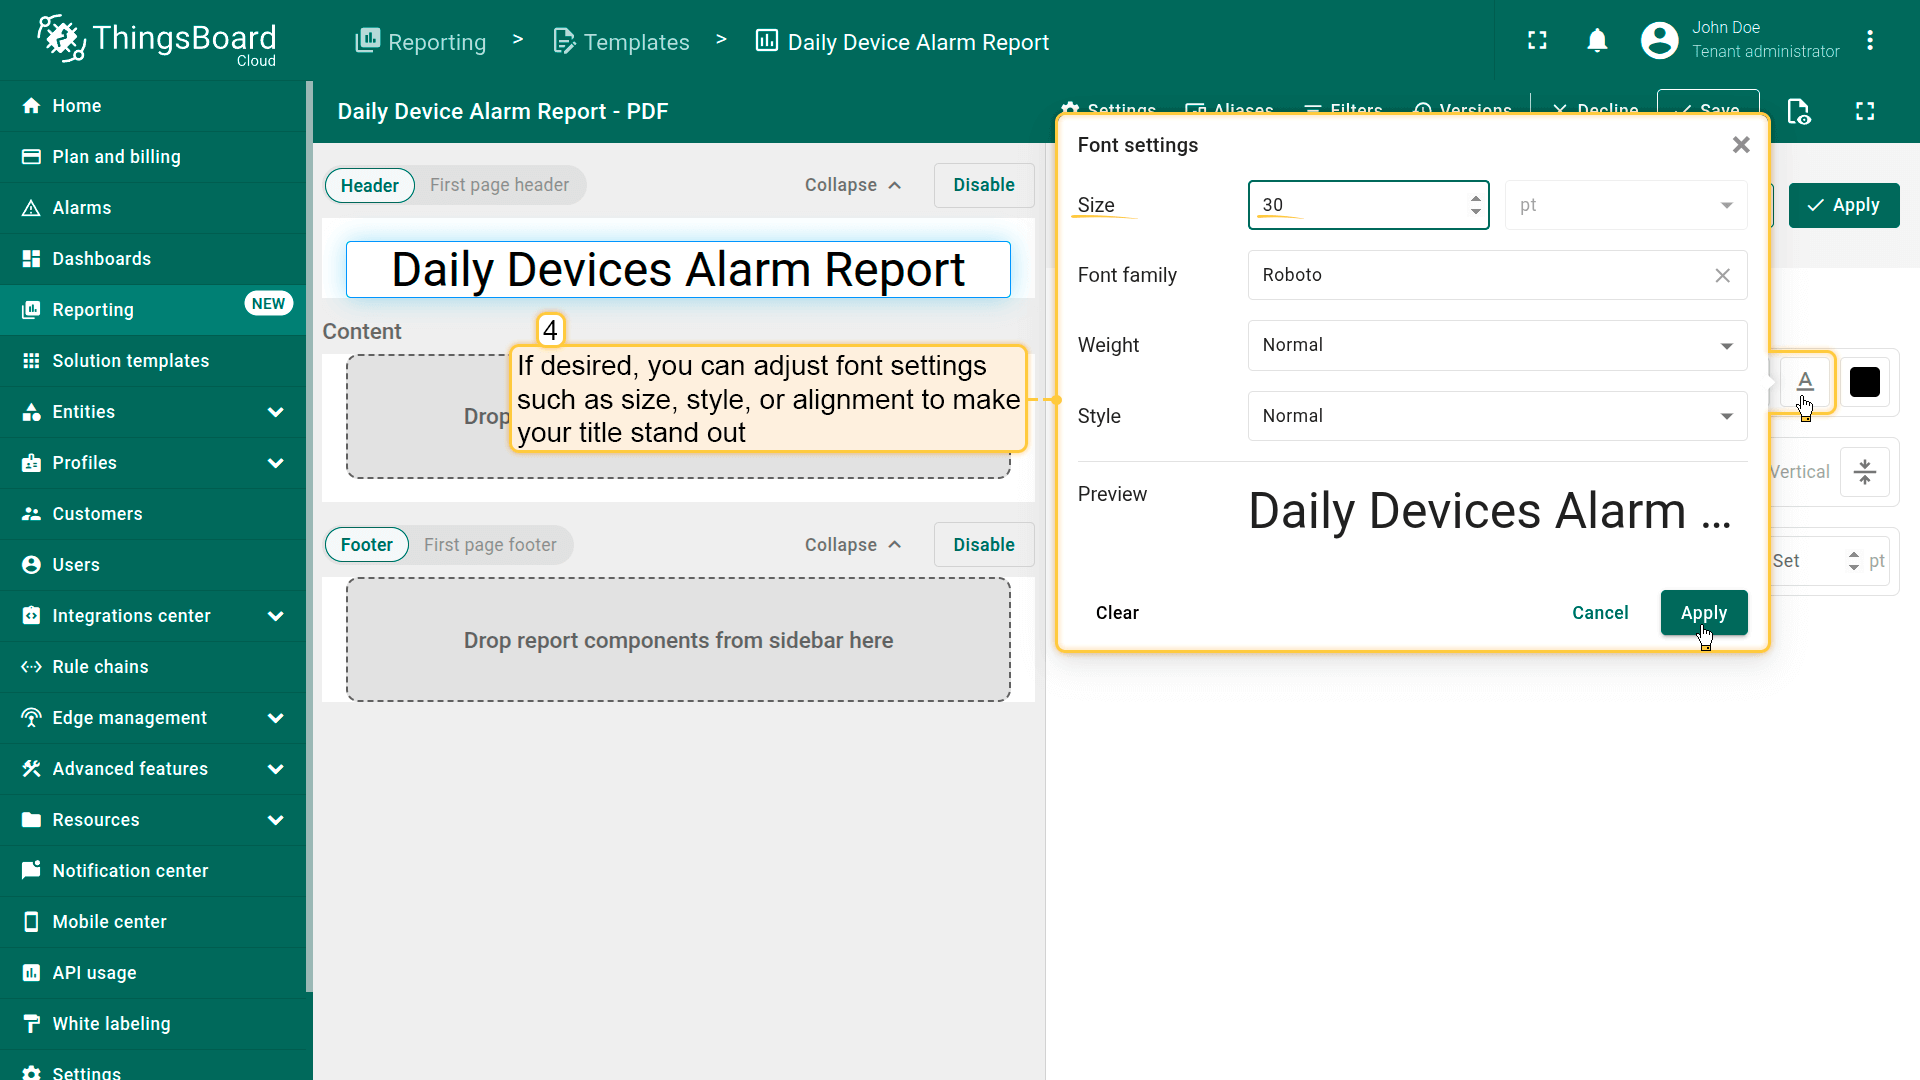
- If desired, you can adjust font settings such as size, style, or alignment to make your title stand out.
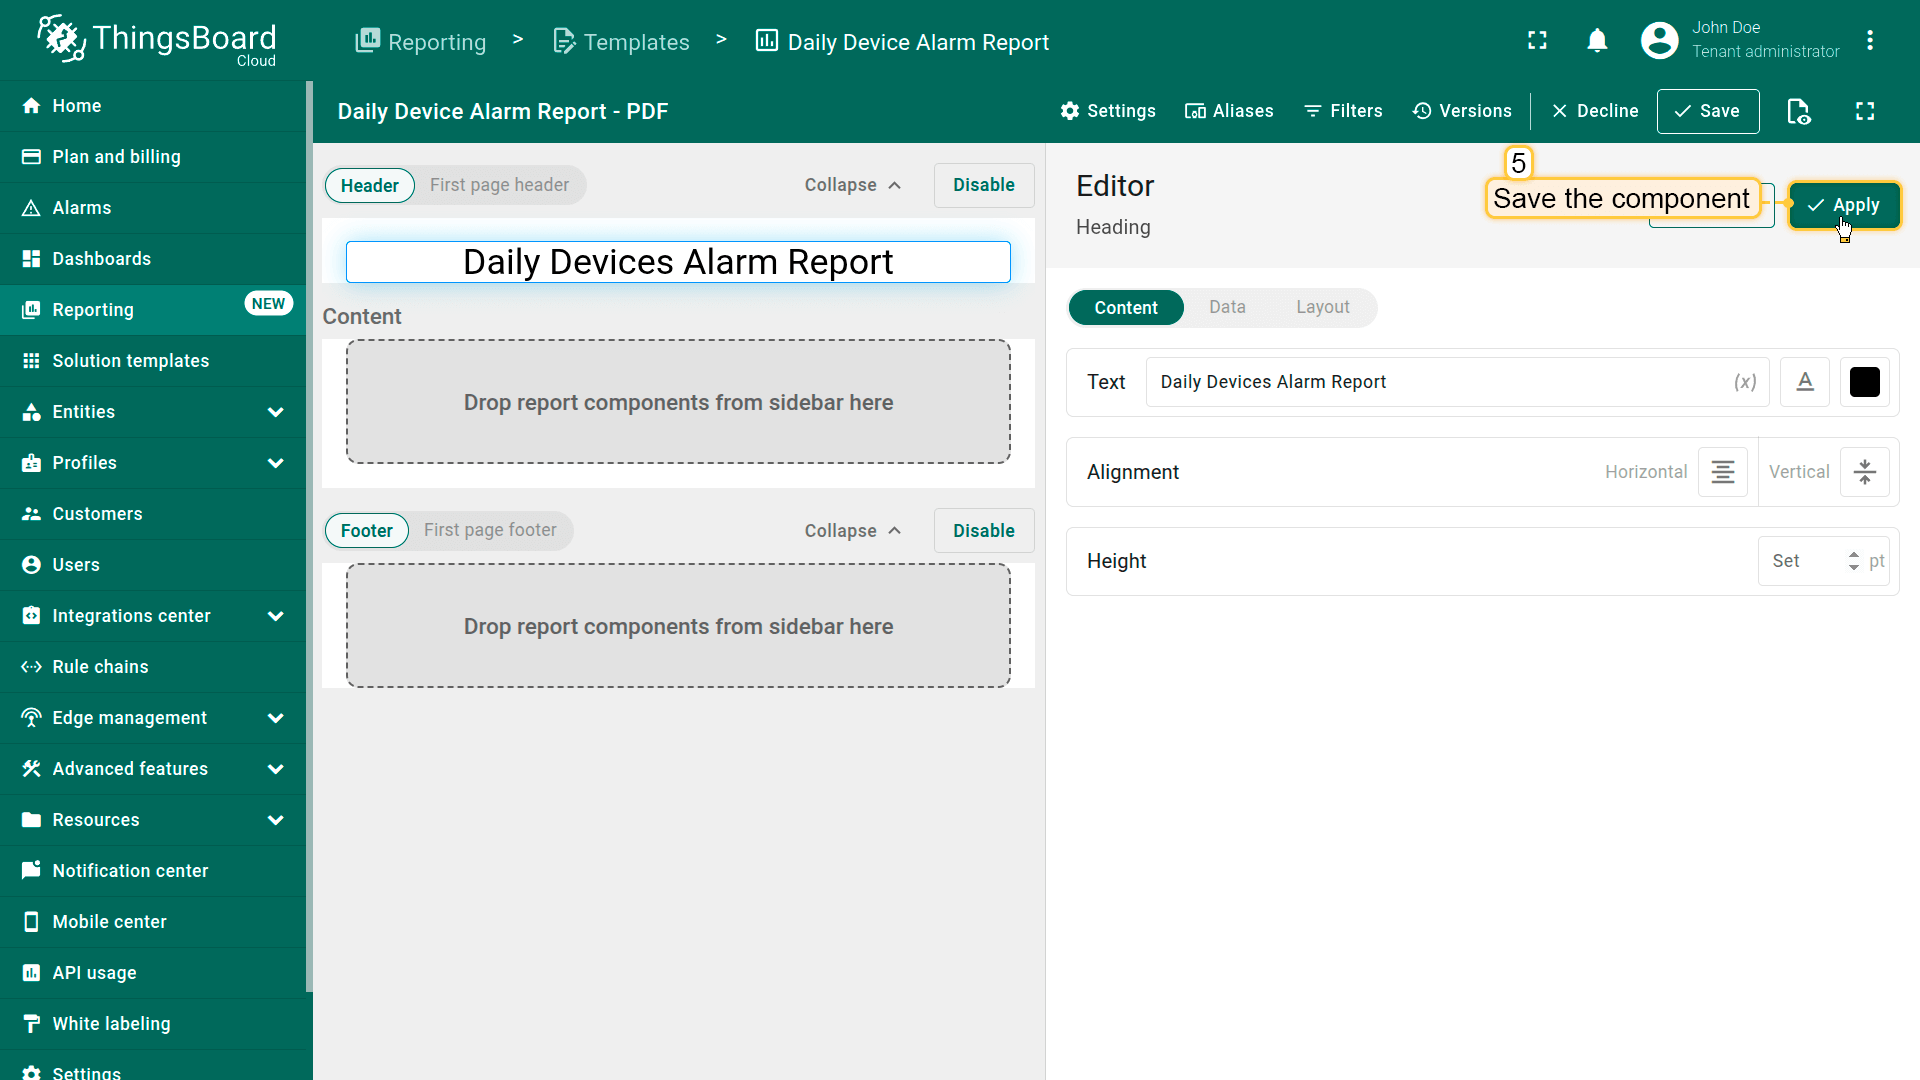
- Once done, click Apply to save the component.
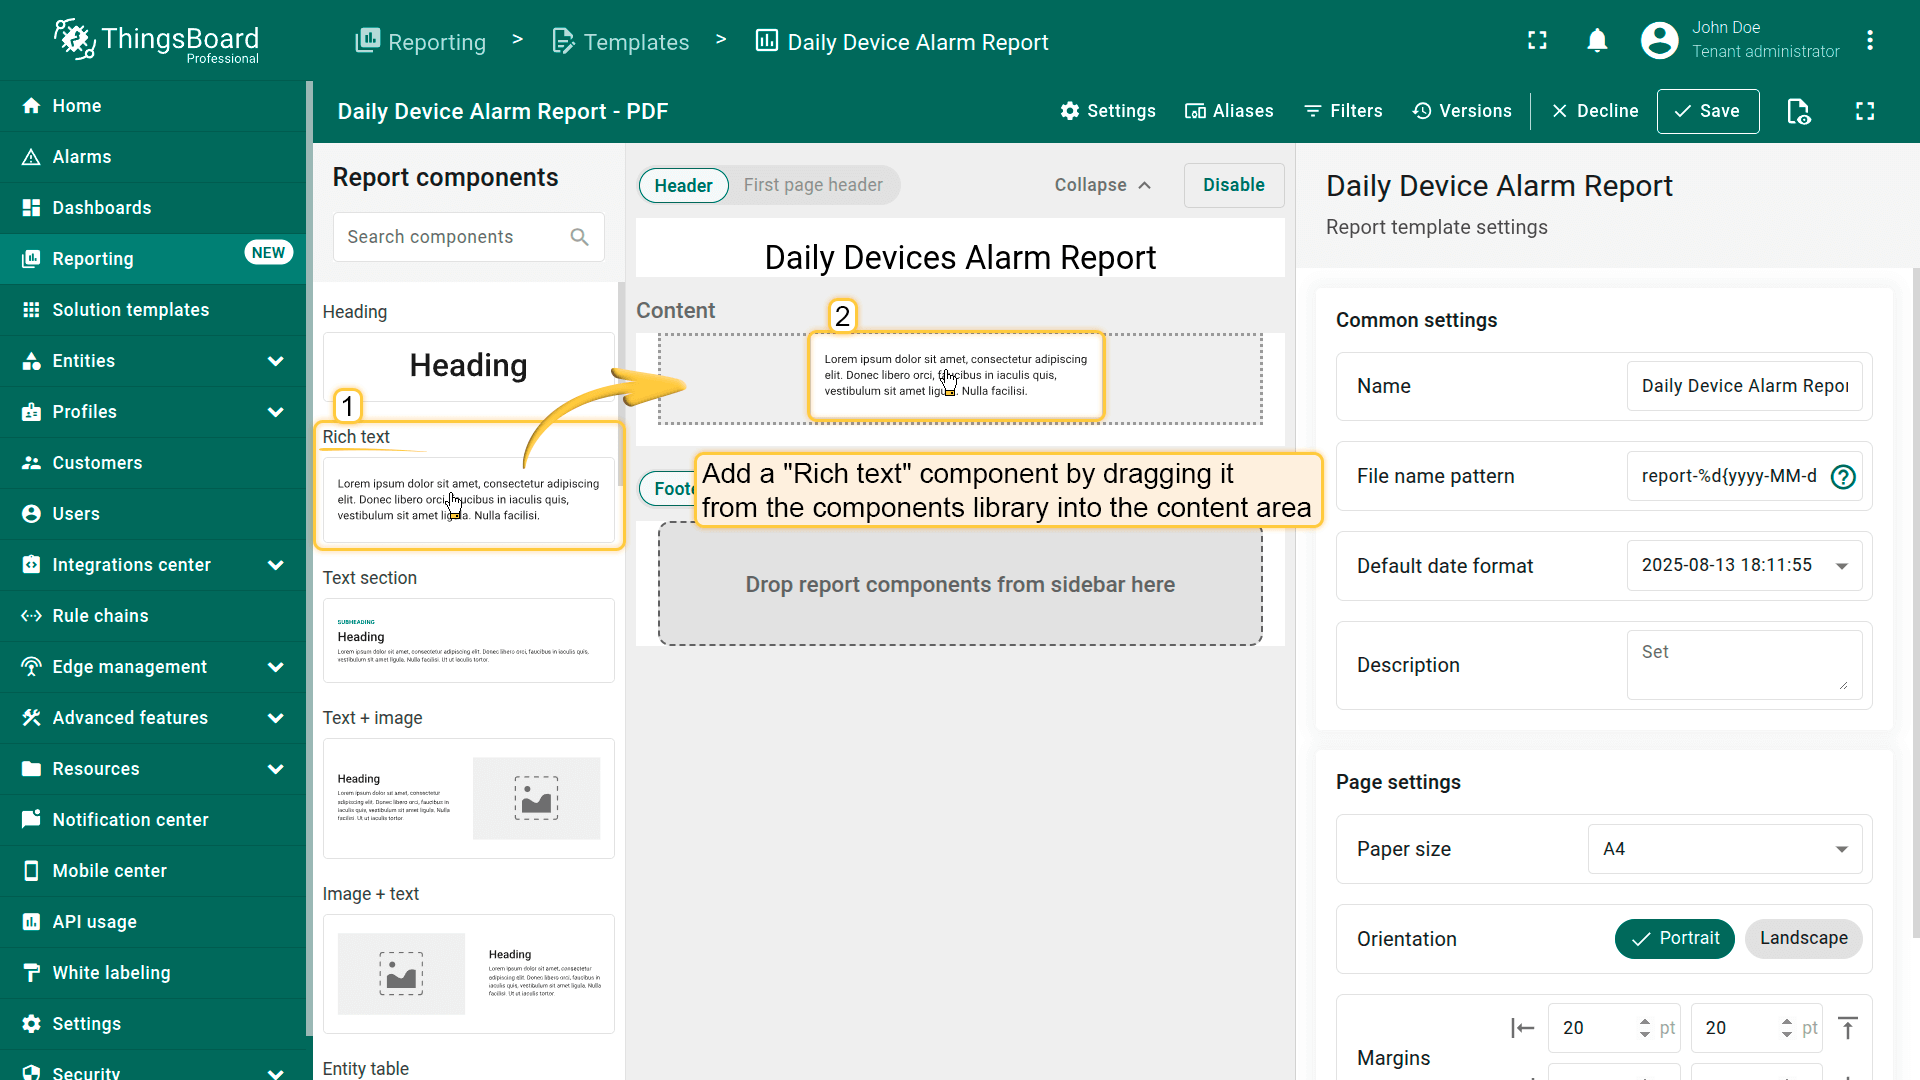
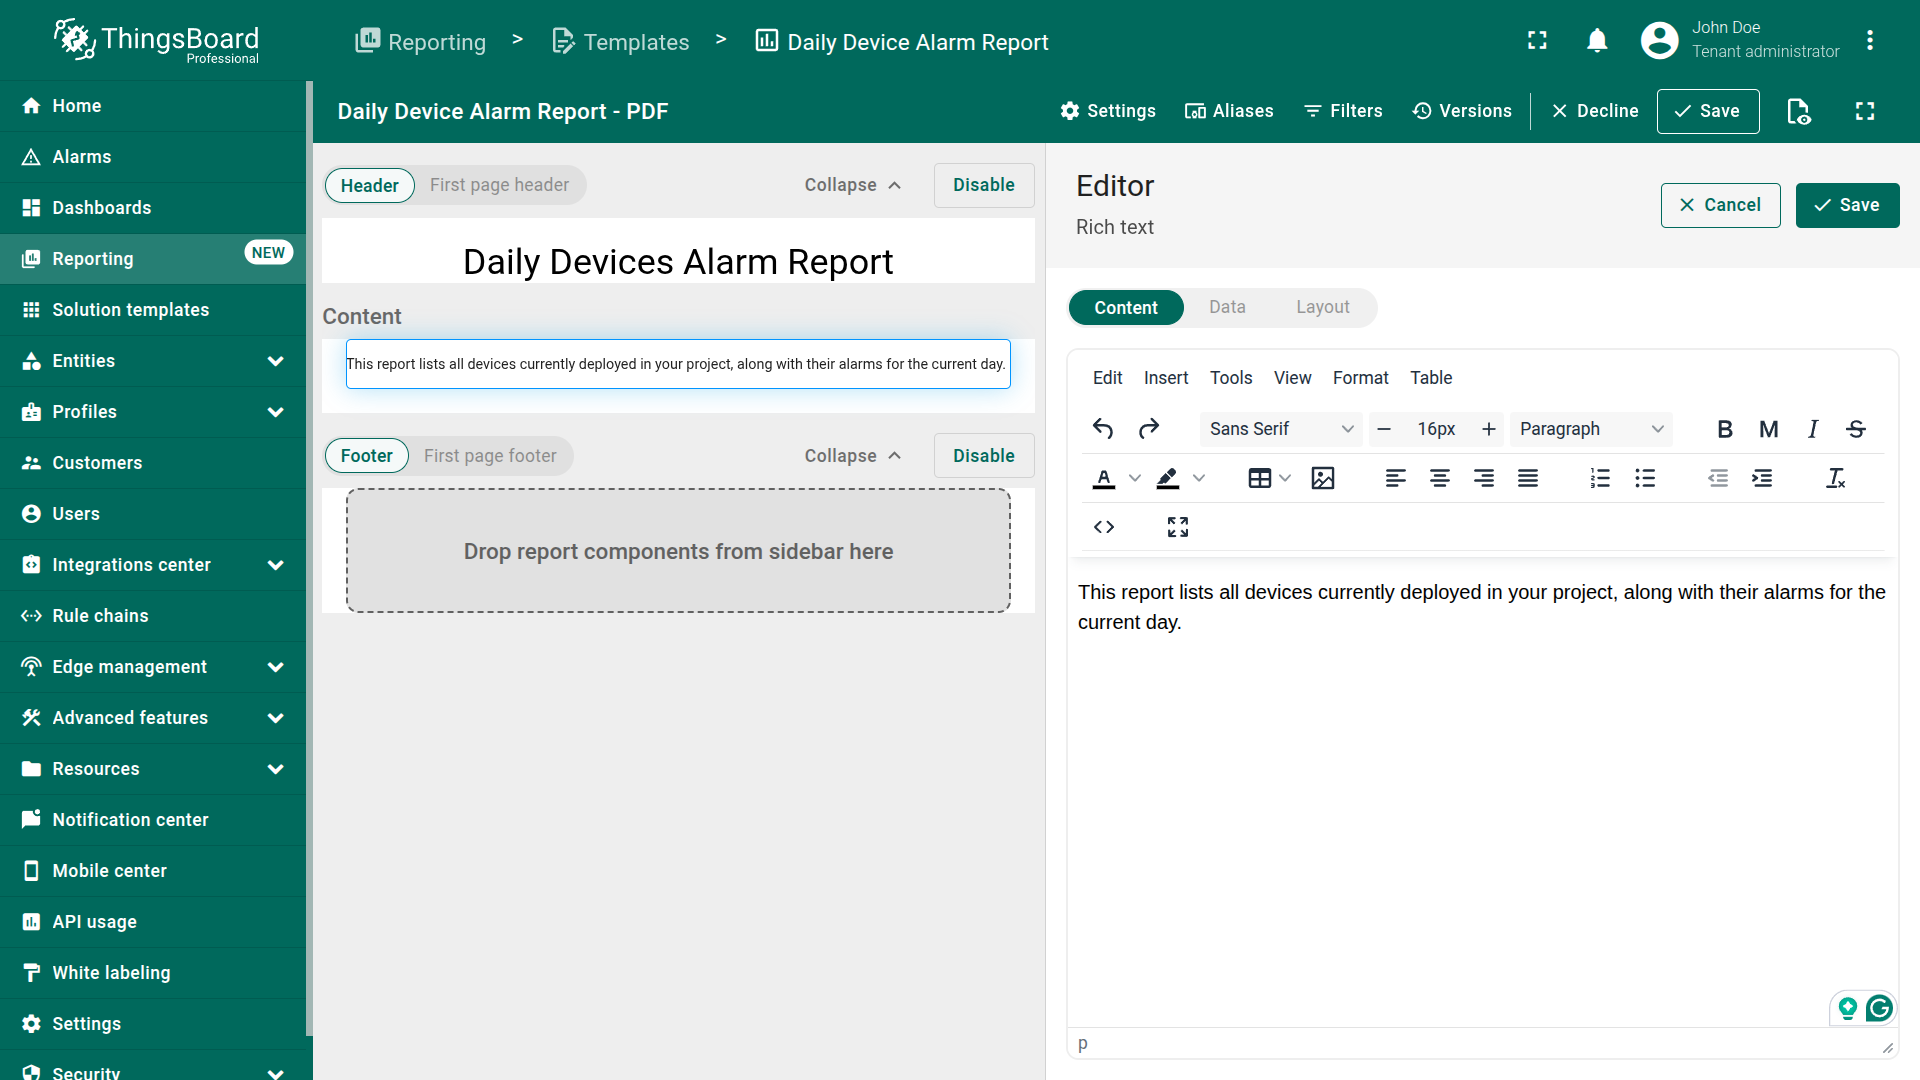
Step 2.2 “Rich text” component
Next, let's add the Rich text component, which will contain a brief explanation of the report's purpose.
- Locate the Rich text component in the components library and drag it into the content area.
- Enter the following text (or your preferred description) component's text field.
For example:1
This report lists all devices currently deployed in your project, along with their alarms for the current day.
- Once you've added the text, click Apply.
- Click Apply to save the component.
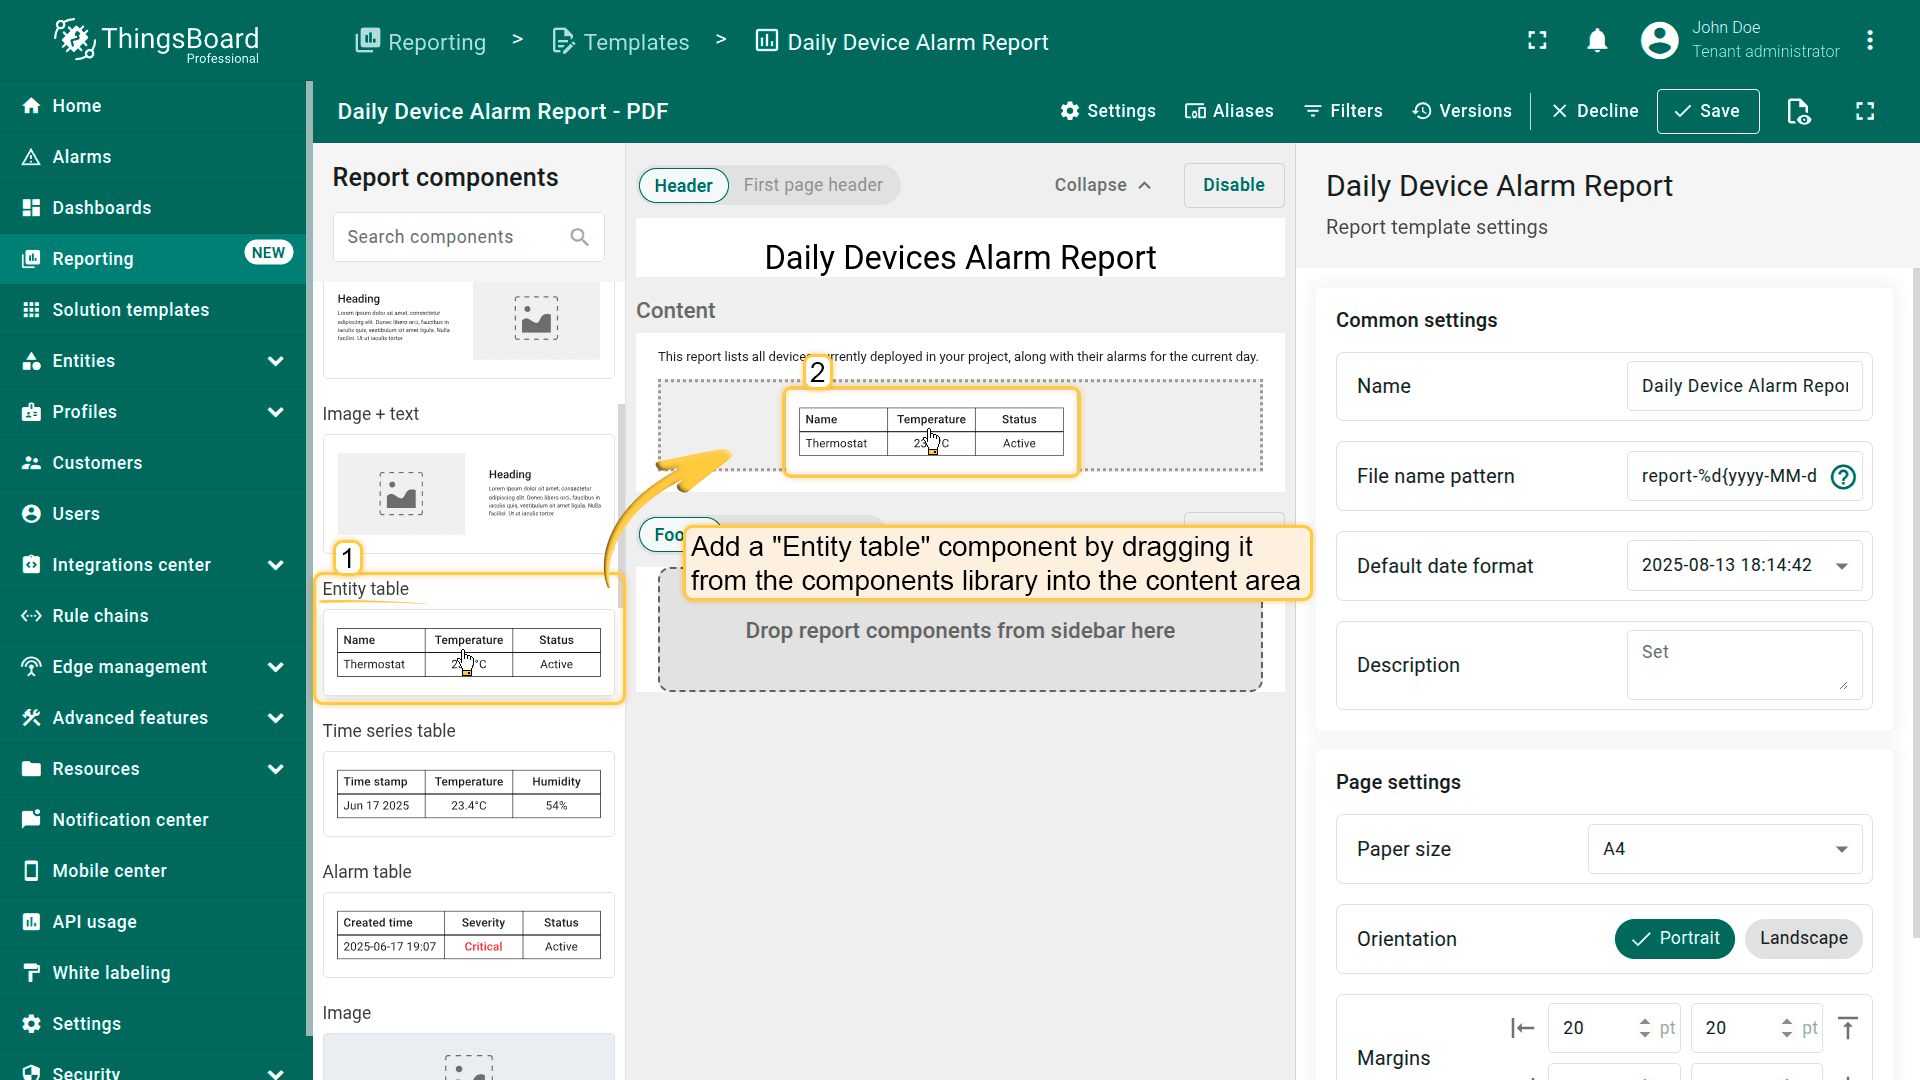
Step 2.3 “Entity table” component
The next component we'll add is the Entity table — a table-style component that will display a list of all your devices along with their latest telemetry values and status.
- Drag & Drop the Entity table component from the components library into the content area.
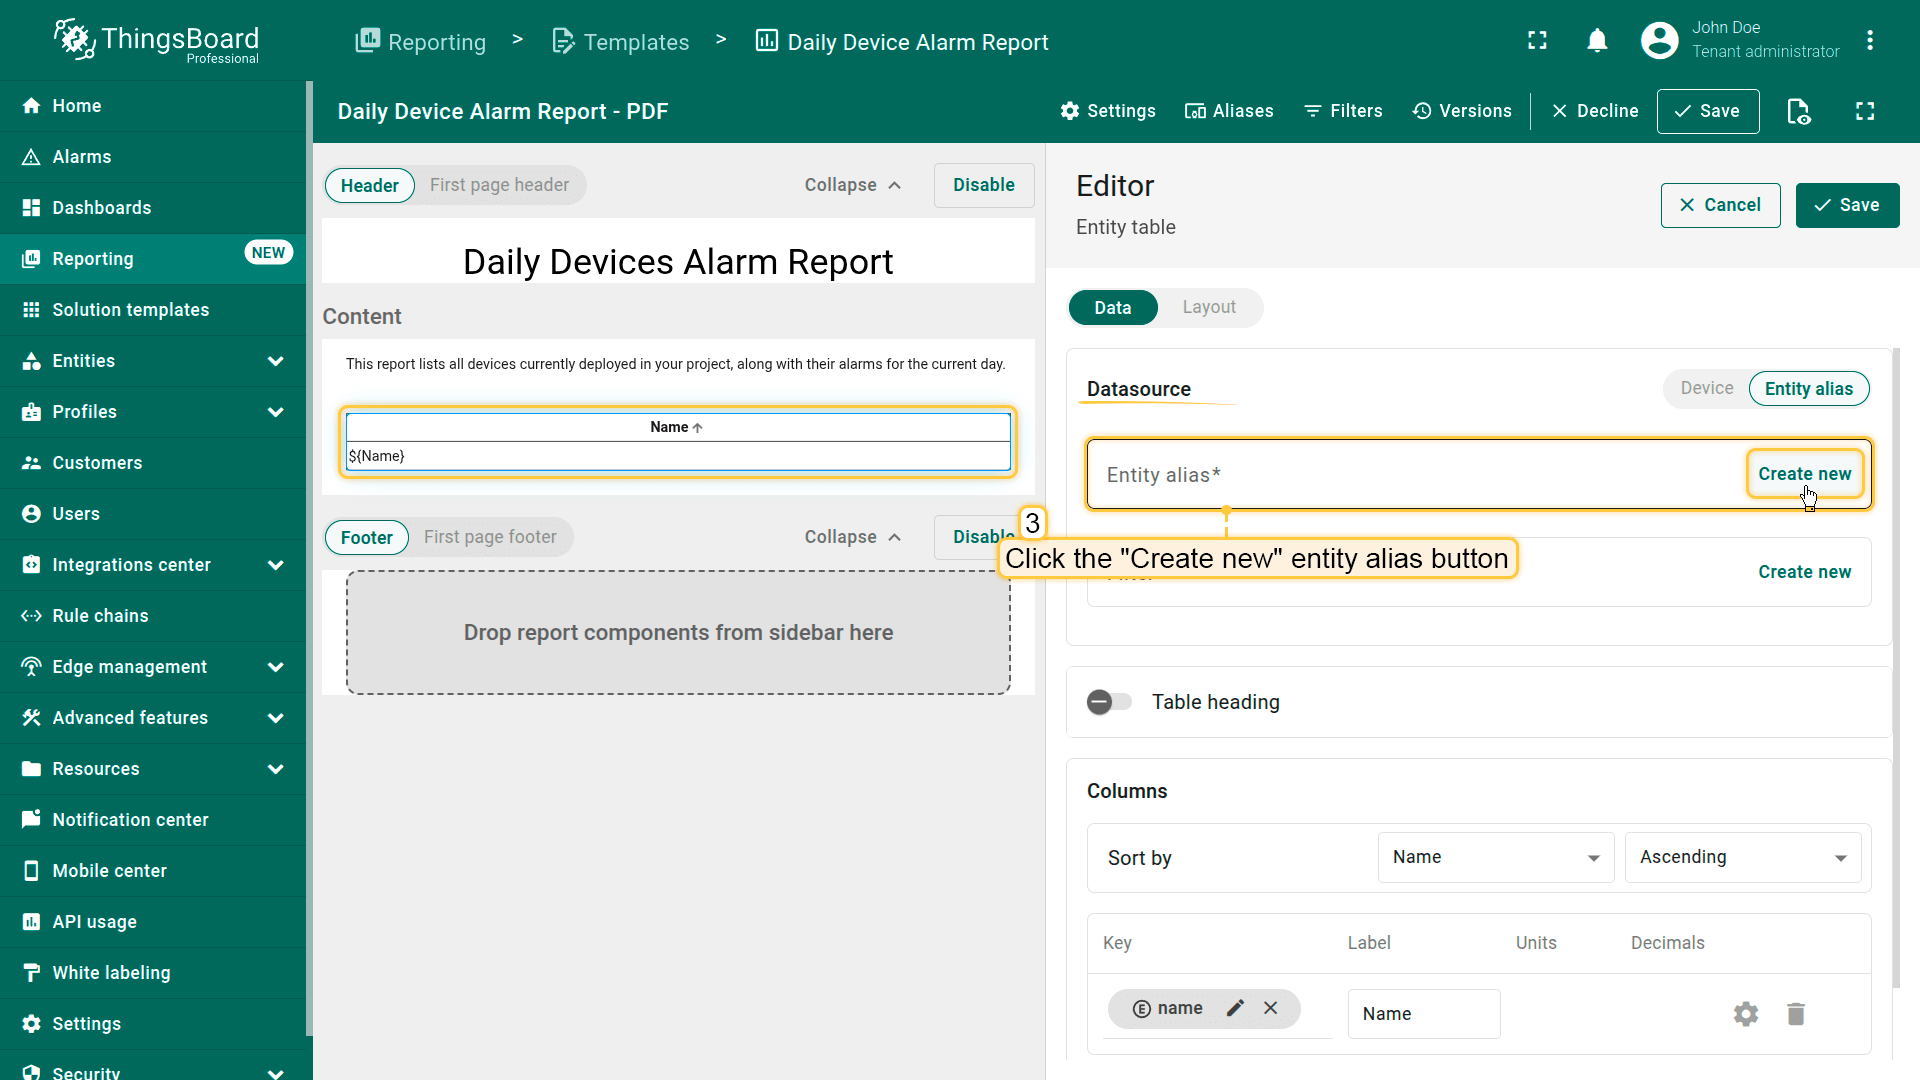
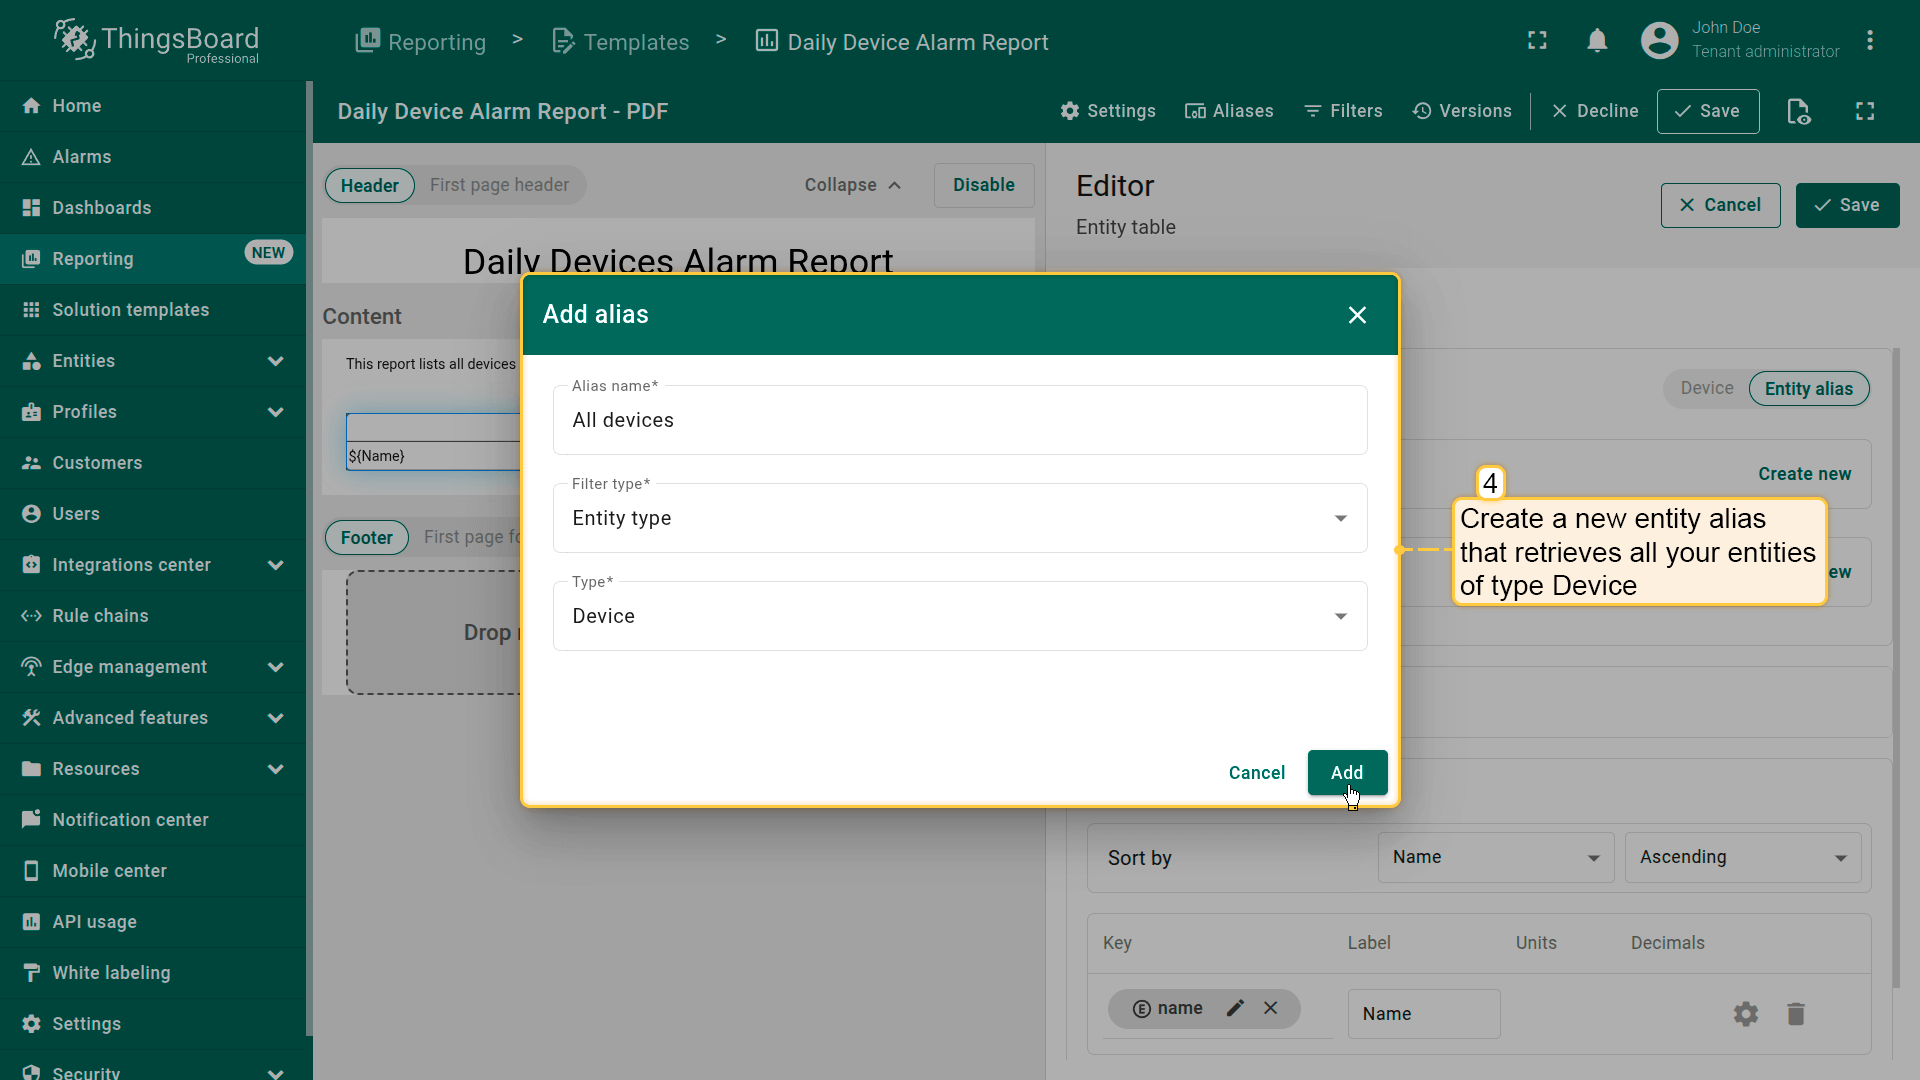
- In the Datasource section, create a new entity alias that retrieves all your entities of type Device.
- Turn on the table heading and update the heading text.
- In the Columns section:
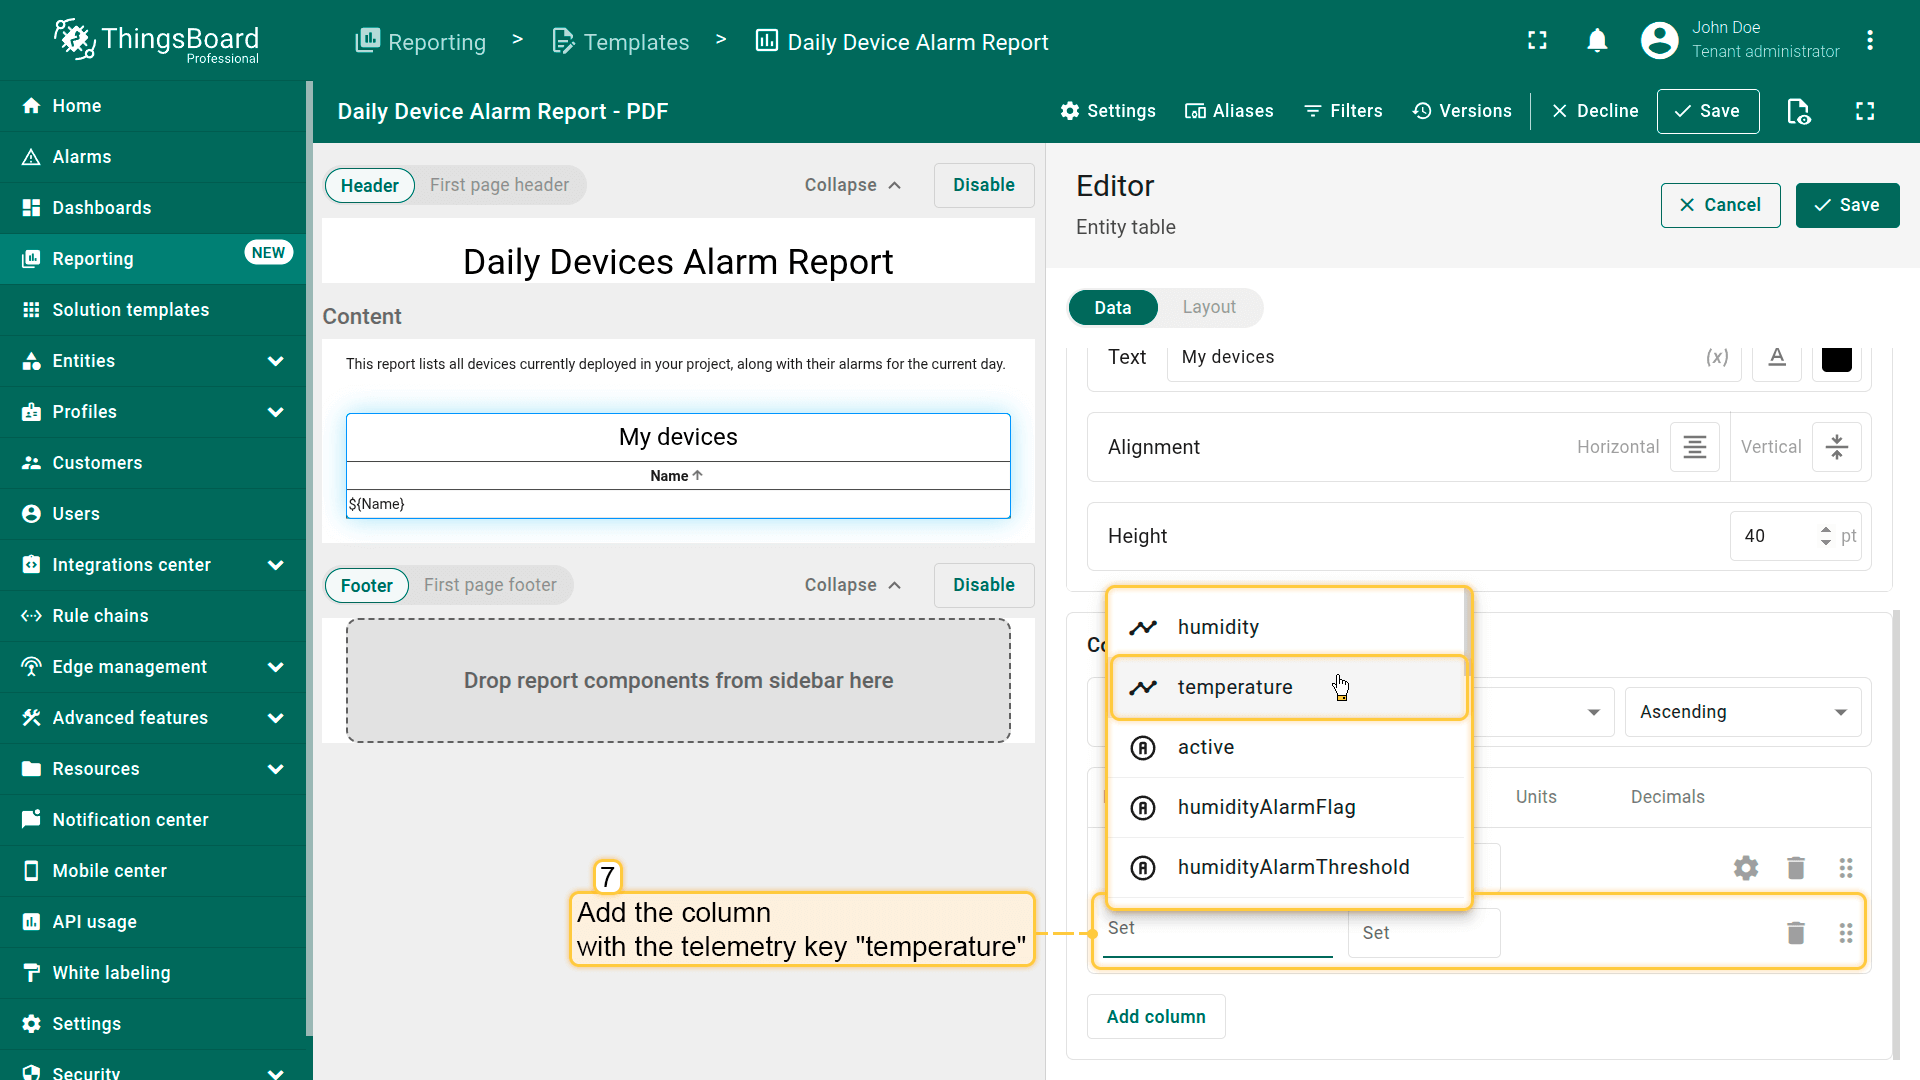
- Add a new table column and set the key to “temperature”.
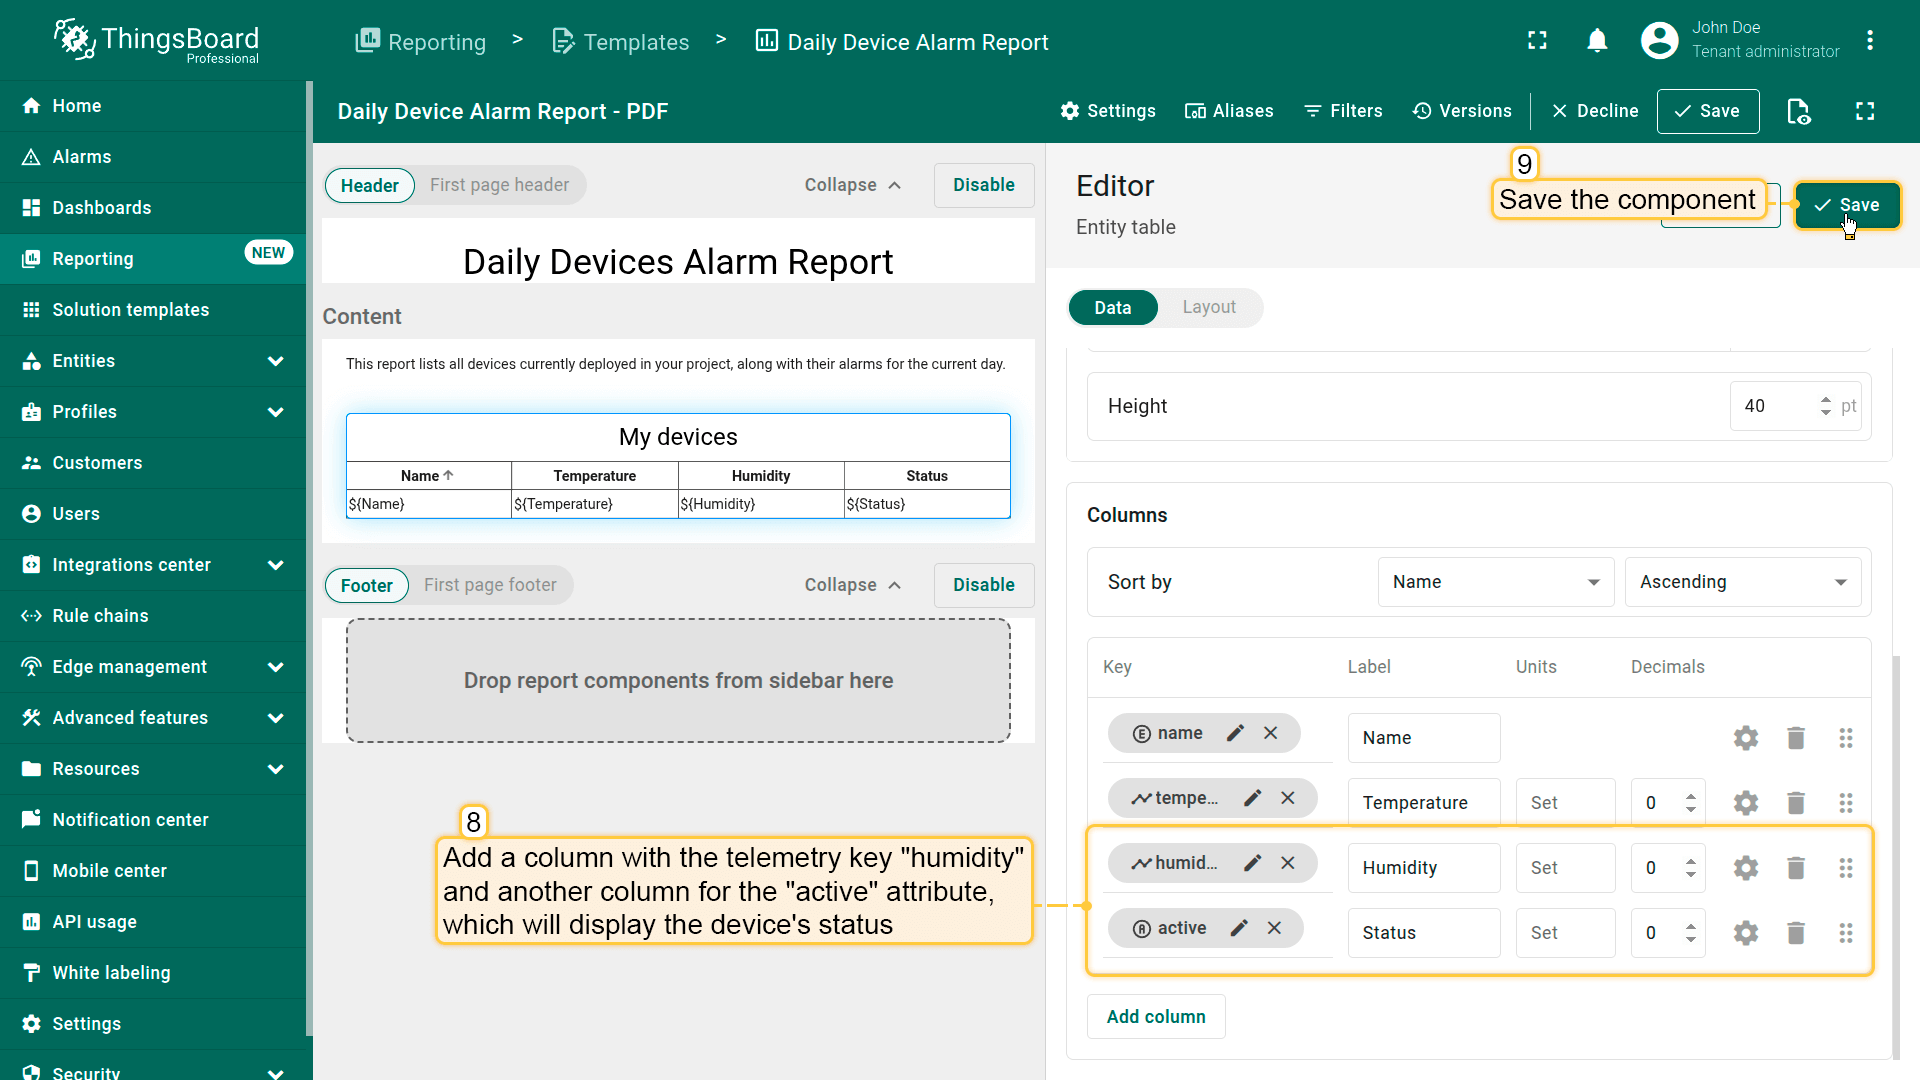
- Add another table column with the telemetry key “humidity”.
- Add one more table column for the attribute “active”, which will display the device's status.
- In the column settings, set center alignment for the cells of each key.
- Click Save component to apply your changes.
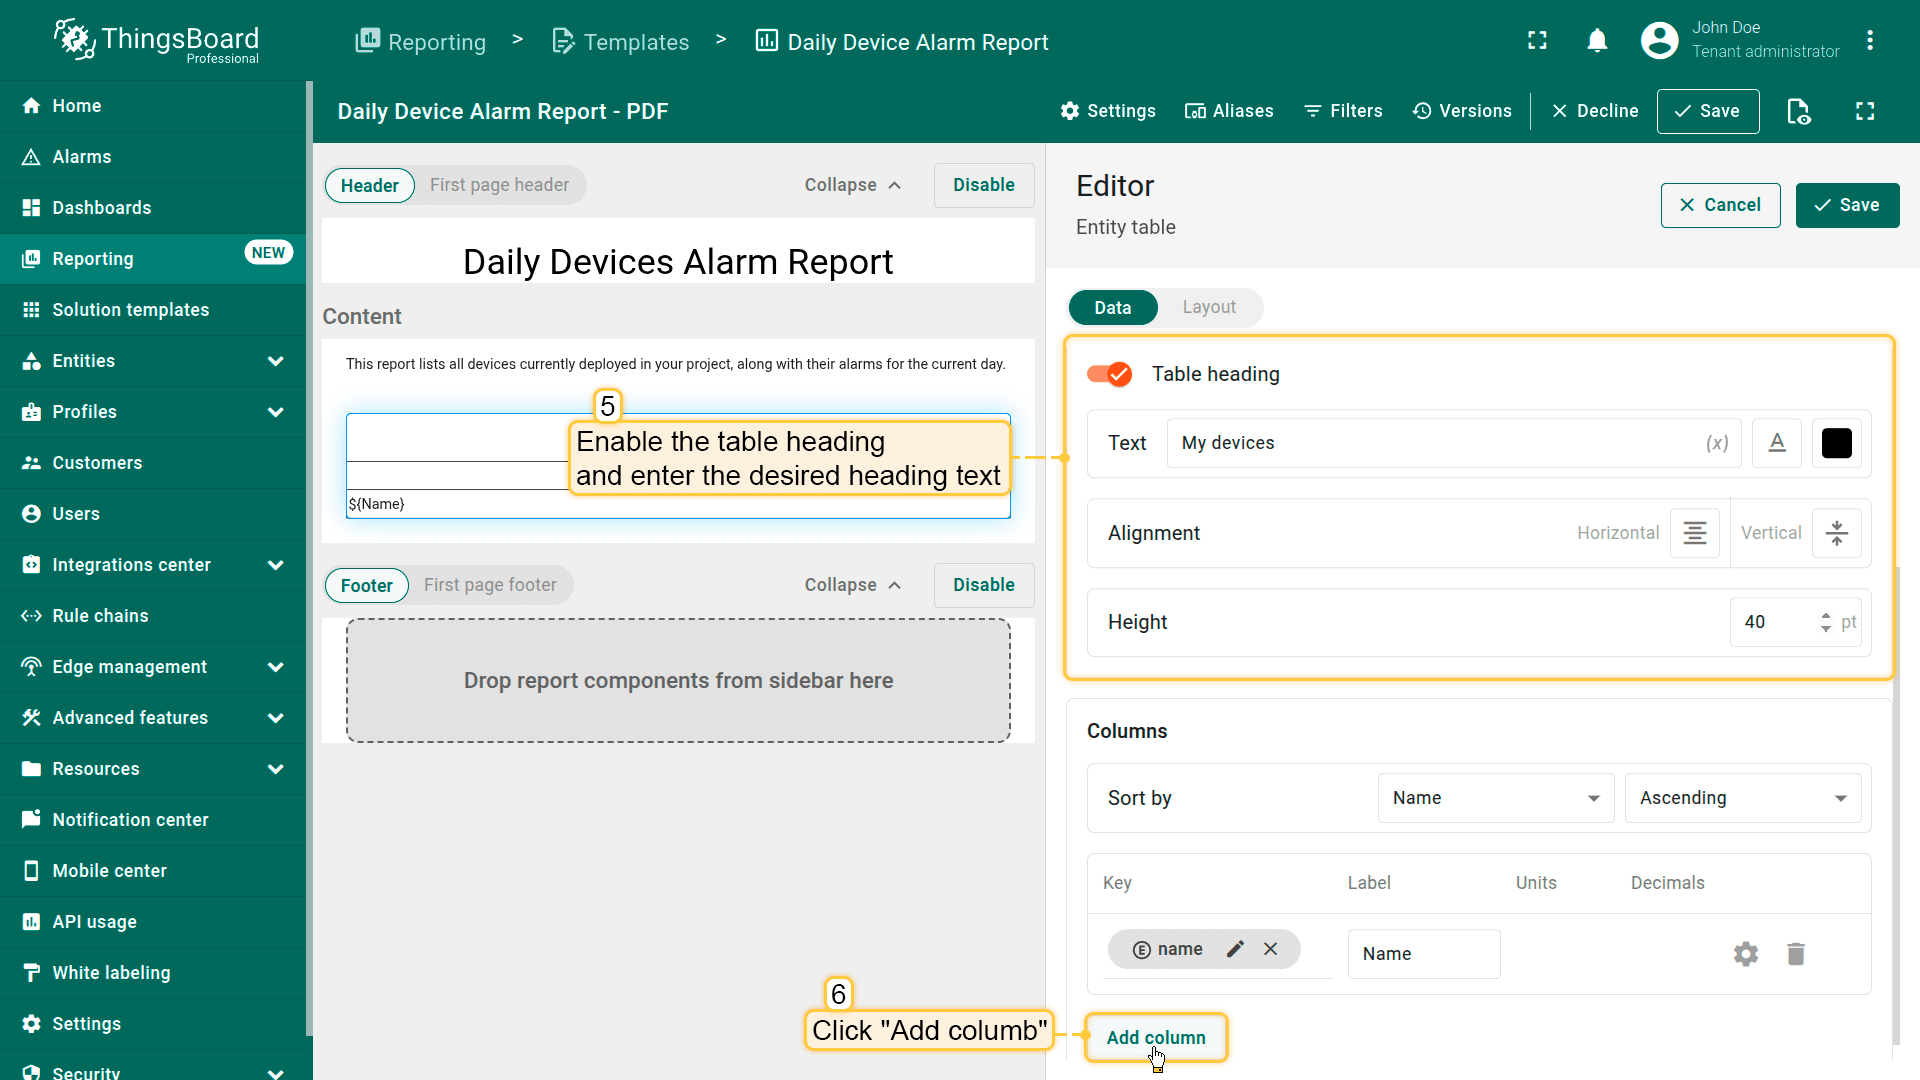
- In the "Columns" section click "Add column".
- In the column settings, set center alignment for the cells of each key.
- Click Apply to save component.
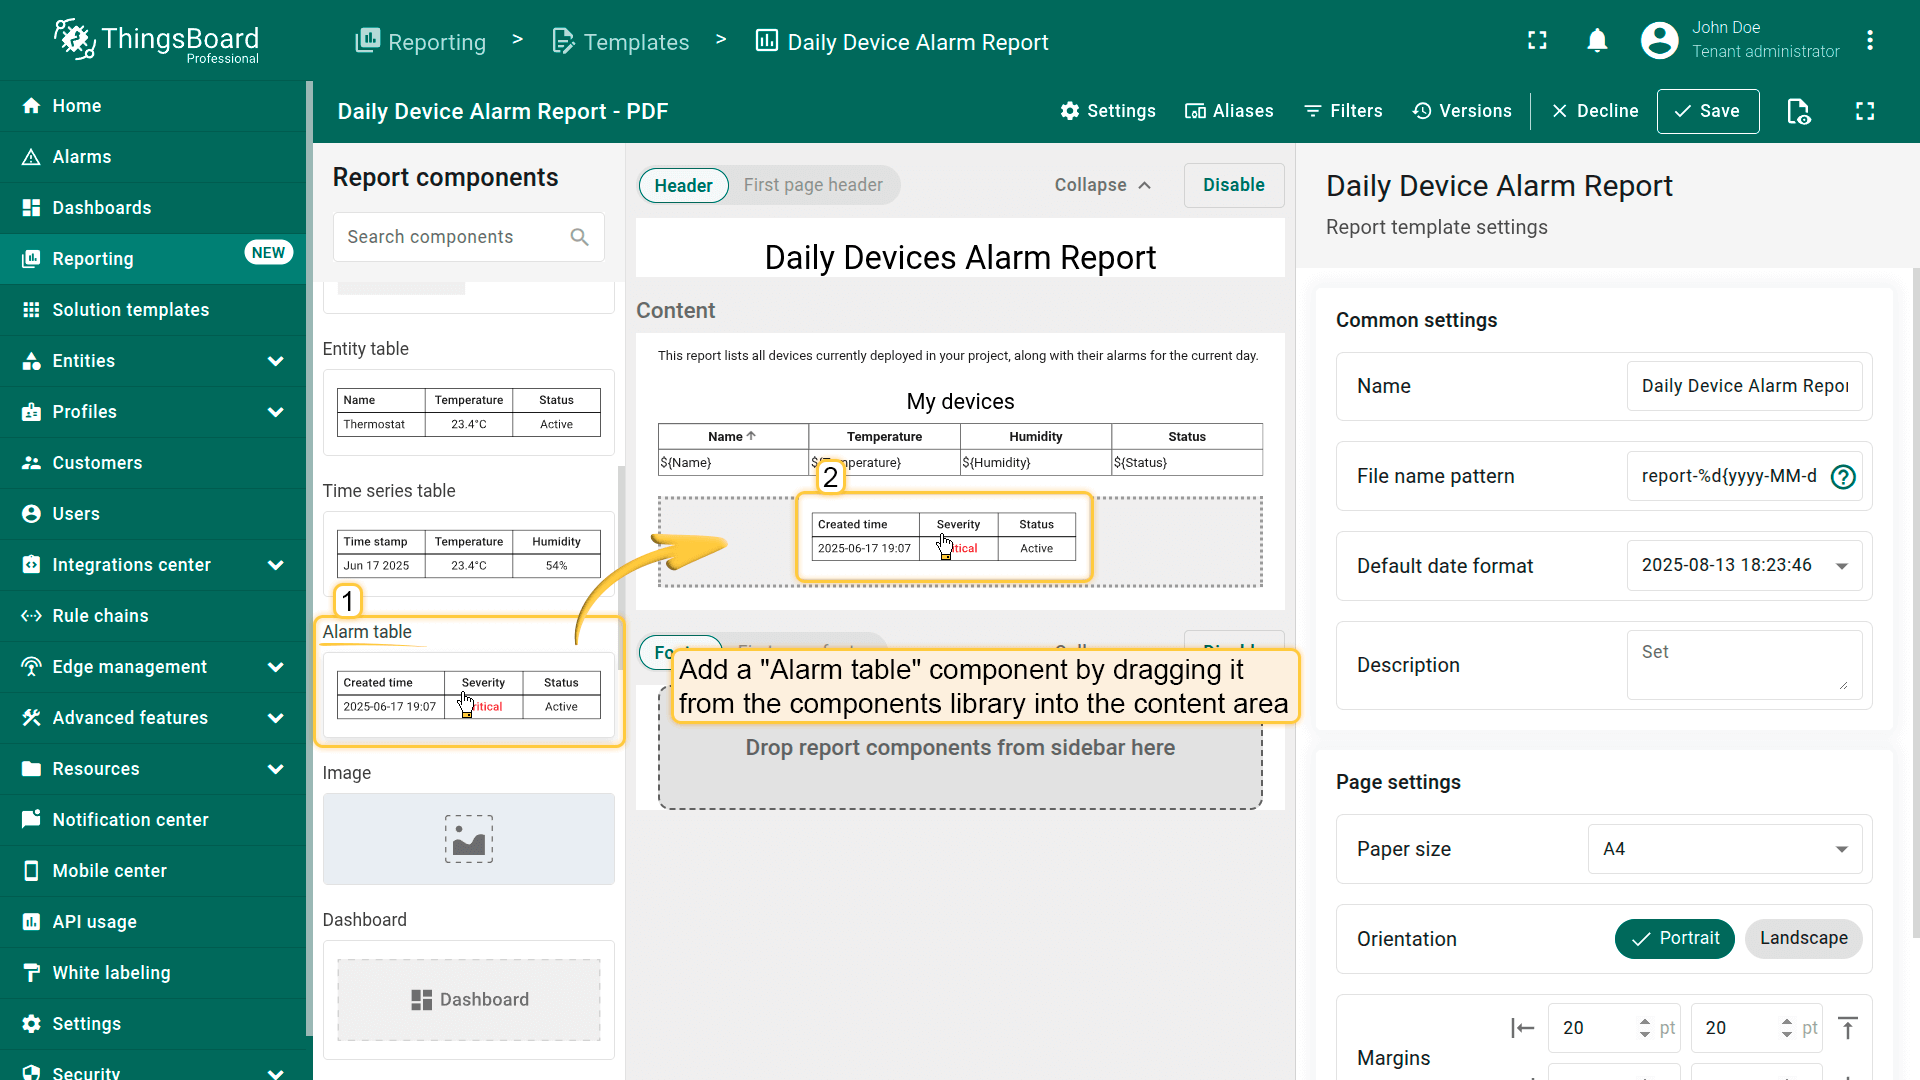
Step 2.4 “Alarm table” component
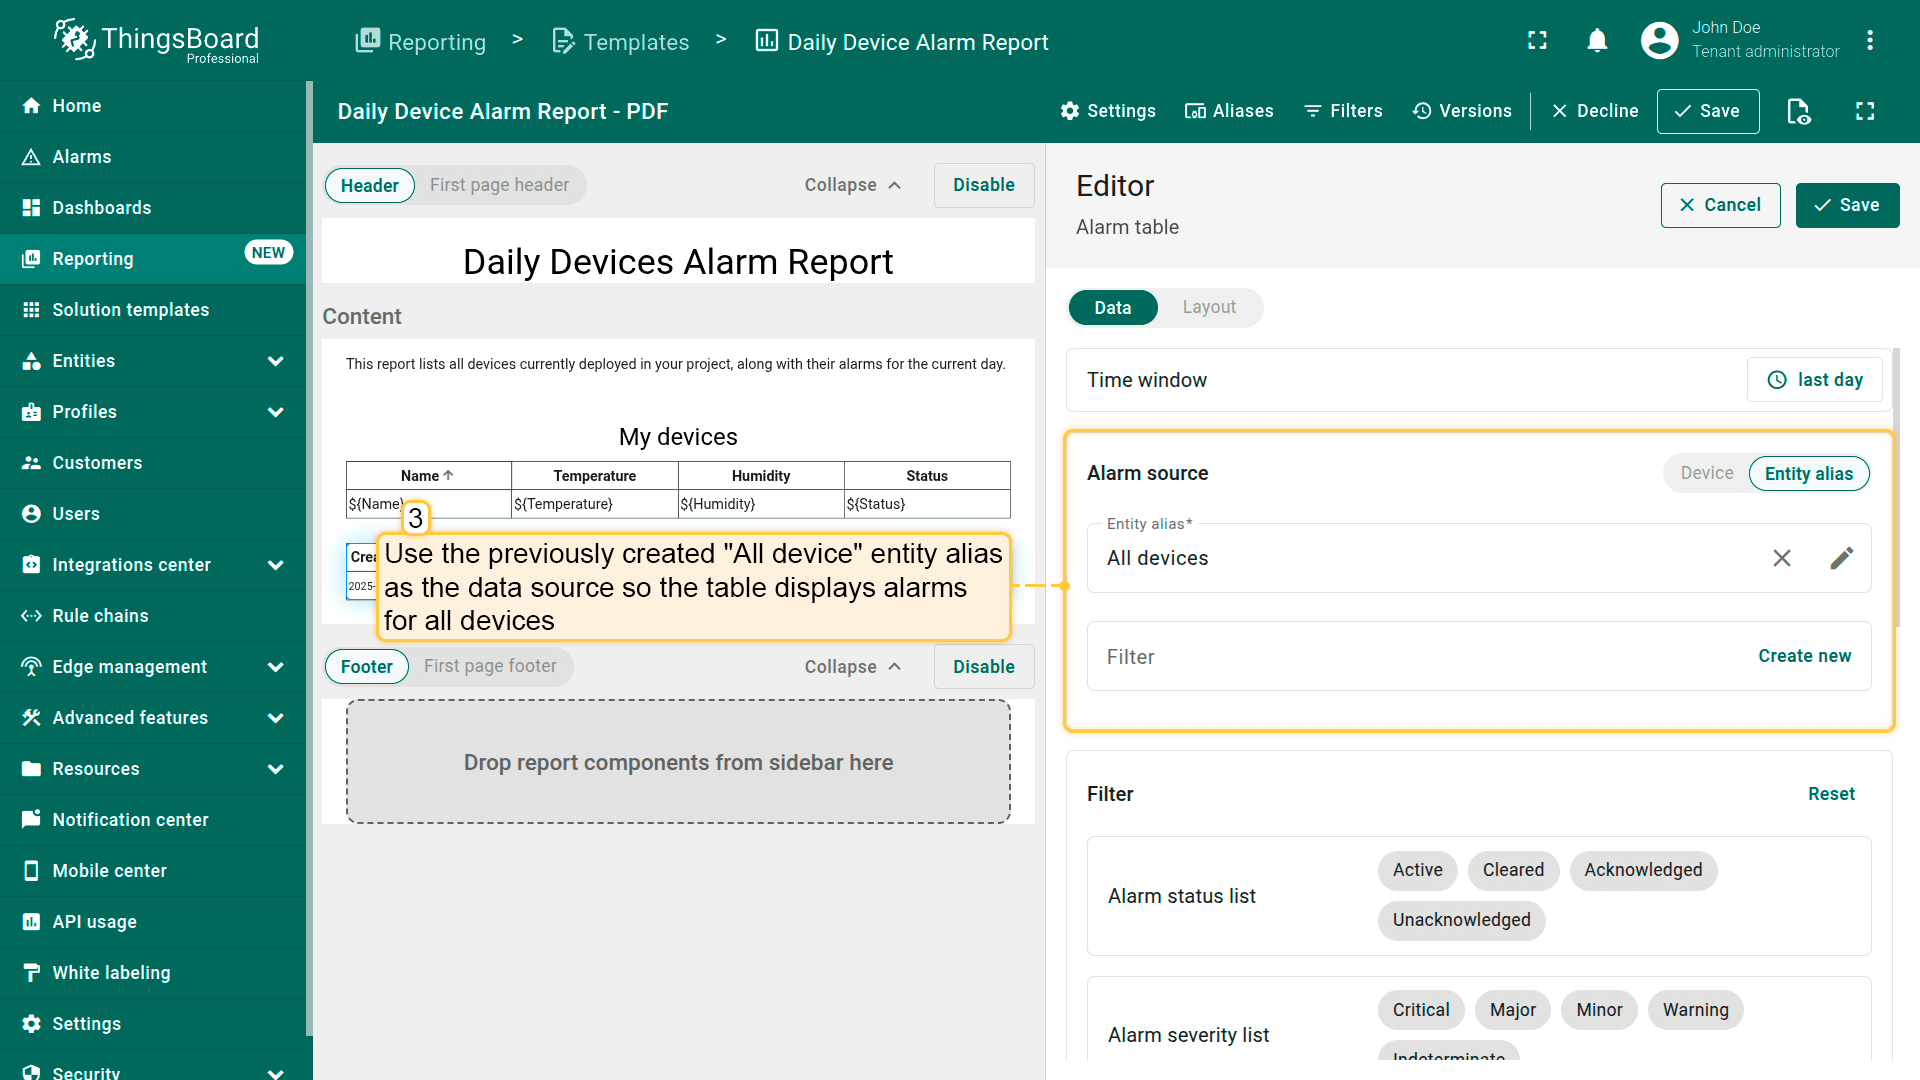
The next component we'll add is the Alarm table component, which displays a list of alarms for the selected period.
- From the components panel, drag the Alarm table component into the main content area of your report layout.
- By default, the Alarm table is preconfigured to display alarms from the last 24 hours.
- Set the All devices entity alias as the alarm source.
- In the Filters section, check the box to display only currently active alarms.
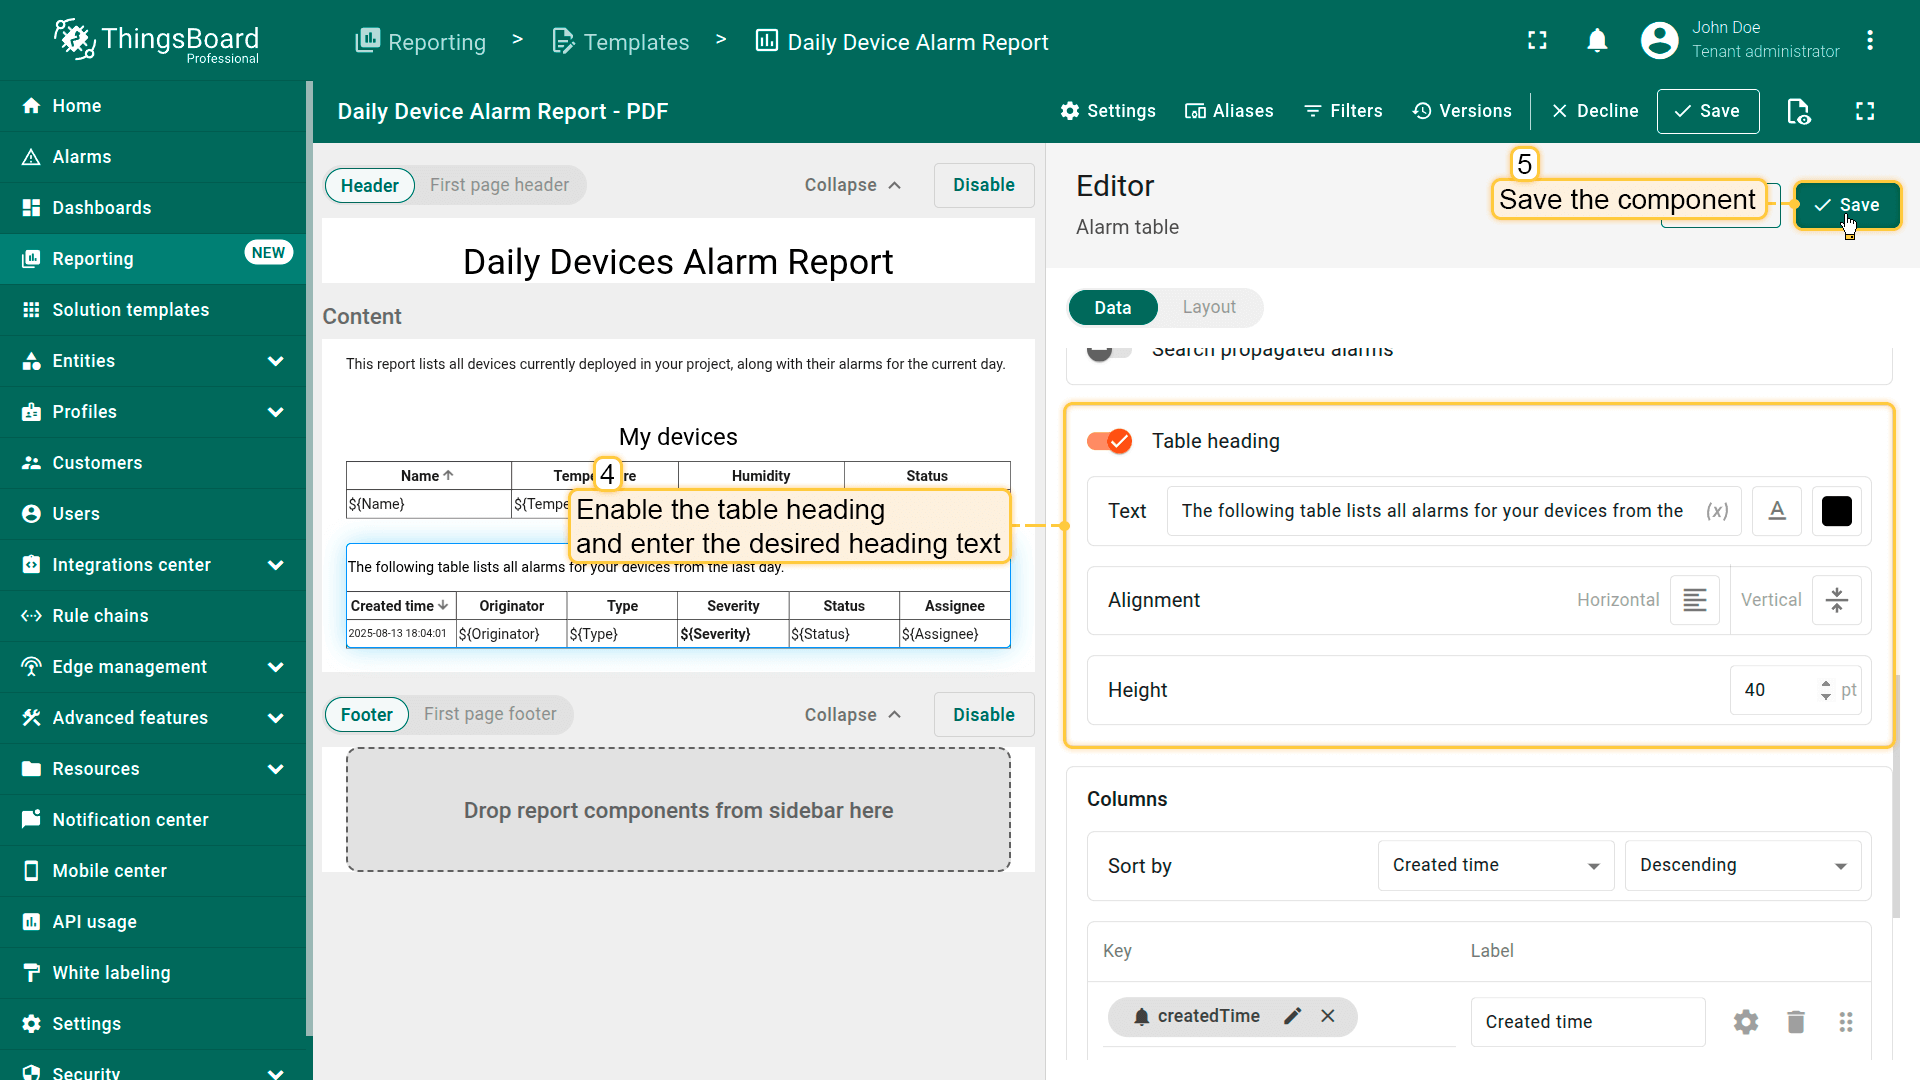
- Scroll down slightly, find the switch labeled Table heading, and toggle it on.
- Type your desired heading, for example:
1
The following table lists all alarms for your devices from the last day.
- Adjust the horizontal alignment and reduce the font size if desired.
- Keep the table columns as they are (no changes needed).
- Save the component.
- Set the entity alias All devices as the alarm source.
- In the Filters section, check the box to display only currently active alarms.
Adjust the horizontal alignment and reduce the font size if desired.
- Save the component.
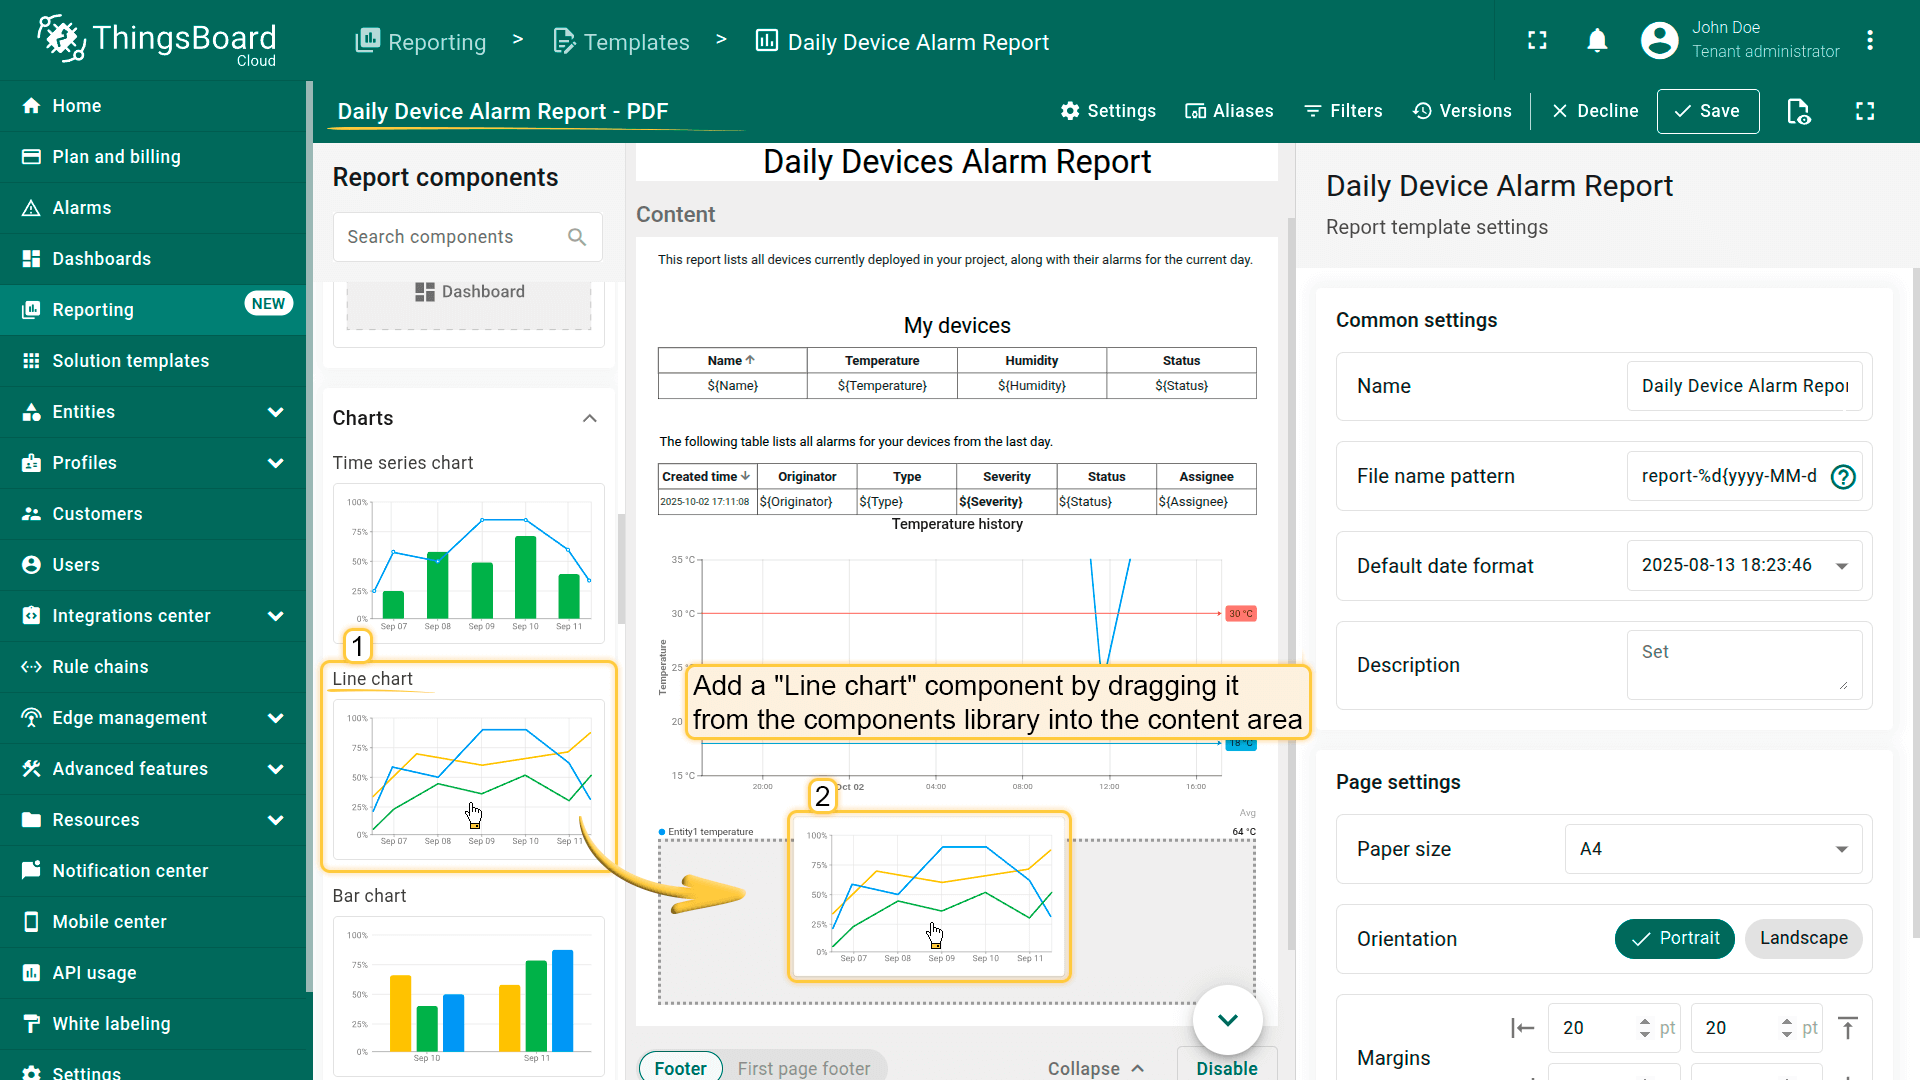
Step 2.5 “Line chart” component
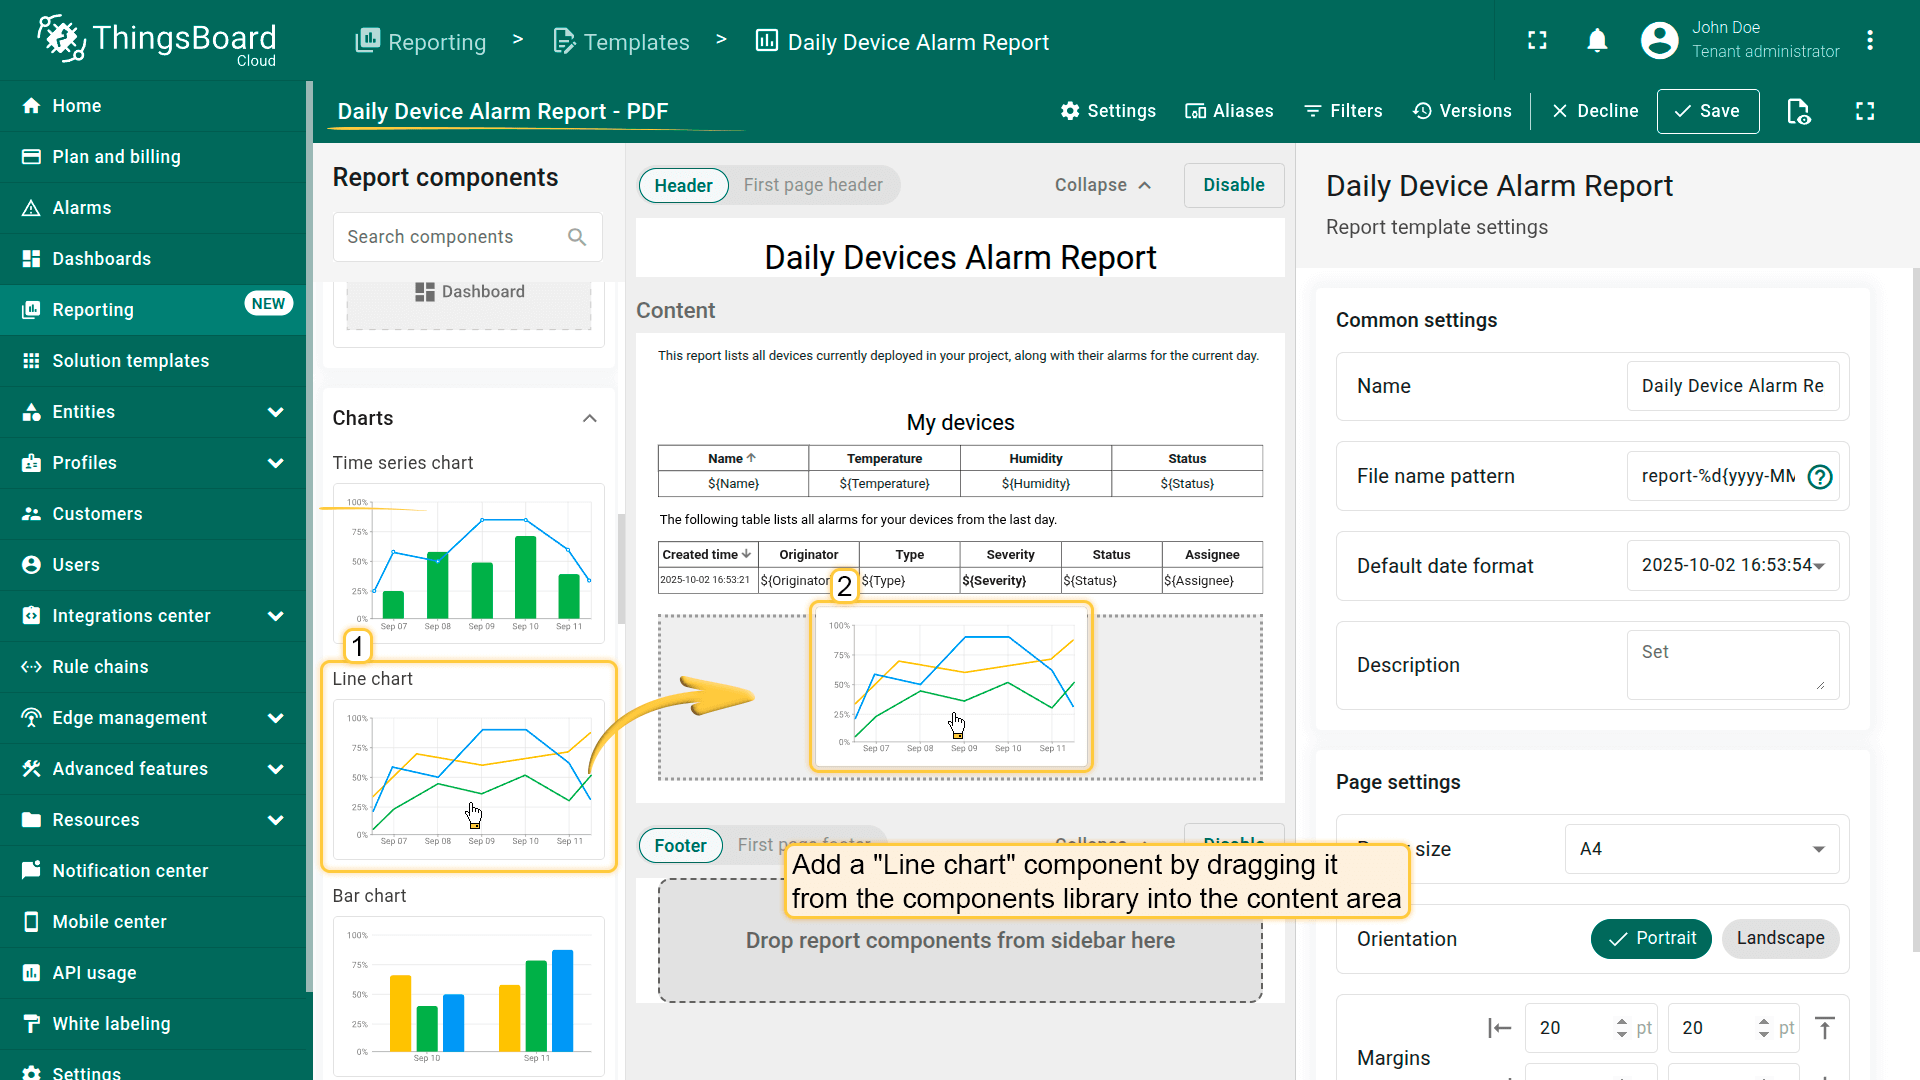
The final components we'll add to the report are two separate line charts to visualize historical telemetry trends for temperature and humidity. Each chart will represent data collected over the last 24 hours from your devices.
1. Add the first chart – Temperature
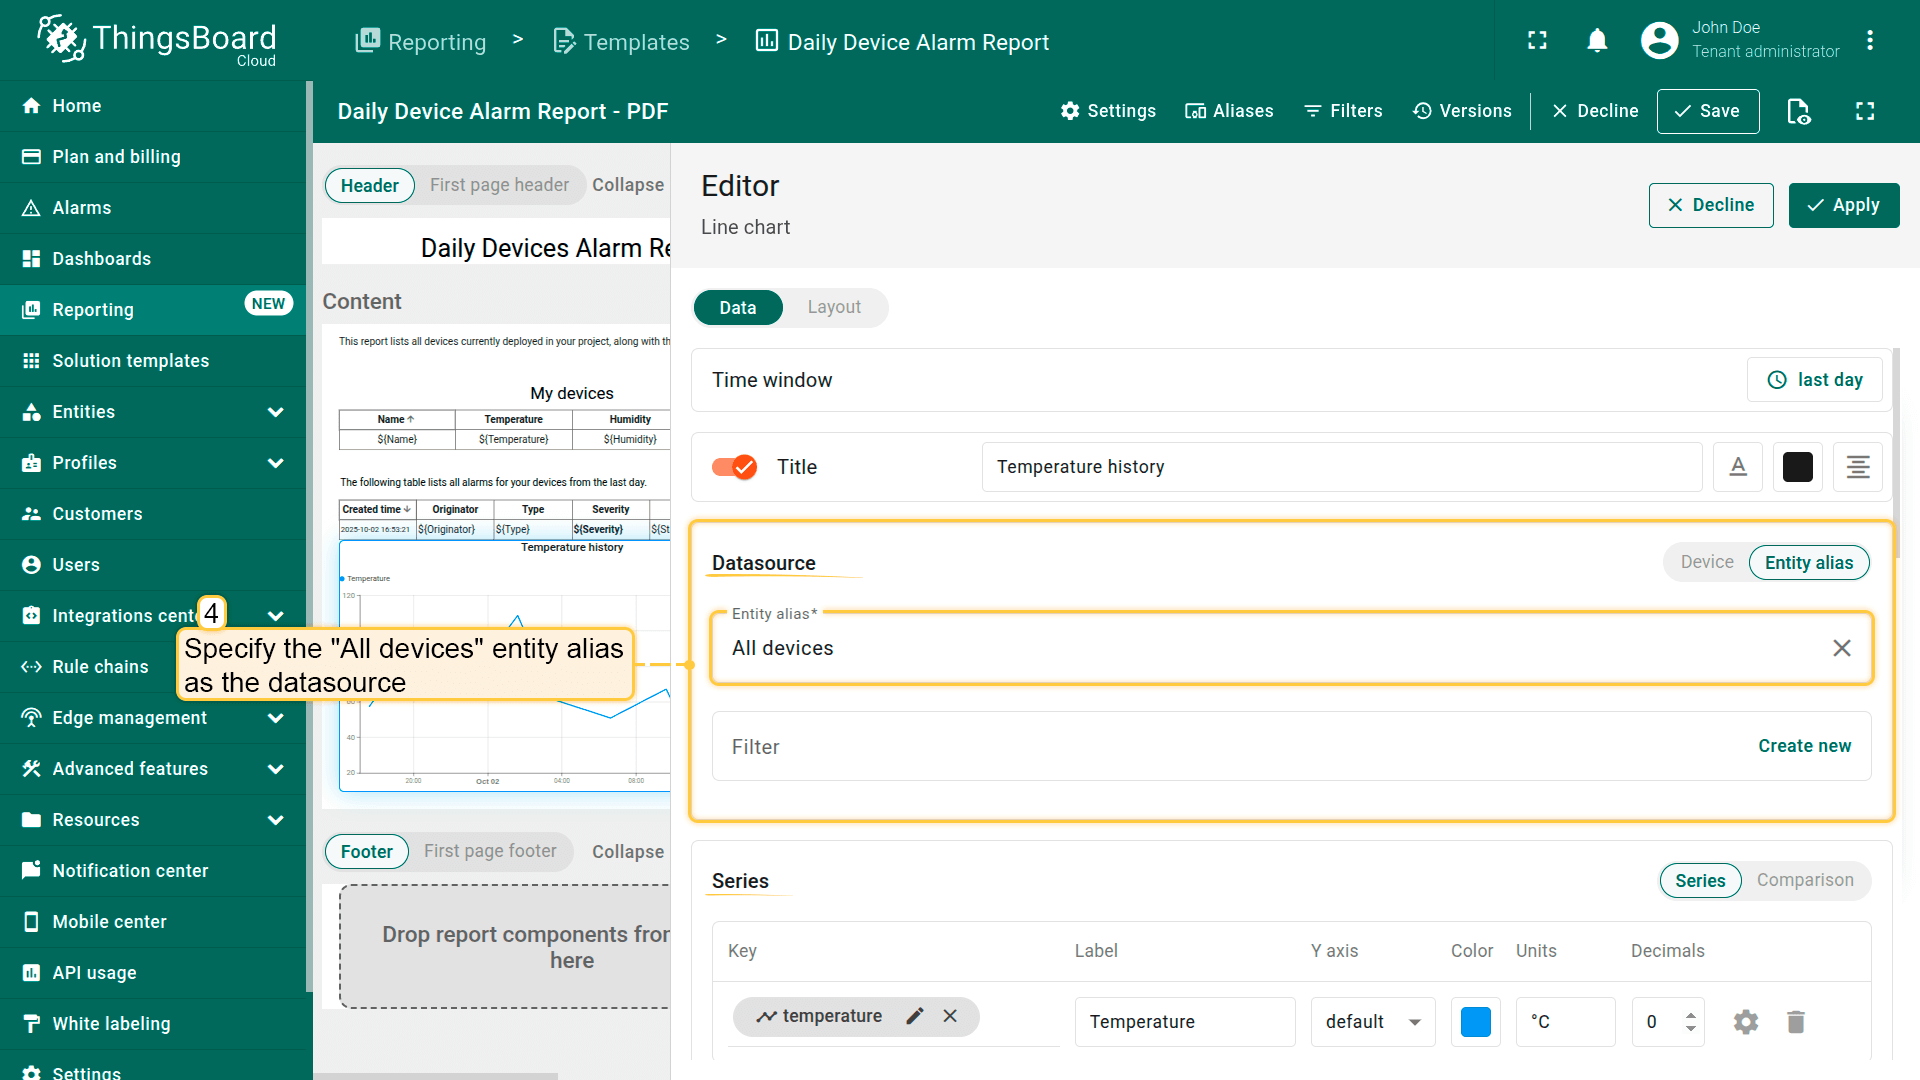
- Drag the Line chart component into the content area of the report.
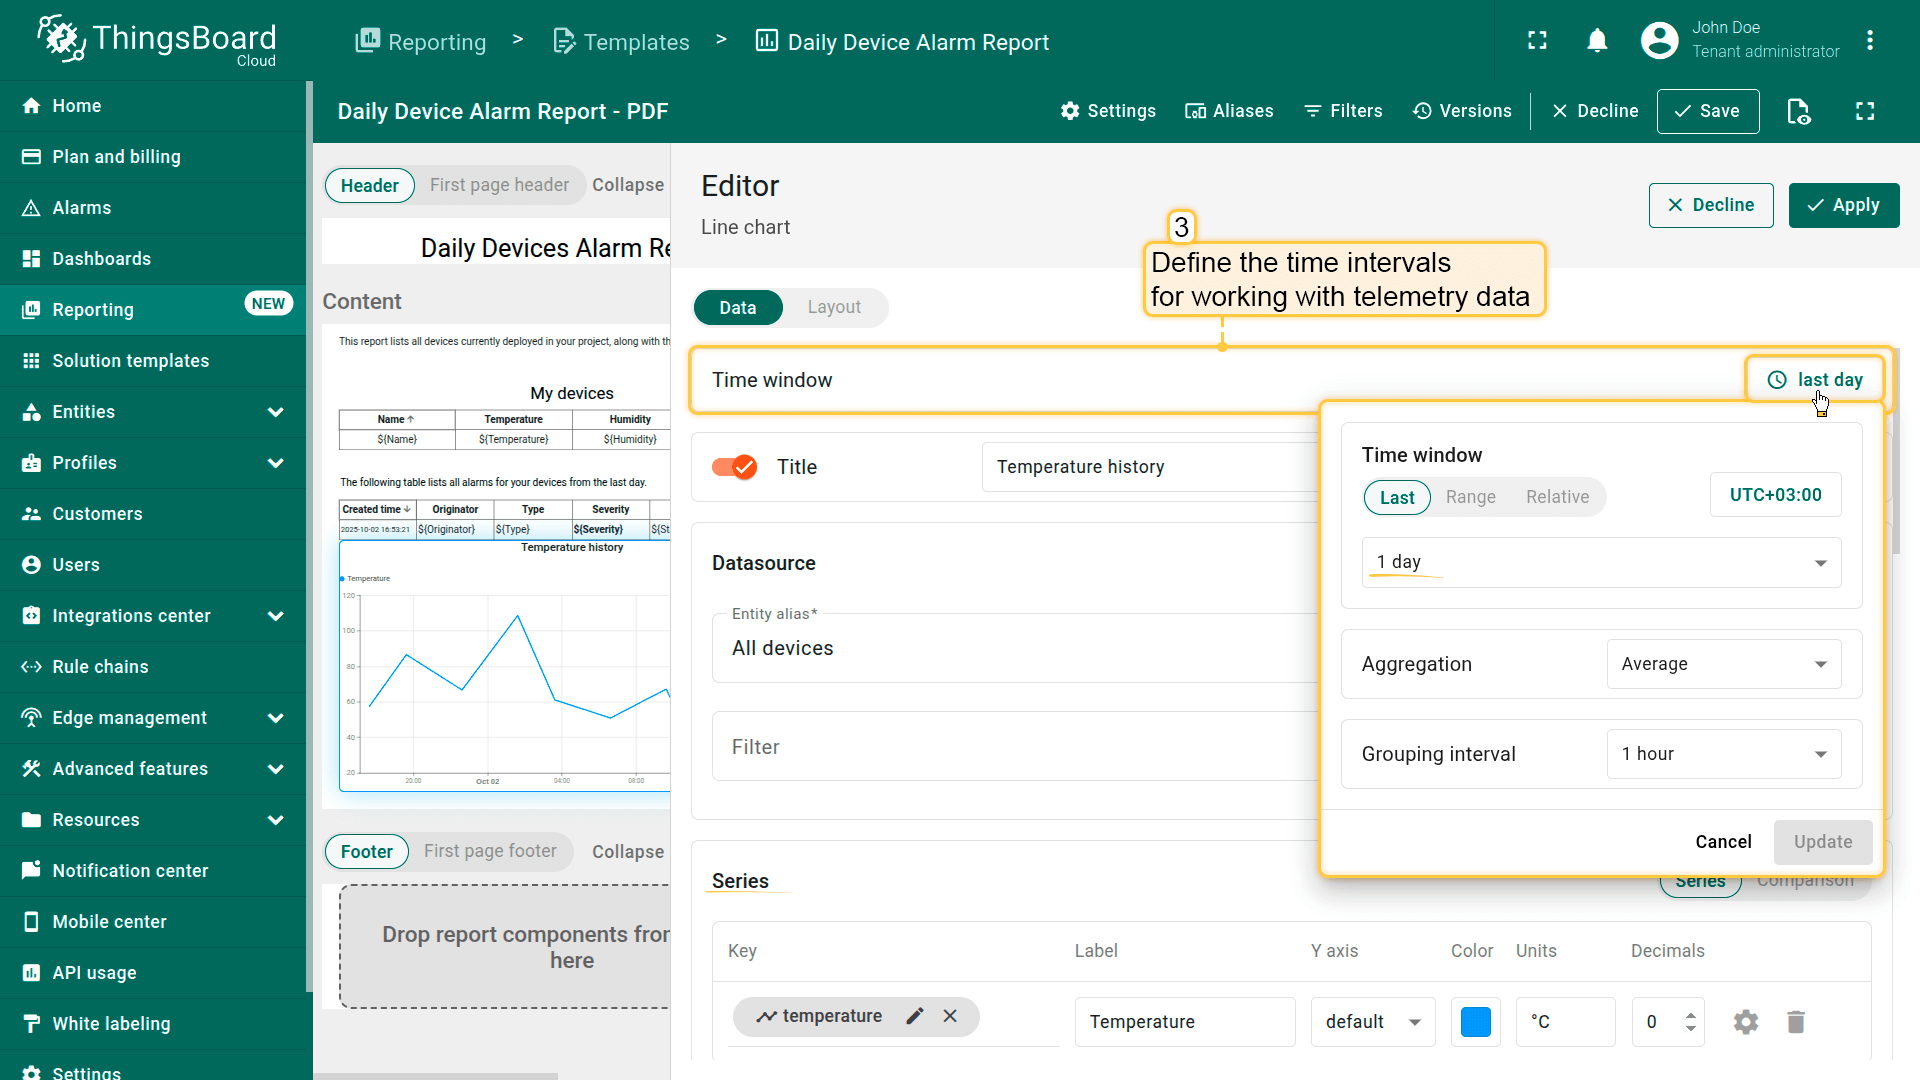
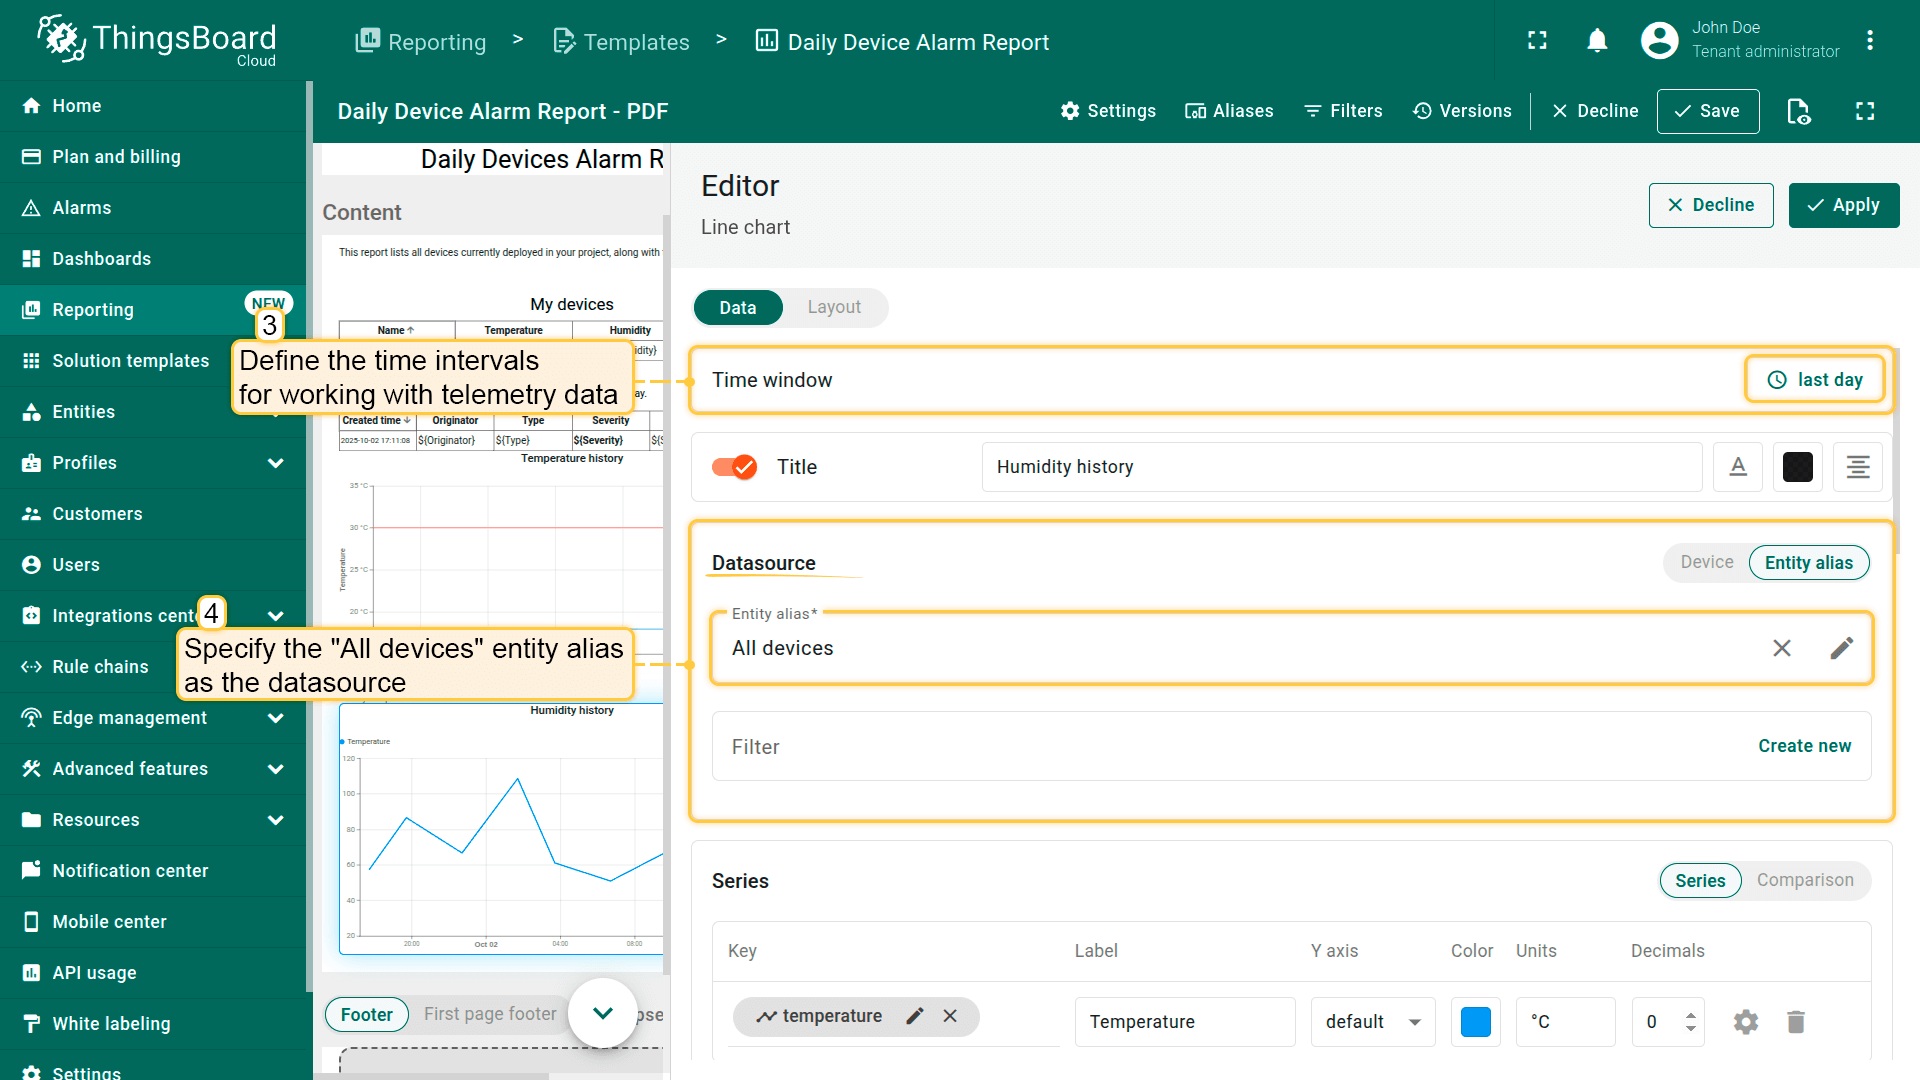
- By default, the time window shows the last day of data, aggregated by 1 hour.
- Set the entity alias All devices as the datasource.
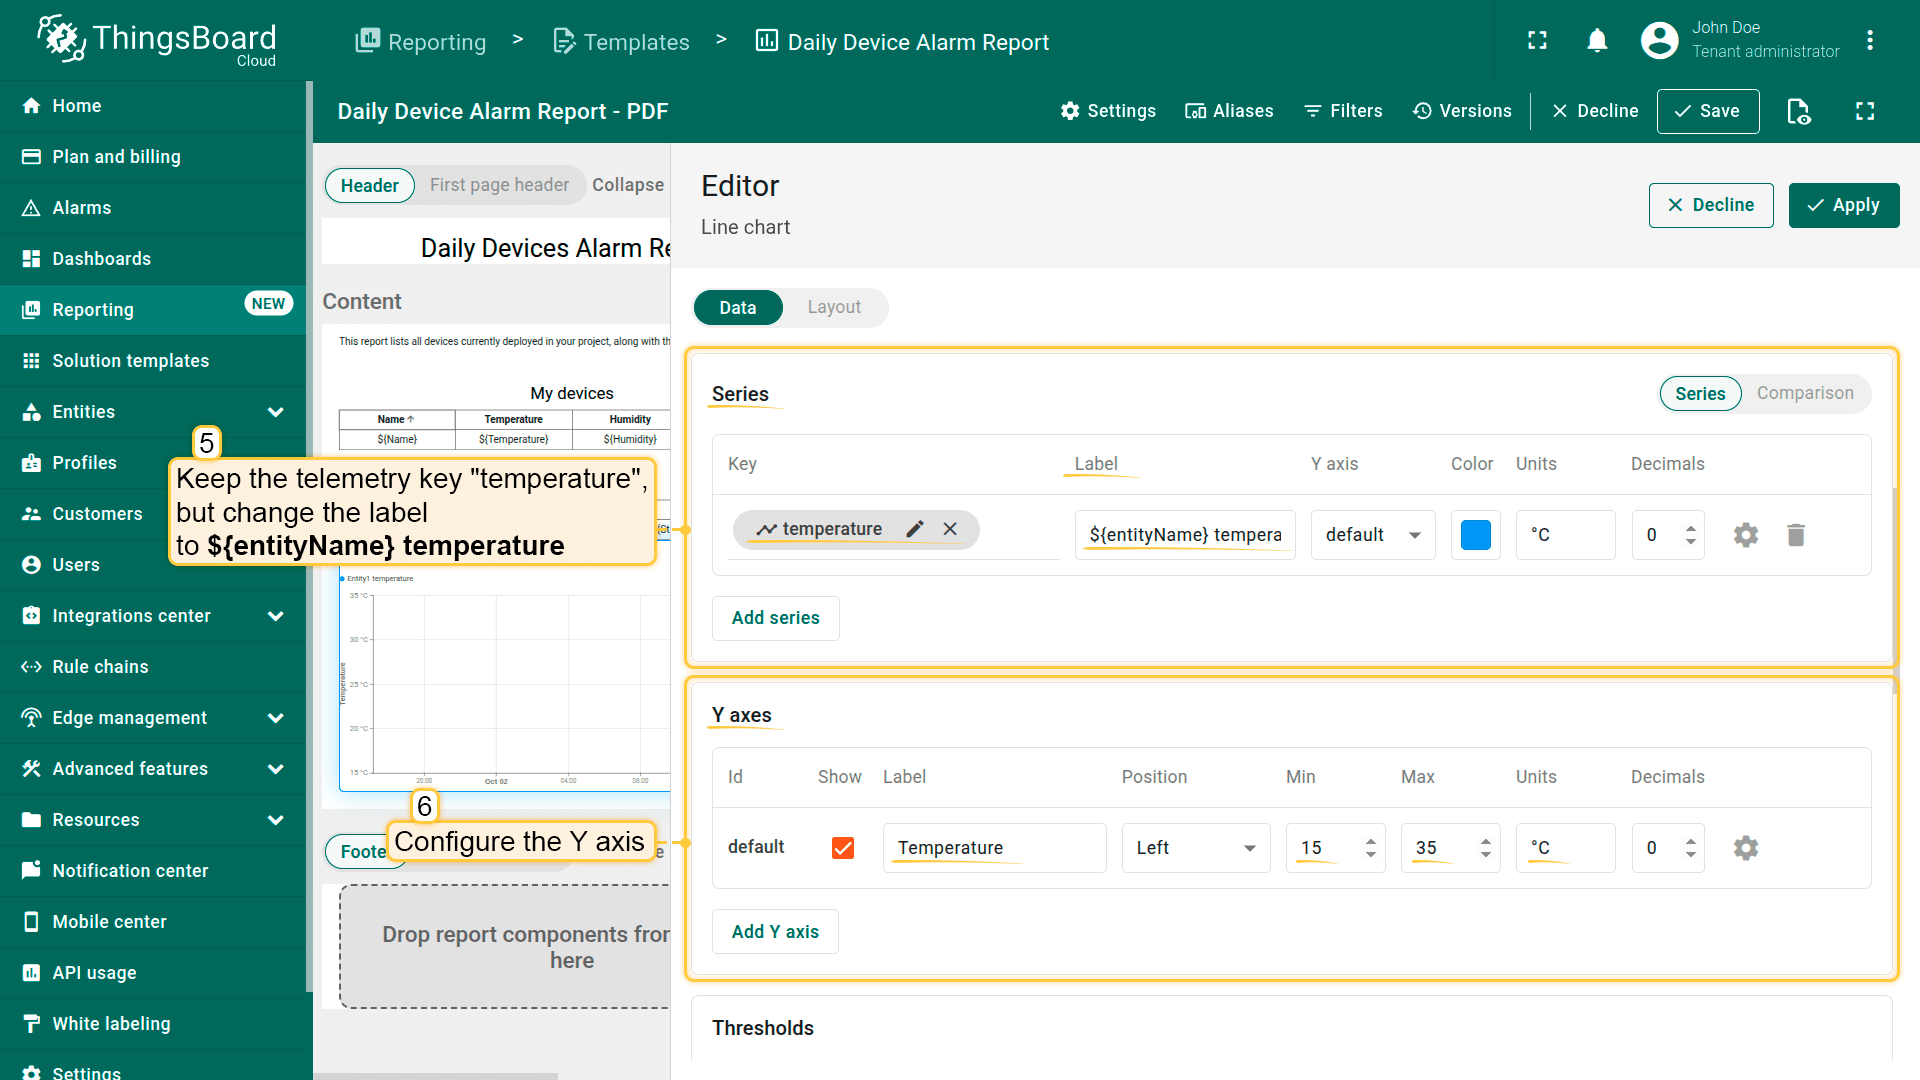
- Keep the telemetry key temperature, but change the label to
1
${entityName} temperature - Configure the Y axes:
- Label: Temperature
- Min: 15
- Max: 35
- Units: °C
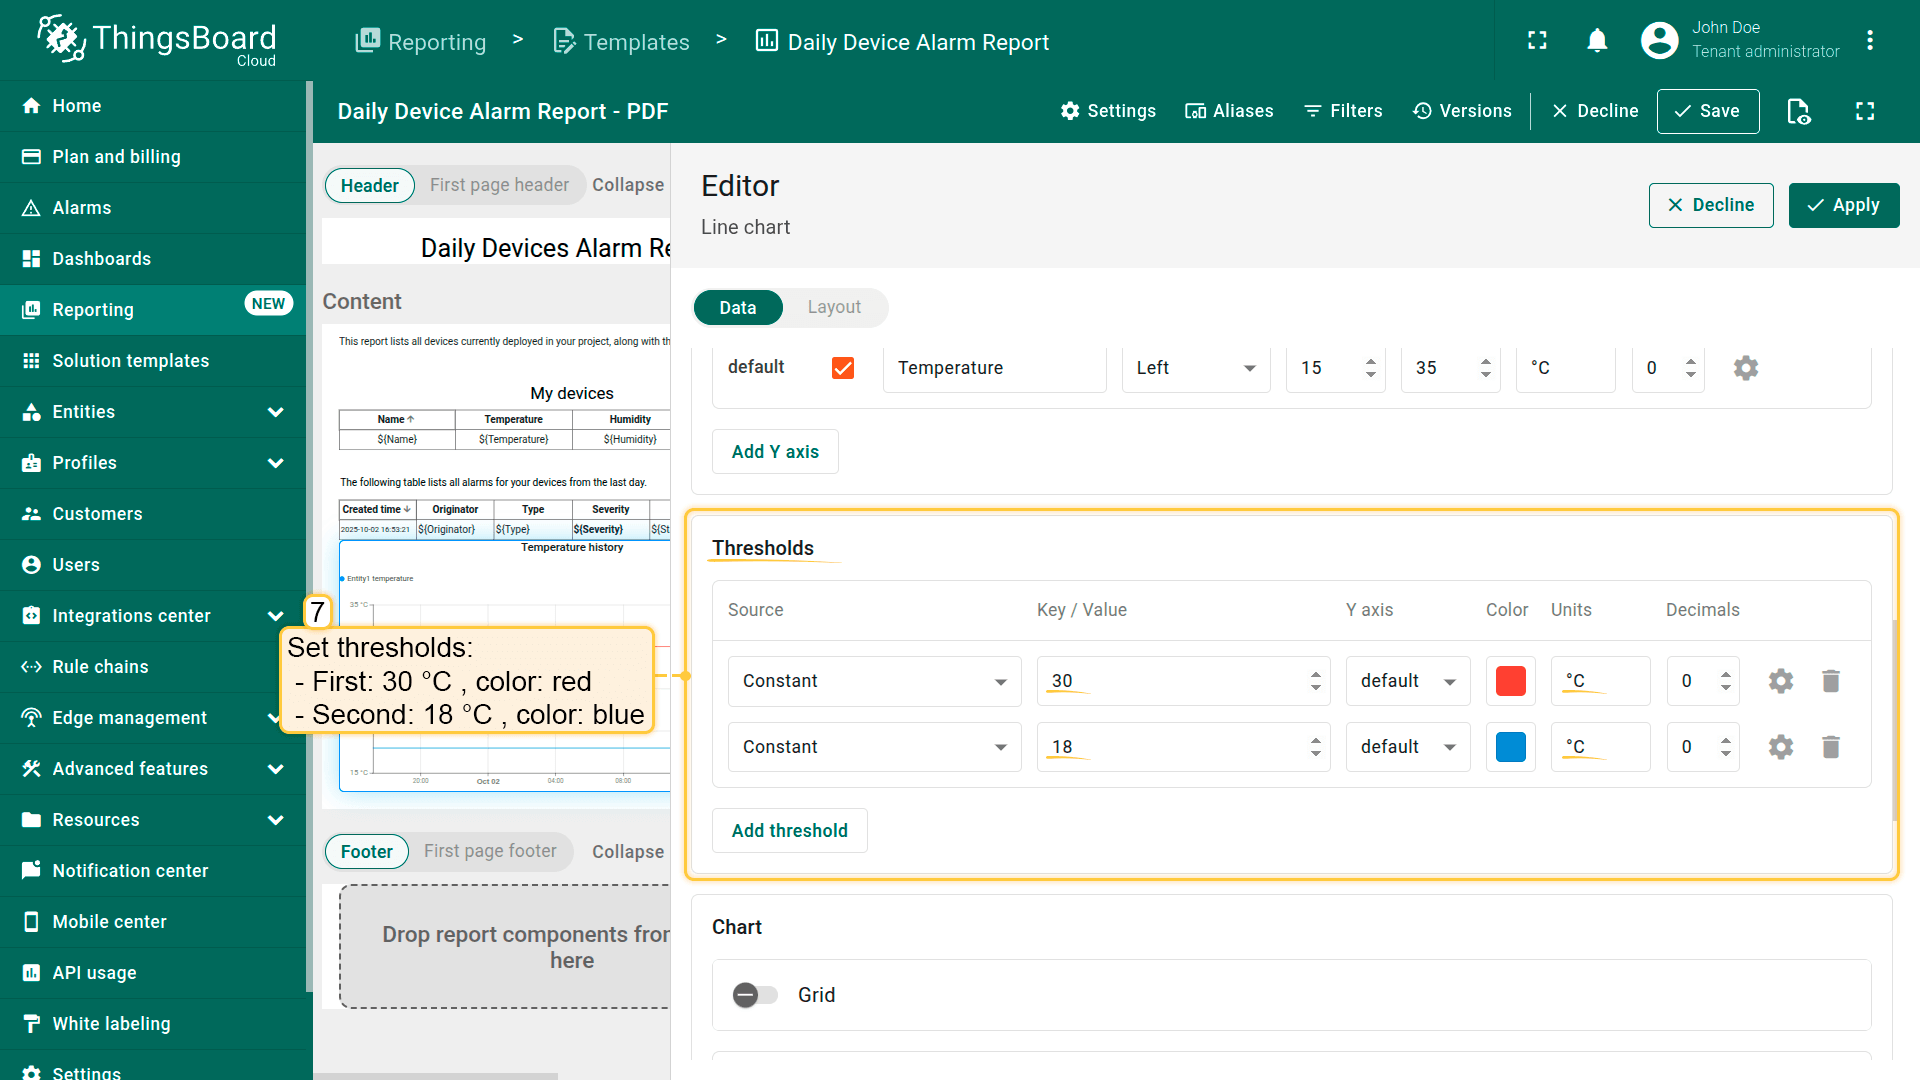
- Set thresholds:
- First: 30 °C , color red
- Second: 18 °C , color blue
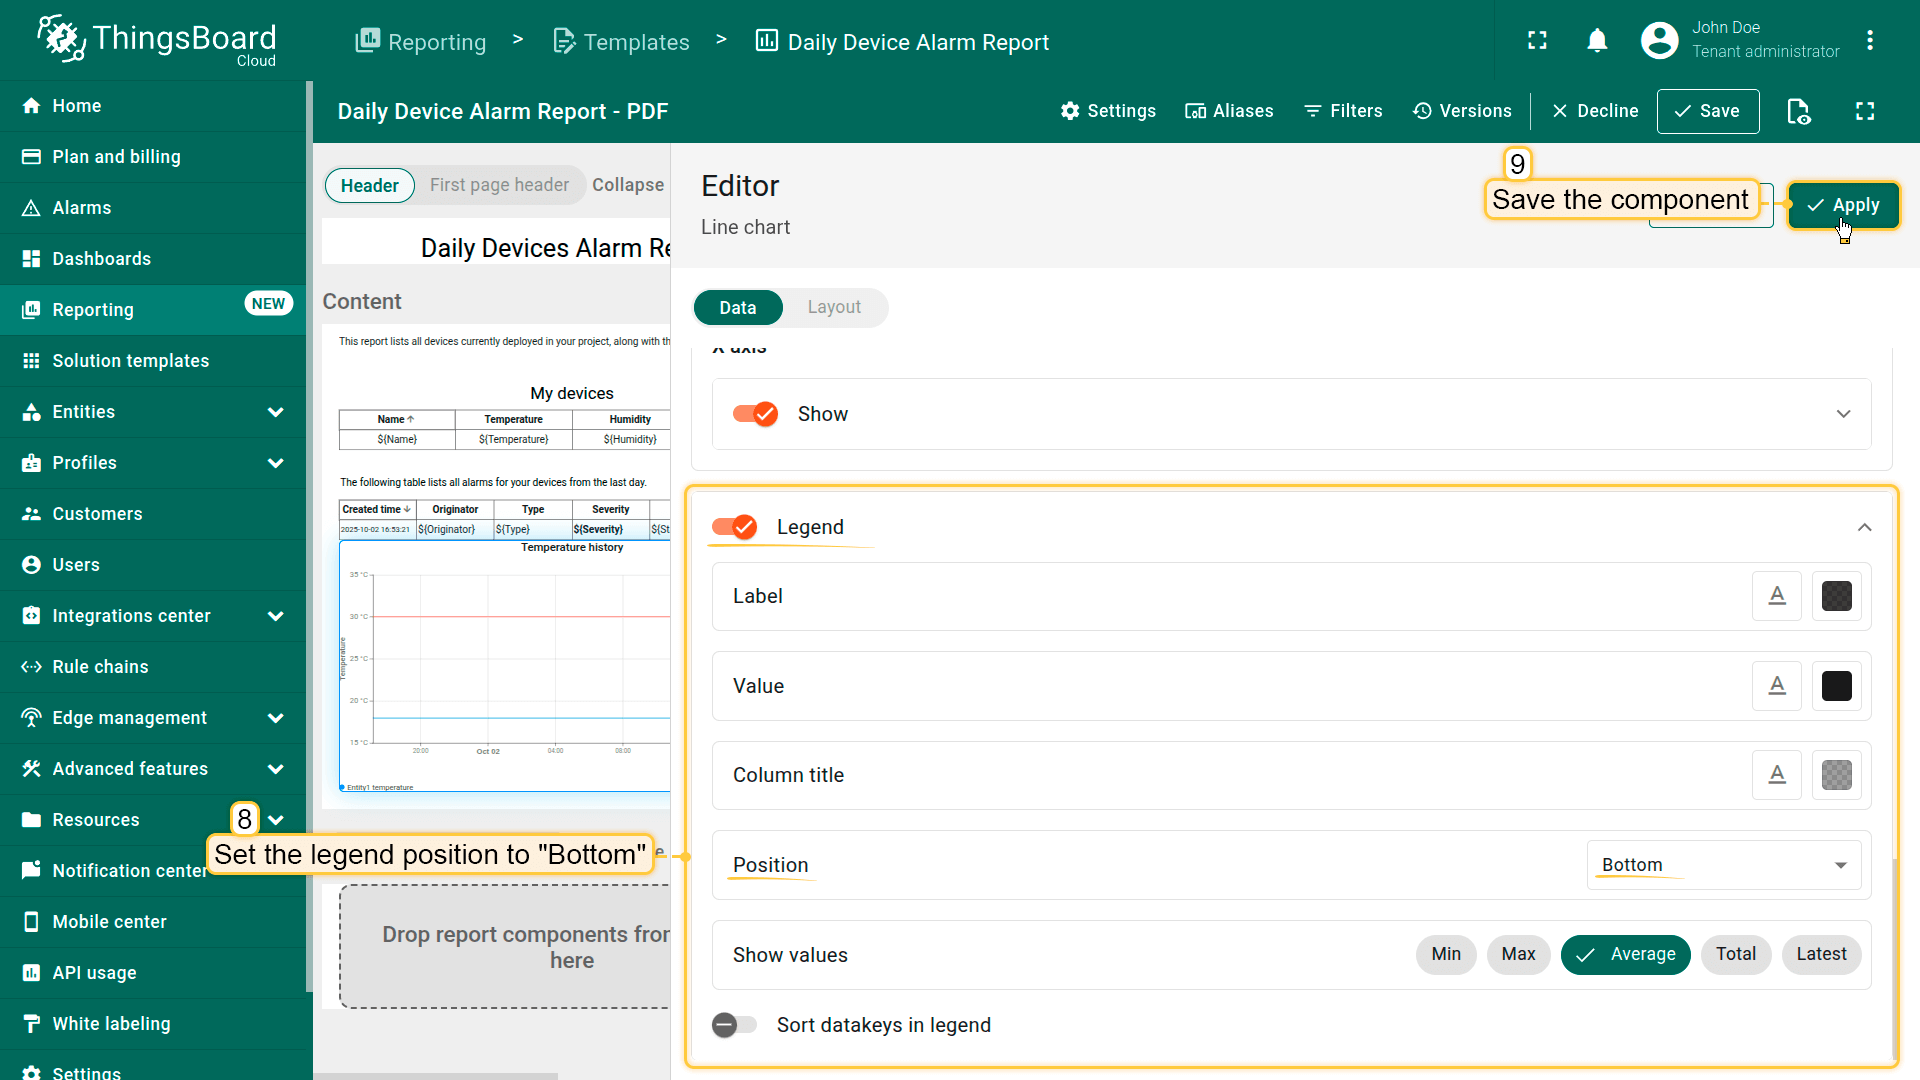
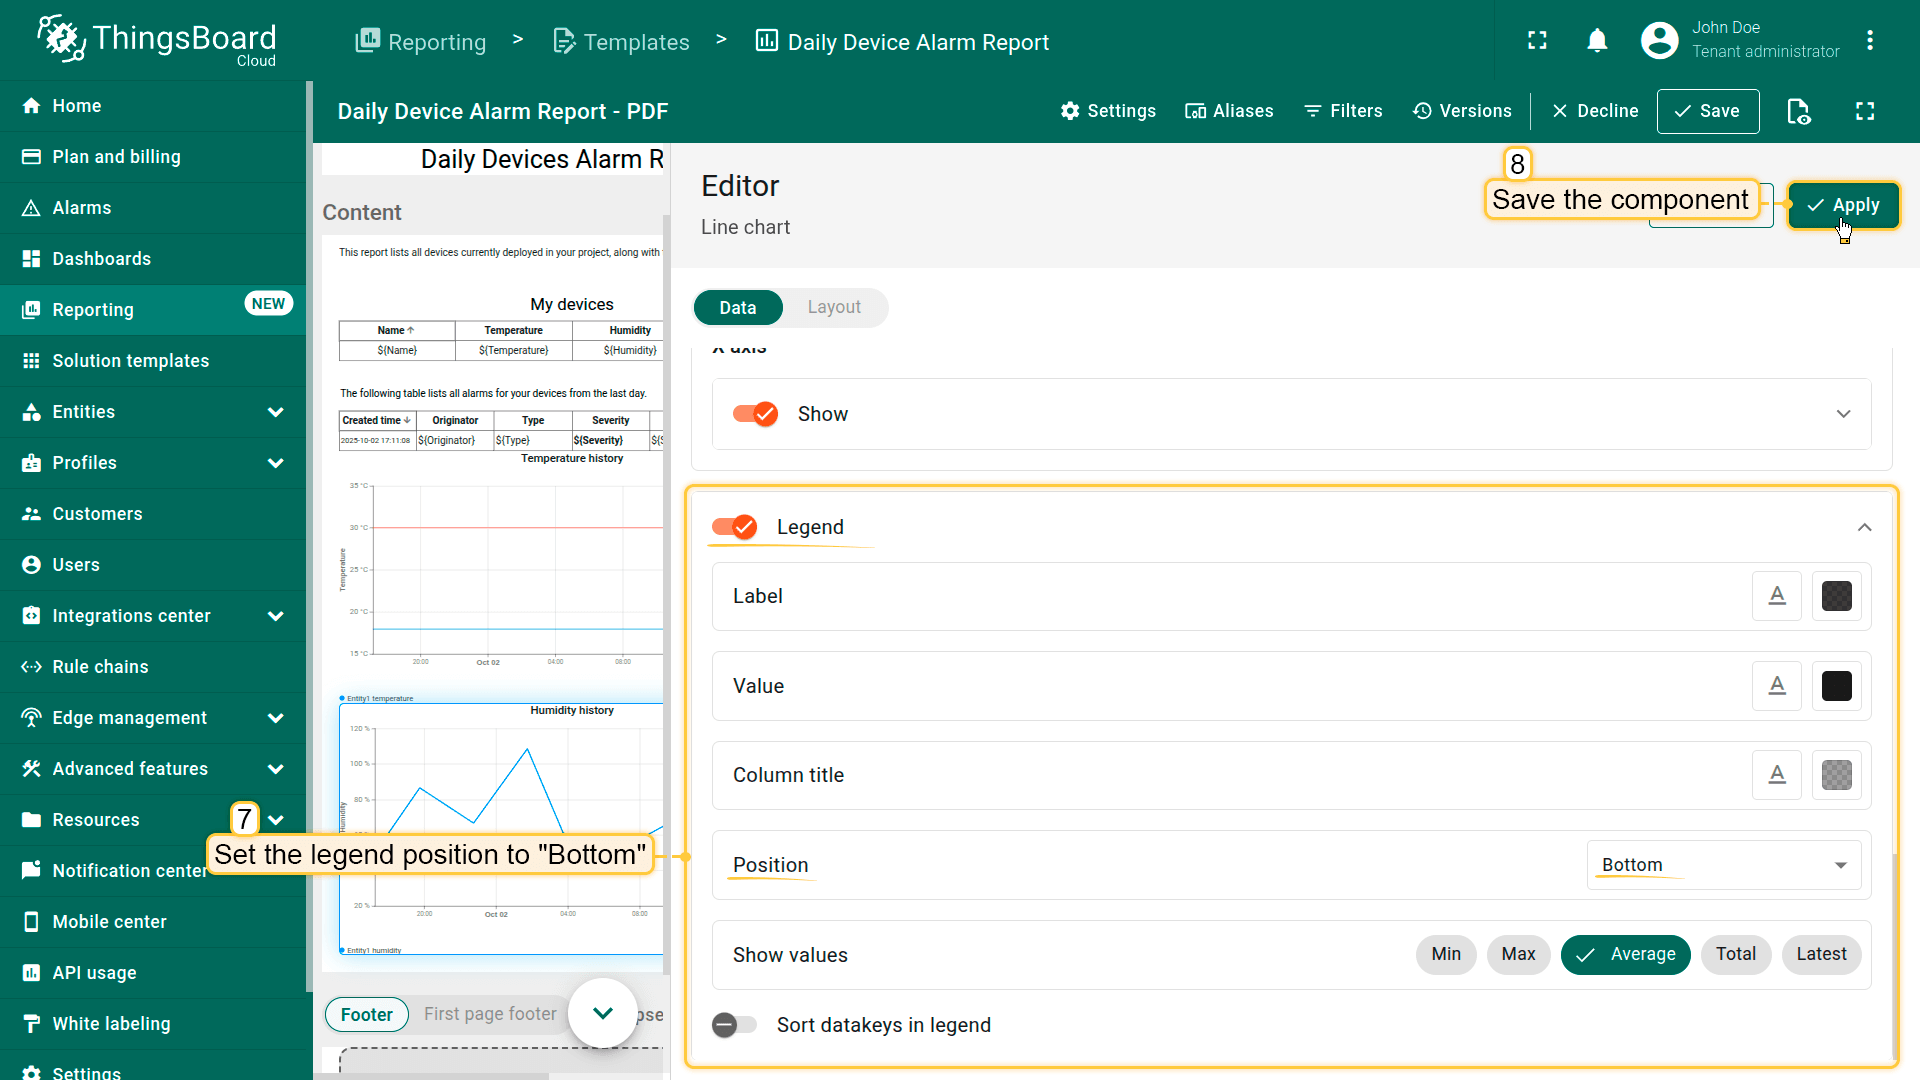
- Set the legend position to Bottom.
- Save the component.
- Configure the Y axes.
- Save the component.
2. Add the second chart – Humidity
- Drag another Line chart component just below the first one.
- Specify the entity alias All devices as the datasource.
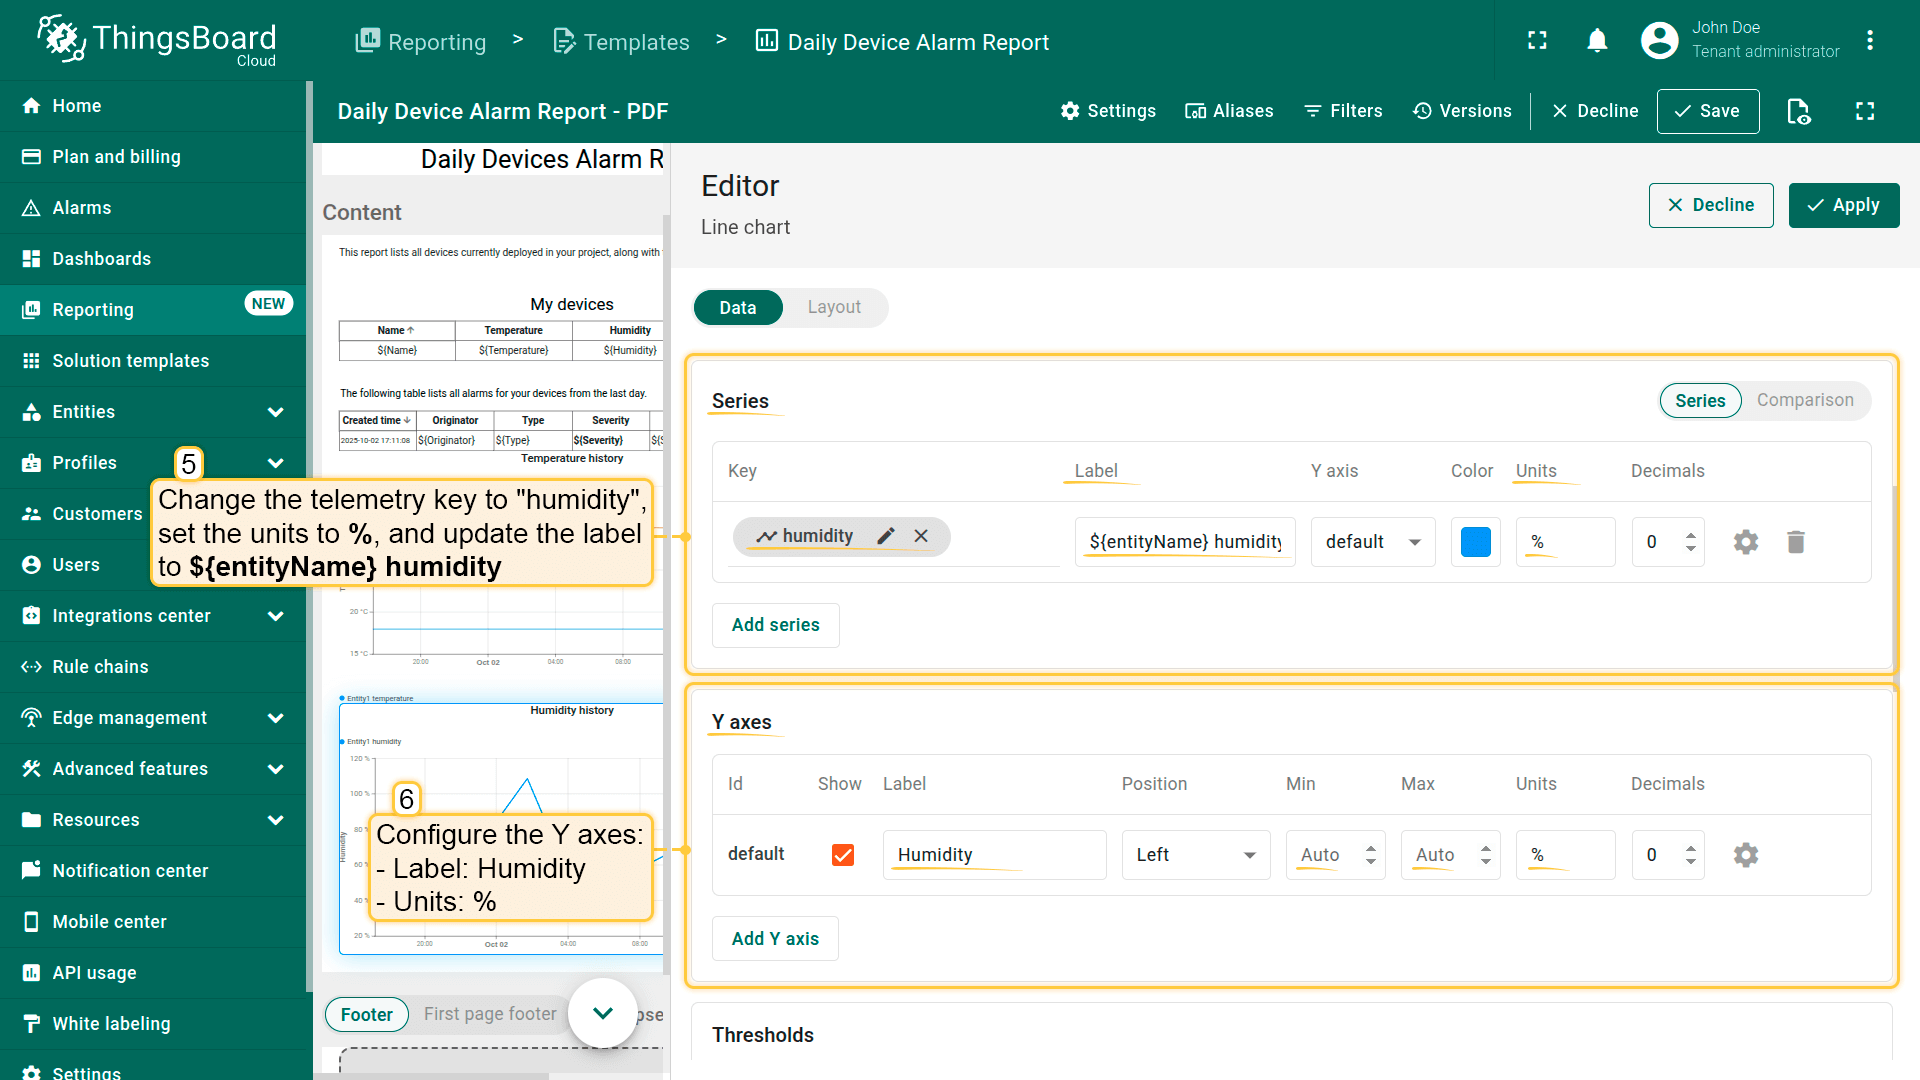
- Set the telemetry key to humidity, units %, and change the label to
1
${entityName} humidity - Configure the Y axes:
- Label: Humidity
- Units: %
- Set the legend position to Bottom.
- Save the component.
- Specify the entity alias All devices as the datasource.
- Configure the Y axes.
- Save the component.
Step 2.6 Save the report template and preview
After adding and configuring all required components in your report template, the final step is to save your work and optionally generate a test report to verify that everything displays correctly.
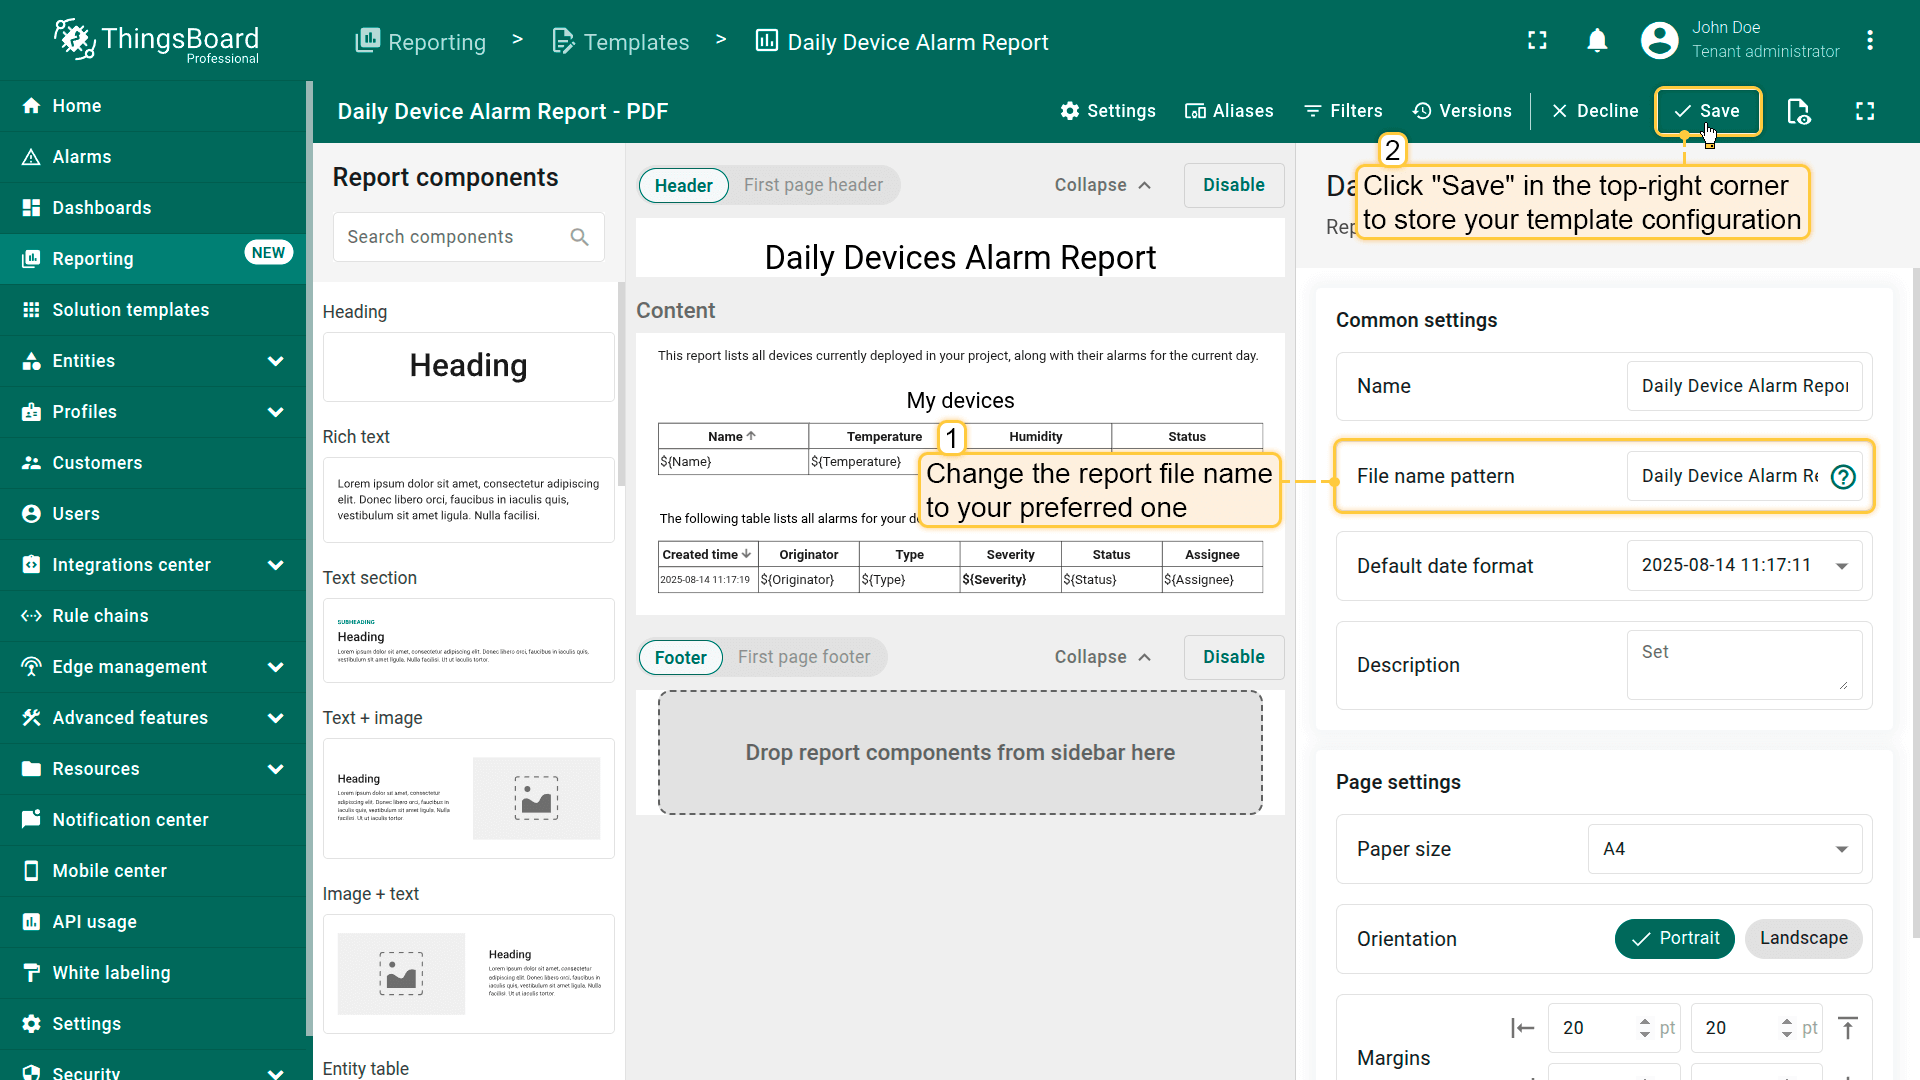
Update the report file name
Before saving the template, update the report file name so that exported files are easy to identify:
- In the File name pattern field enter a clear, descriptive name such as:
1
daily-device-alarm-report-%d{yyyy-MM-dd_HH:mm:ss}
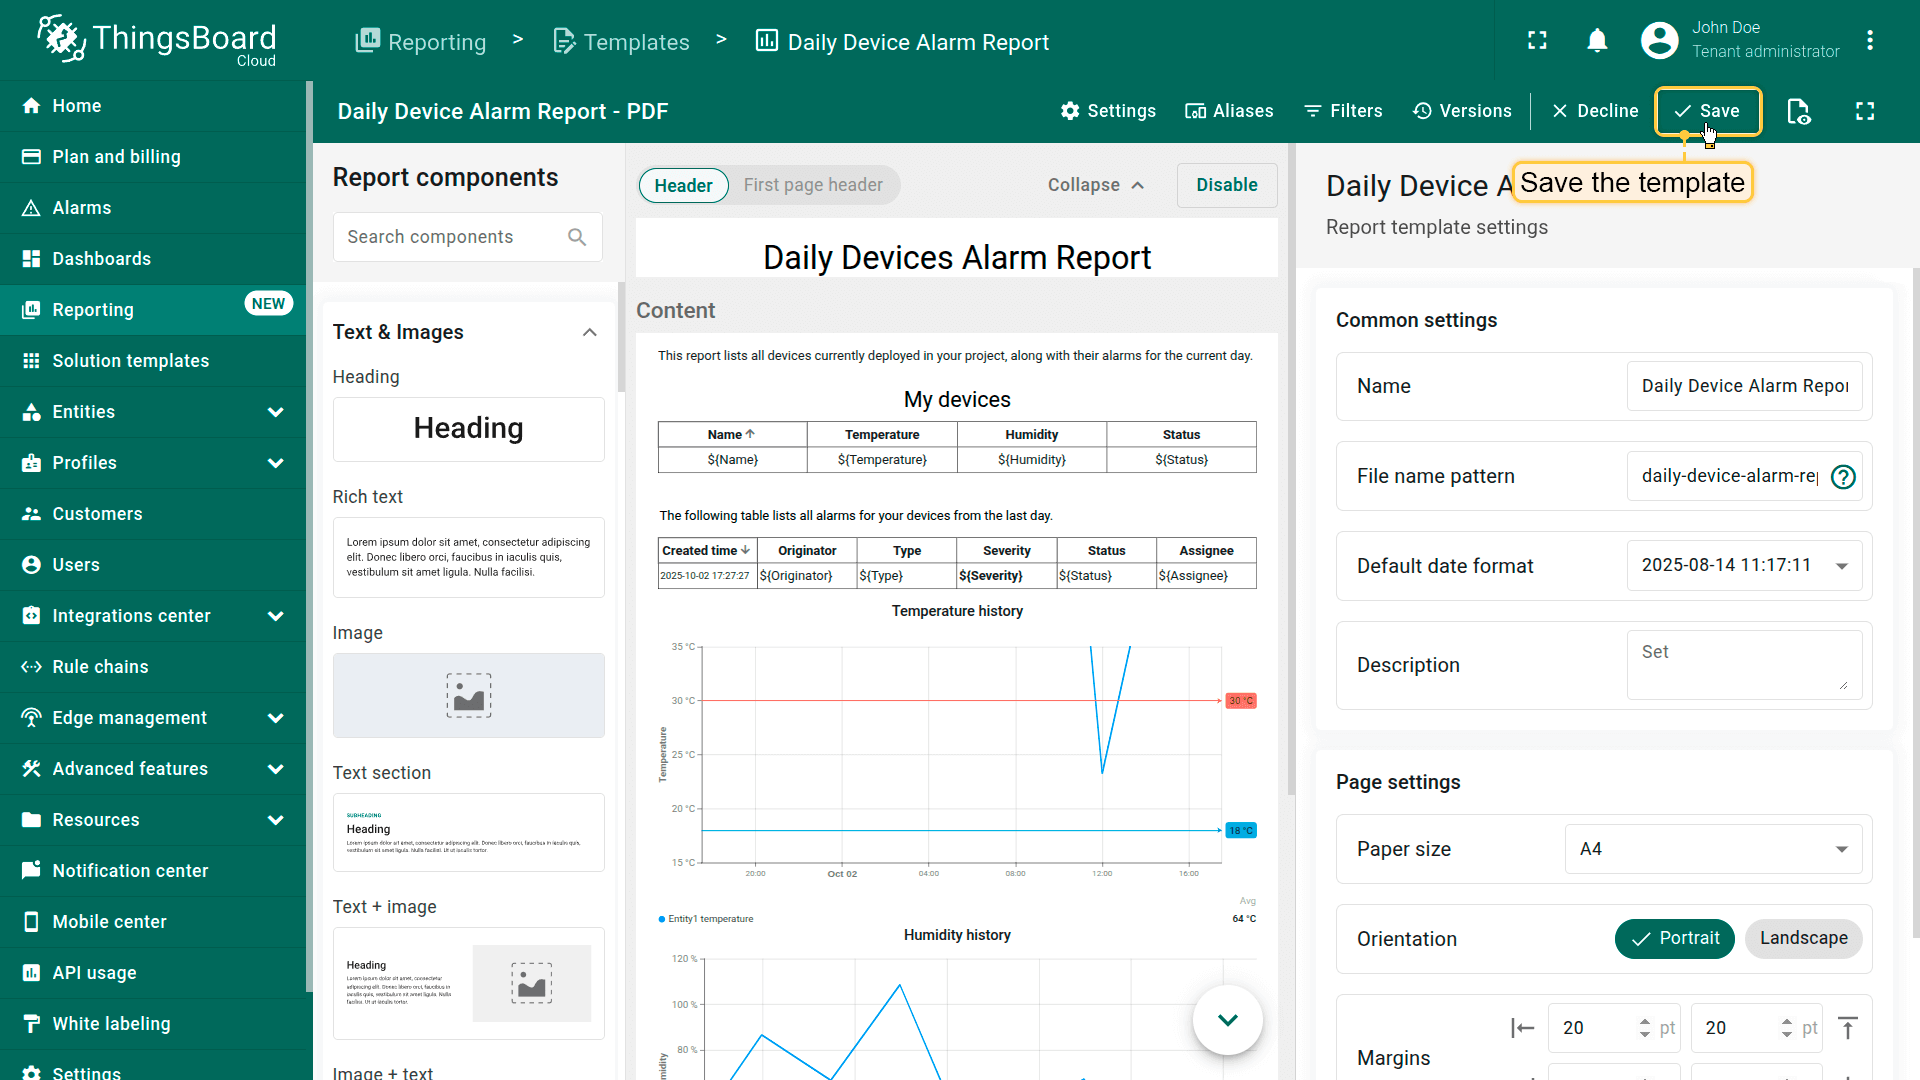
Save your template
To save the current configuration:
- Click the Save button in the top-right corner of the report builder interface.
This stores your layout, components, and settings under the current template for future use in manual or scheduled report generation.
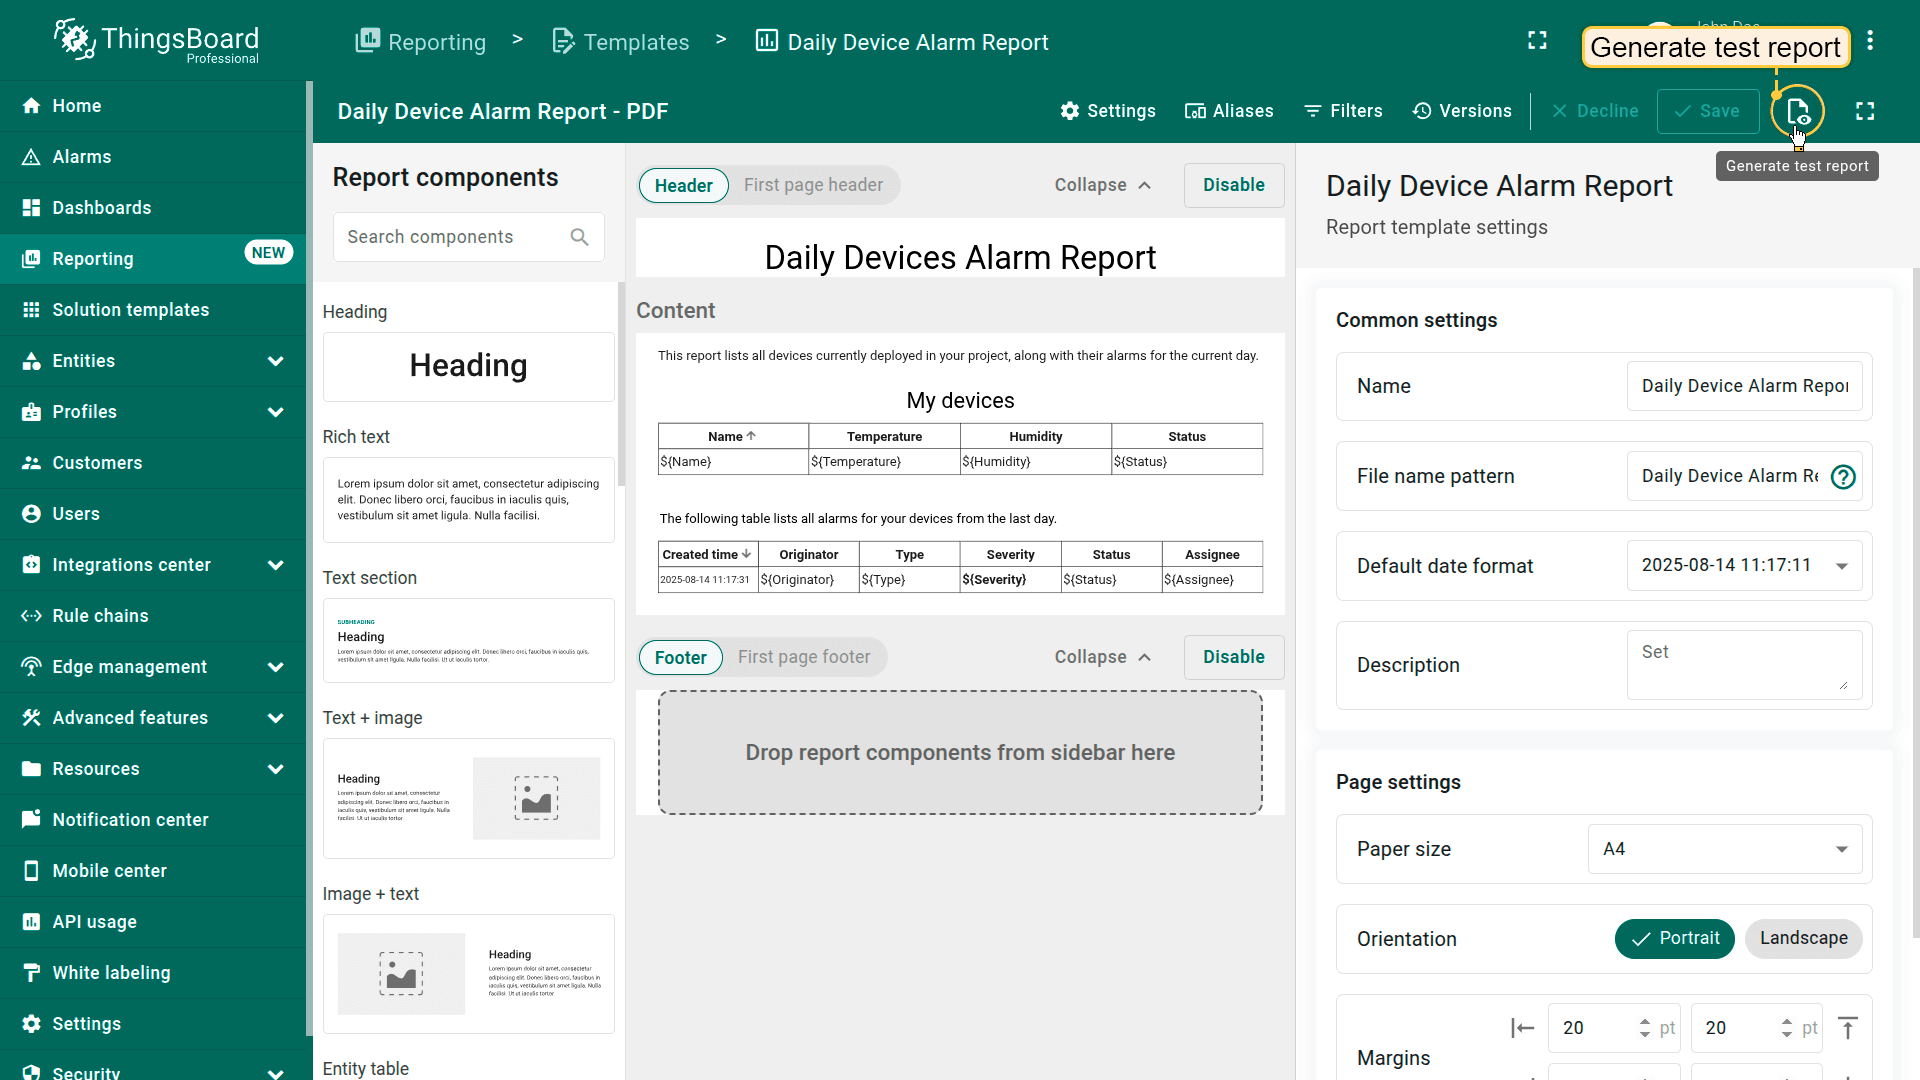
Step 2.7 Generate a test report (Optional)
To make sure your template is set up correctly and data displays as expected, click “Generate test report” (located next to the Save button).
The system will create a sample report using available test data from your selected entity alias.
Step 3: Scheduling the report for customers
Now that the Daily Devices Alarm report template is ready, you can set it up for automatic delivery to your clients using the scheduler feature.
Key points for correct scheduling
To ensure the report is generated correctly and contains accurate data, you must specify:
- Report recipients – the users who will receive the generated report (e.g., managers or clients).
- User account – the account under which the report will be generated. This defines the data scope and permissions applied to the report.
Why this matters
In ThingsBoard, reports are generated according to the access rights of the user account that triggers them.
Example:
- If the report should include only devices owned by Customer A, you must set the User field to the email address of a user belonging to Customer A when scheduling the report.
- Likewise, to schedule a report for Customer B recipients, use the email address of a Customer B user in the User field.
This ensures the report will only display devices and data accessible to that specific user.
Step 3.1 Scheduling a report for Customer A users
First, we'll set up automated delivery of the report for all Customer A users. The report will be generated on behalf of Jane Smith, the administrator for this customer.
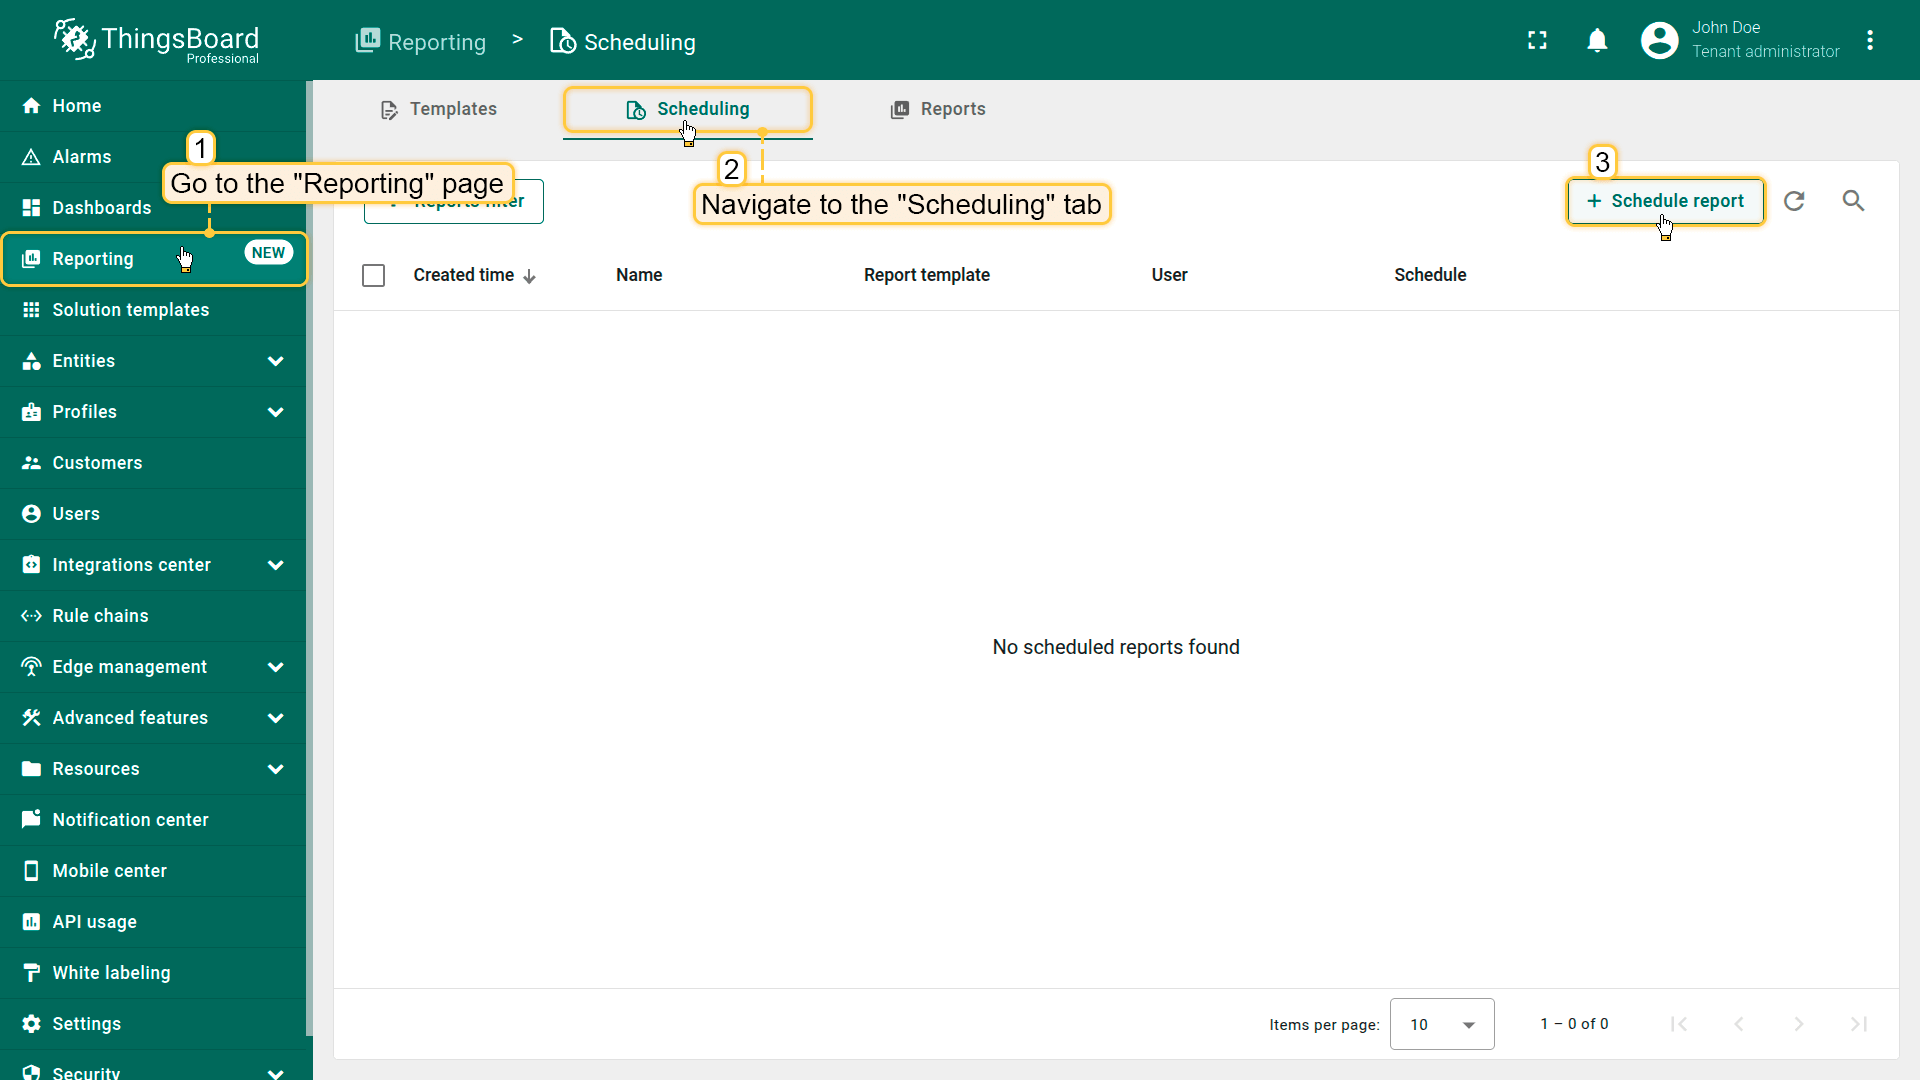
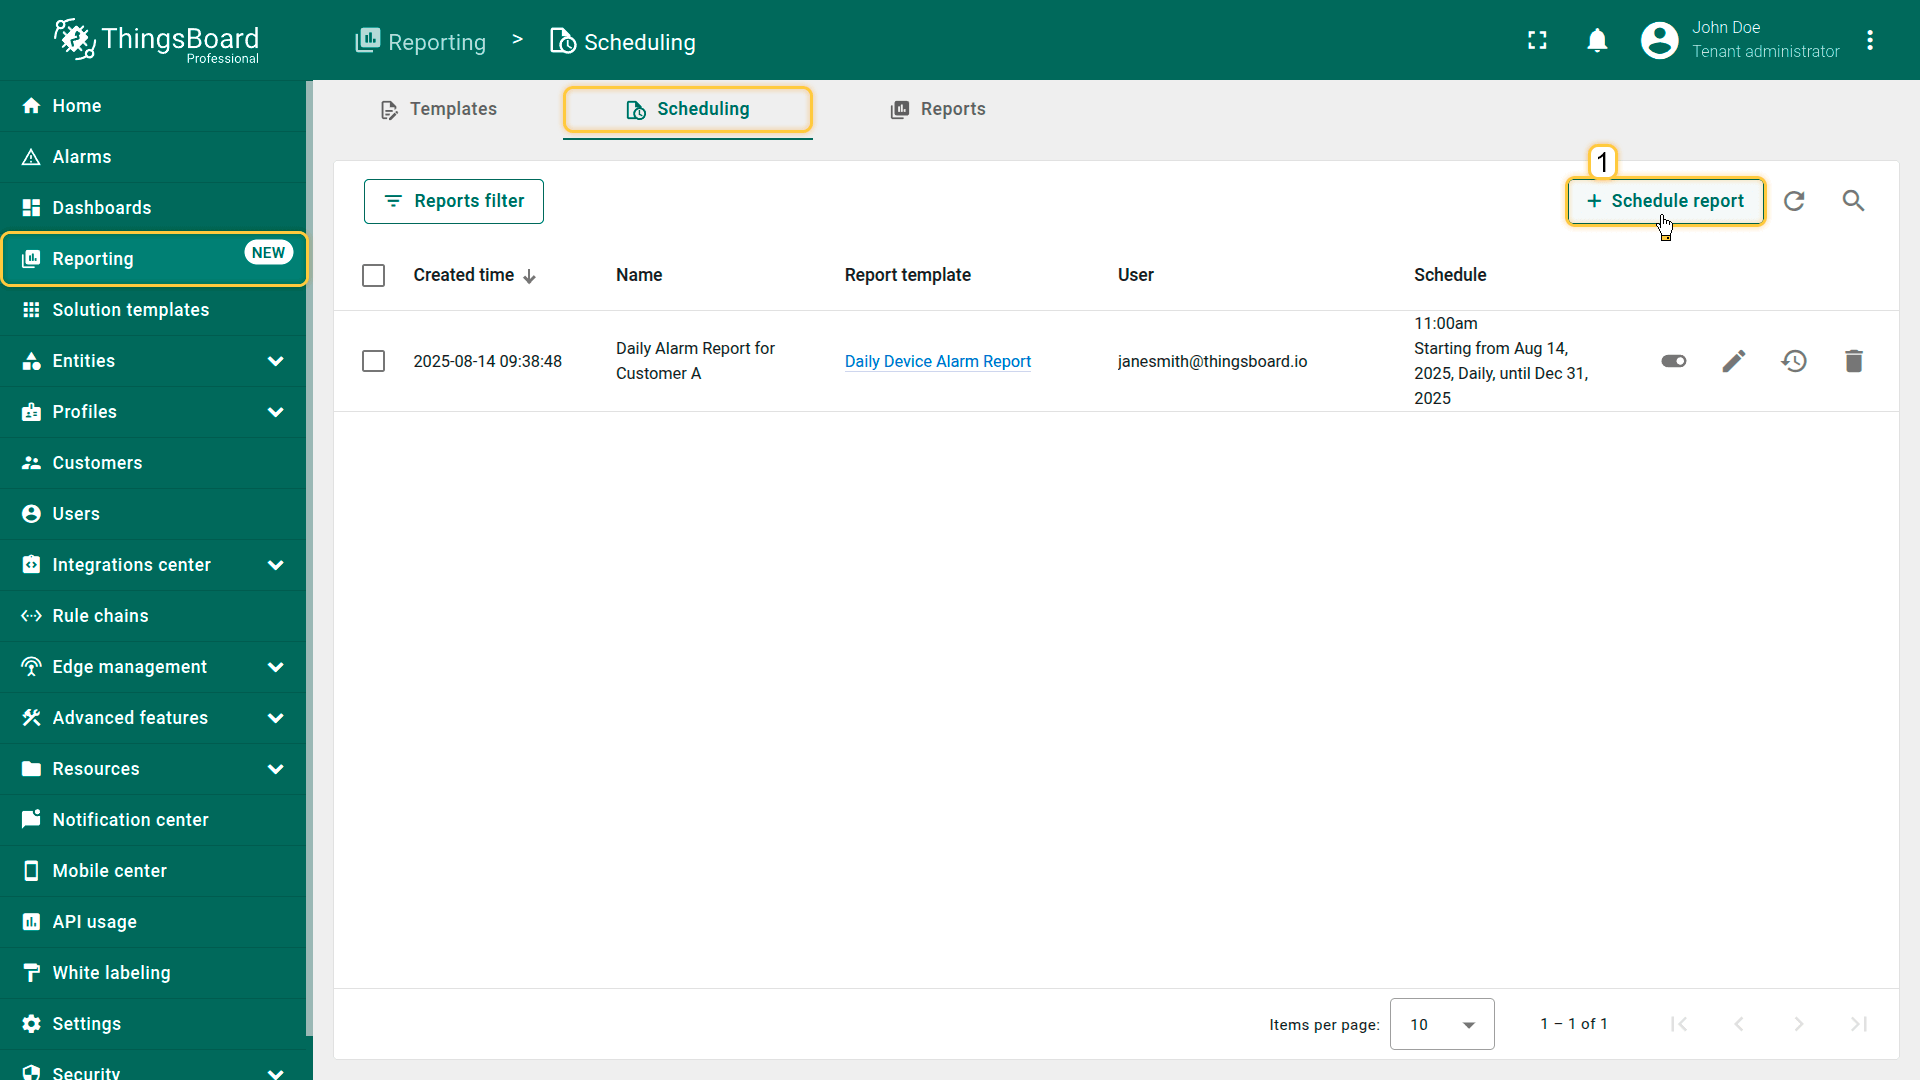
- Go to the “Scheduling” tab on the “Reporting” page.
- Сlick the “+ Scheduled Report” in the top-right corner to create a new scheduler event.
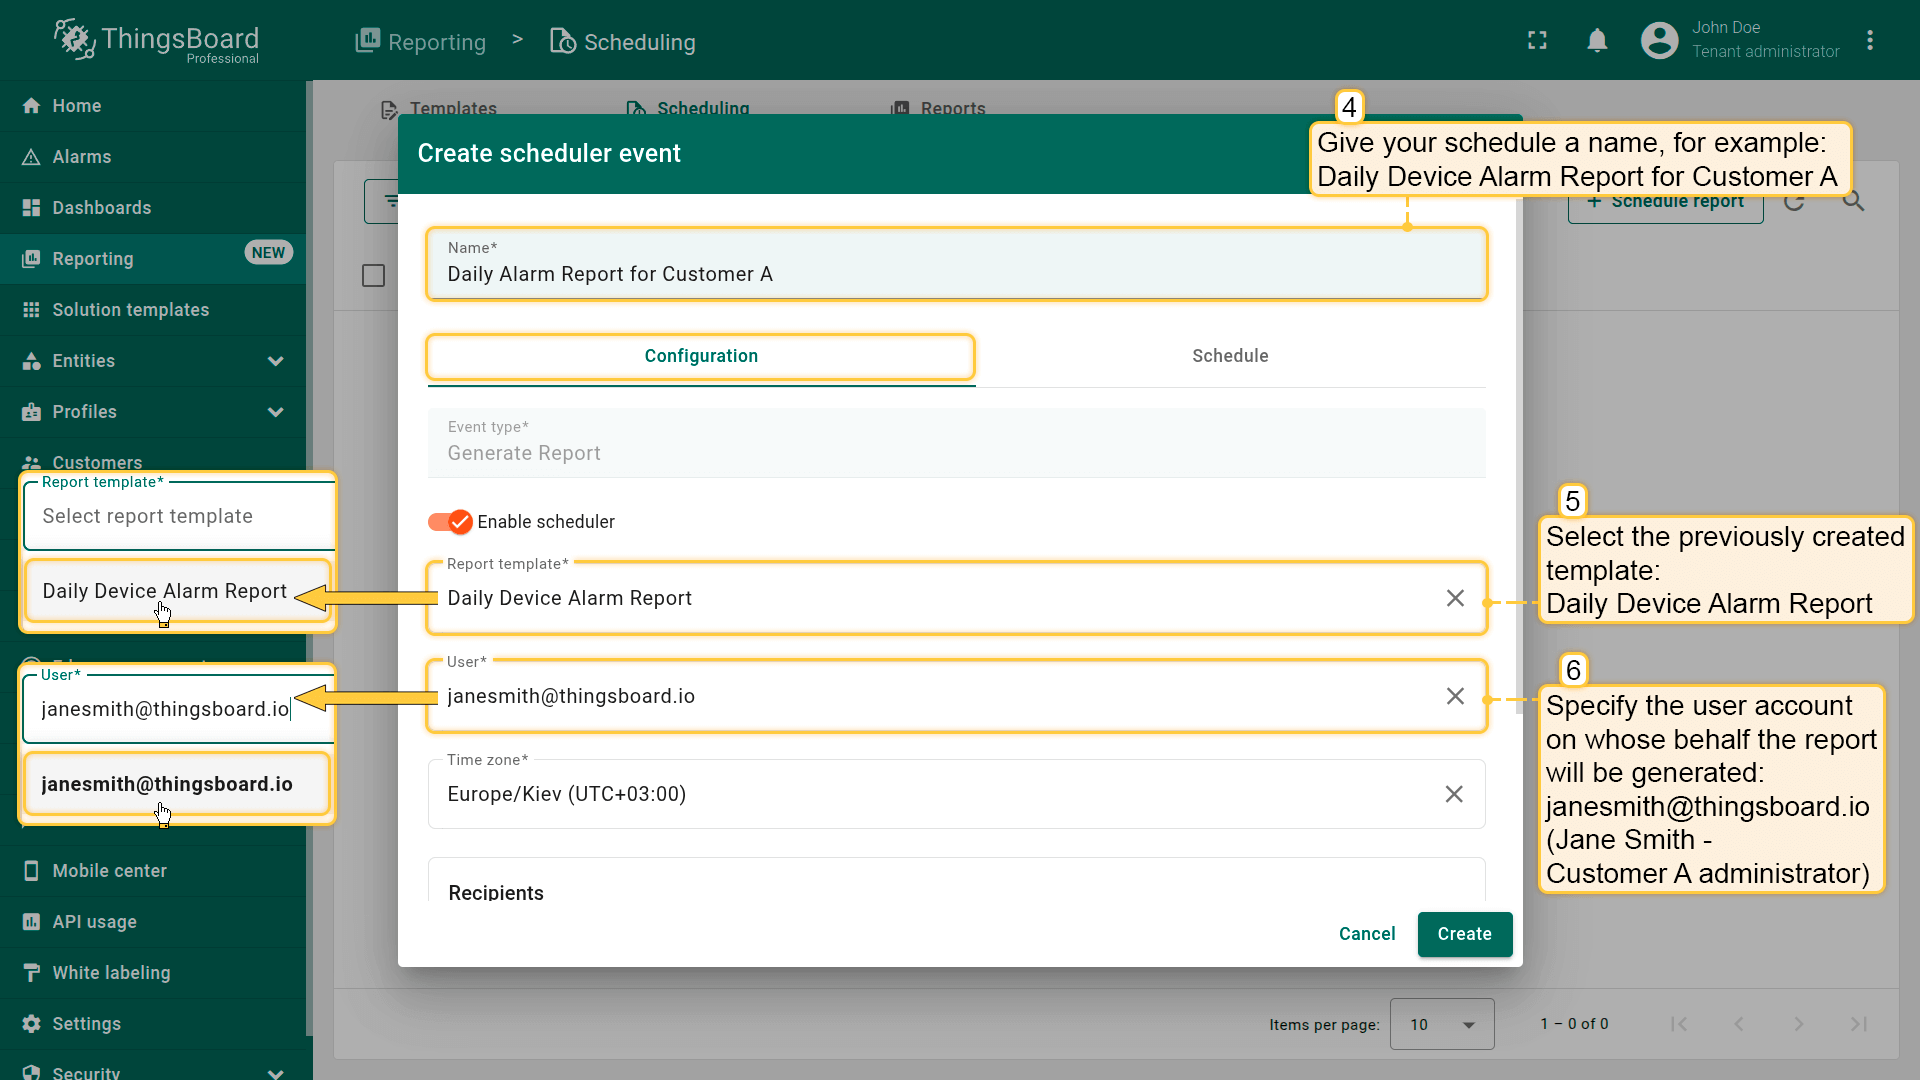
- In the scheduling dialog, provide the following details:
- Give your schedule event a clear title, for example:
1
Daily Devices Alarm Report for Customer A
- Event type – always set to Create report.
- Report template – select the previously created Daily Devices Alarm Report template.
- User – specify the user account on whose behalf the report will be generated: [email protected] (Jane Smith — Customer A administrator).
- Give your schedule event a clear title, for example:
. – Select the previously created Daily Devices Alarm Report template.
– Specify the user account on whose behalf the report will be generated: [email protected] (Jane Smith — Customer A administrator).
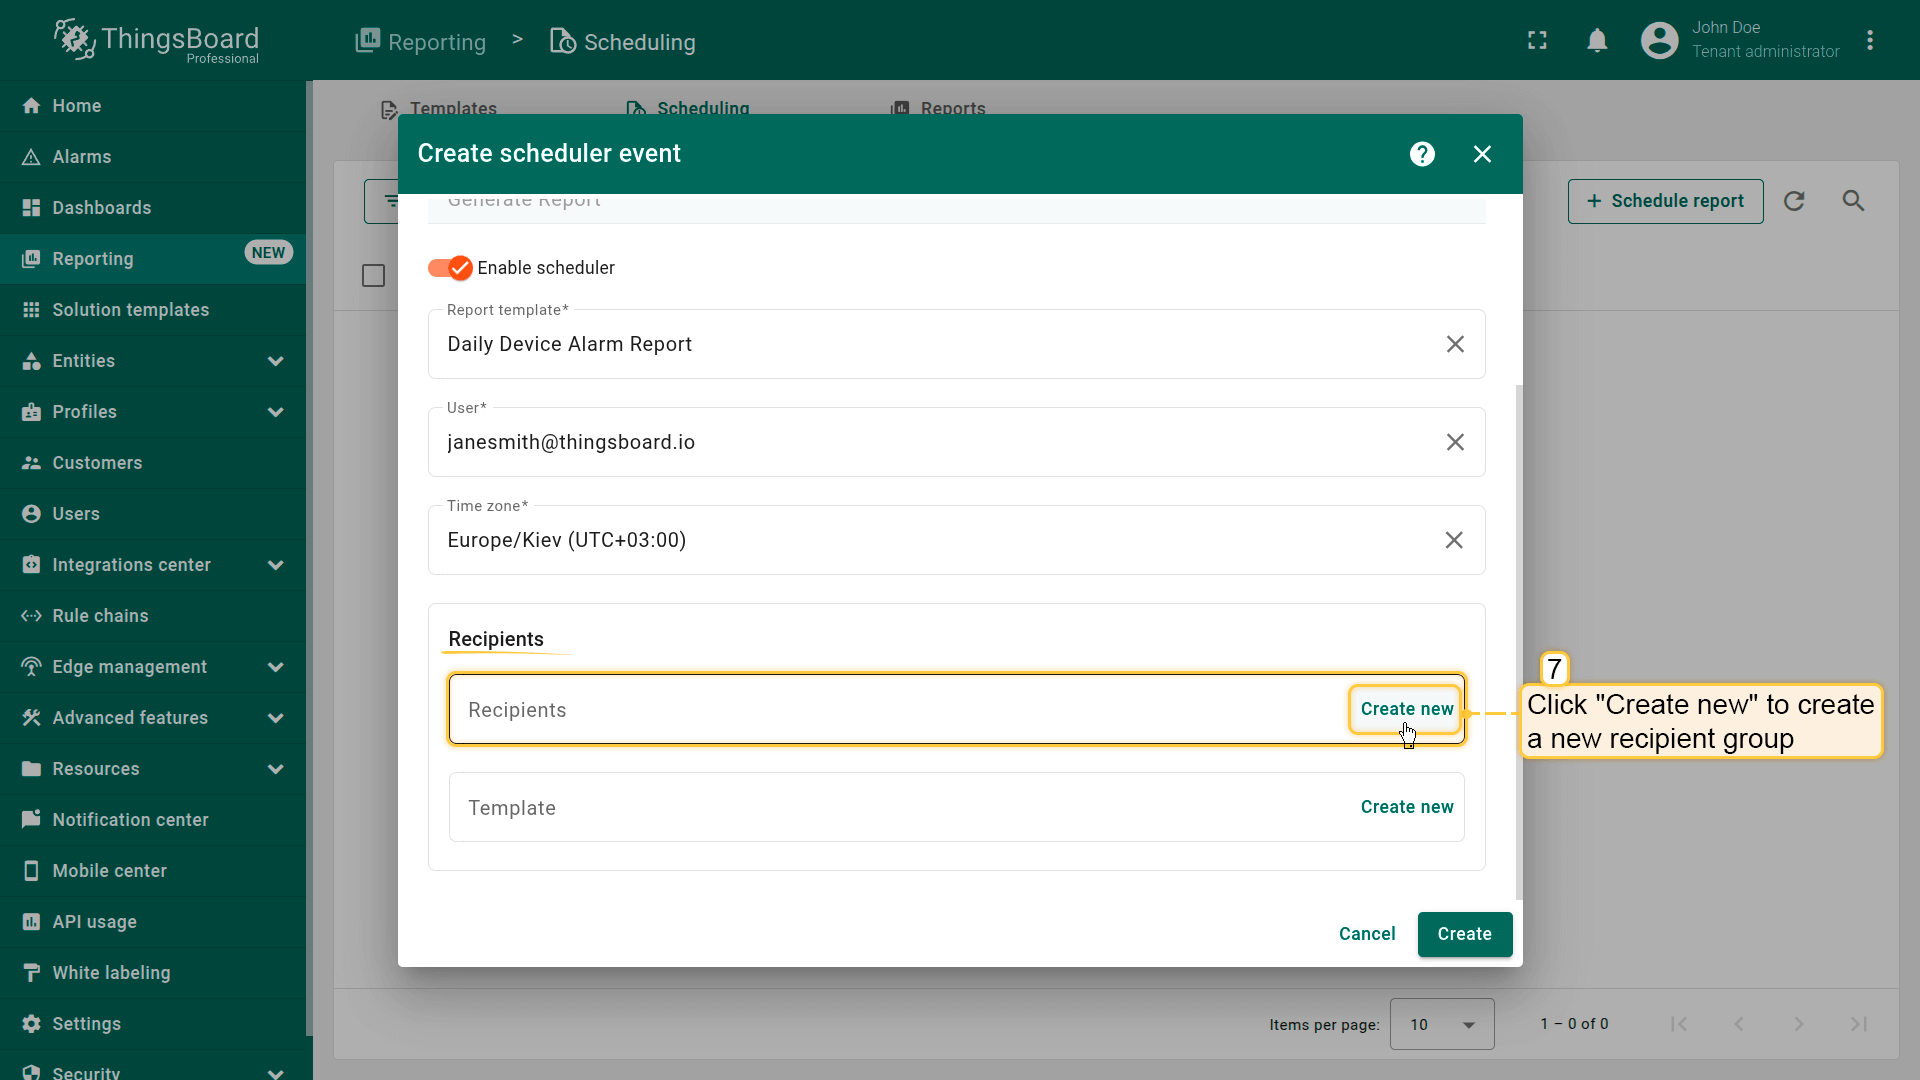
- Set the recipients:
- In the “Recipients” field, click Create new to create a new recipient group.
- Enter a name for the notification recipient group.
- Select Customer users filter.
- Set Customer to Customer A.
- Click “Add”.
- In the “Recipients” field, click Create new to create a new recipient group.
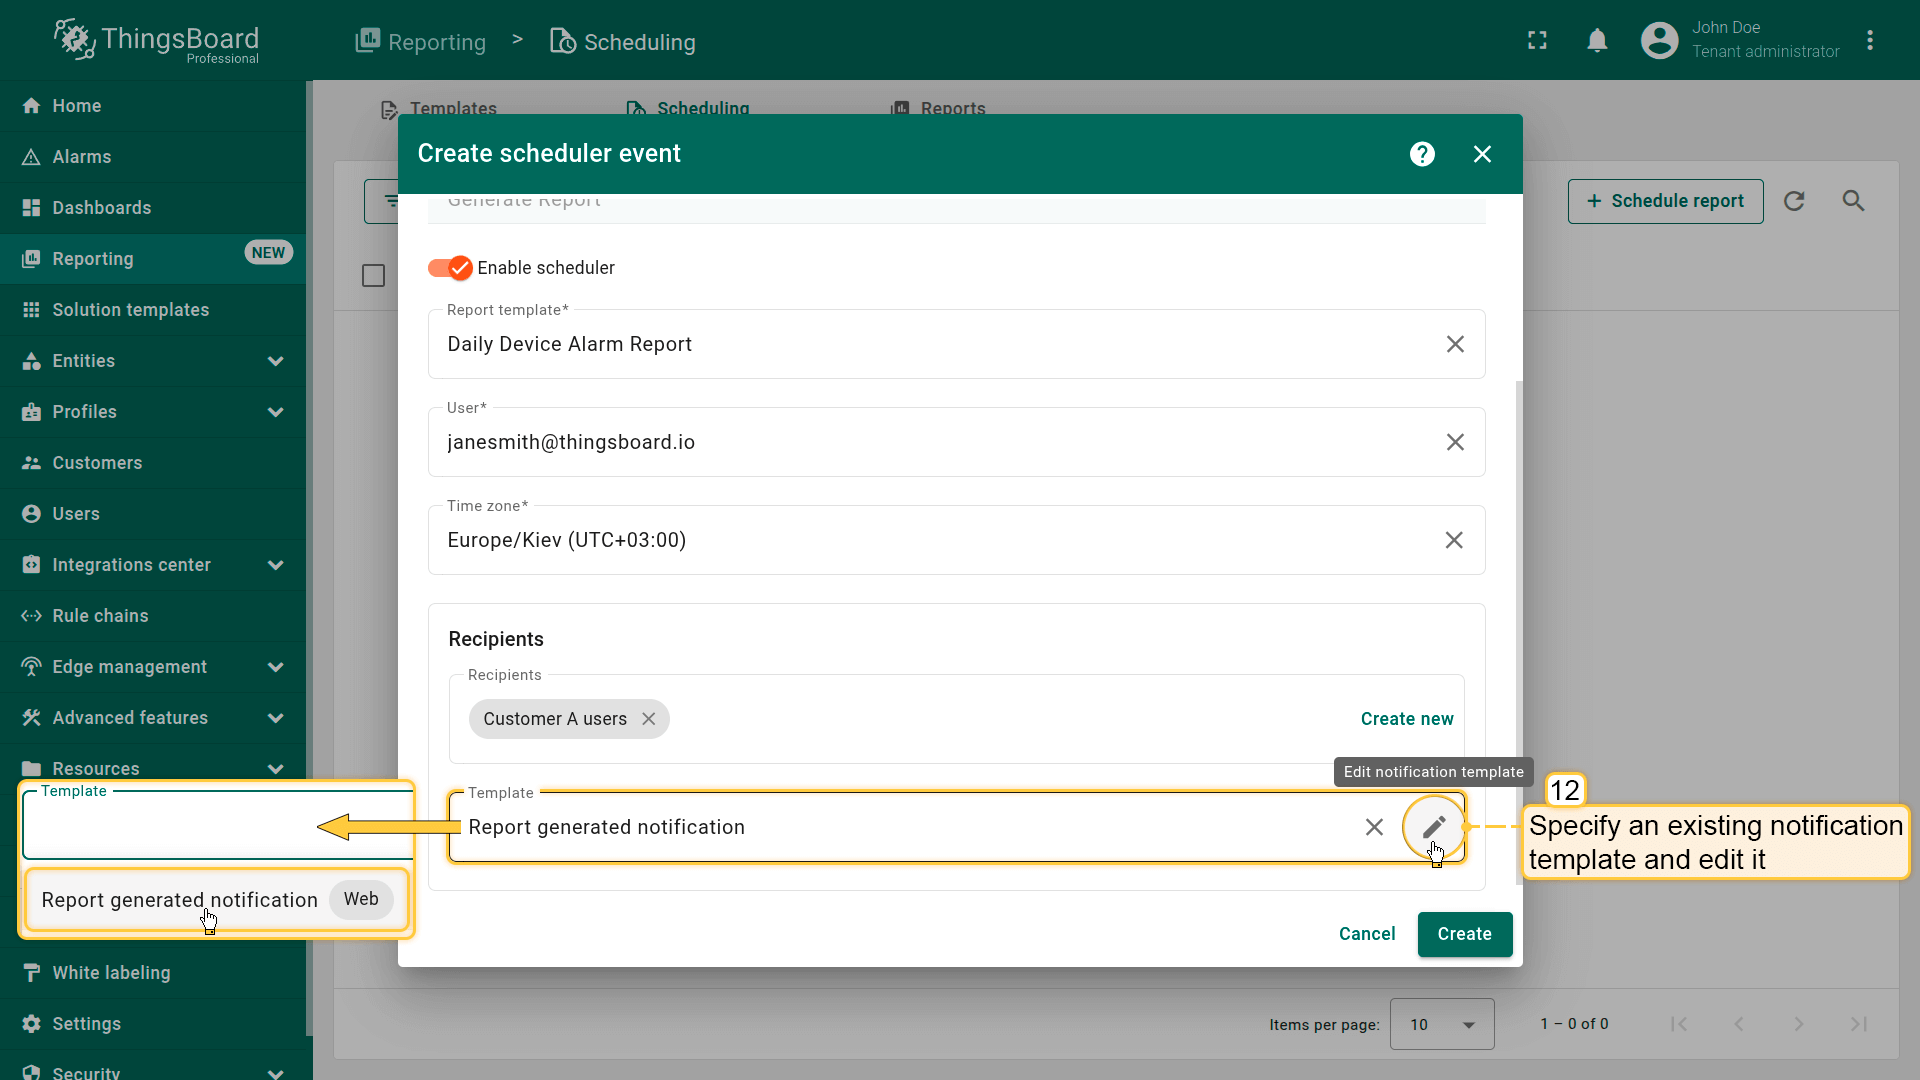
- Notification template & delivery methods:
- Select an existing notification template (defines how the report will be delivered) and edit it.
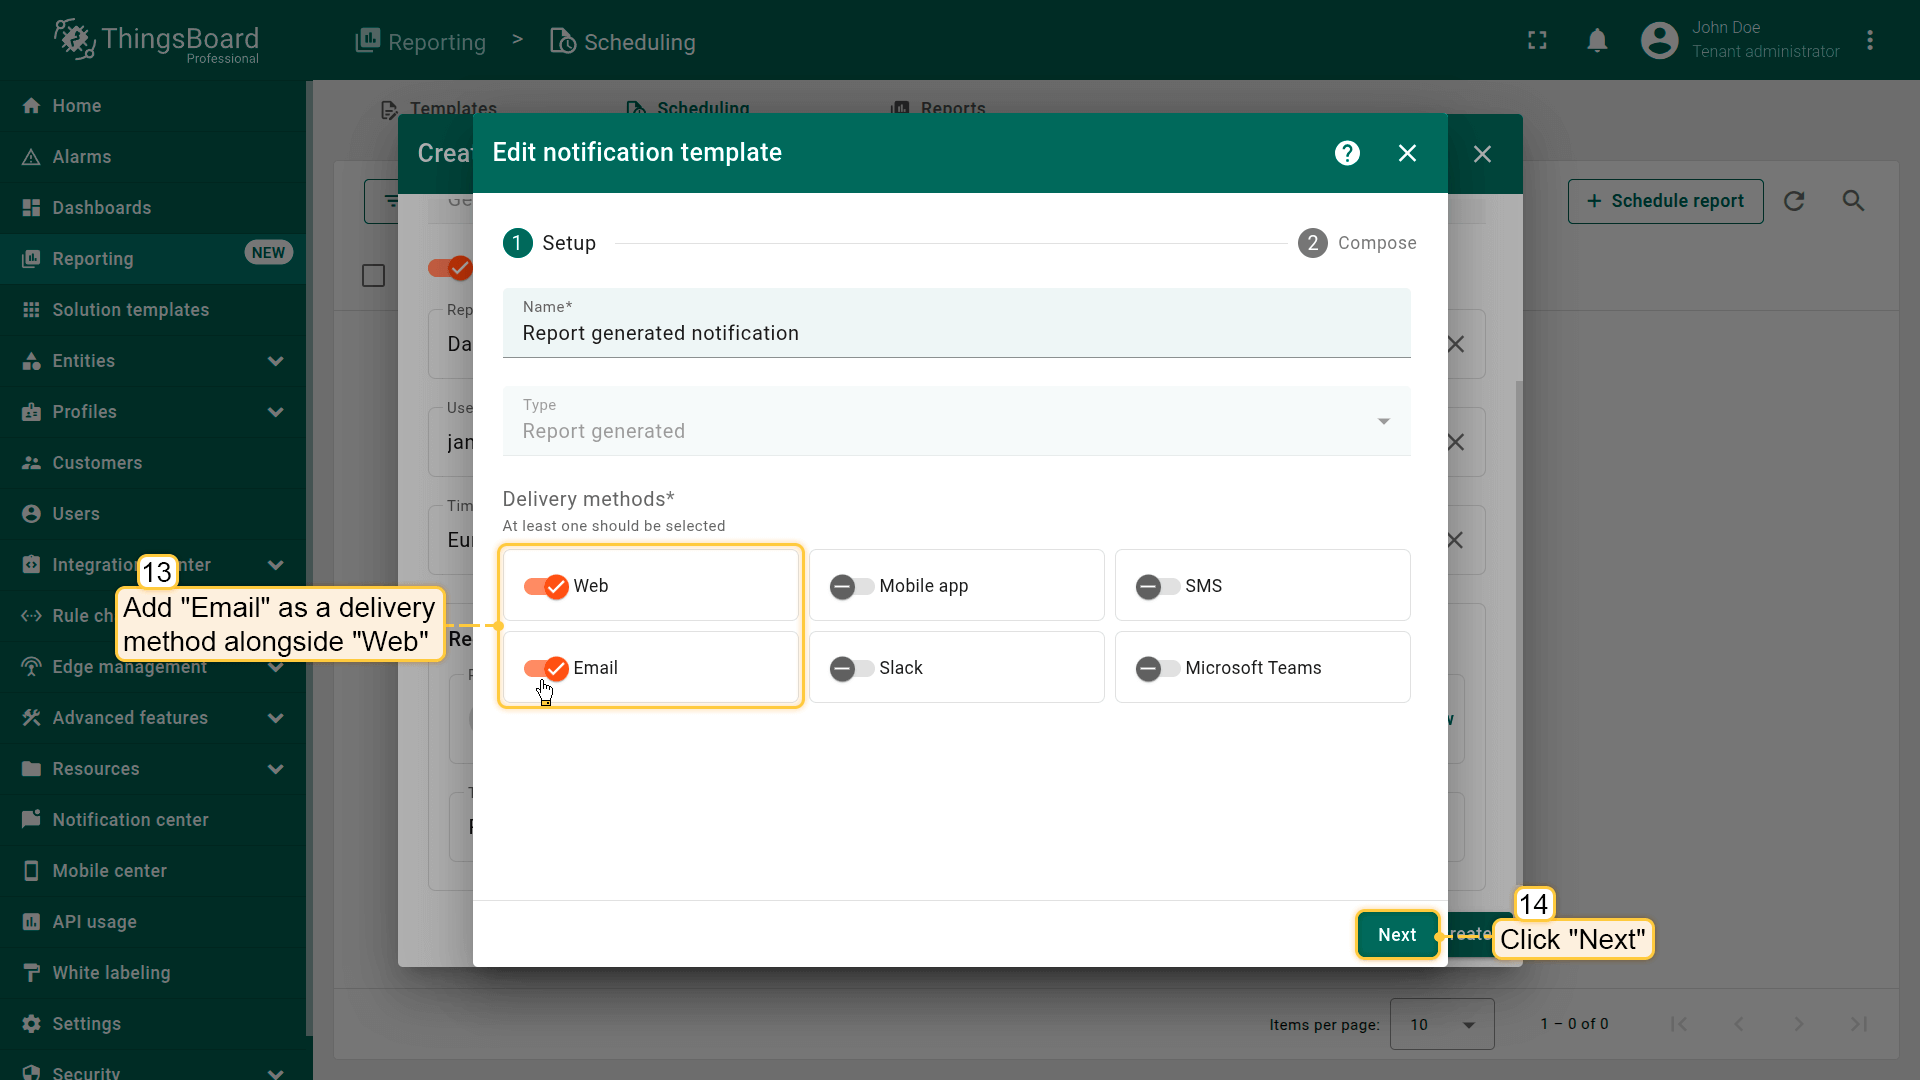
- Add Email as a delivery method alongside Web. Click “Next”.
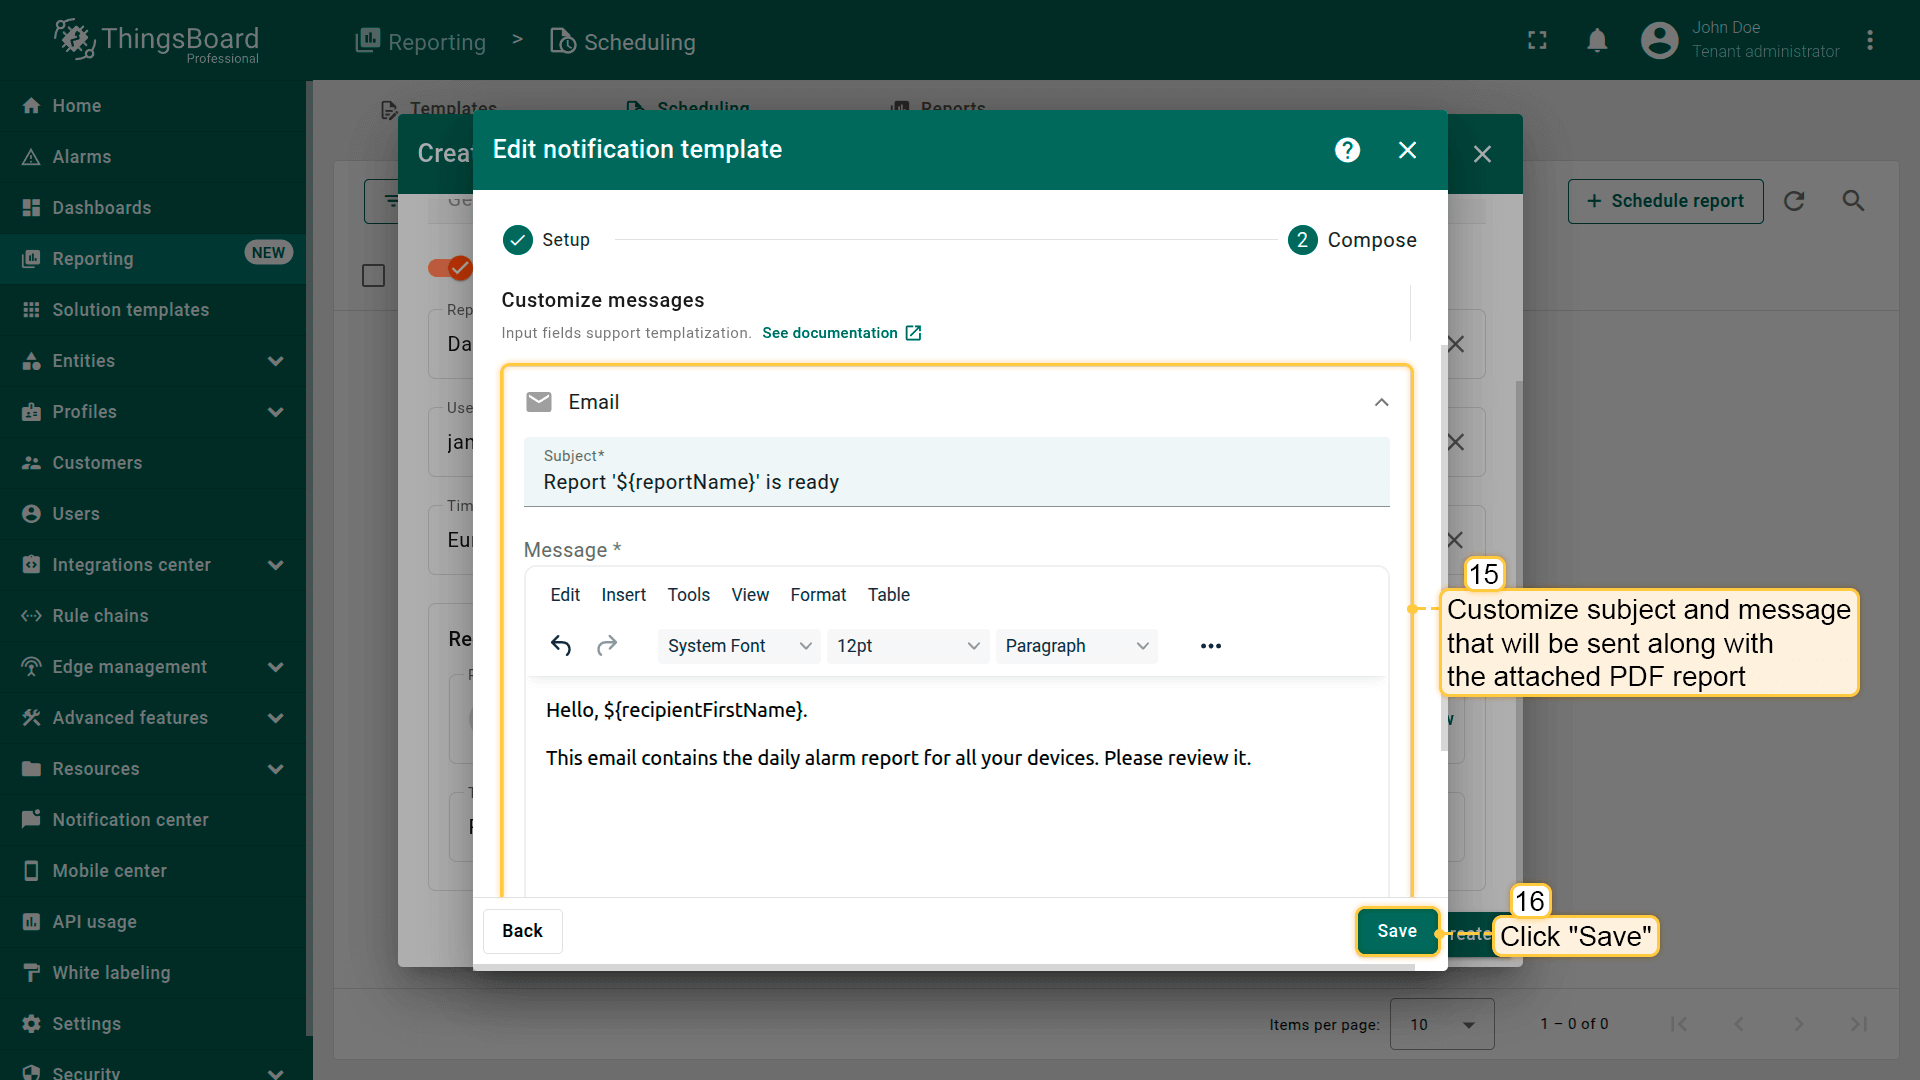
- Add the subject and body text for the email notification to which the PDF report will be attached. Click “Save”.

- Select Customer users filter.
- Set Customer to Customer A.
- Click "Add".
Set up the schedule
- Go to the Schedule tab.
- Start time – set the date and time of the first run.
- Time zone – choose the applicable time zone.
- Enable Repeat:
- Interval – select Daily.
- End date – set an end date or leave blank for ongoing delivery.
- Finally, click “Create” to save and apply the scheduler event.
Now, every day at the scheduled time, all Customer A users will automatically receive a report with the latest information about their device alarms.


Step 3.2. Scheduling a report for Customer B users
Now let's create another schedule event to send the report to Customer B's users. This report will be generated on behalf of Emma Johnson — the administrator of this customer.
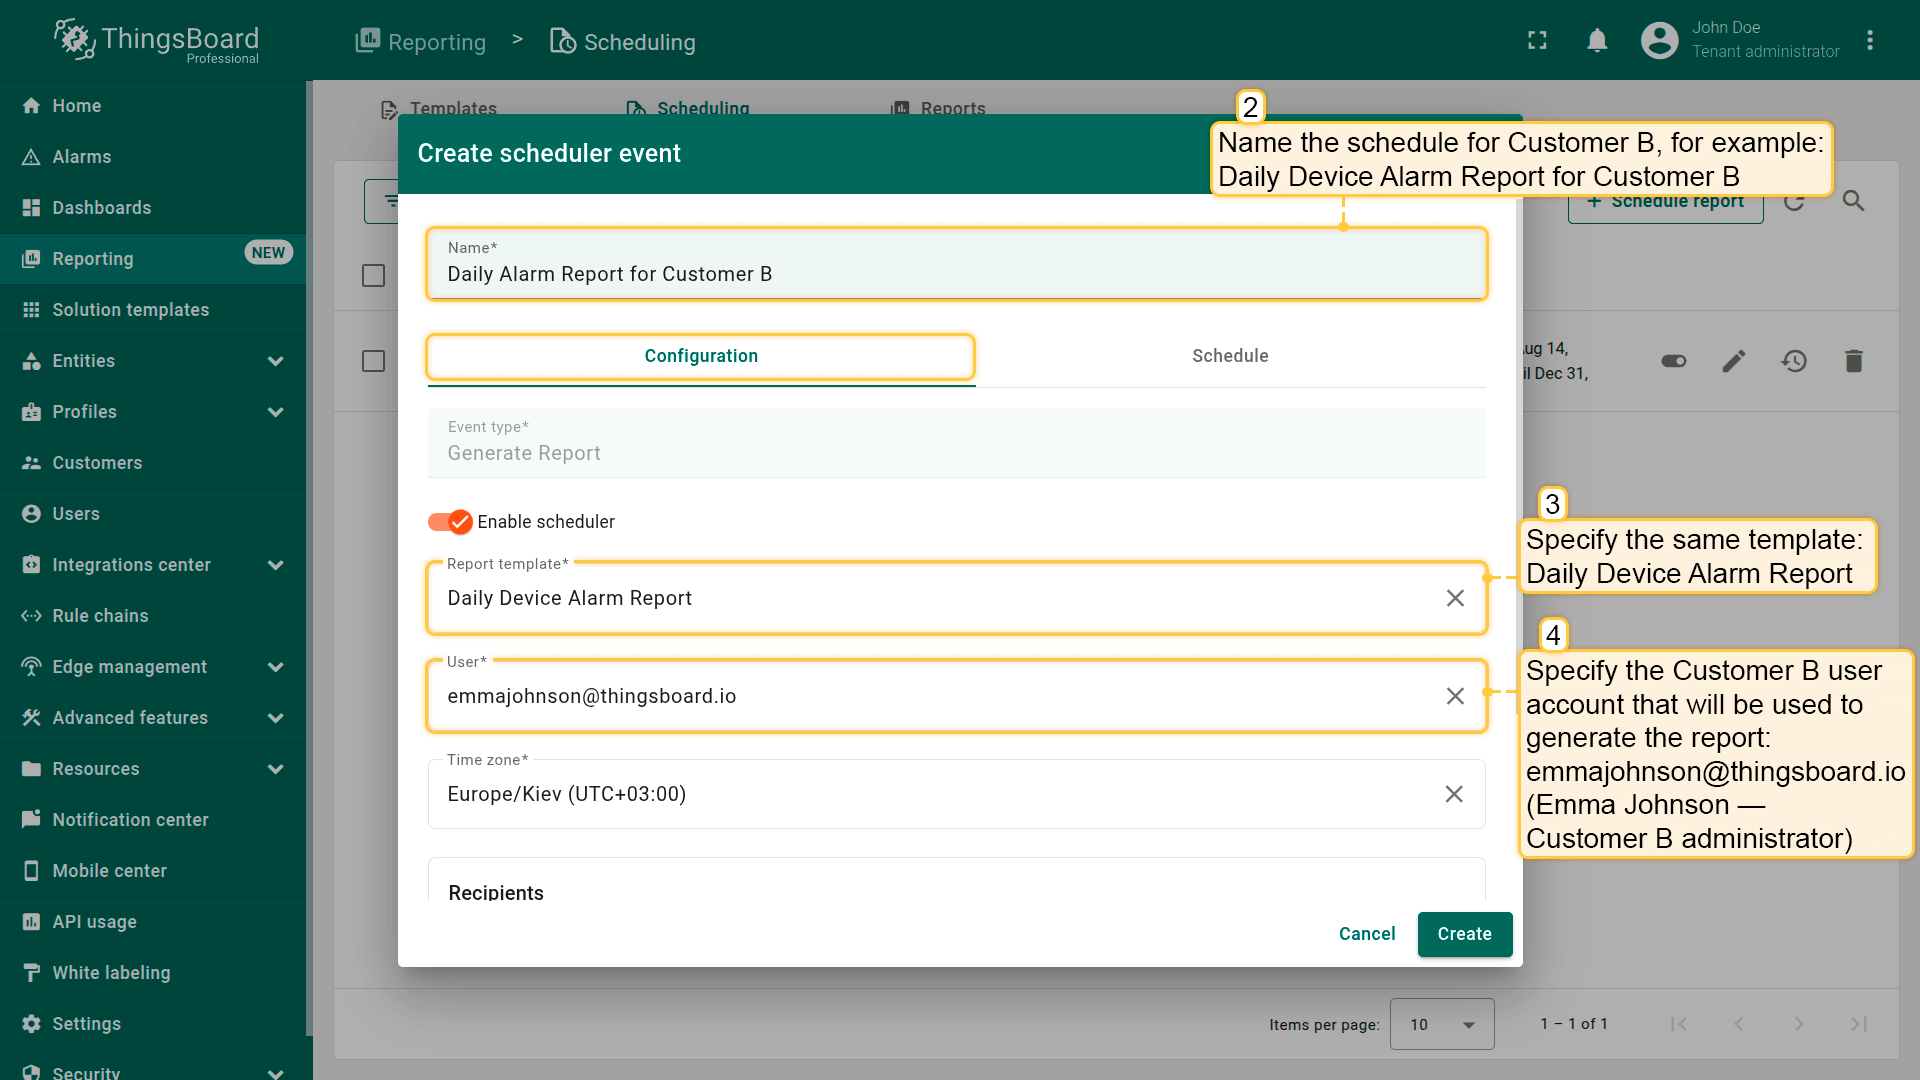
- Click “+ Scheduled report” in the top right corner of the “Template” page to create a new scheduler event.
- Give your schedule a descriptive name, for example:
1
Daily Device Alarm Report for Customer B
- Select the same template used for Customer A — Daily Device Alarm Report.
- Set the user account to [email protected] (Emma Johnson – Customer B Administrator).
The report will be generated on behalf of this user, containing only the data accessible to Customer B.
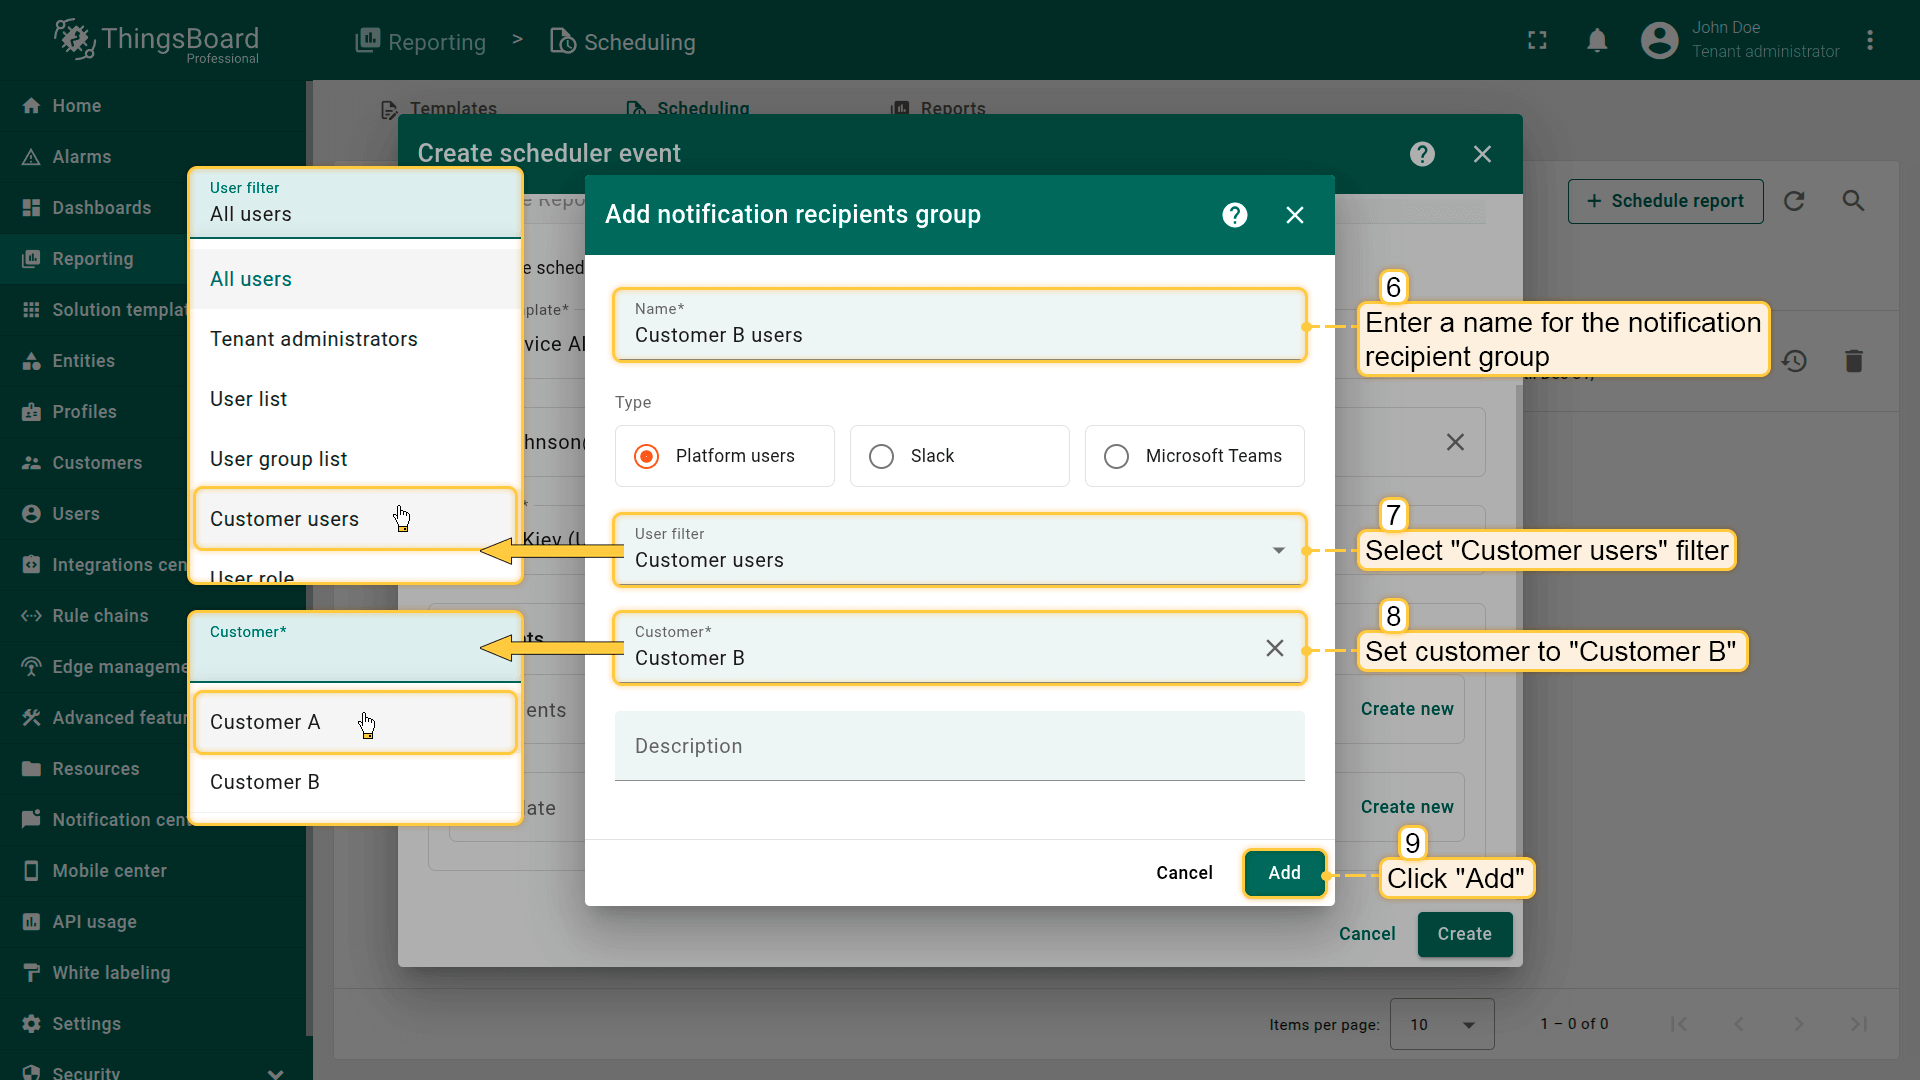
- In the “Recipients” field, click “Create new” to create a new recipient group.
- Name: Enter a group name.
- Filter: Select Customer users.
- Customer: Set to Customer B.
- Click “Add”.
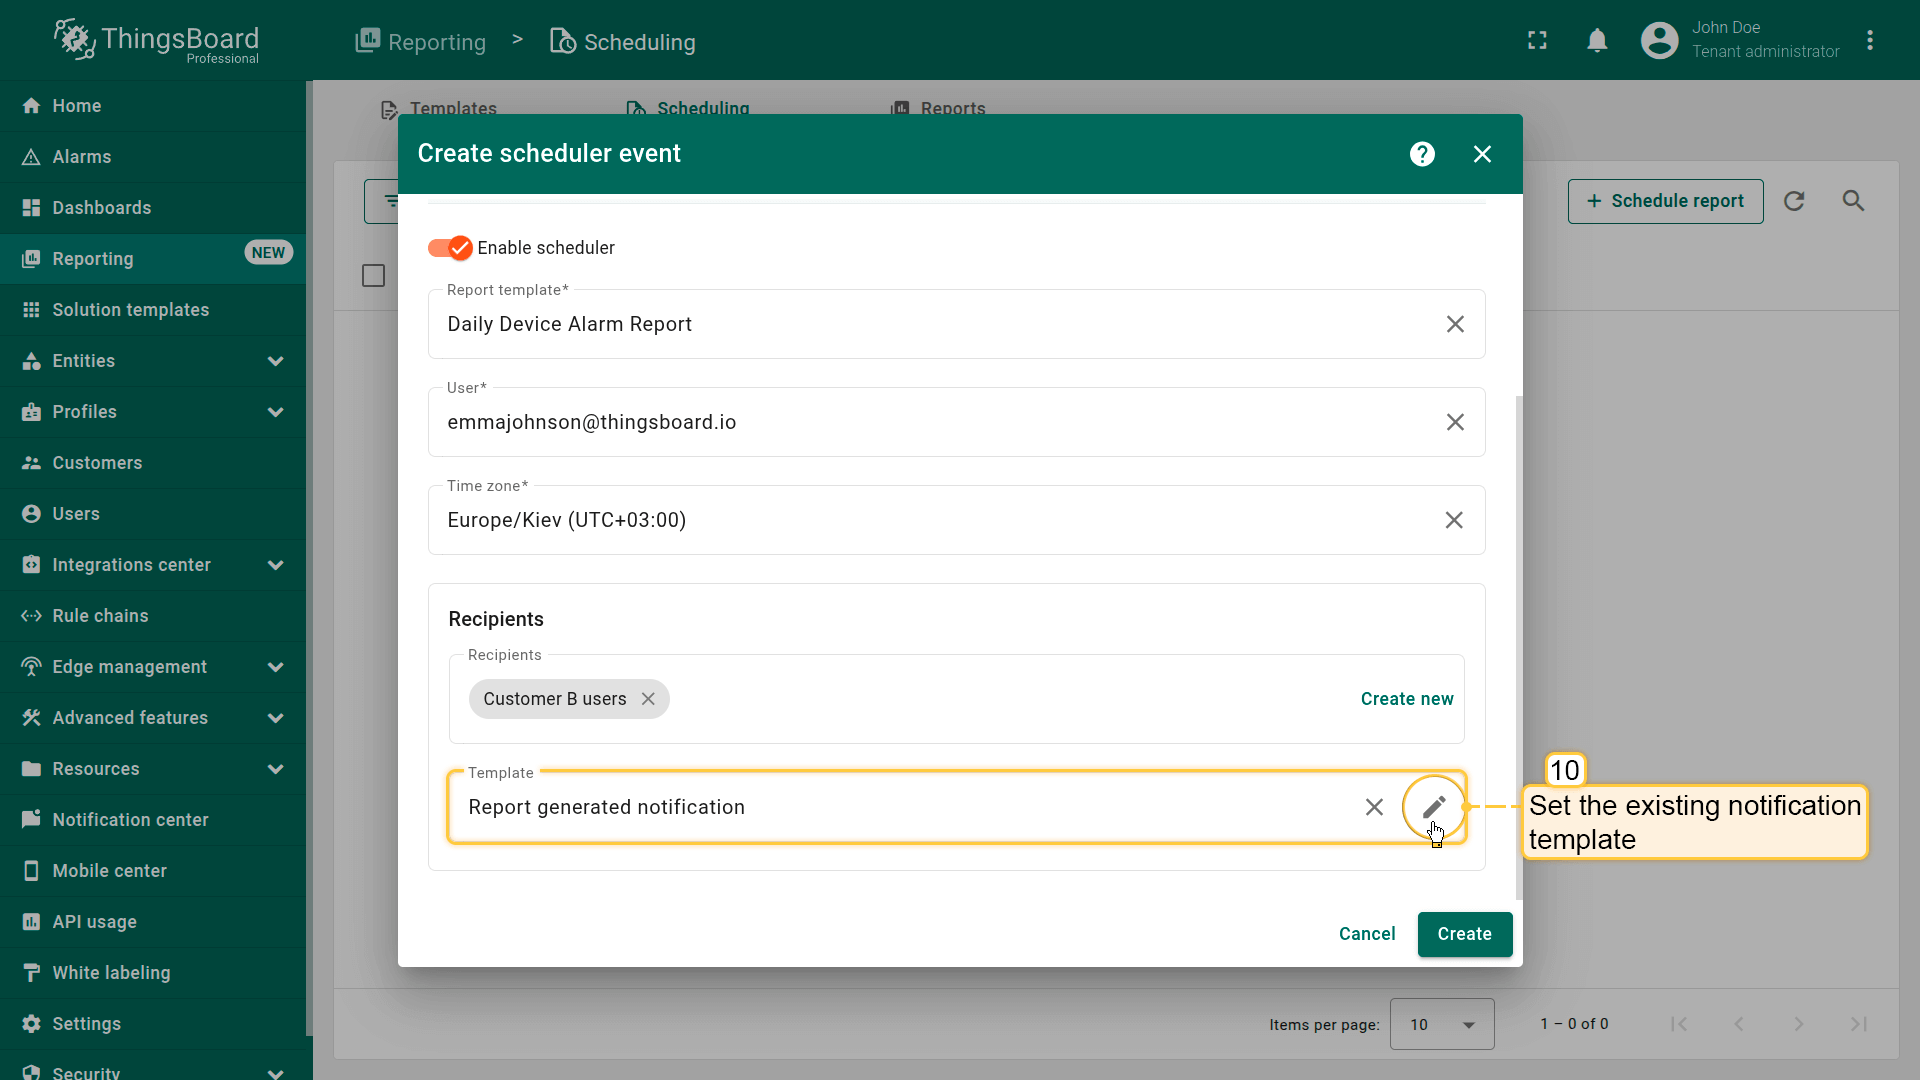
- Use the existing notification template that is already configured to send messages via Email and Web.
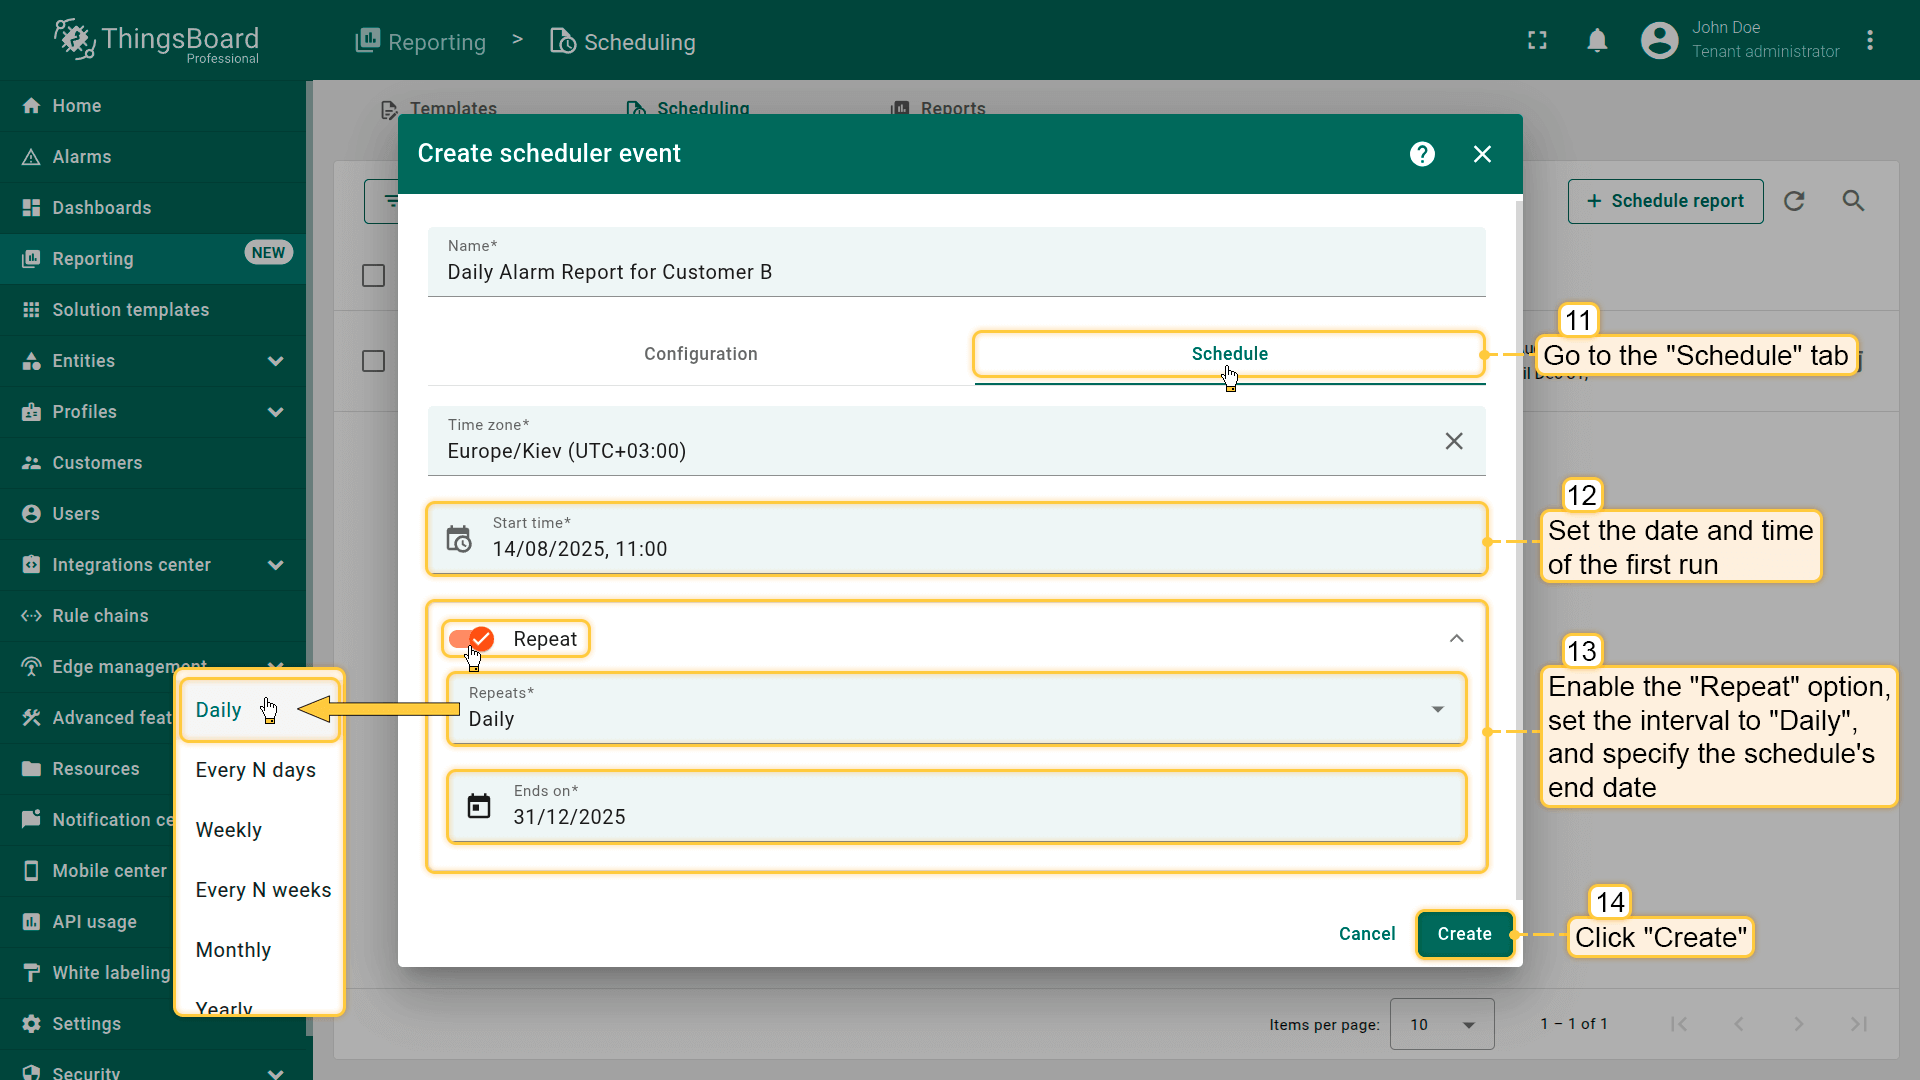
- Set the delivery schedule the same way as for Customer A:
- Start date/time: Specify the date and time of the first run.
- Repeat: Enable this option.
- Interval: Select “Daily”.
- End date: put the schedule's end date.
- Finally, click “Create” to save the scheduler event.
- Select the same template used for Customer A — Daily Device Alarm Report.
- Set the user account to [email protected] (Emma Johnson – Customer B Administrator). The report will be generated on behalf of this user, containing only the data accessible to Customer B.

- Select Customer users filter.
- Set Customer to Customer B.
- Click "Add".
- Specify the date and time of the first run.
- Enable the "Repeat" option, select
Daily</b> as the interval, and put the schedule's end date.
- Finally, click "Create" to save the scheduler event.
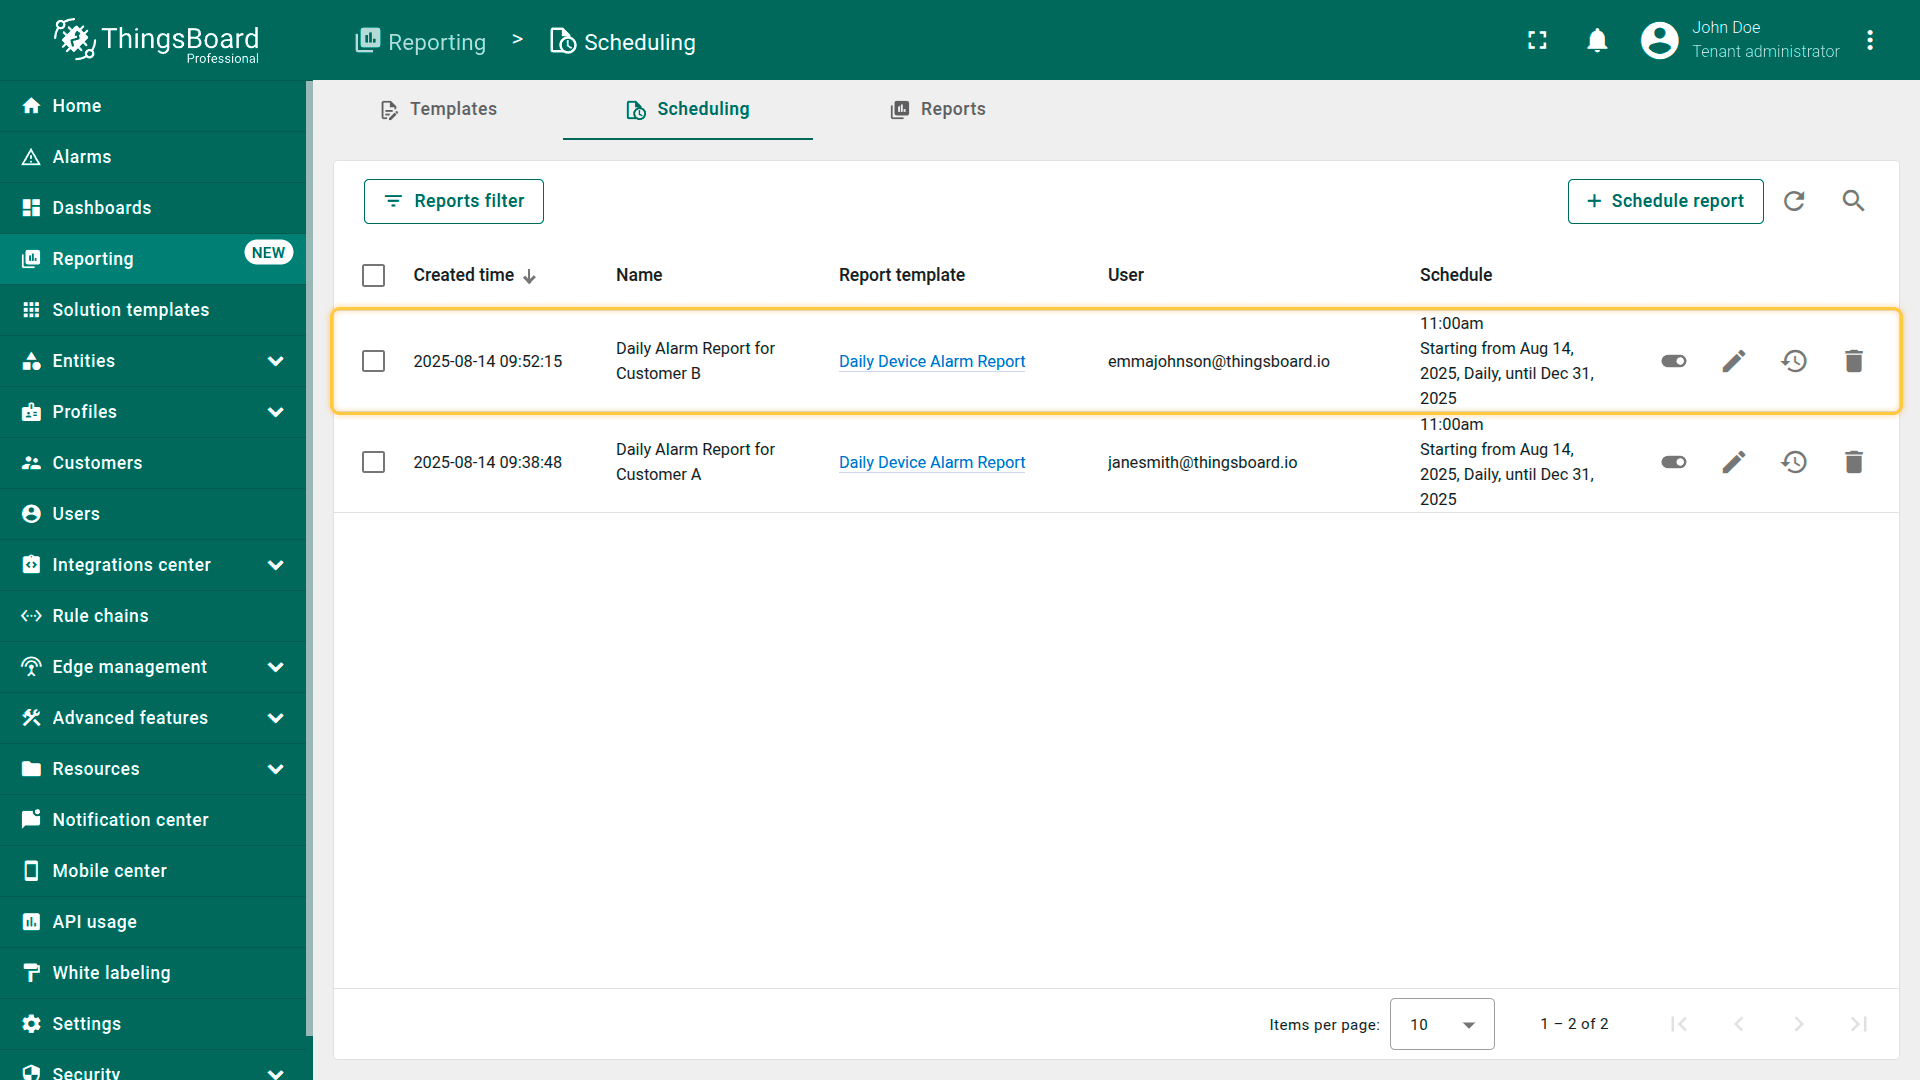
Step 4. Scheduled events result
Both scenarios use the same template — Daily Device Alarm Report.
Each user from both customers receives their own individual report containing only the entities they have access to.
The system automatically sends the reports daily at the scheduled time, without any manual intervention.
At the time specified in the scheduled events, all users of Customer A and Customer B will receive notifications along with the generated report on their device alarms.
Notifications will be delivered through two channels:
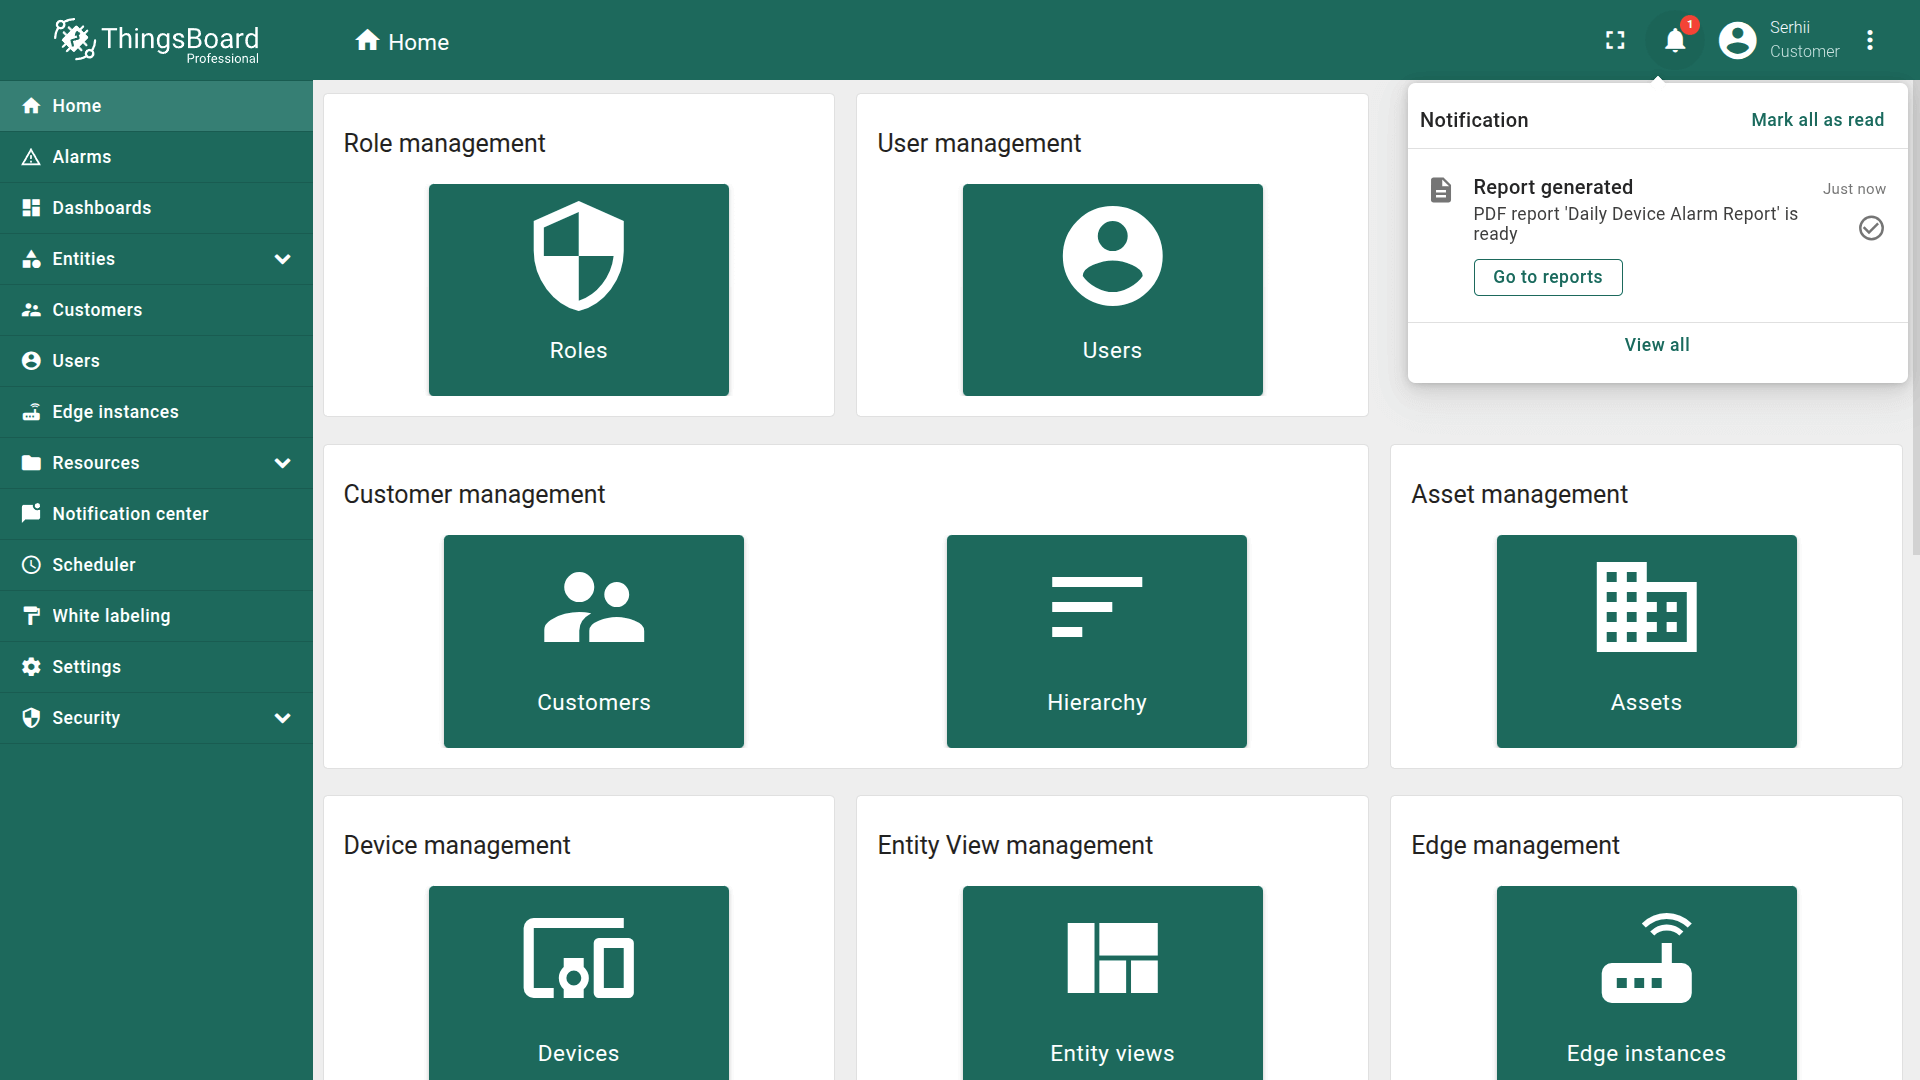
1. Web UI notification
- A notification about the generated report will appear in the ThingsBoard Web UI.
- Tenant Users can open the report directly within the ThingsBoard interface.
Important:
- Only Tenant Users can view generated reports directly in the ThingsBoard Web UI.
- Customer users do not have access to reports in the Web UI — they can only receive them through Email or Slack.
If your recipients are customer users, make sure at least one of these delivery channels is selected.
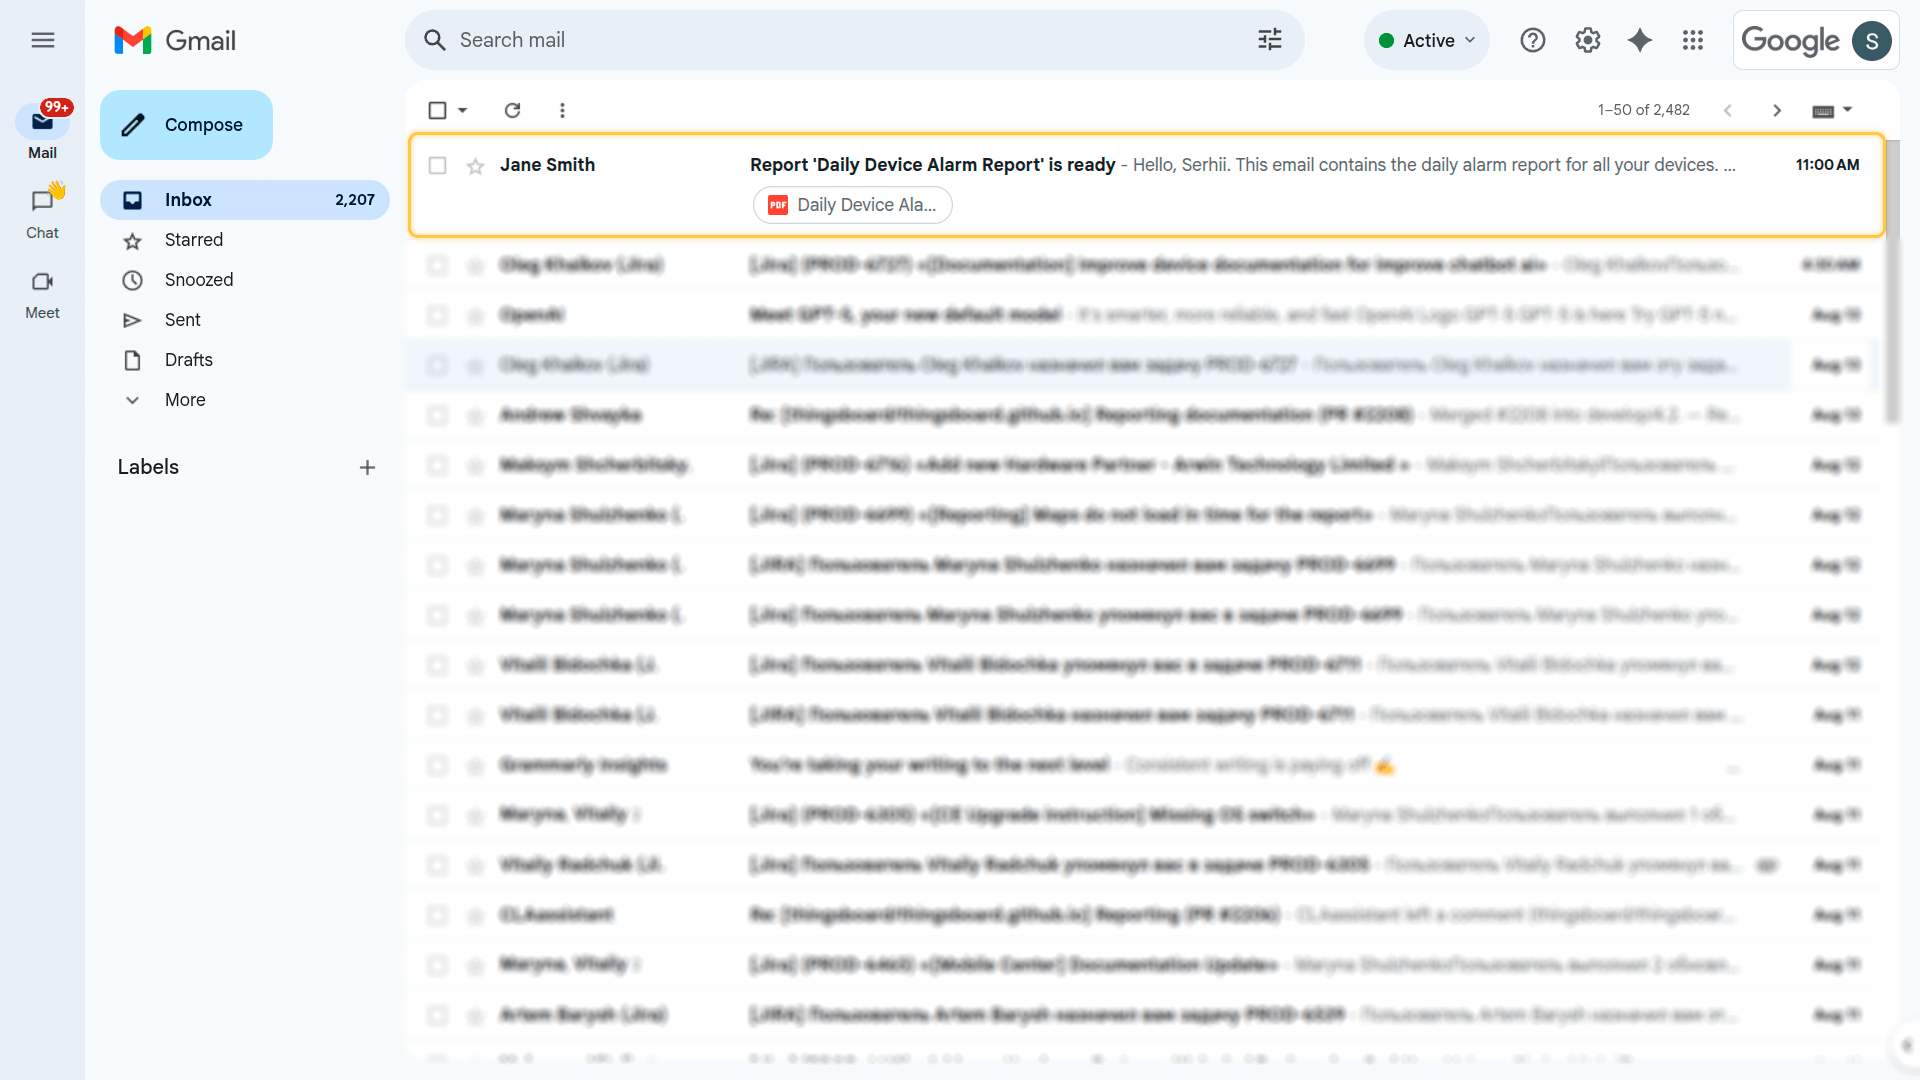
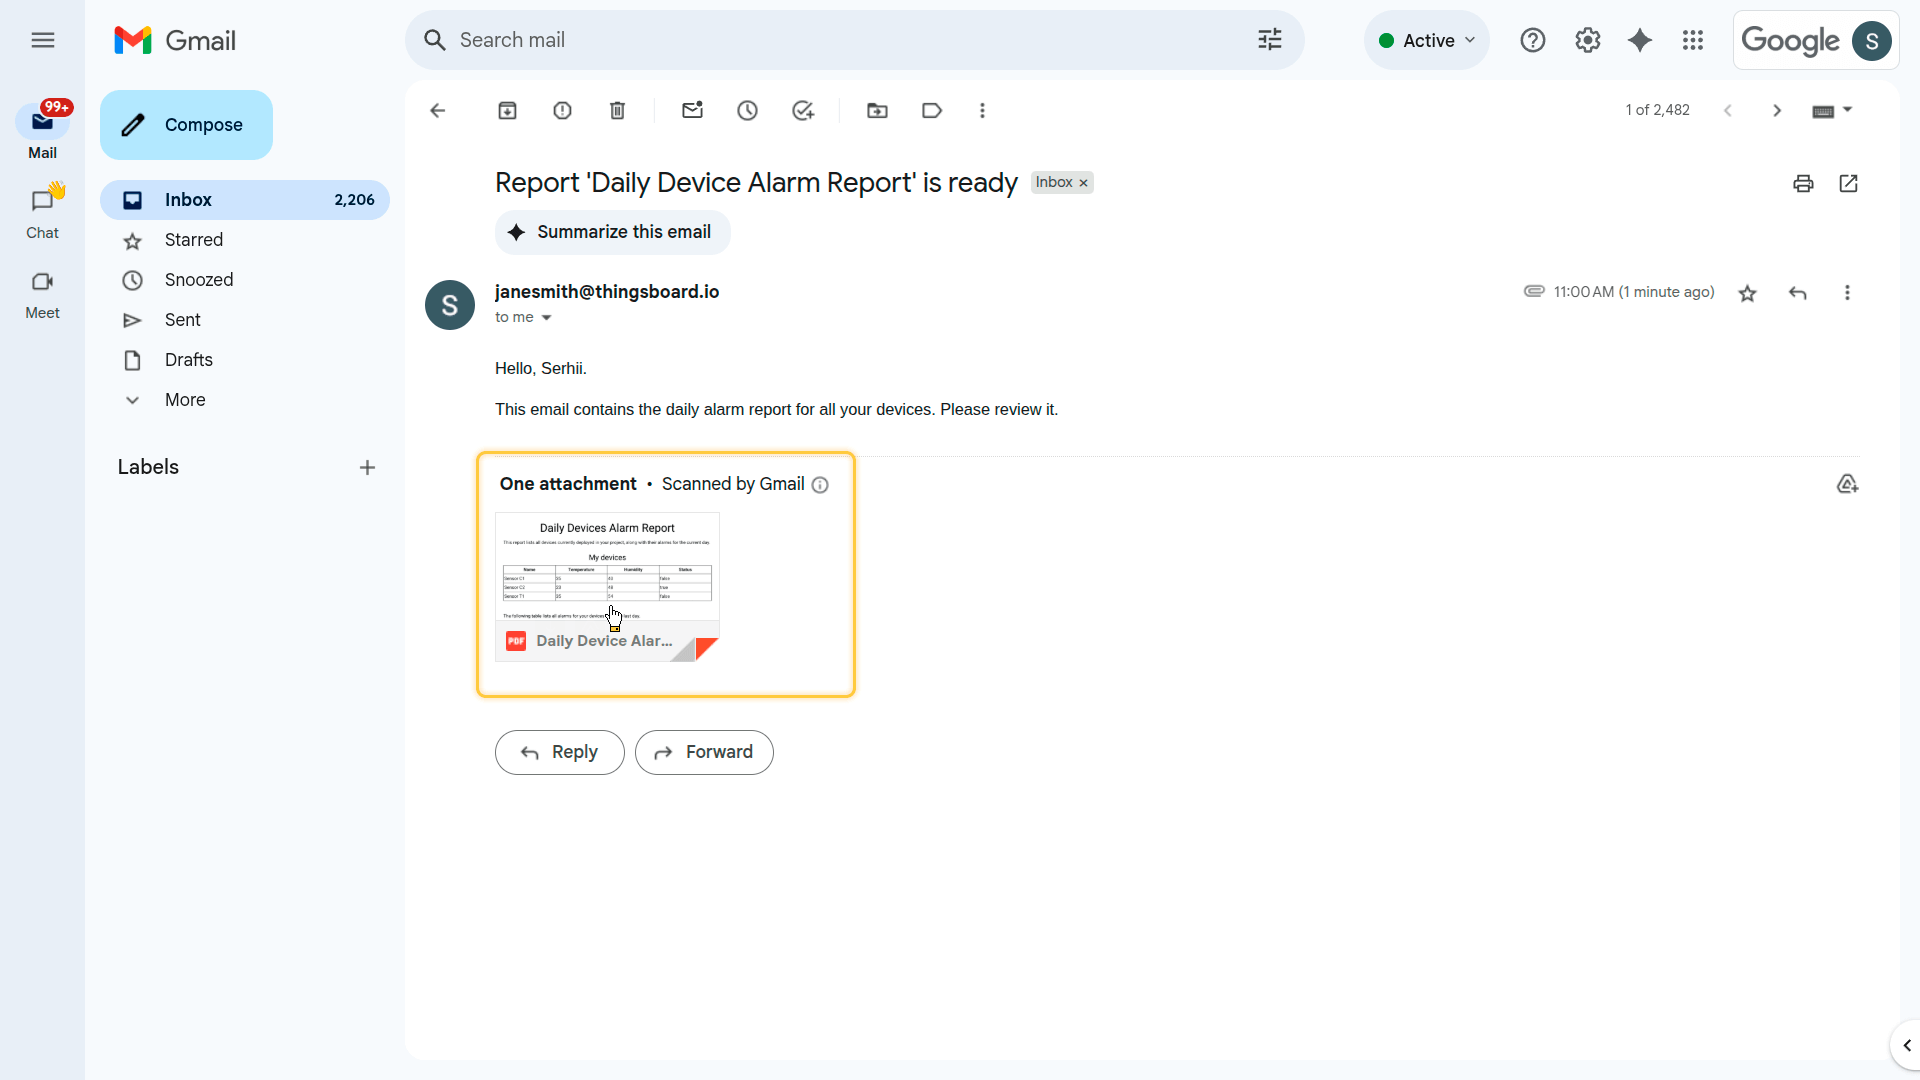
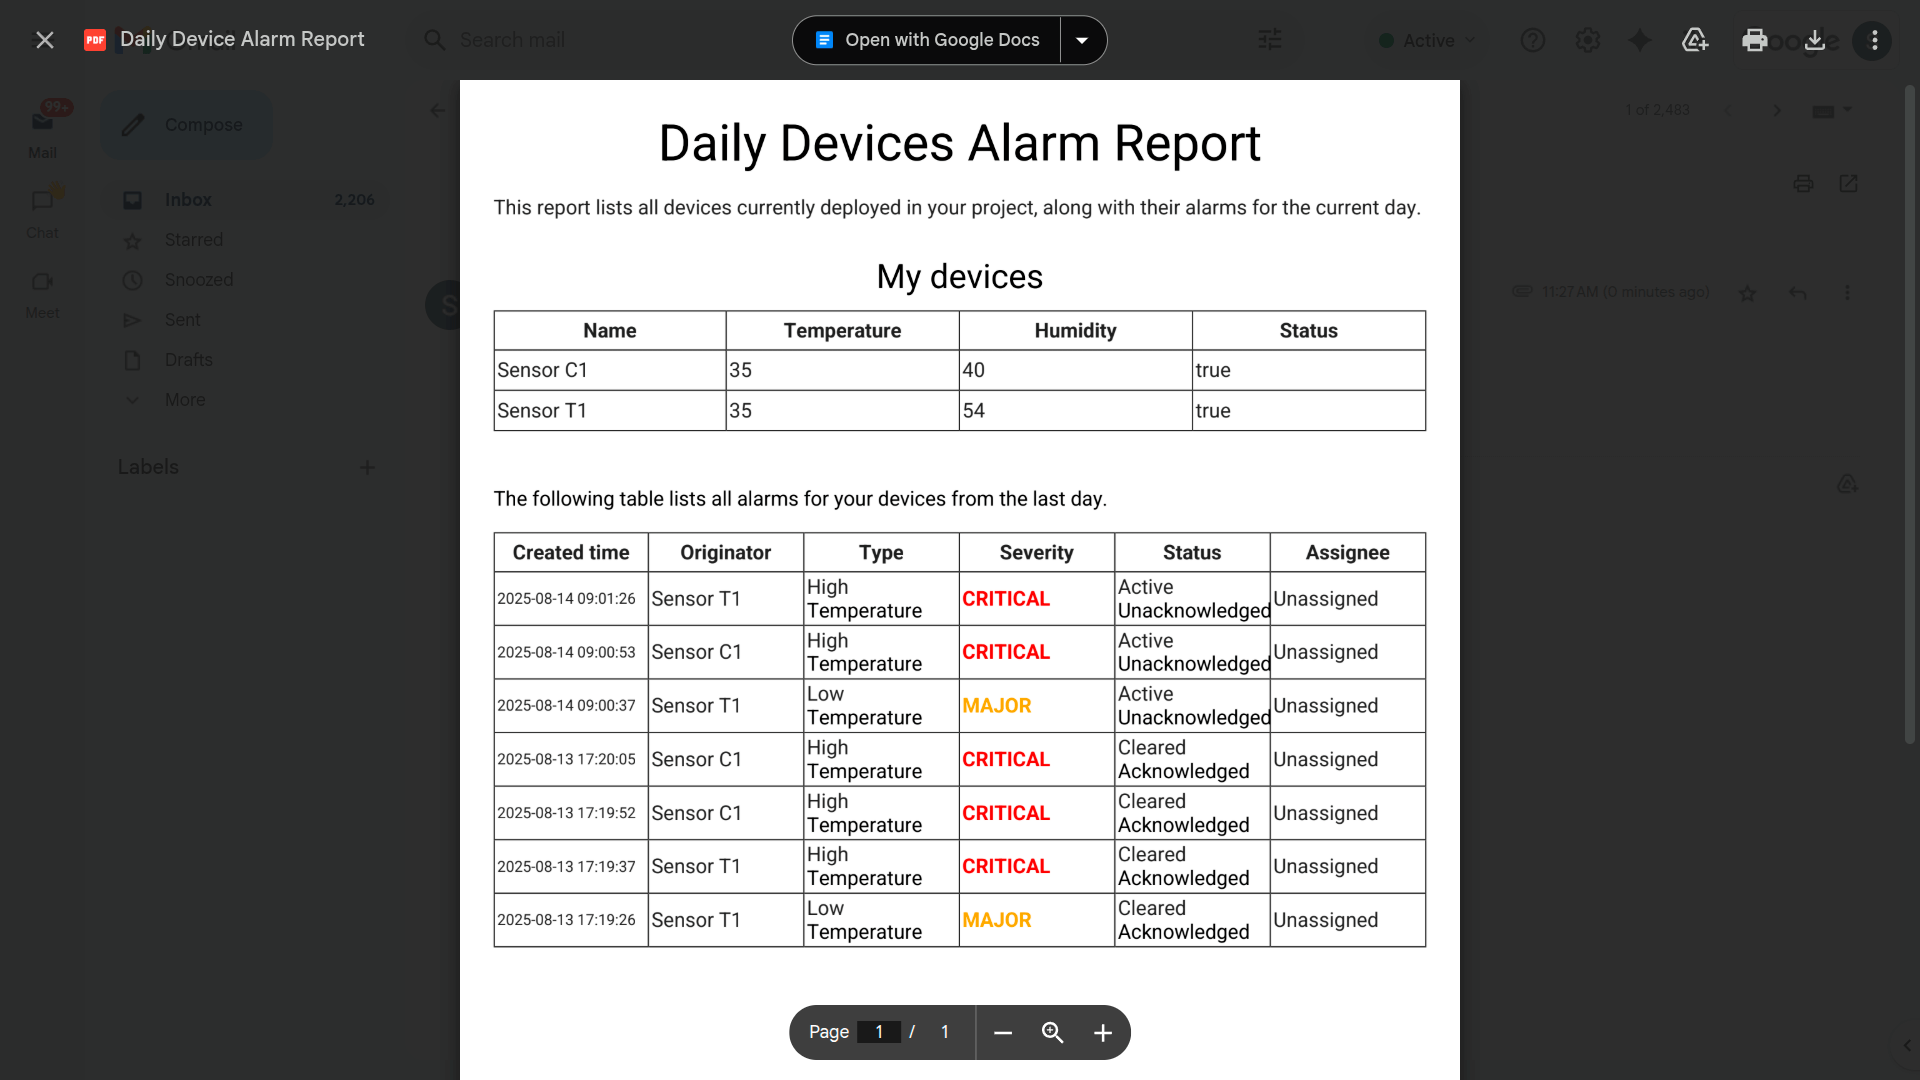
2. Email notification
- An email will be sent to the user with the subject and message you configured in the notification template.
- The email will have the report attached as a PDF file, which can be opened and viewed in the browser or downloaded.
Importing a template from JSON
If needed, you can also download a ready-made “Daily Device Alarm Report” template as a JSON file.
To import a template from a JSON file into your instance, see the instructions in this guide.
Next steps
-
Connect your device - Learn how to connect devices based on your connectivity technology or solution.
-
Data visualization - These guides contain instructions on how to configure complex ThingsBoard dashboards.
-
Data processing & actions - Learn how to use ThingsBoard Rule Engine.
-
IoT Data analytics - Learn how to use rule engine to perform basic analytics tasks.
-
Advanced features - Learn about advanced ThingsBoard features.
Your feedback
Don't hesitate to star ThingsBoard on github to help us spread the word. If you have any questions about this sample, please contact us.