Calculate Hourly Water Consumption Delta
Use a Script calculated field to compute the difference between the last two water meter readings and derive a new value—the water usage delta.
Use Case
Section titled “Use Case”The Water Meter A1 device reports hourly water consumption readings using the waterConsumption key.
ThingsBoard:
- collects the two most recent
waterConsumptionreadings within a 1-hour rolling window - computes the difference between them
- stores the result as
waterConsumptionHourlyon the device
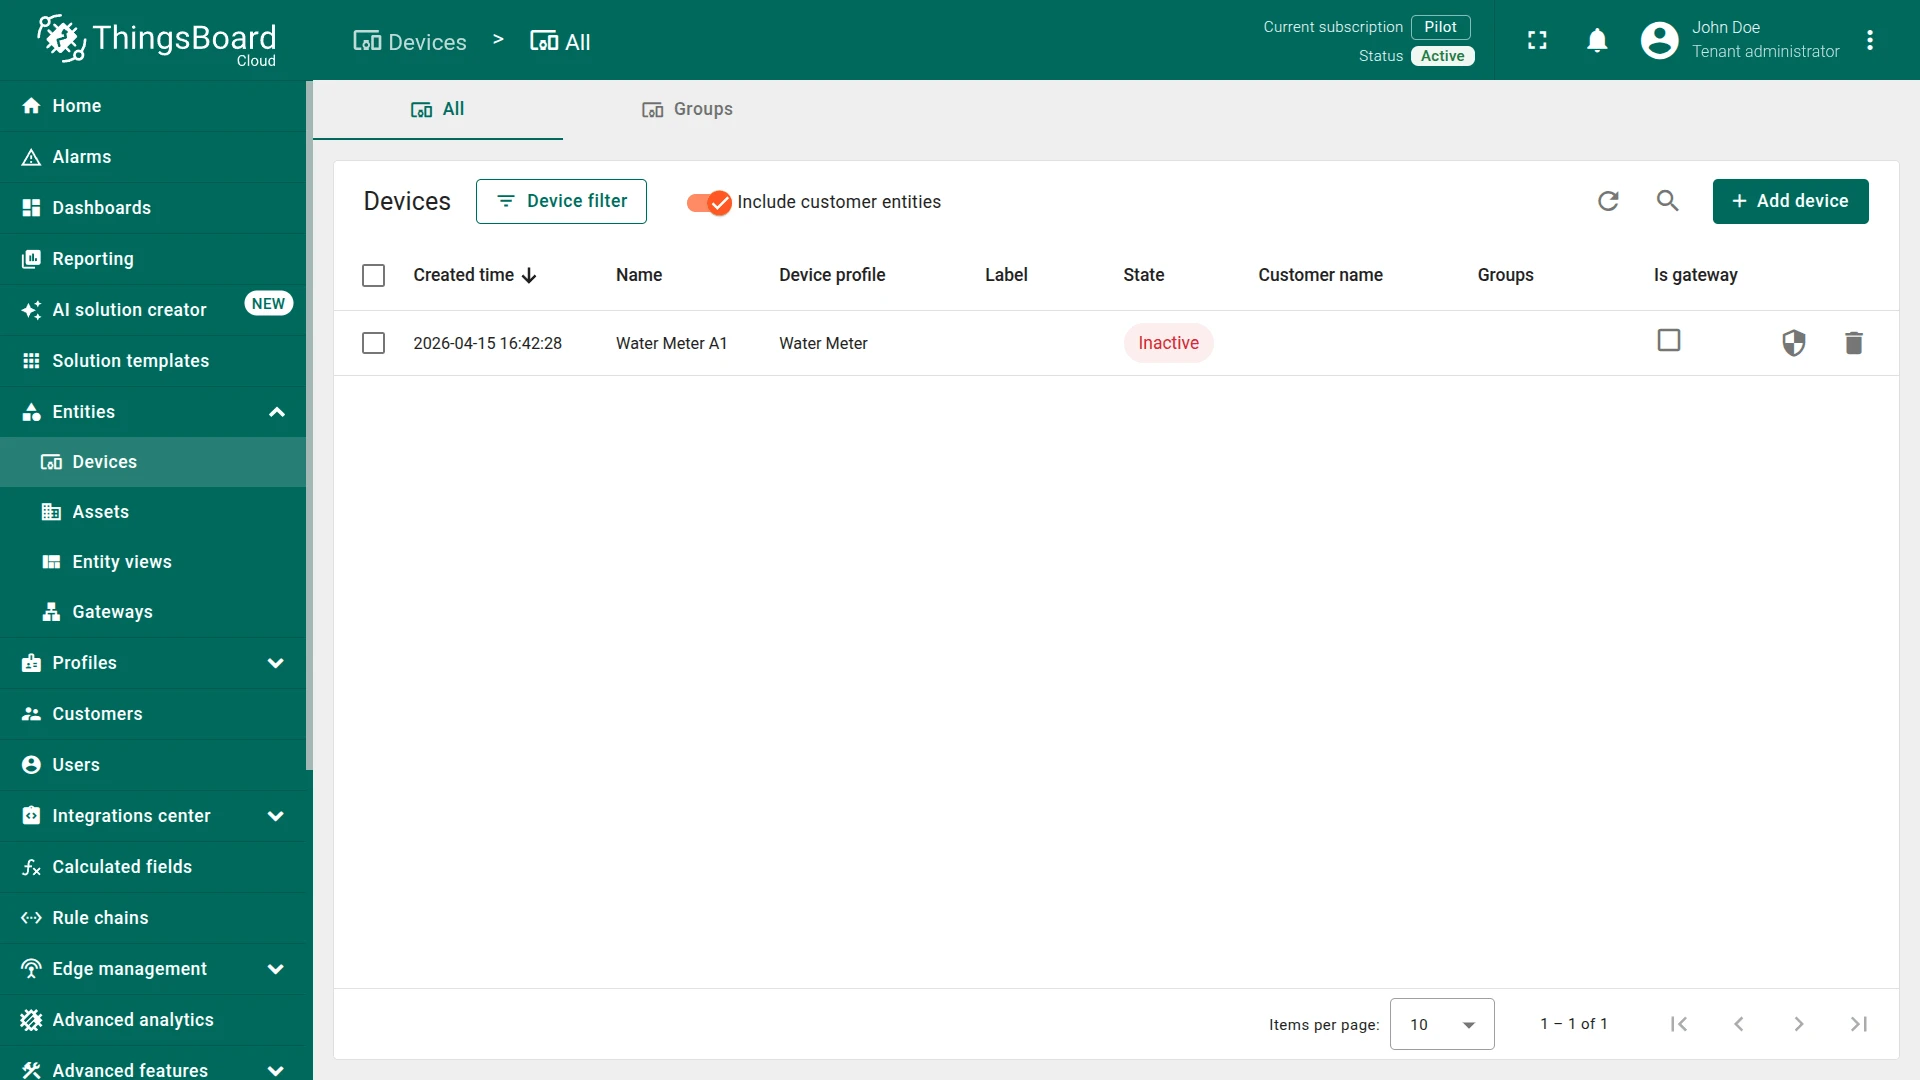
Step 1. Create Device
Section titled “Step 1. Create Device”Create a device:
- Name:
Water Meter A1 - Device profile:
Water Meter
Step 2. Create the Calculated Field
Section titled “Step 2. Create the Calculated Field”You can import a ready-made calculated field or build it manually.
Option 1. Import calculated field
-
Download the Water Consumption Hourly calculated field as JSON file and import it into your instance.
Option 2. Create manually
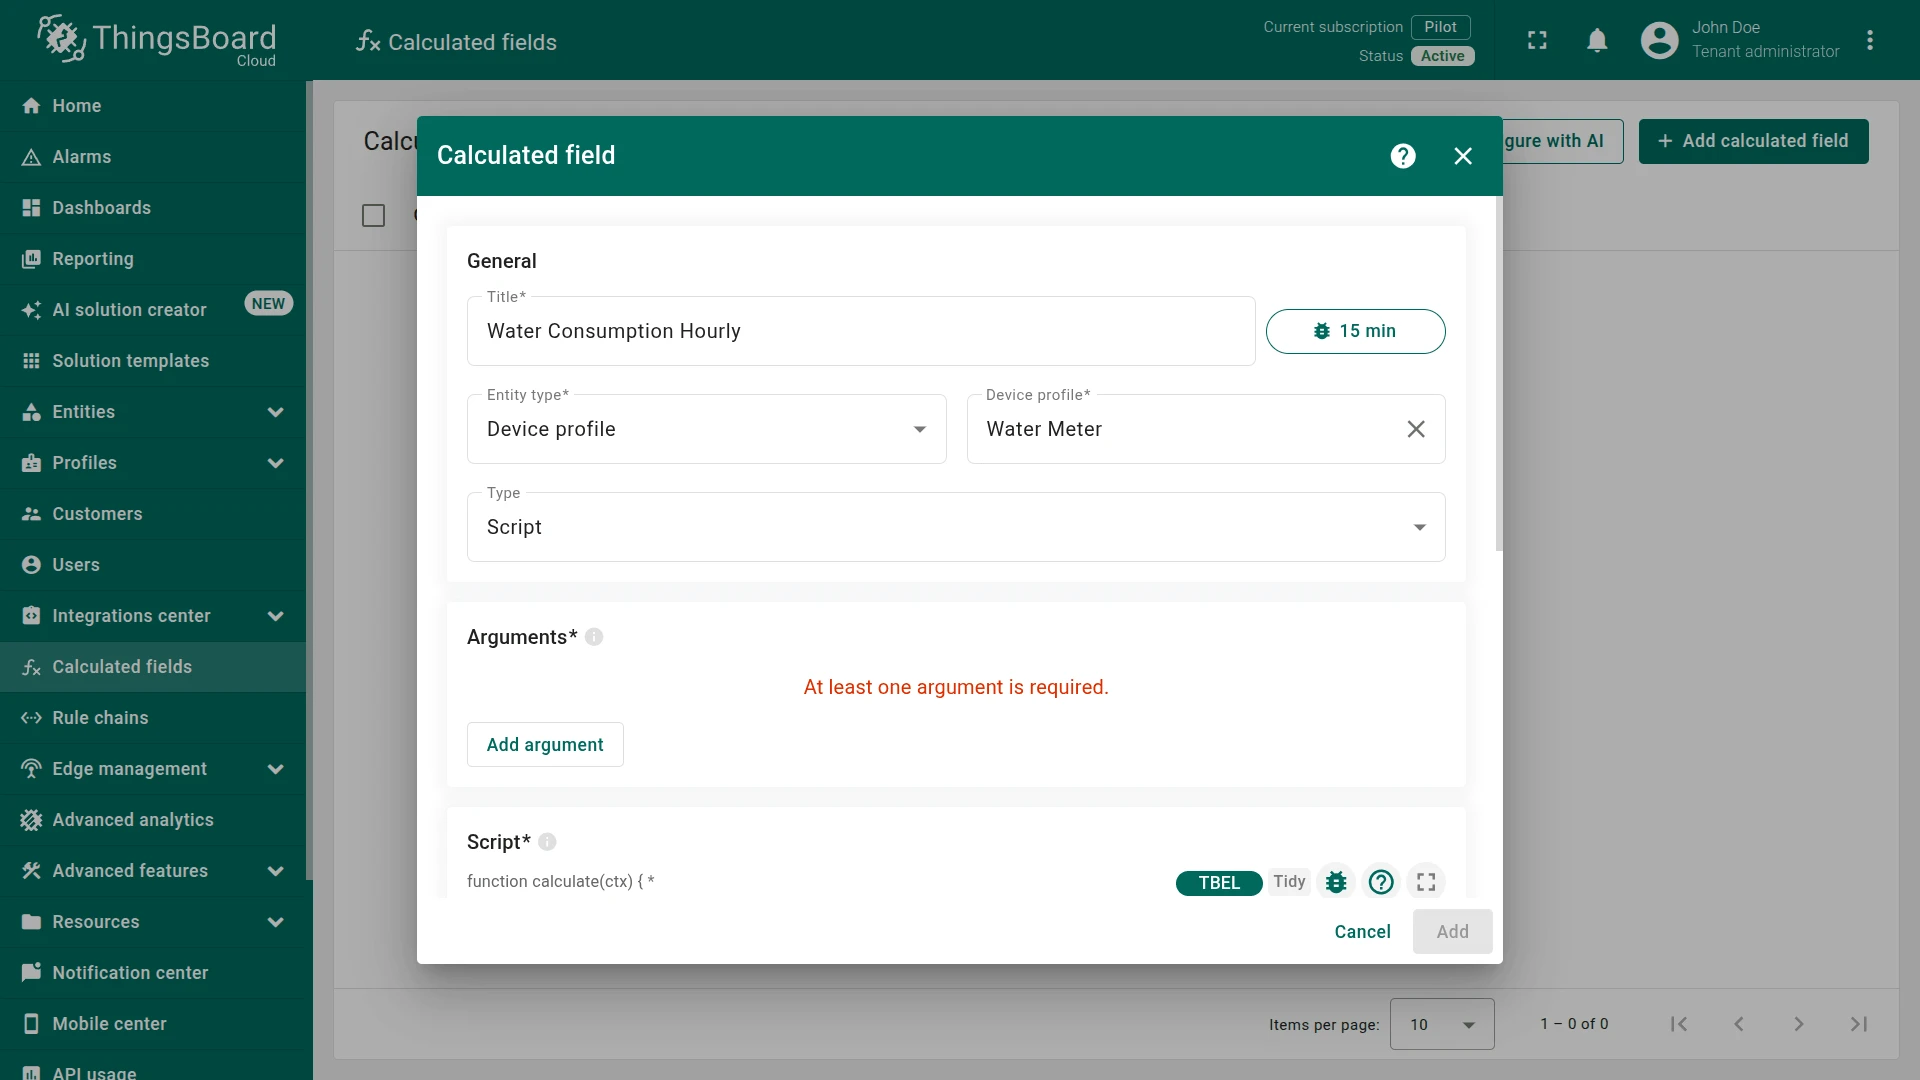
Navigate to Calculated fields and click + Add calculated field.
General Settings
Section titled “General Settings”- Title:
Water Consumption Hourly - Entity type:
Device profile - Device profile:
Water Meter - Type:
Script
Argument
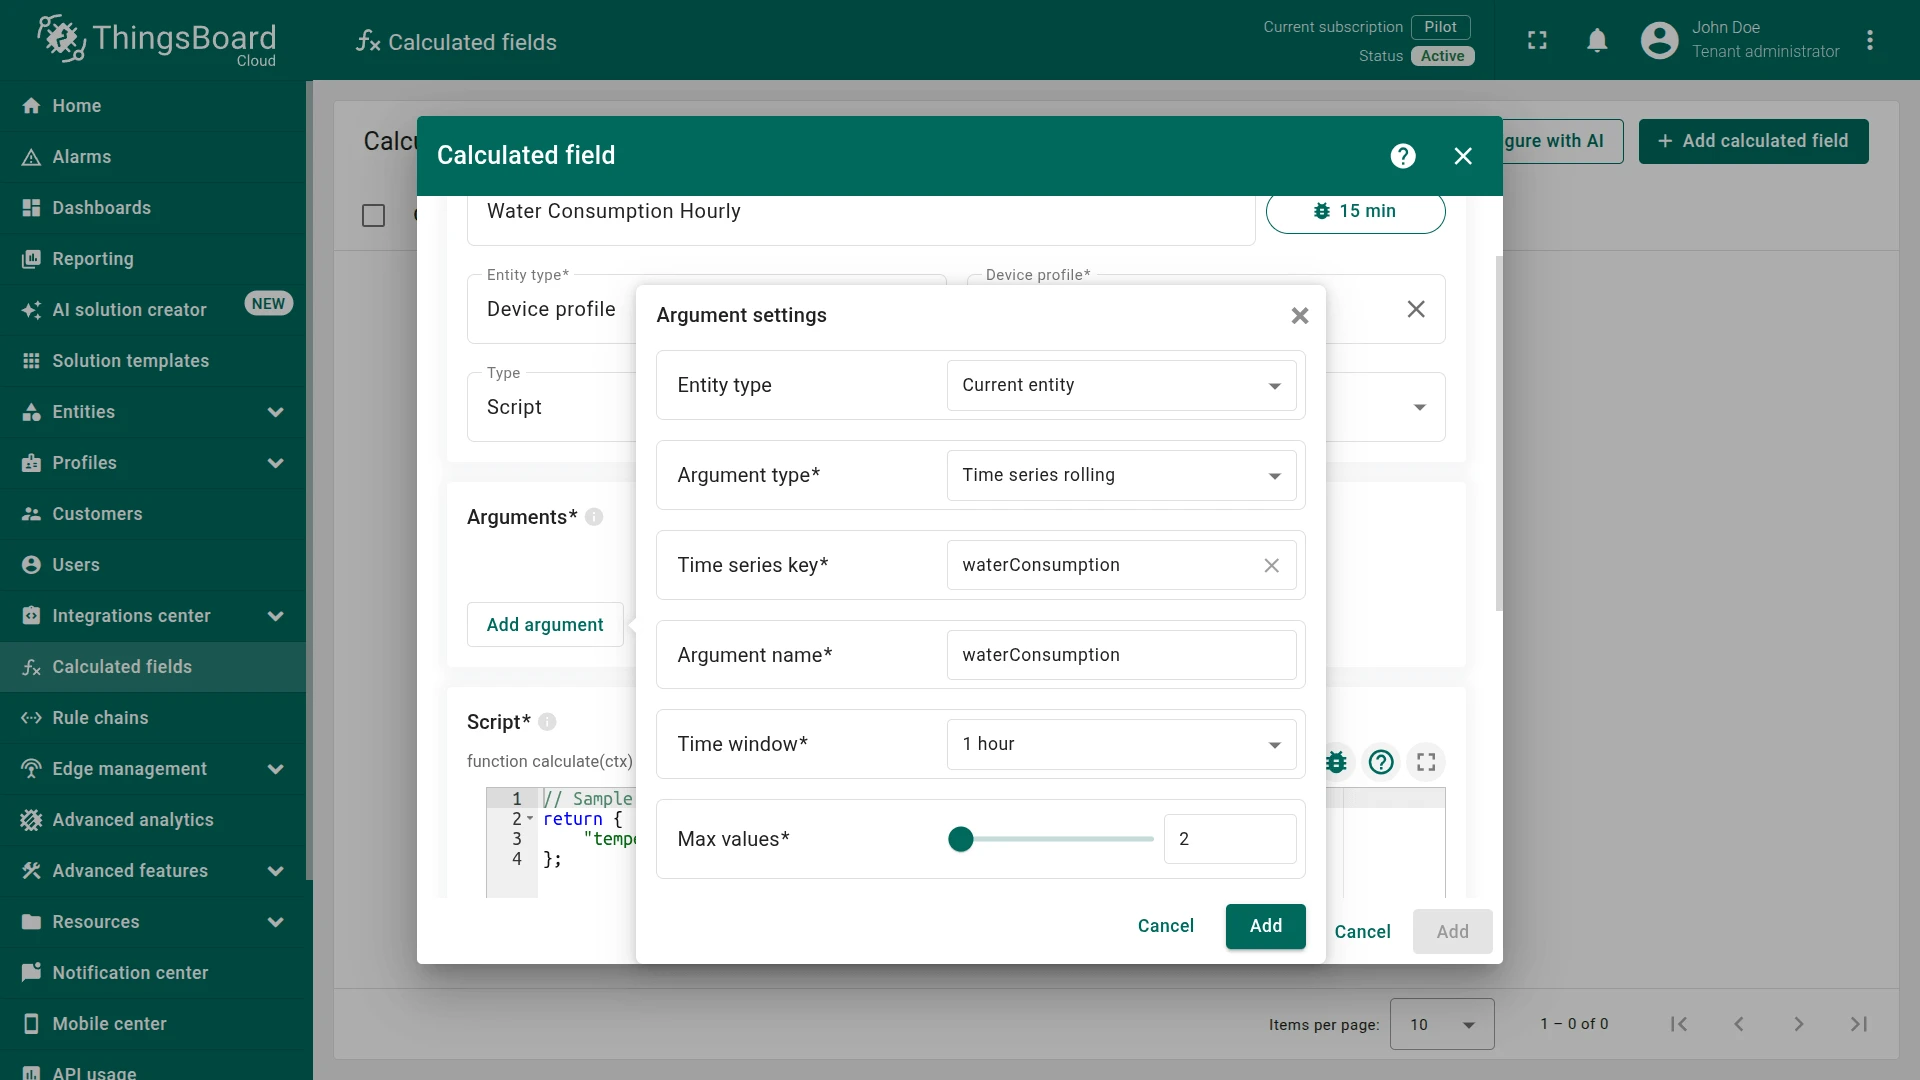
Section titled “Argument”Click Add argument and configure the rolling window:
- Entity type:
Current entity - Argument type:
Time series rolling - Time series key:
waterConsumption - Argument name:
waterConsumption - Time window:
1 hour - Max values:
2
This argument collects the two most recent waterConsumption readings from the last hour.
Script
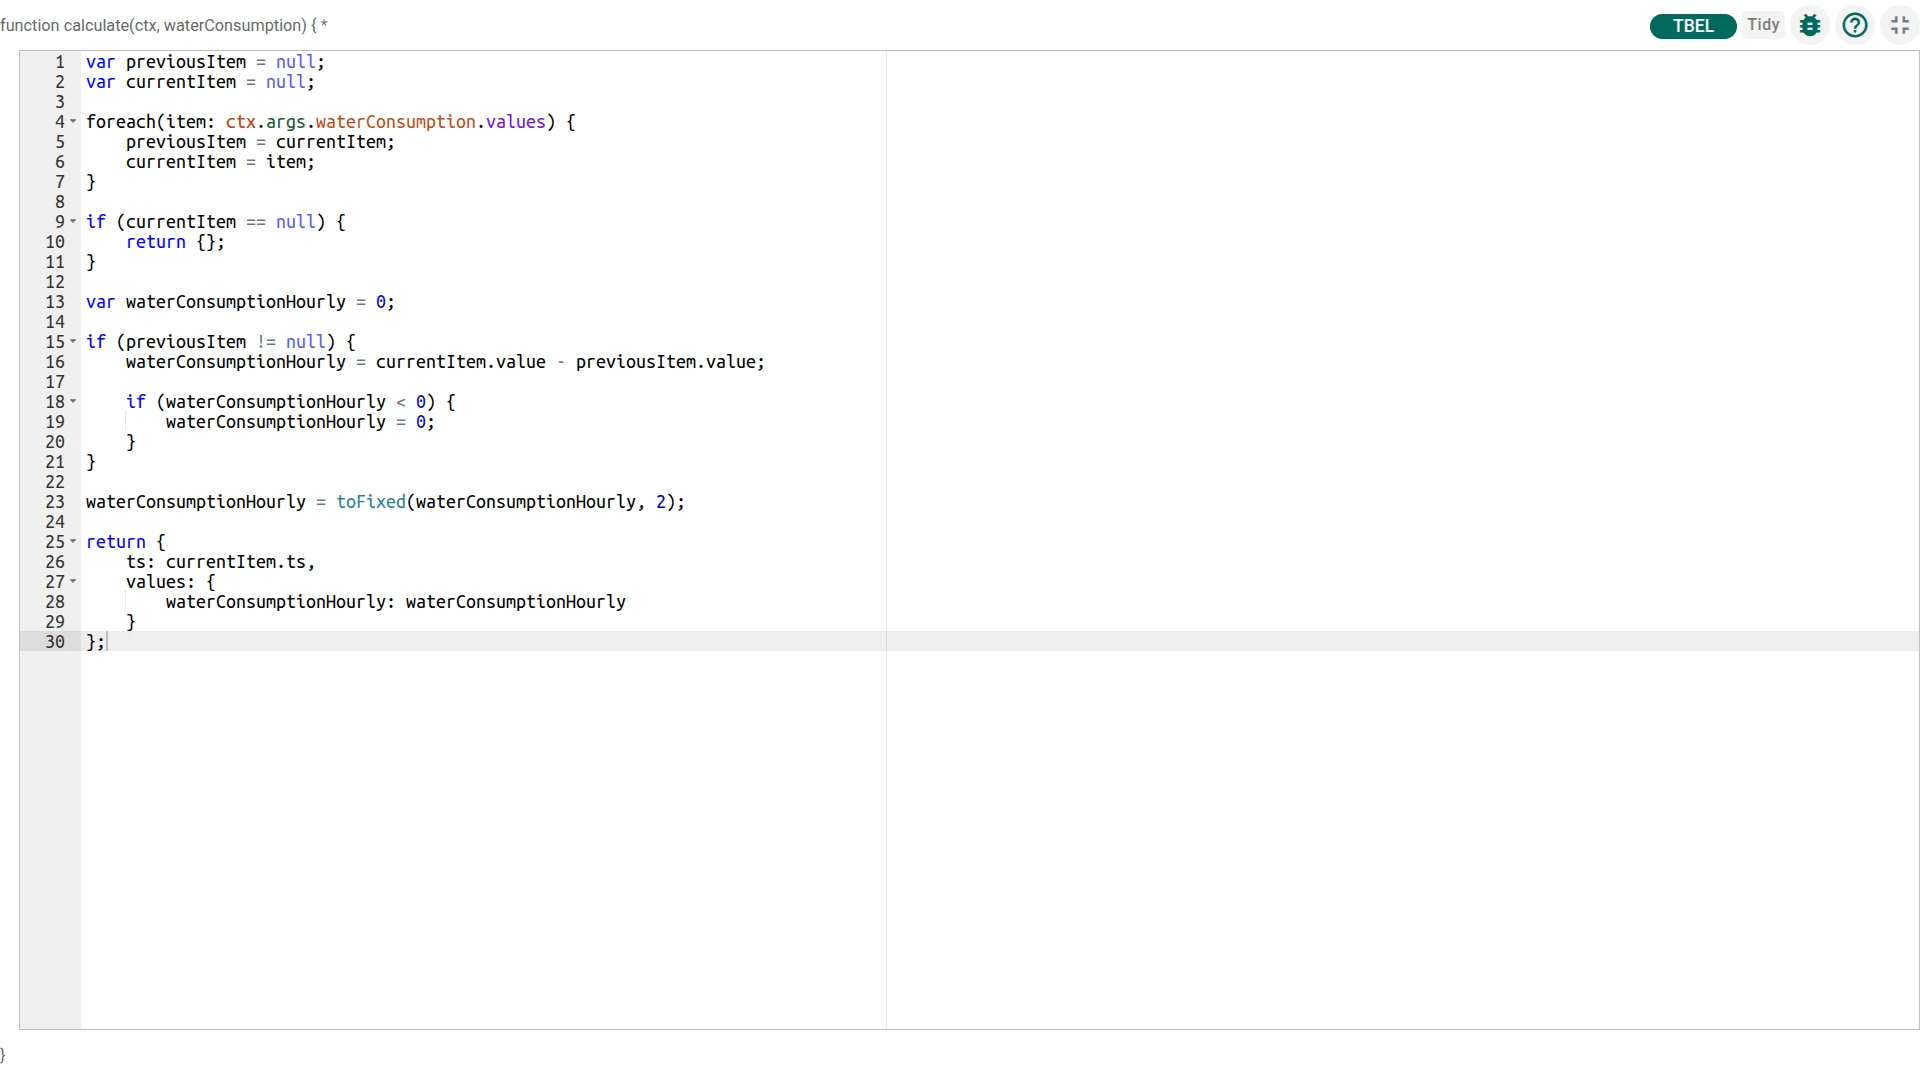
Section titled “Script”The script iterates over the two collected readings, computes the delta between the latest and the previous value, clamps negative results to zero (e.g. on meter reset), and returns the result timestamped to the latest reading.
var previousItem = null;var currentItem = null;
foreach(item: ctx.args.waterConsumption.values) {    previousItem = currentItem;    currentItem = item;}
if (currentItem == null) {    return {};}
var waterConsumptionHourly = 0;
if (previousItem != null) {    waterConsumptionHourly = currentItem.value - previousItem.value;
    if (waterConsumptionHourly < 0) {        waterConsumptionHourly = 0;    }}
waterConsumptionHourly = toFixed(waterConsumptionHourly, 2);
return {    ts: currentItem.ts,    values: {        waterConsumptionHourly: waterConsumptionHourly    }};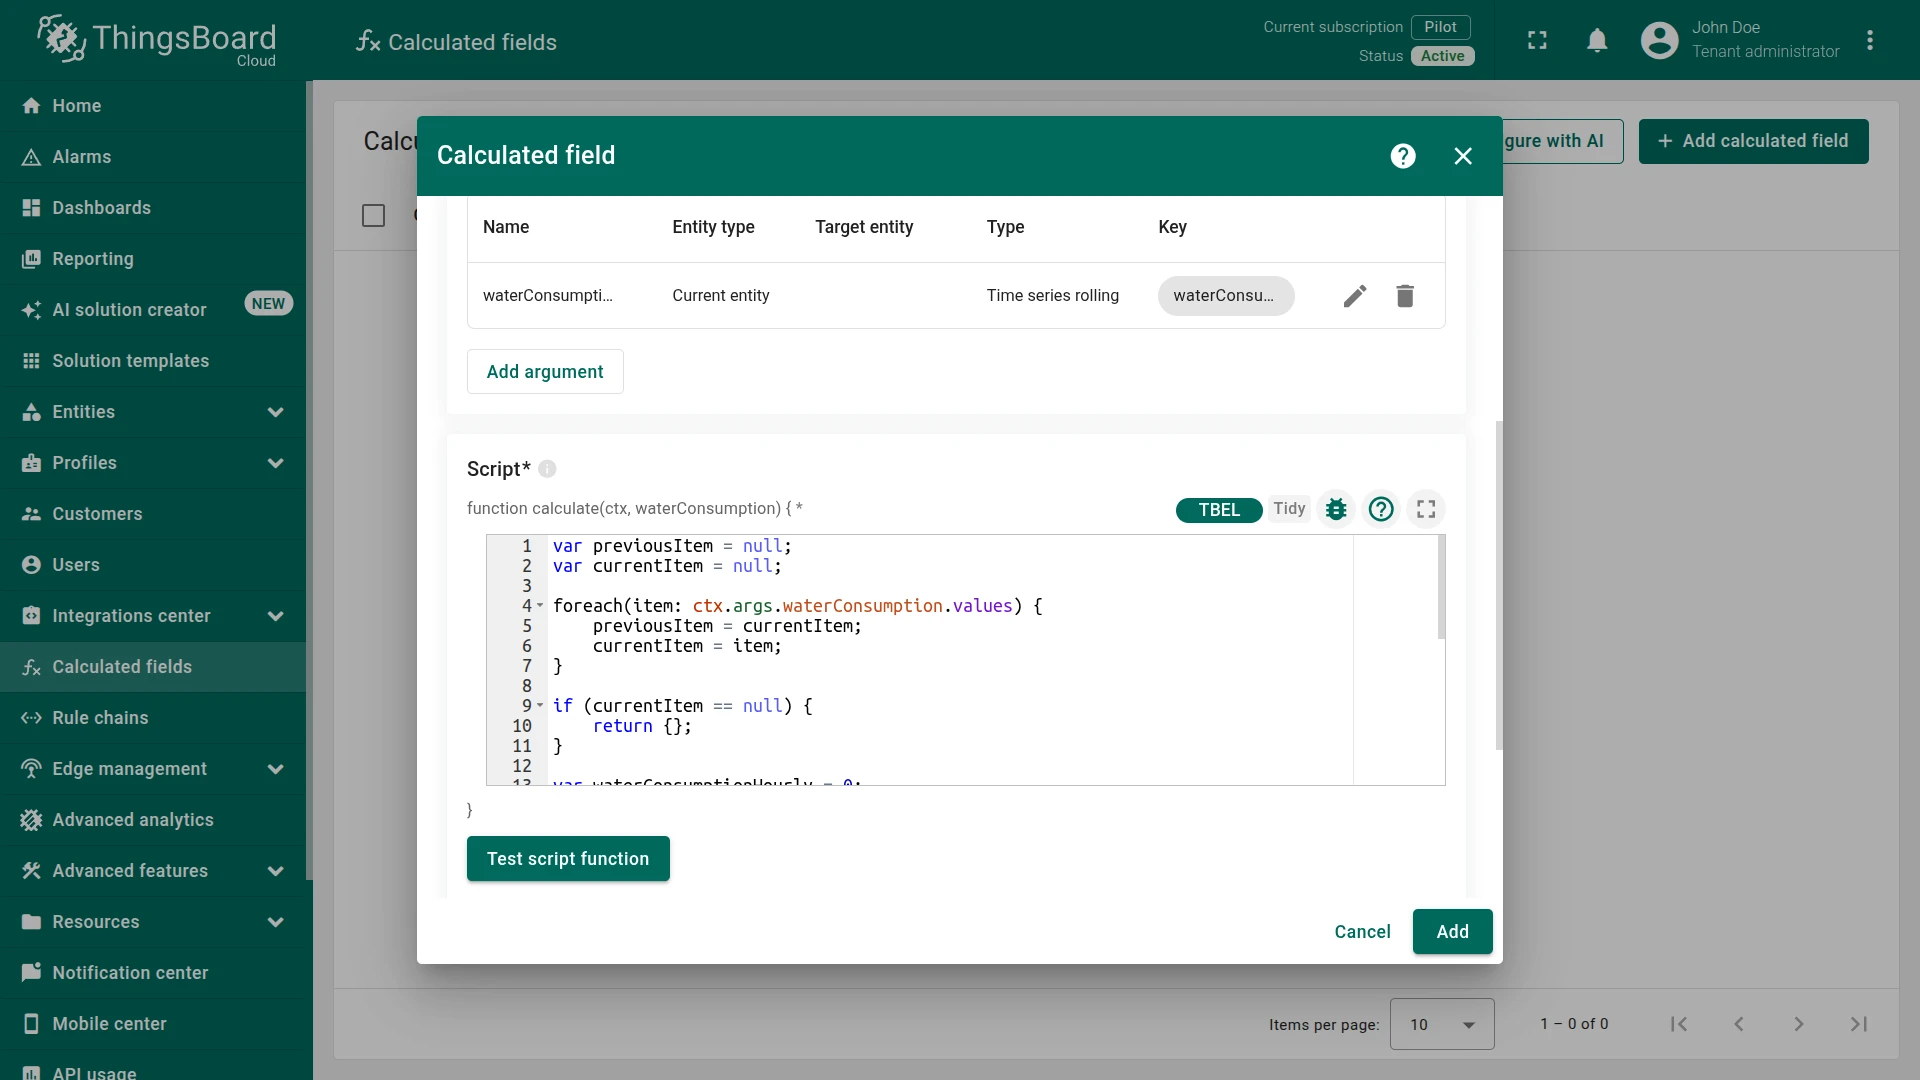
Output
Section titled “Output”- Output type:
Time series - Strategy:
Process right away
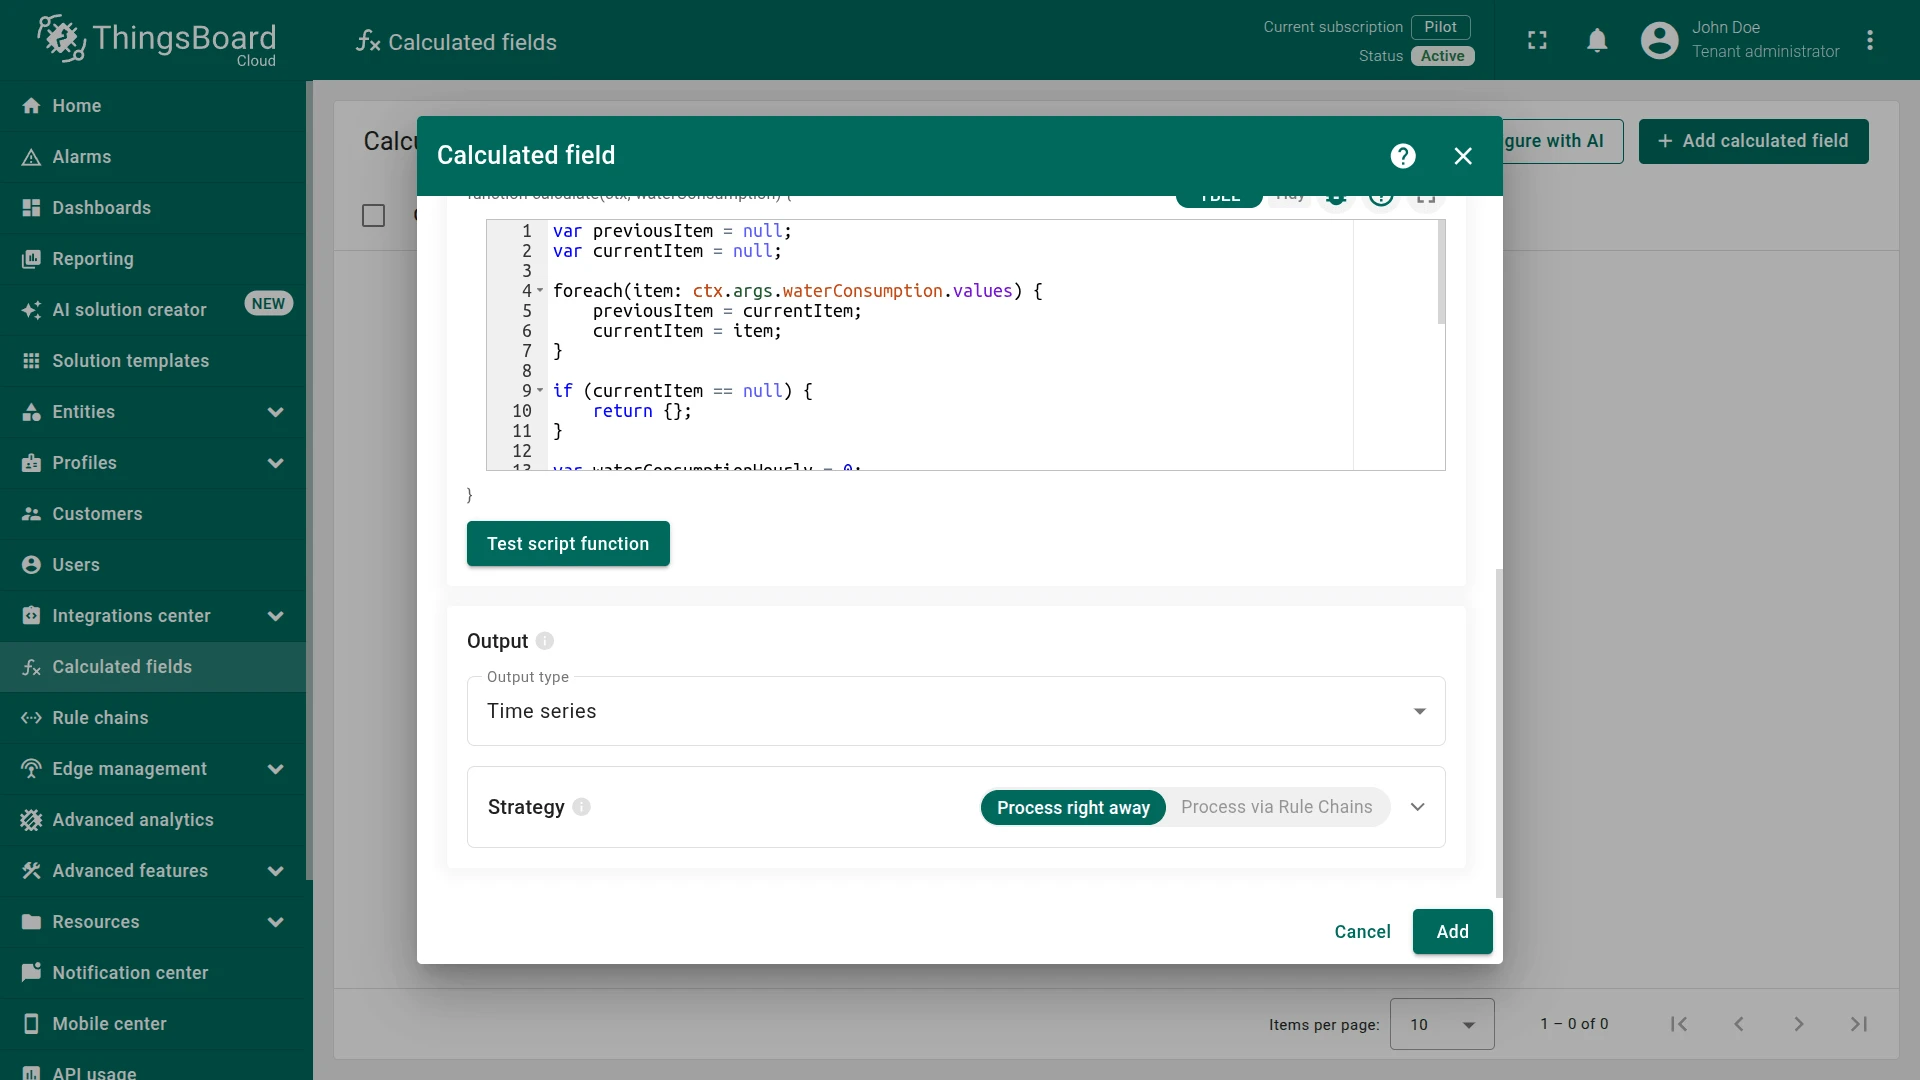
Click Add to save.
Step 3. Verify the Result
Section titled “Step 3. Verify the Result”Post two waterConsumption readings to Water Meter A1 within the configured time window. Replace $ACCESS_TOKEN with the device access token.
First reading:
curl -v -X POST -d '{"waterConsumption": 140}' https://$THINGSBOARD_HOST/api/v1/$ACCESS_TOKEN/telemetry --header "Content-Type:application/json"Second reading:
curl -v -X POST -d '{"waterConsumption": 145}' https://$THINGSBOARD_HOST/api/v1/$ACCESS_TOKEN/telemetry --header "Content-Type:application/json"Expected result: Open Water Meter A1 ⇾ Latest telemetry tab. A new waterConsumptionHourly key appears with value 5.0 — the delta between the two readings.
Step 4. Import the Dashboard
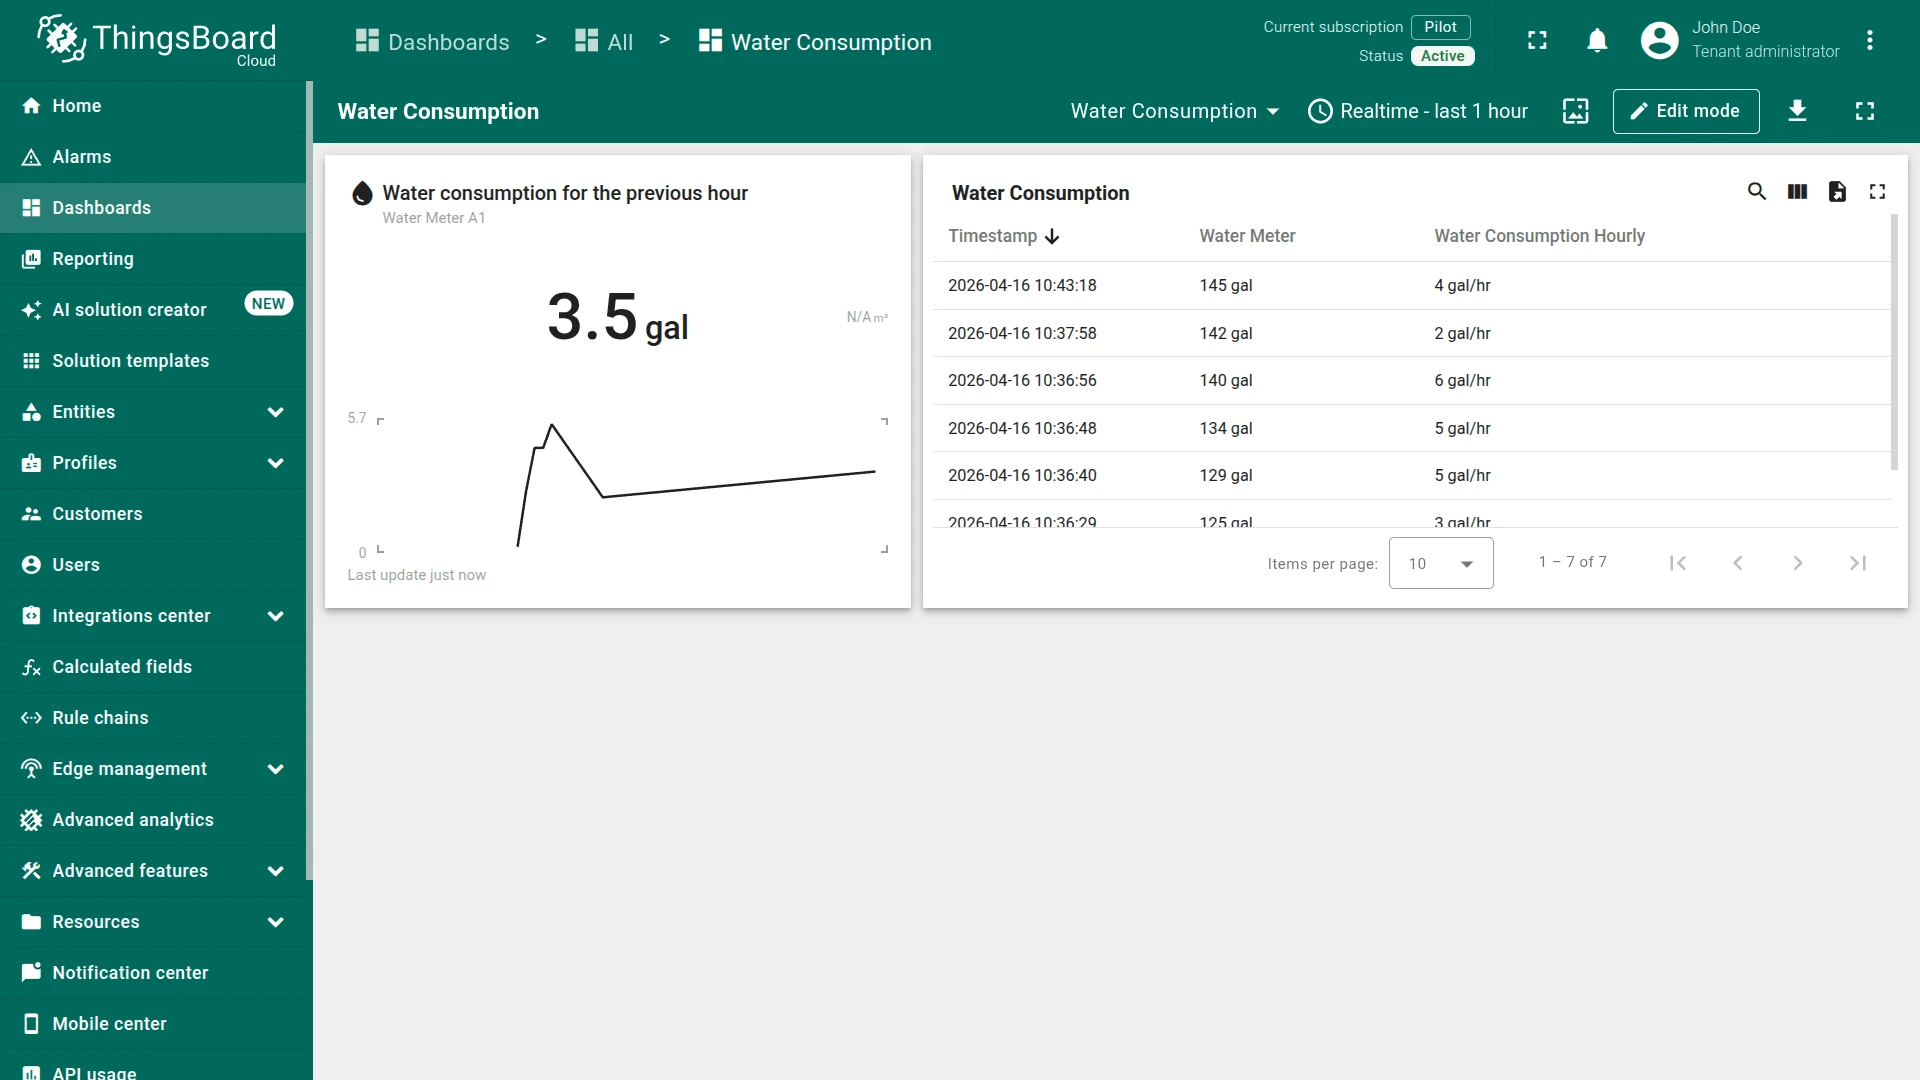
Section titled “Step 4. Import the Dashboard”Download the Water Consumption dashboard as a JSON file and import it.
The dashboard includes:
- a summary widget showing the latest hourly consumption value
- a time series table displaying
waterConsumptionandwaterConsumptionHourlyreadings over time
See Also
Section titled “See Also”- Script calculated fields — full feature reference
- Calculated fields — overview of all calculated field types
- Aggregate Telemetry from Related Devices — aggregation across multiple related devices using Sum
Was this helpful?