Step 4. Check device data
To review the data uploaded from your gateway, use the following steps:
-
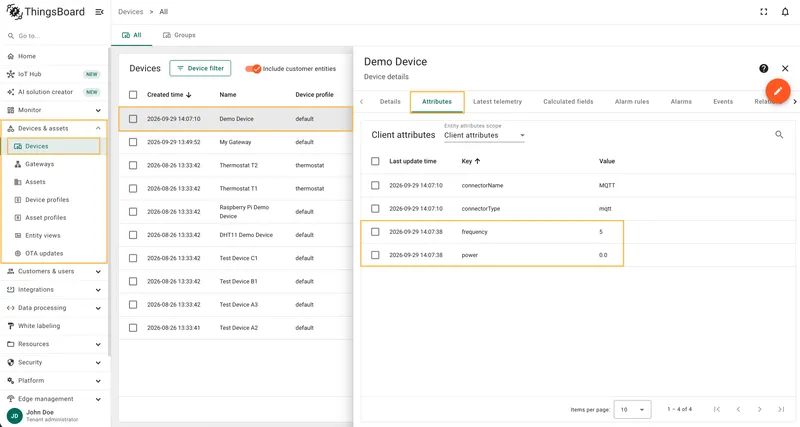
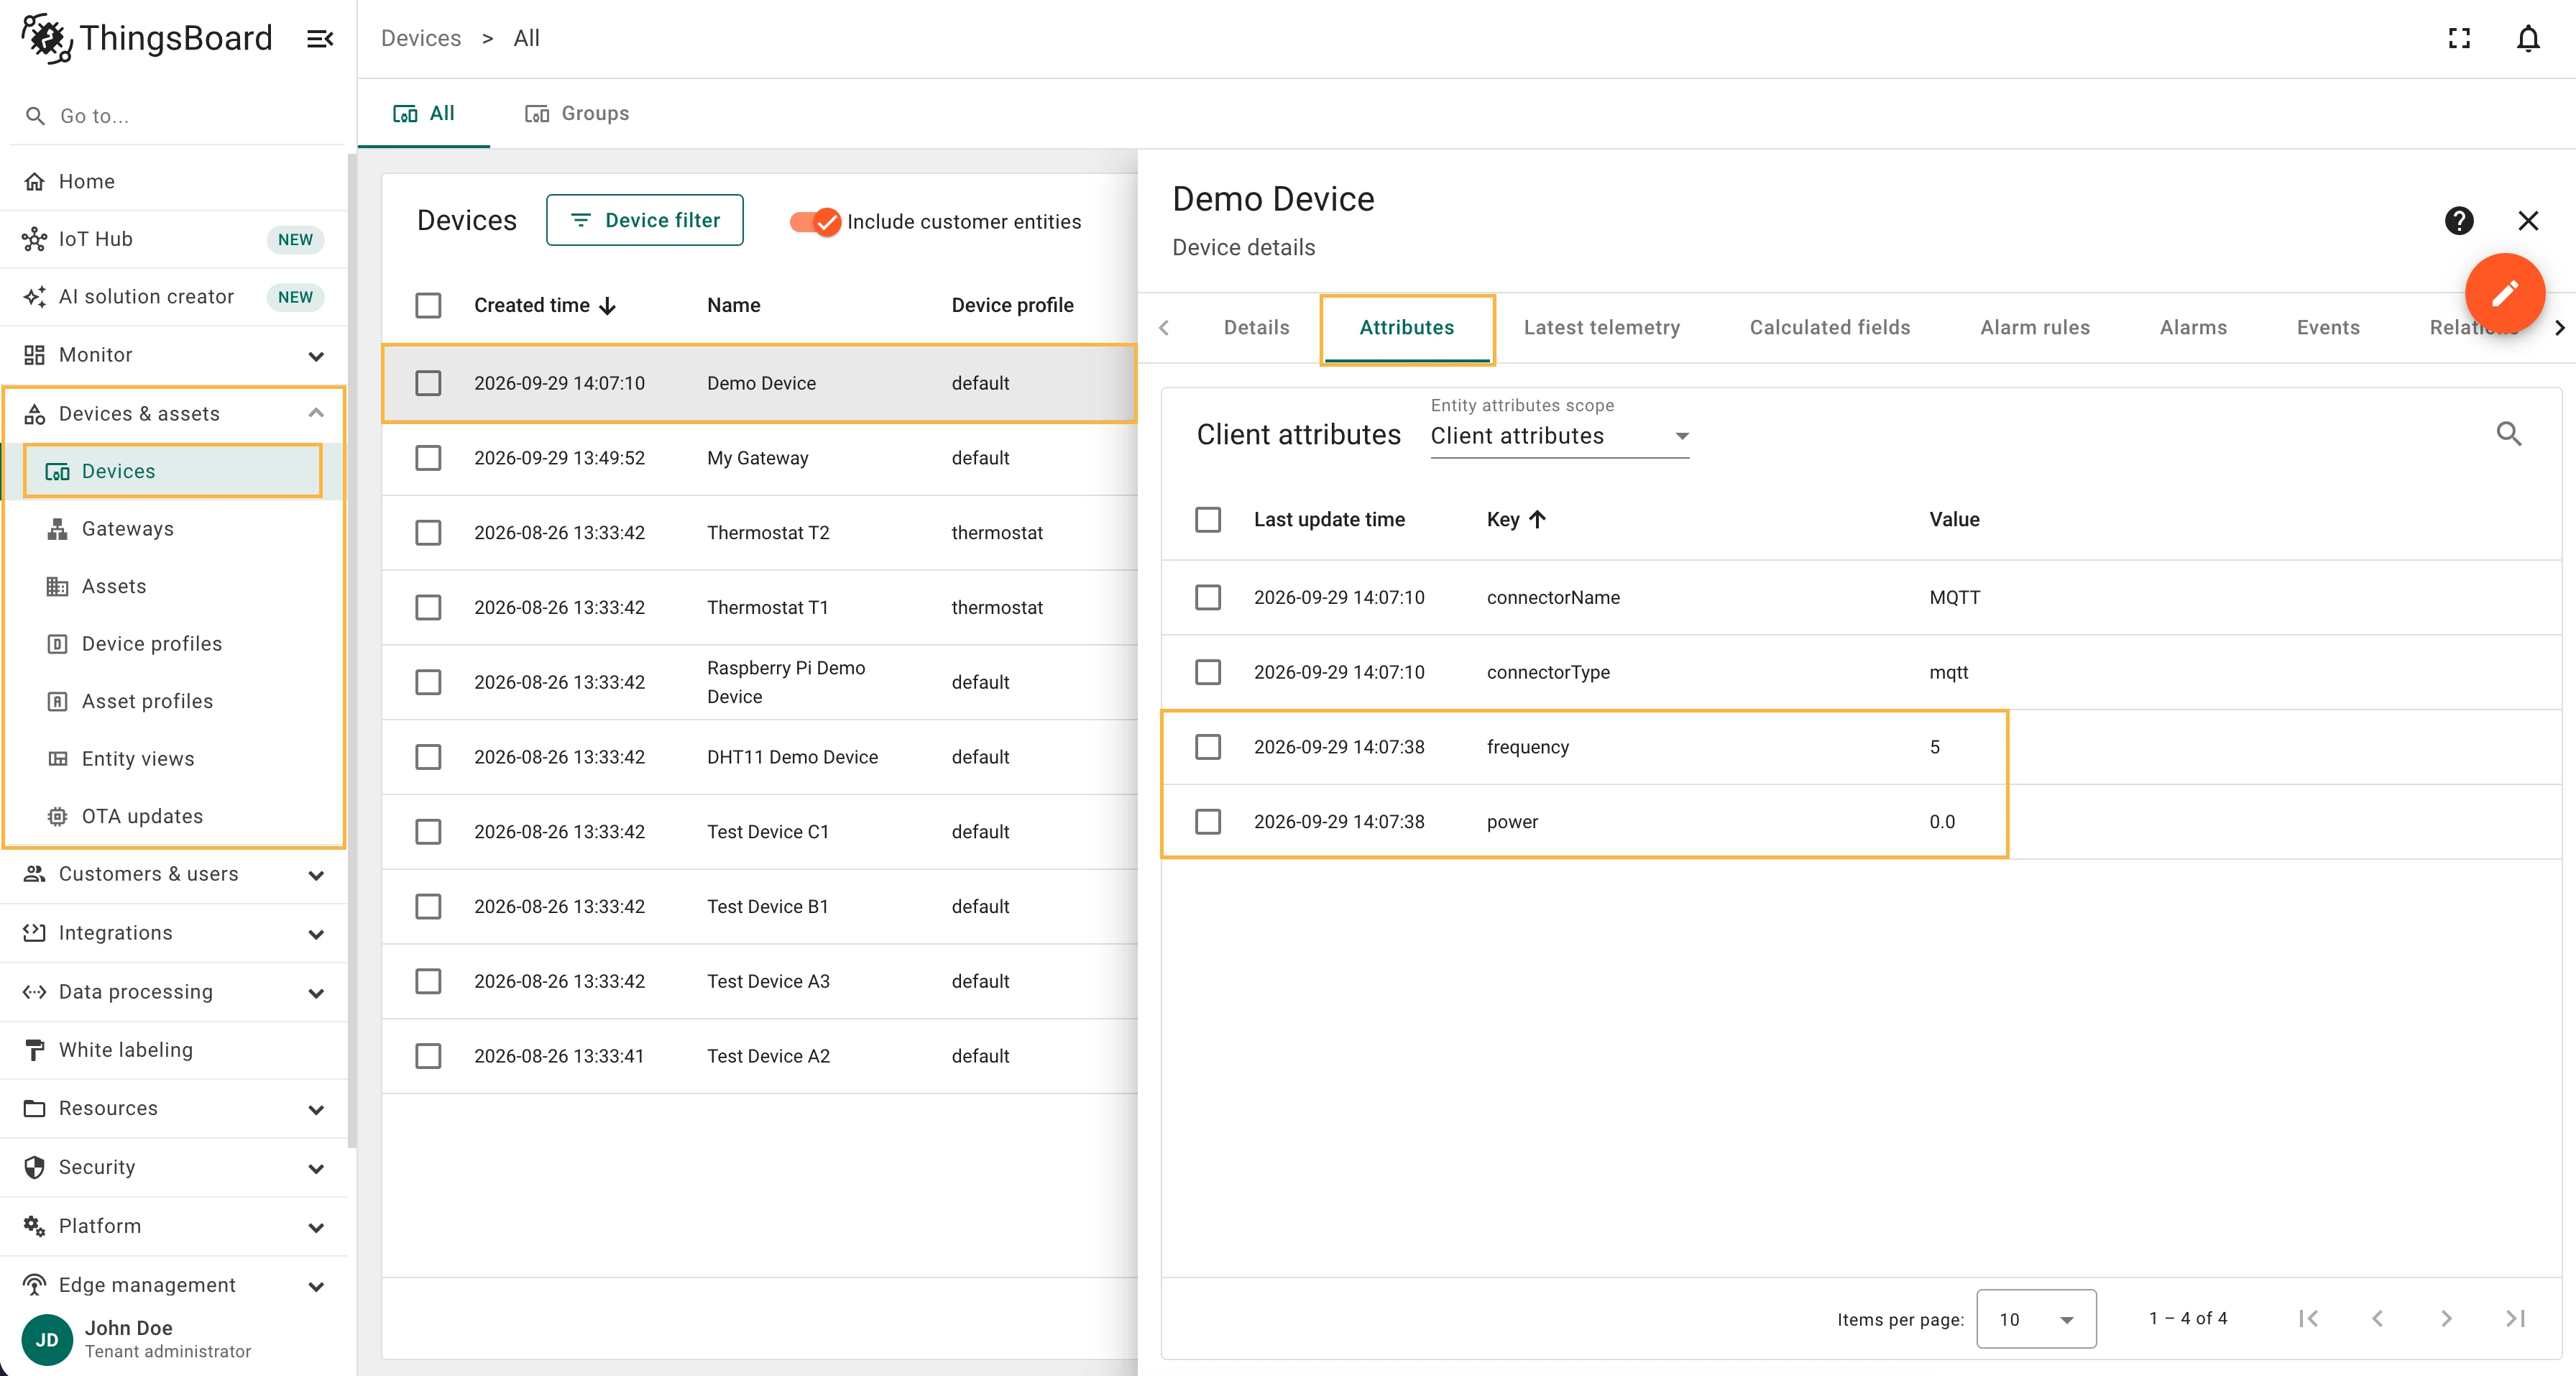
Navigate to the Devices & assets > Devices page and click on the created device. This will open the device details page. From there, switch to the Attributes tab to view the attributes that were configured in the connector.
-
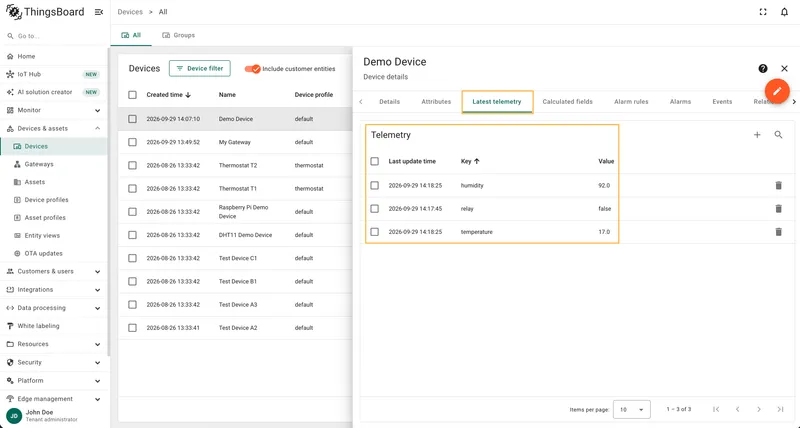
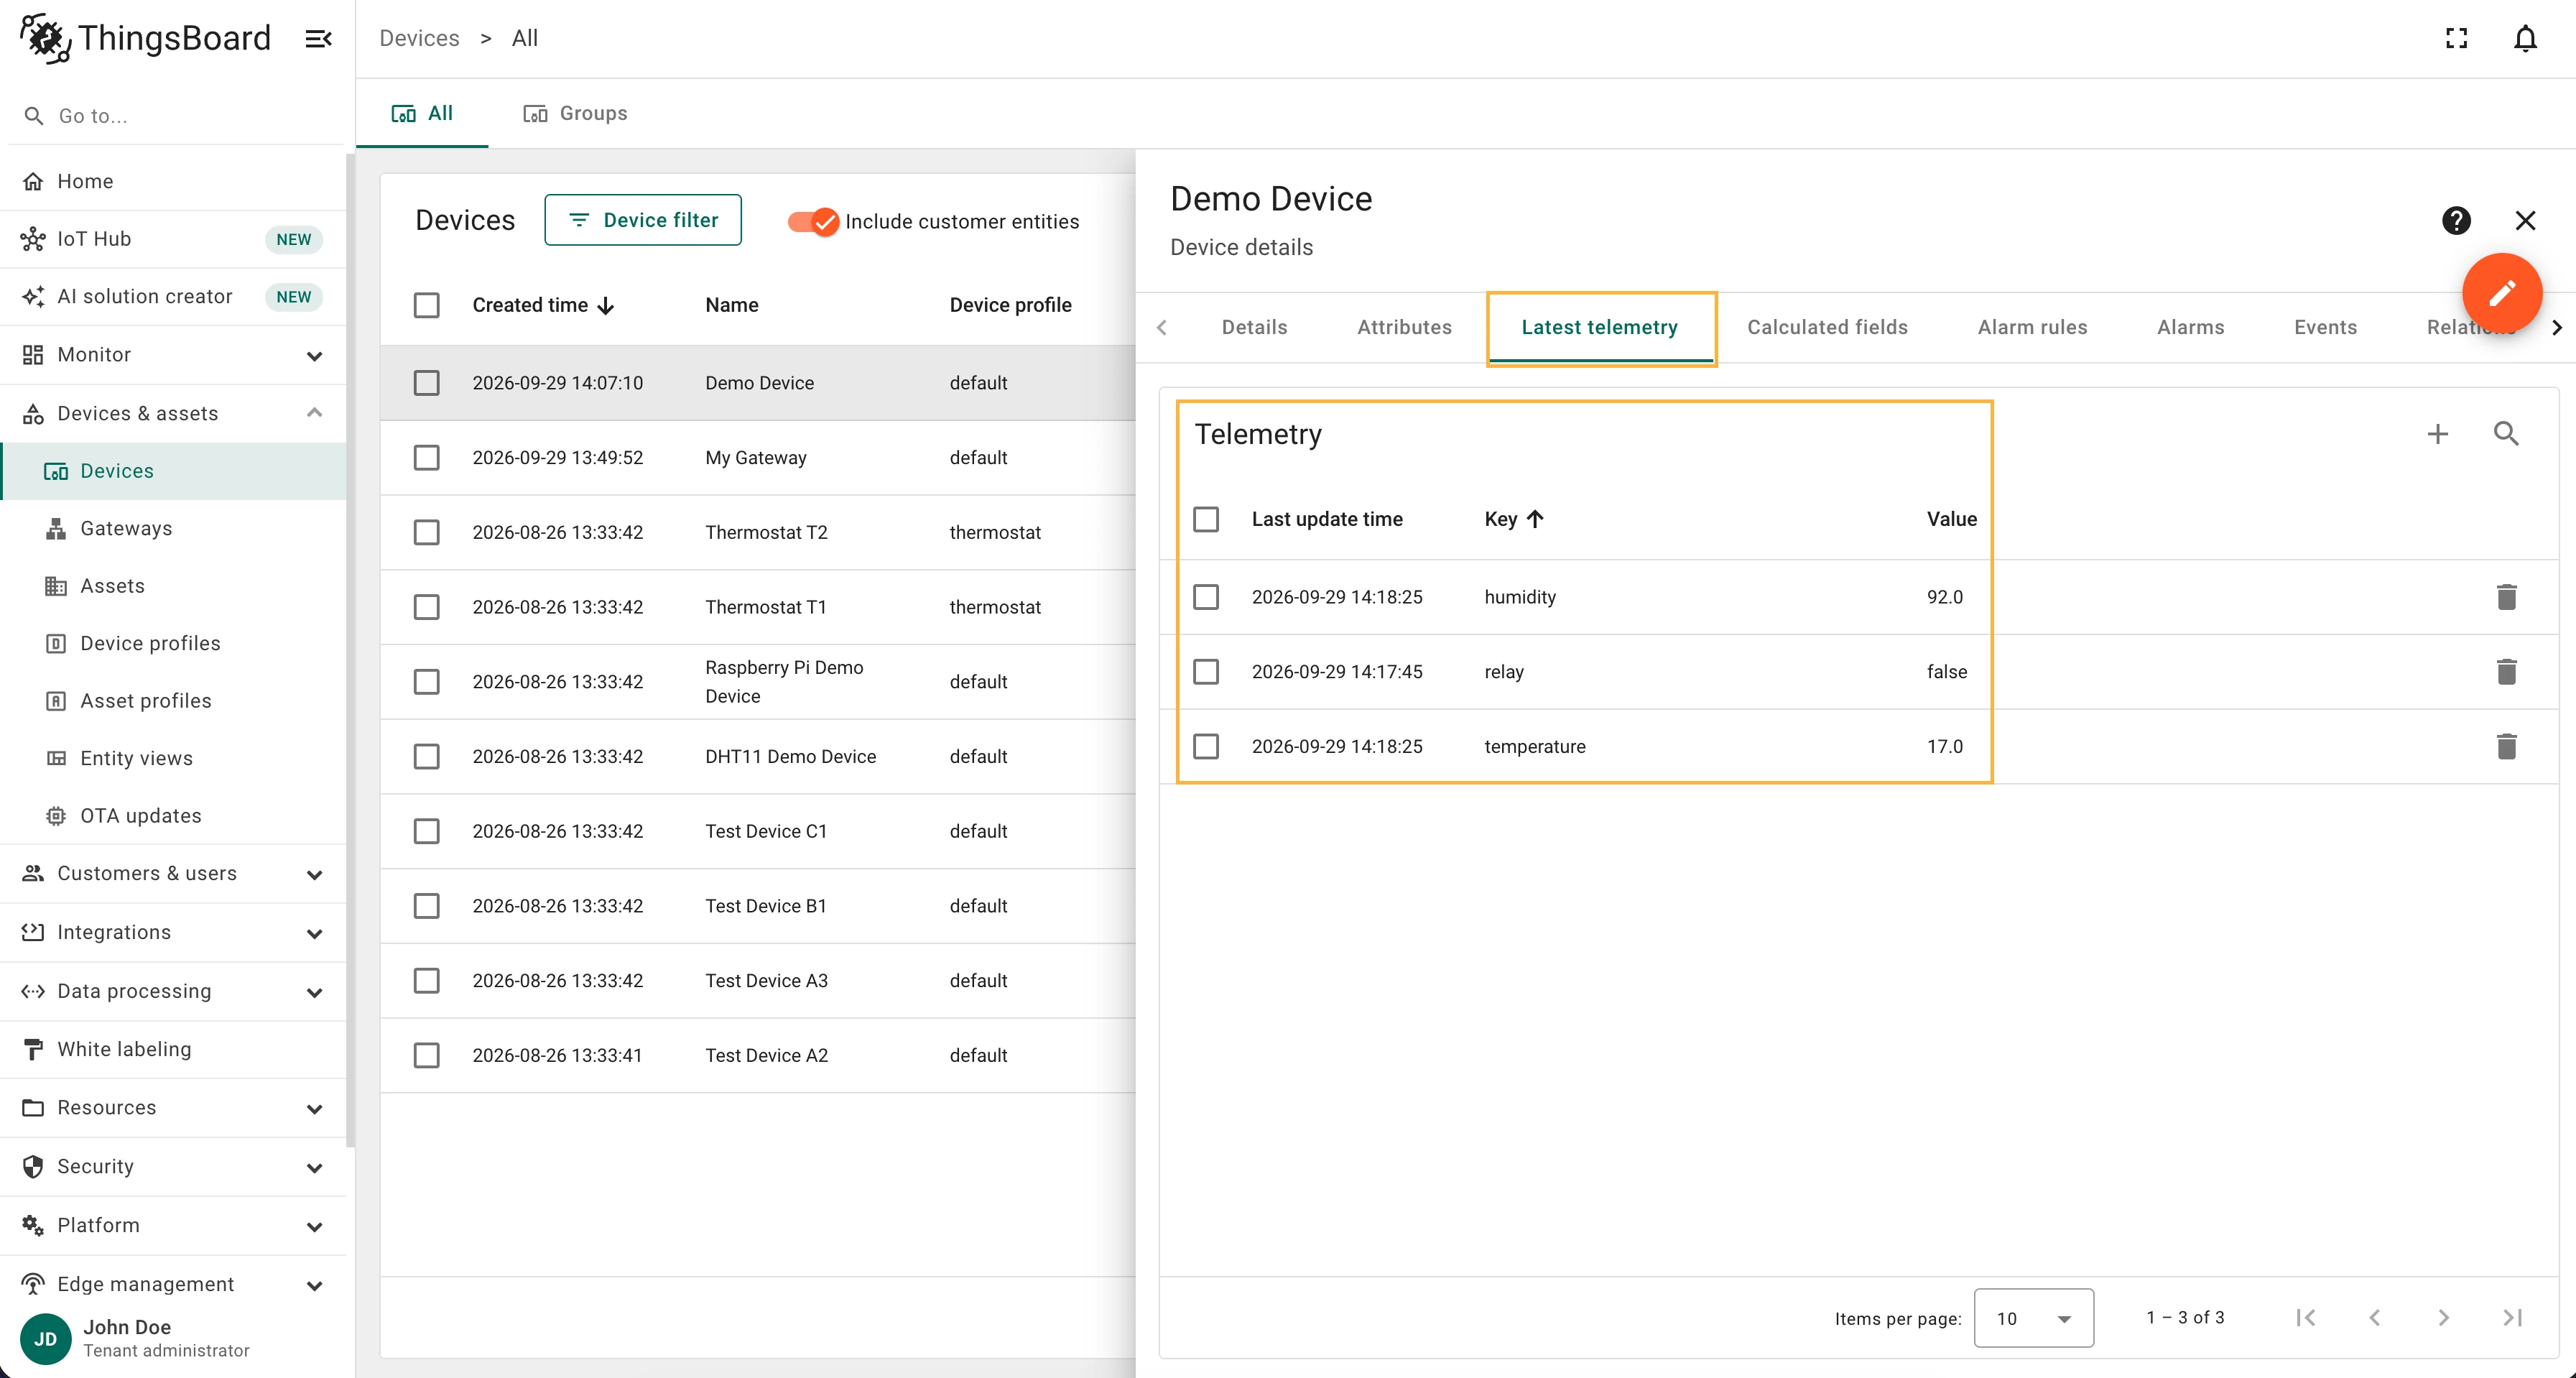
To view real-time telemetry data from the device, navigate to the Latest Telemetry tab. Here, you will find the telemetry data being sent by the device, including metrics like “humidity”, “temperature” and “relay”. This tab provides real-time device telemetry updates.
Congratulations! 🎉
You have successfully completed the Getting Started guide of the ThingsBoard IoT Gateway, created a gateway device, launched the gateway using Docker, configured a connector to connect to a local demo server, collected the data, and reviewed the received device data on ThingsBoard.
After the successful installation and configuration of your first connector, you can configure other connectors to connect to different devices. You can find more information about connectors in the following articles:
- MQTT connector
- OPC-UA connector
- Modbus connector
- S7 connector
- BLE connector
- Request connector
- REST connector
- CAN connector
- FTP connector
- Socket connector
- XMPP connector
- BACnet connector
- OCPP connector
- ODBC connector
- KNX connector
- SNMP connector
- Custom connector
You can read more about ThingsBoard IoT Gateway remote configuration.
Checklist
Section titled “Checklist”Was this helpful?