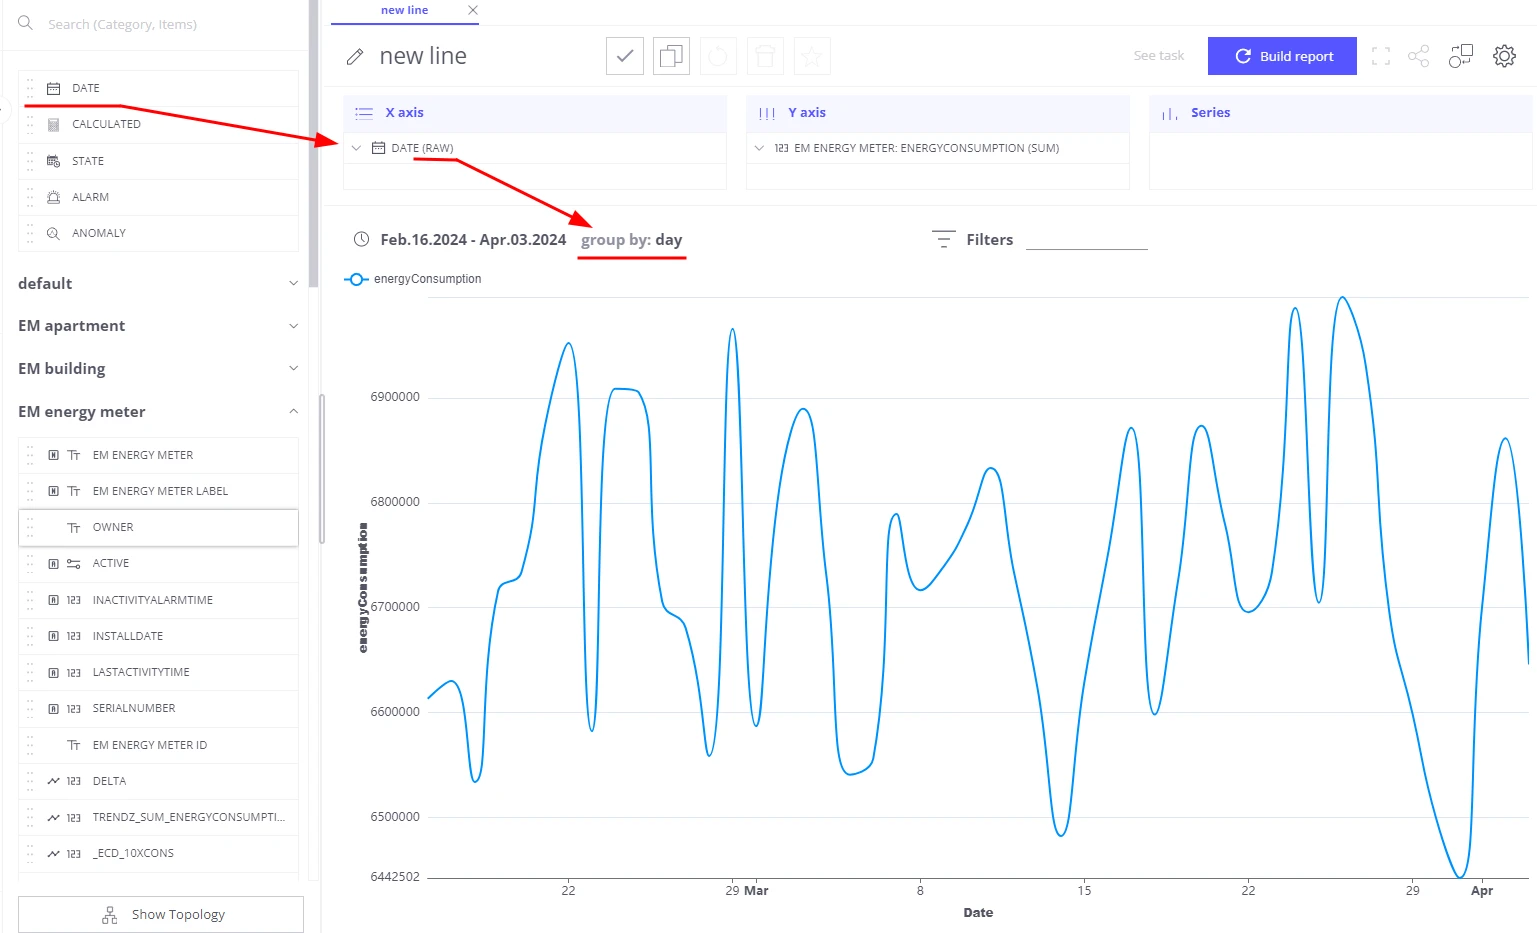
Grouping by Time
To show how data changes over time, drag the Date field from the left panel onto the X-axis section of a view. Trendz will split the selected time range into intervals and apply the configured aggregation function to the data in each interval. If a bucket contains no data, it is displayed as -.
RAW Mode
Section titled “RAW Mode”The default Date aggregation is RAW. In RAW mode the bucket size is not fixed in the view — instead, the user controls it at runtime using the Group By dropdown next to the time range picker.
  Time range: last 7 days   Group By: Day
  Mon     Tue     Wed     Thu     Fri     Sat     Sun  ╔═════╗ ╔═════╗ ╔═════╗ ╔═════╗ ╔═════╗ ╔═════╗ ╔═════╗  ║ avg ║ ║ avg ║ ║ avg ║ ║ avg ║ ║ avg ║ ║ avg ║ ║ avg ║  ╚═════╝ ╚═════╝ ╚═════╝ ╚═════╝ ╚═════╝ ╚═════╝ ╚═════╝
  Same view, Group By: Hour → 168 buckets instead of 7
Available Group By values:
| Value | Bucket size |
|---|---|
| Month | One bucket per calendar month |
| Week | One bucket per calendar week |
| Day | One bucket per calendar day |
| Hour | One bucket per hour |
| Minute | One bucket per minute |
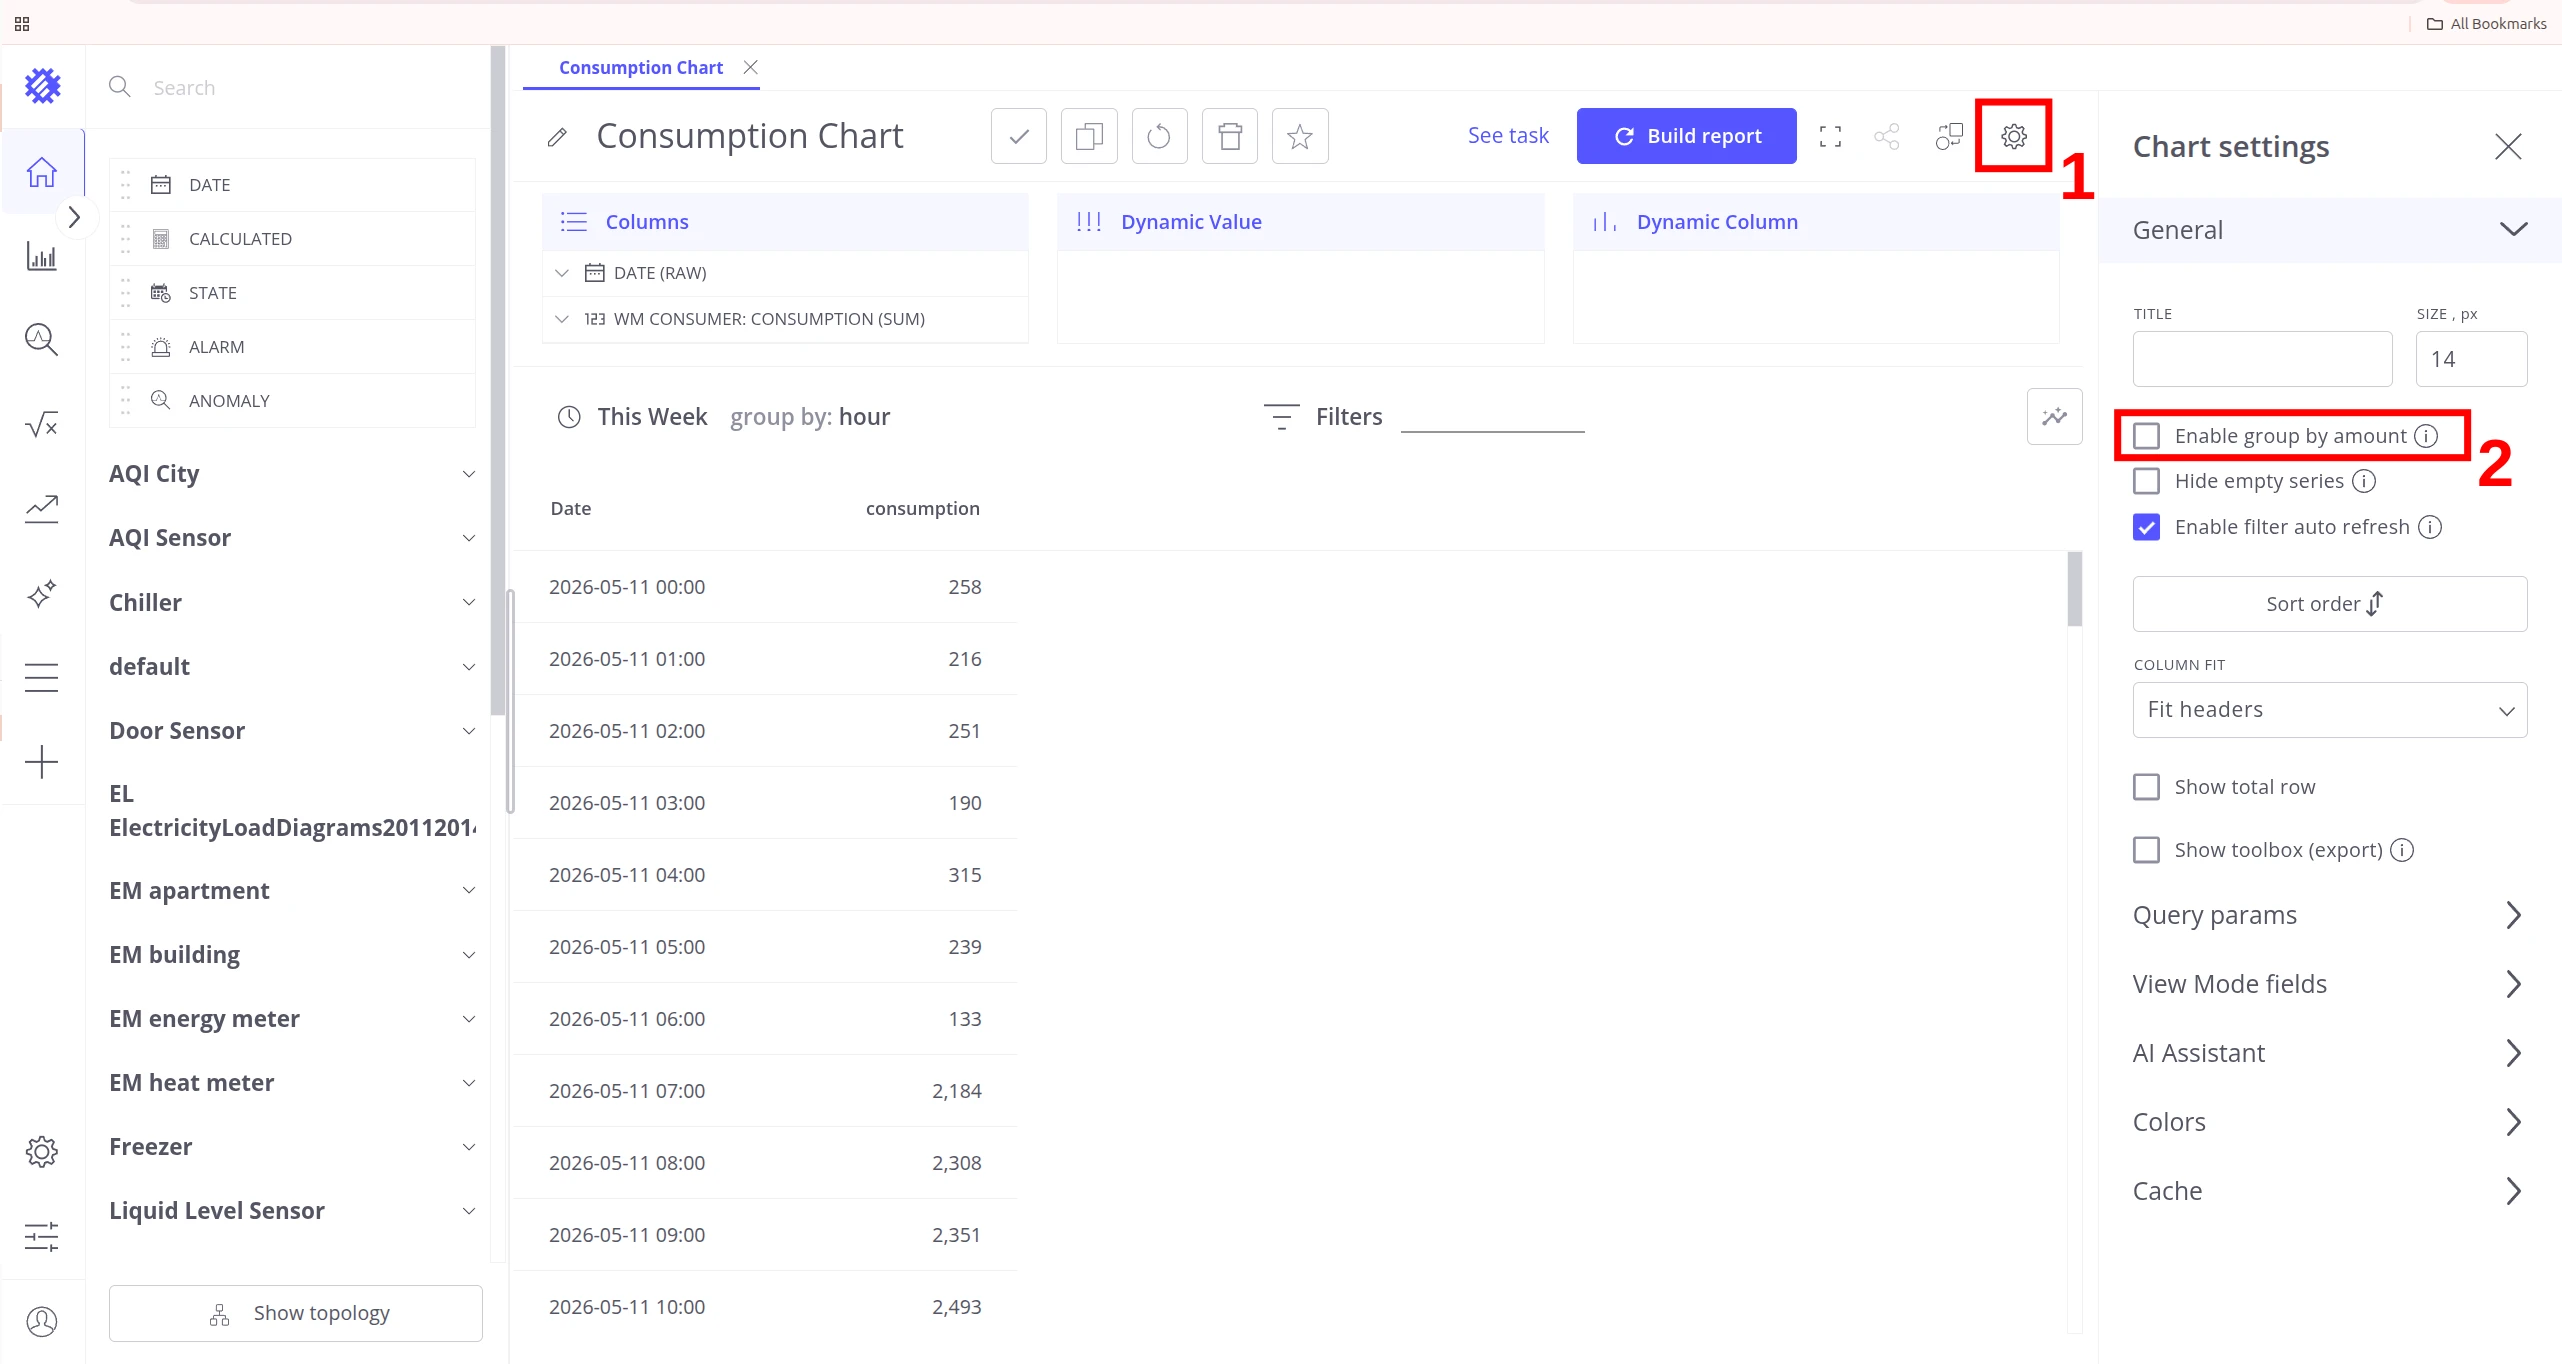
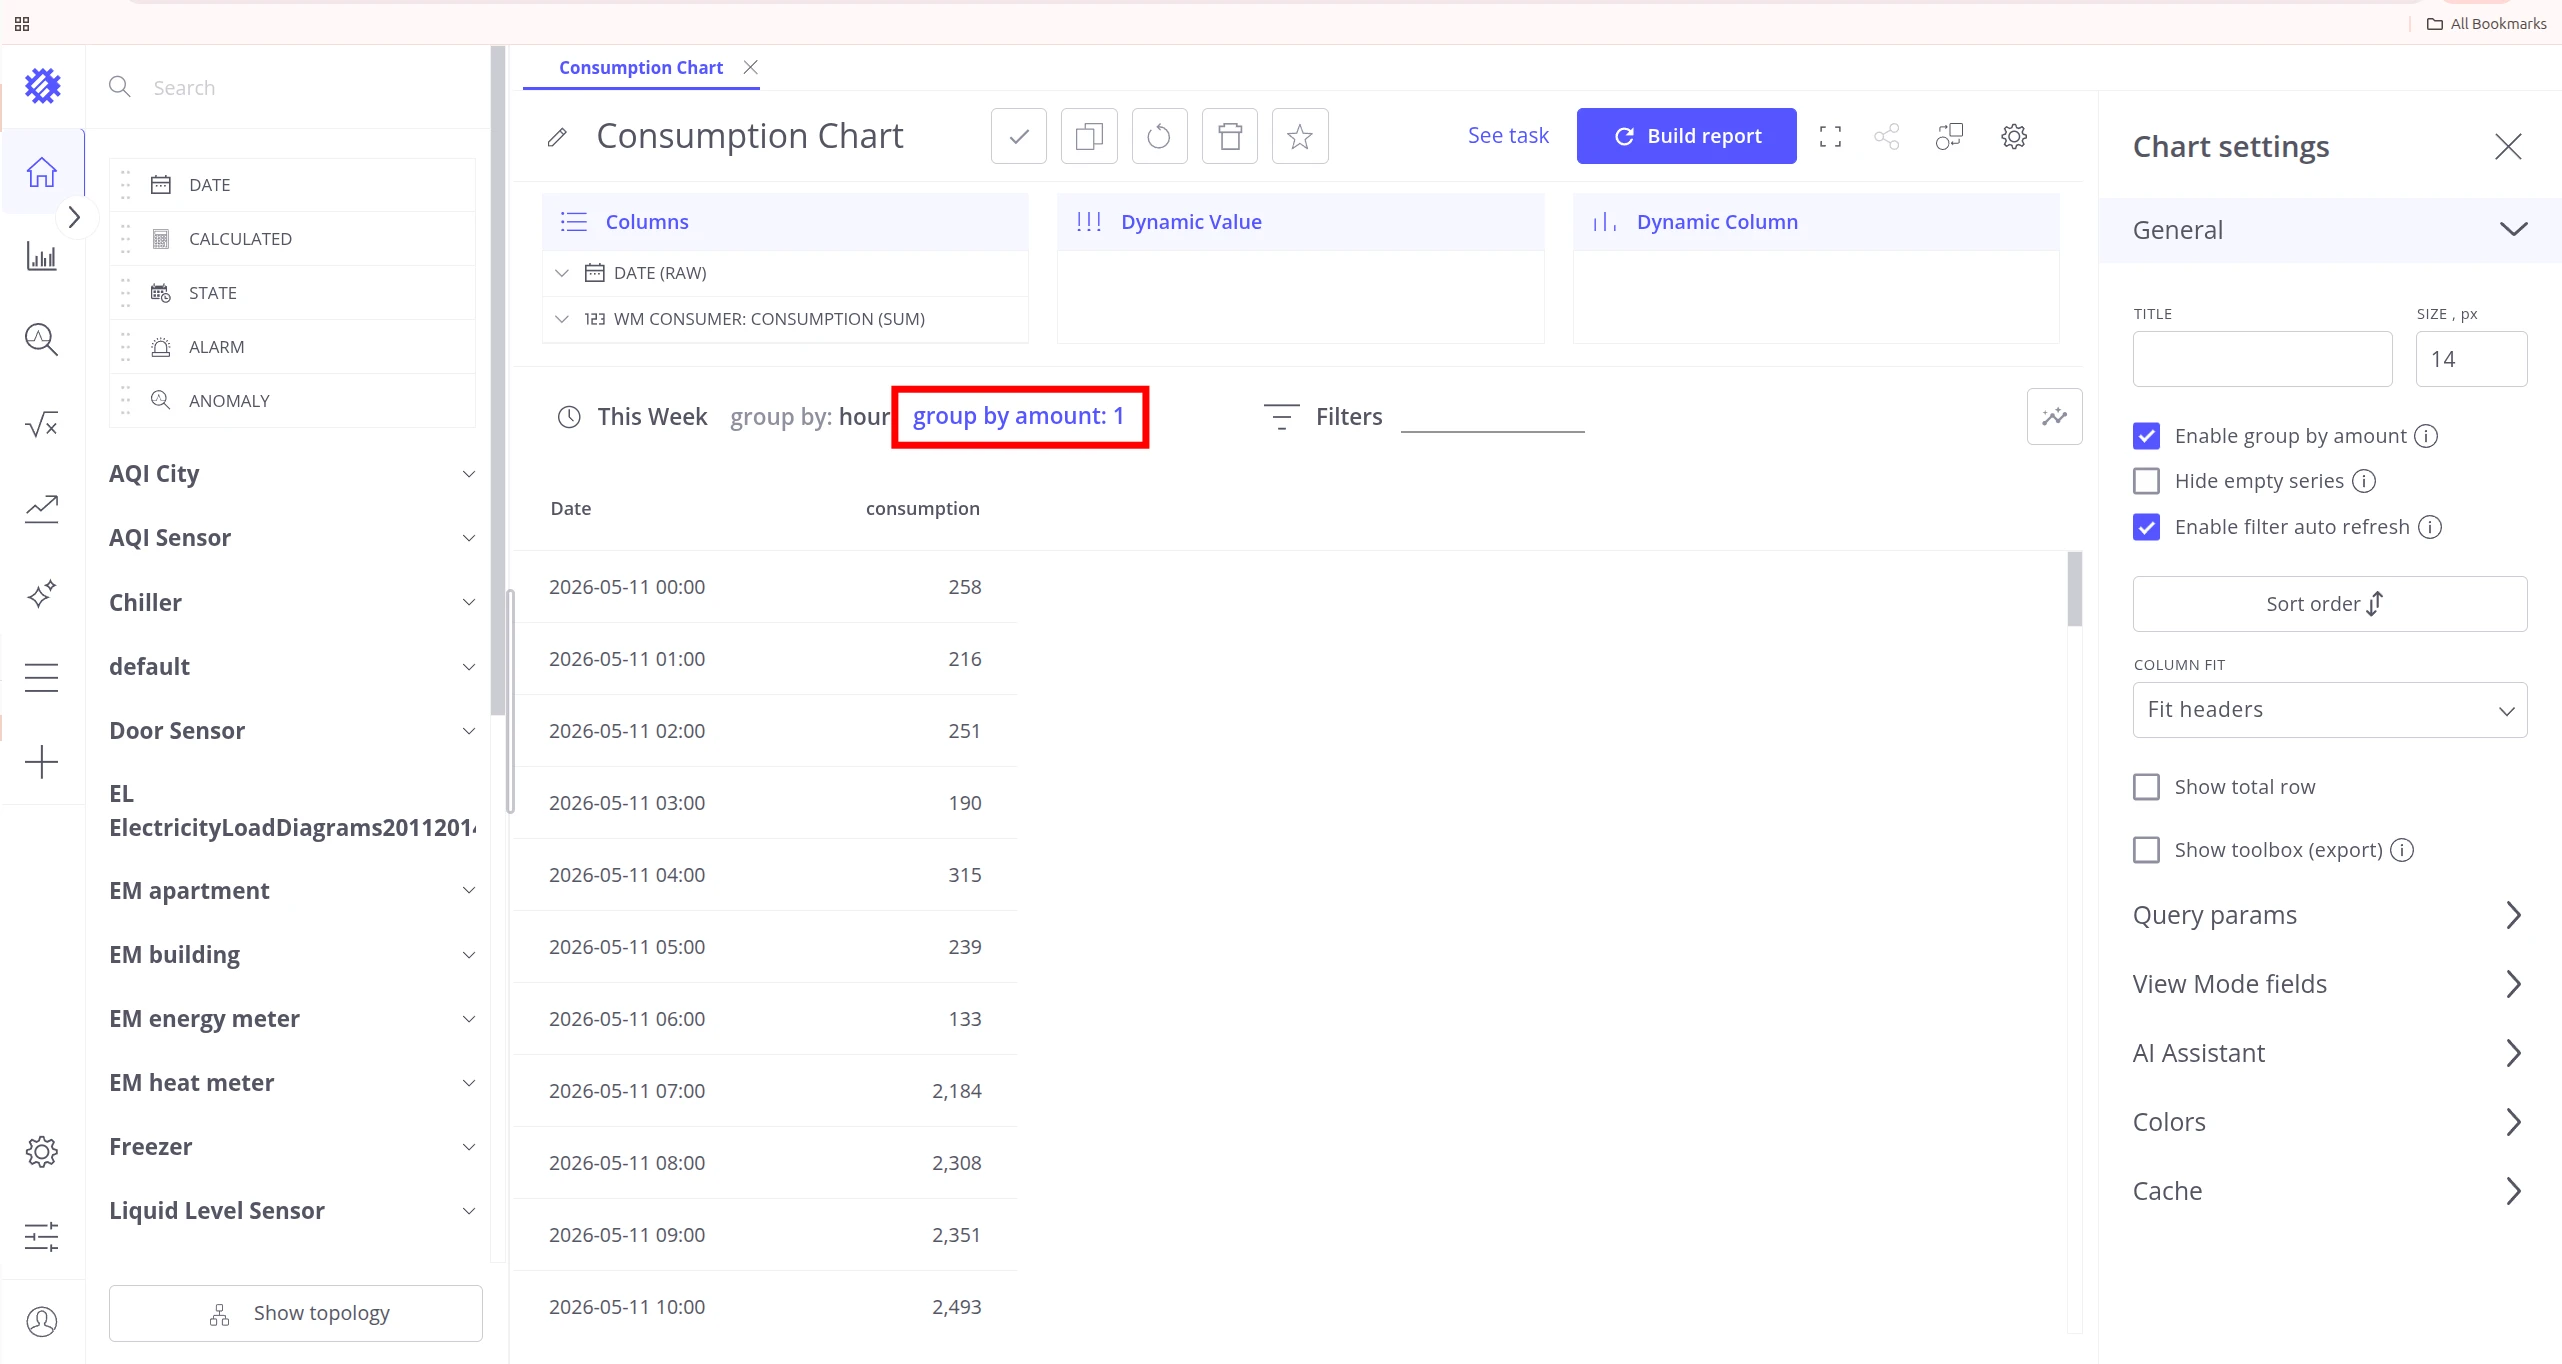
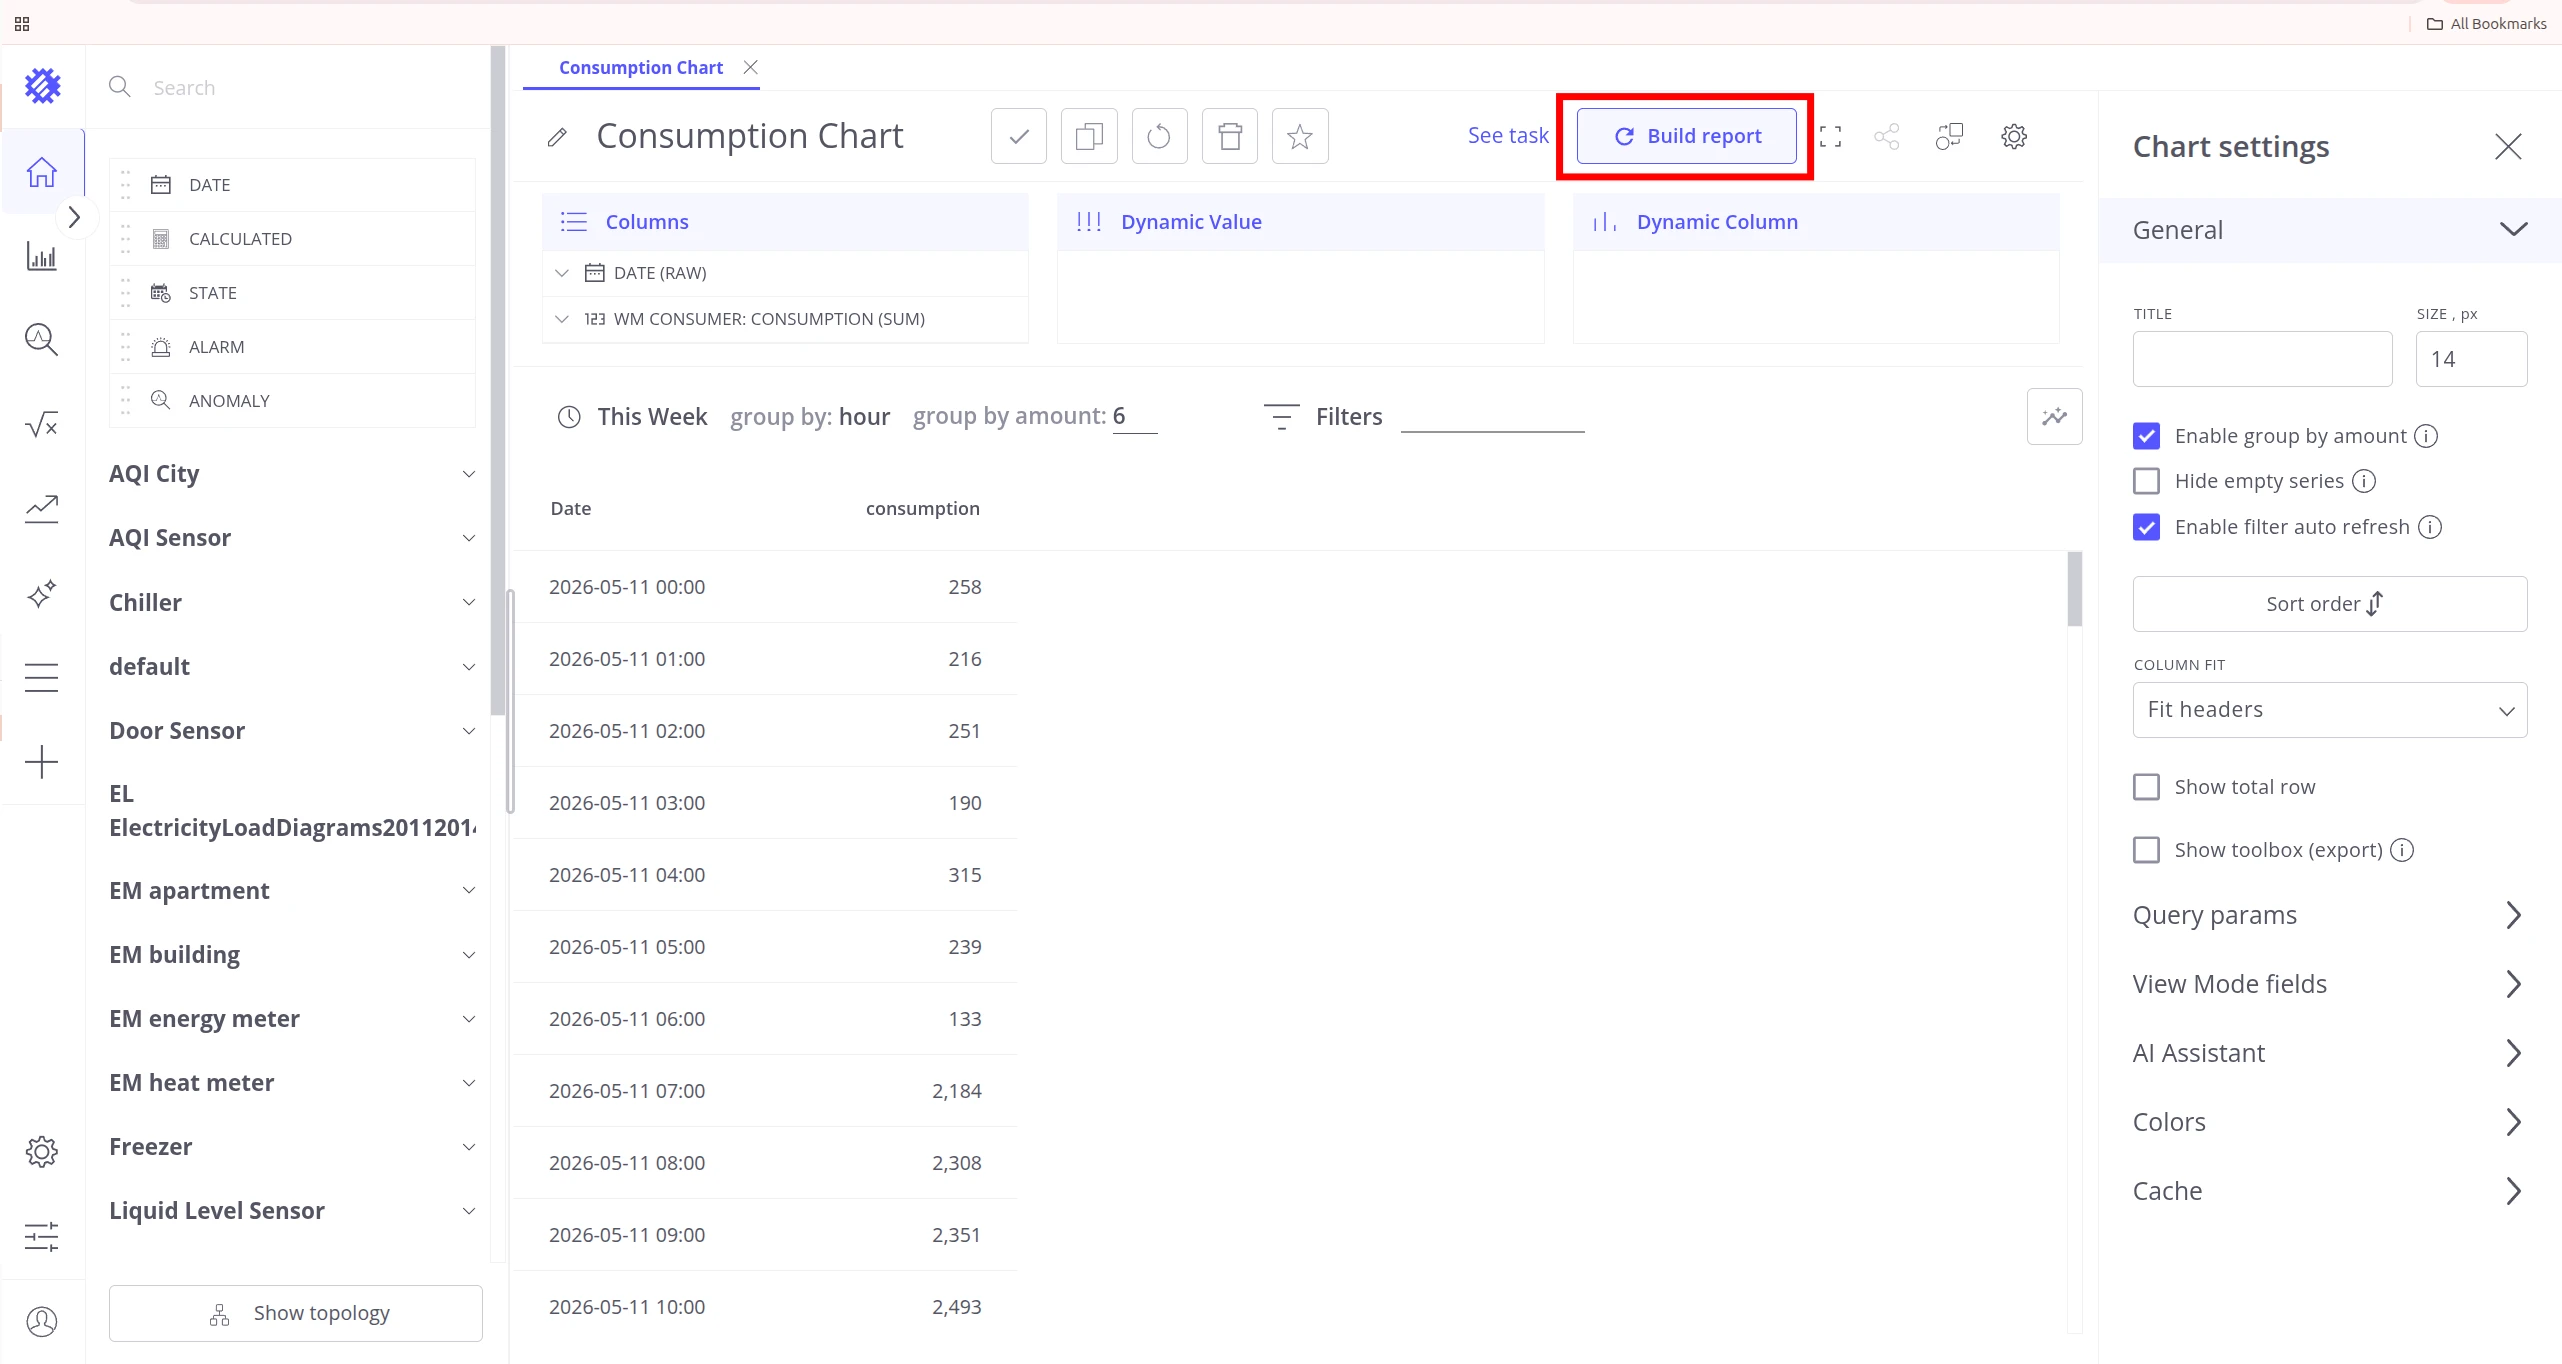
Group by amount
Section titled “Group by amount”By default the Group By dropdown produces one bucket per unit, like one bucket per hour or one bucket per day. To group several units into a single bucket, like every 6 hours or every 3 days, enable Group by amount in the view’s General settings. Once enabled, a second dropdown named group by amount appears next to the time-range picker. Its value is the multiplier applied to the Group By unit.
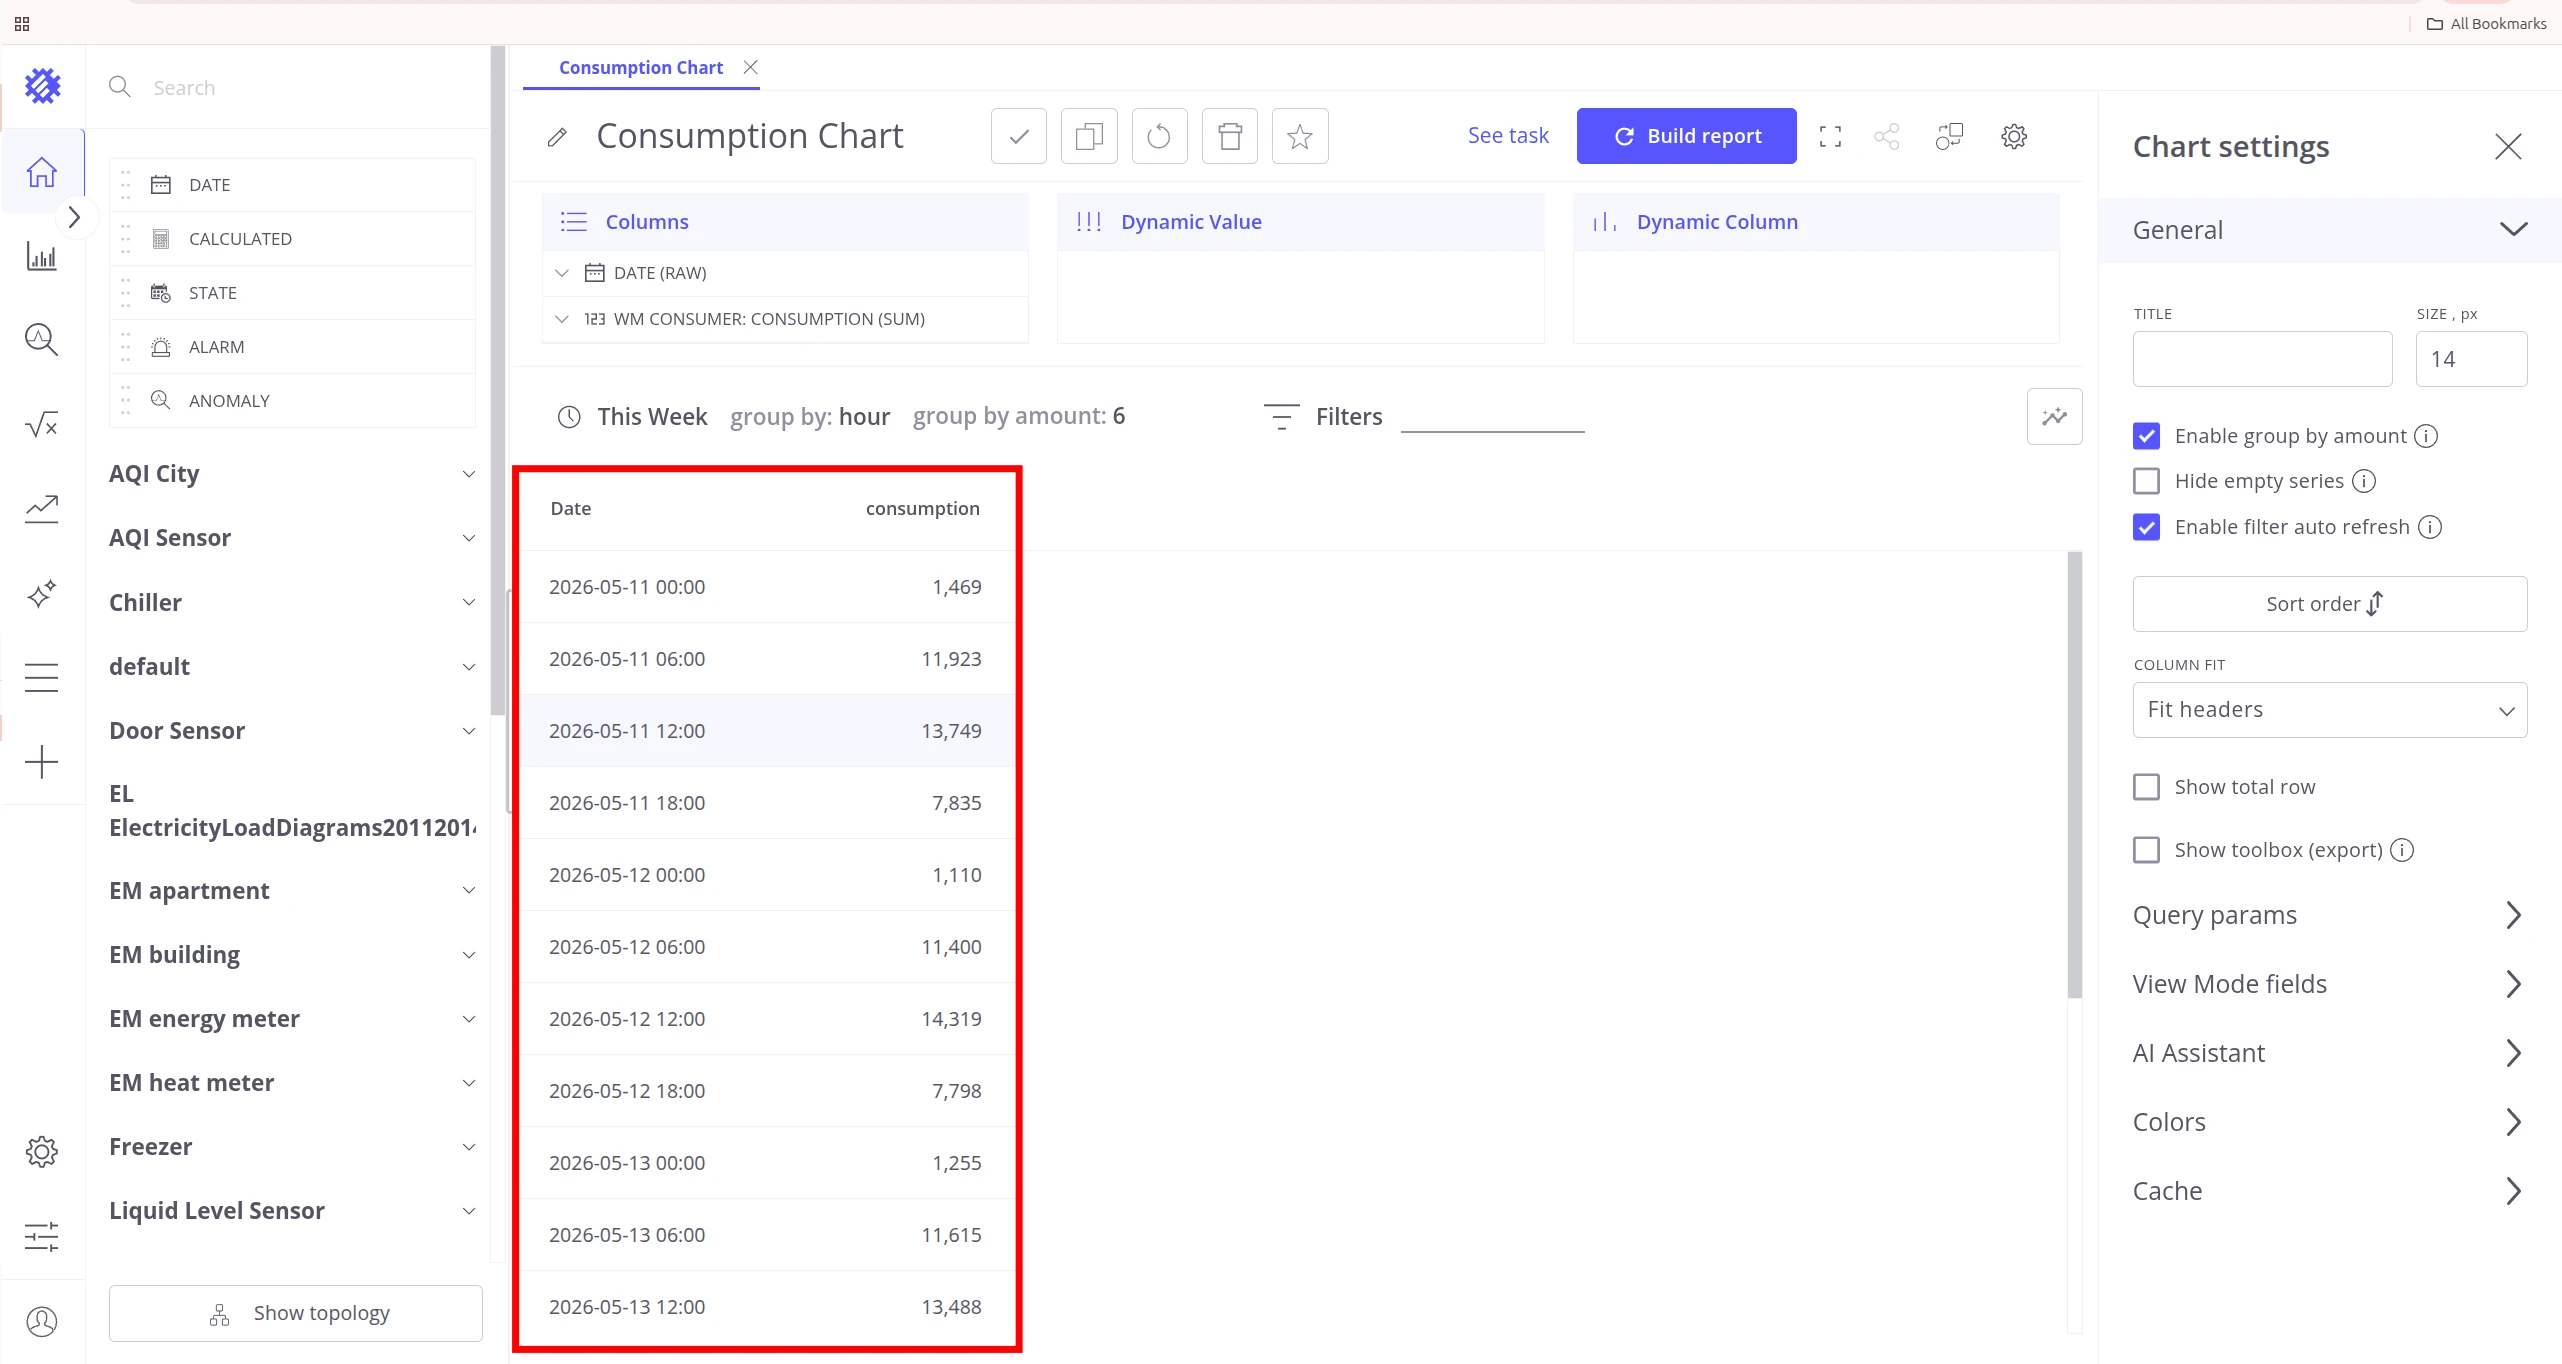
  Time range: last 7 days   Group By: Hour   Group by amount: 6
  ╔═══════════════╗ ╔═══════════════╗ ╔═══════════════╗  …  ║ 00:00 – 05:59 ║ ║ 06:00 – 11:59 ║ ║ 12:00 – 17:59 ║  …  ║      avg      ║ ║      avg      ║ ║      avg      ║  …  ╚═══════════════╝ ╚═══════════════╝ ╚═══════════════╝  …
  168 hourly buckets → 28 six-hour buckets
Group by amount is available only for RAW mode and only when the Group By dropdown is visible. After changing the amount, click Build report to refresh the view.
Fixed Aggregation Options
Section titled “Fixed Aggregation Options”For more precise control you can fix the grouping directly in the view configuration by selecting a specific Date aggregation option. The bucket size is then constant regardless of the selected time range, which is useful for cross-period comparisons (e.g. average consumption by hour-of-day across an entire month).
| Option | Groups data by | Example label |
|---|---|---|
| RAW | User-controlled via Group By dropdown | — |
| MINUTE | Minute of the hour (0–59) | 45 |
| HOUR | Hour of the day (0–23) | 23 |
| DAY | Day of the week (Mon–Sun) | Monday |
| DATE | Day of the month (1–31) | 15 |
| FULL_MINUTE | Exact date and minute | 2020-03-01 23:45 |
| FULL_HOUR | Exact date and hour | 2020-03-01 23 |
| FULL_DATE | Exact calendar date | 2020-03-01 |
| FULL_QUARTER | Exact year and quarter | 2020-Q1 |
| START_OF_WEEK | First day (Monday) of the calendar week | 2020-03-01 |
| WEEK_OF_YEAR | Week number within the year (1–56) | 10 |
| WEEK_OF_MONTH | Week number within the month (1–6) | 2 |
| MONTH | Month of the year (Jan–Dec) | March |
| YEARMONTH | Year and month combined | 2020-Feb |
| QUARTER | Quarter of the year (1–4) | 1 |
| YEAR | Calendar year | 2020 |
Day and week boundaries are calculated using your local browser timezone.
For START_OF_WEEK and WEEK_OF_YEAR, the bucket label anchors to Monday of that week (or its week number) even if Monday falls outside the selected time range — only data within the selected range is aggregated under it.
Fixed vs. RAW
Section titled “Fixed vs. RAW”- Use RAW when the view should work across different time ranges and the user needs to zoom in or out by changing granularity.
- Use a fixed option (e.g. HOUR or DAY) when you want a pattern chart — for example, average energy use per hour-of-day or average temperature per day-of-week — regardless of how wide the time range is.
Was this helpful?