Calendar Heatmap
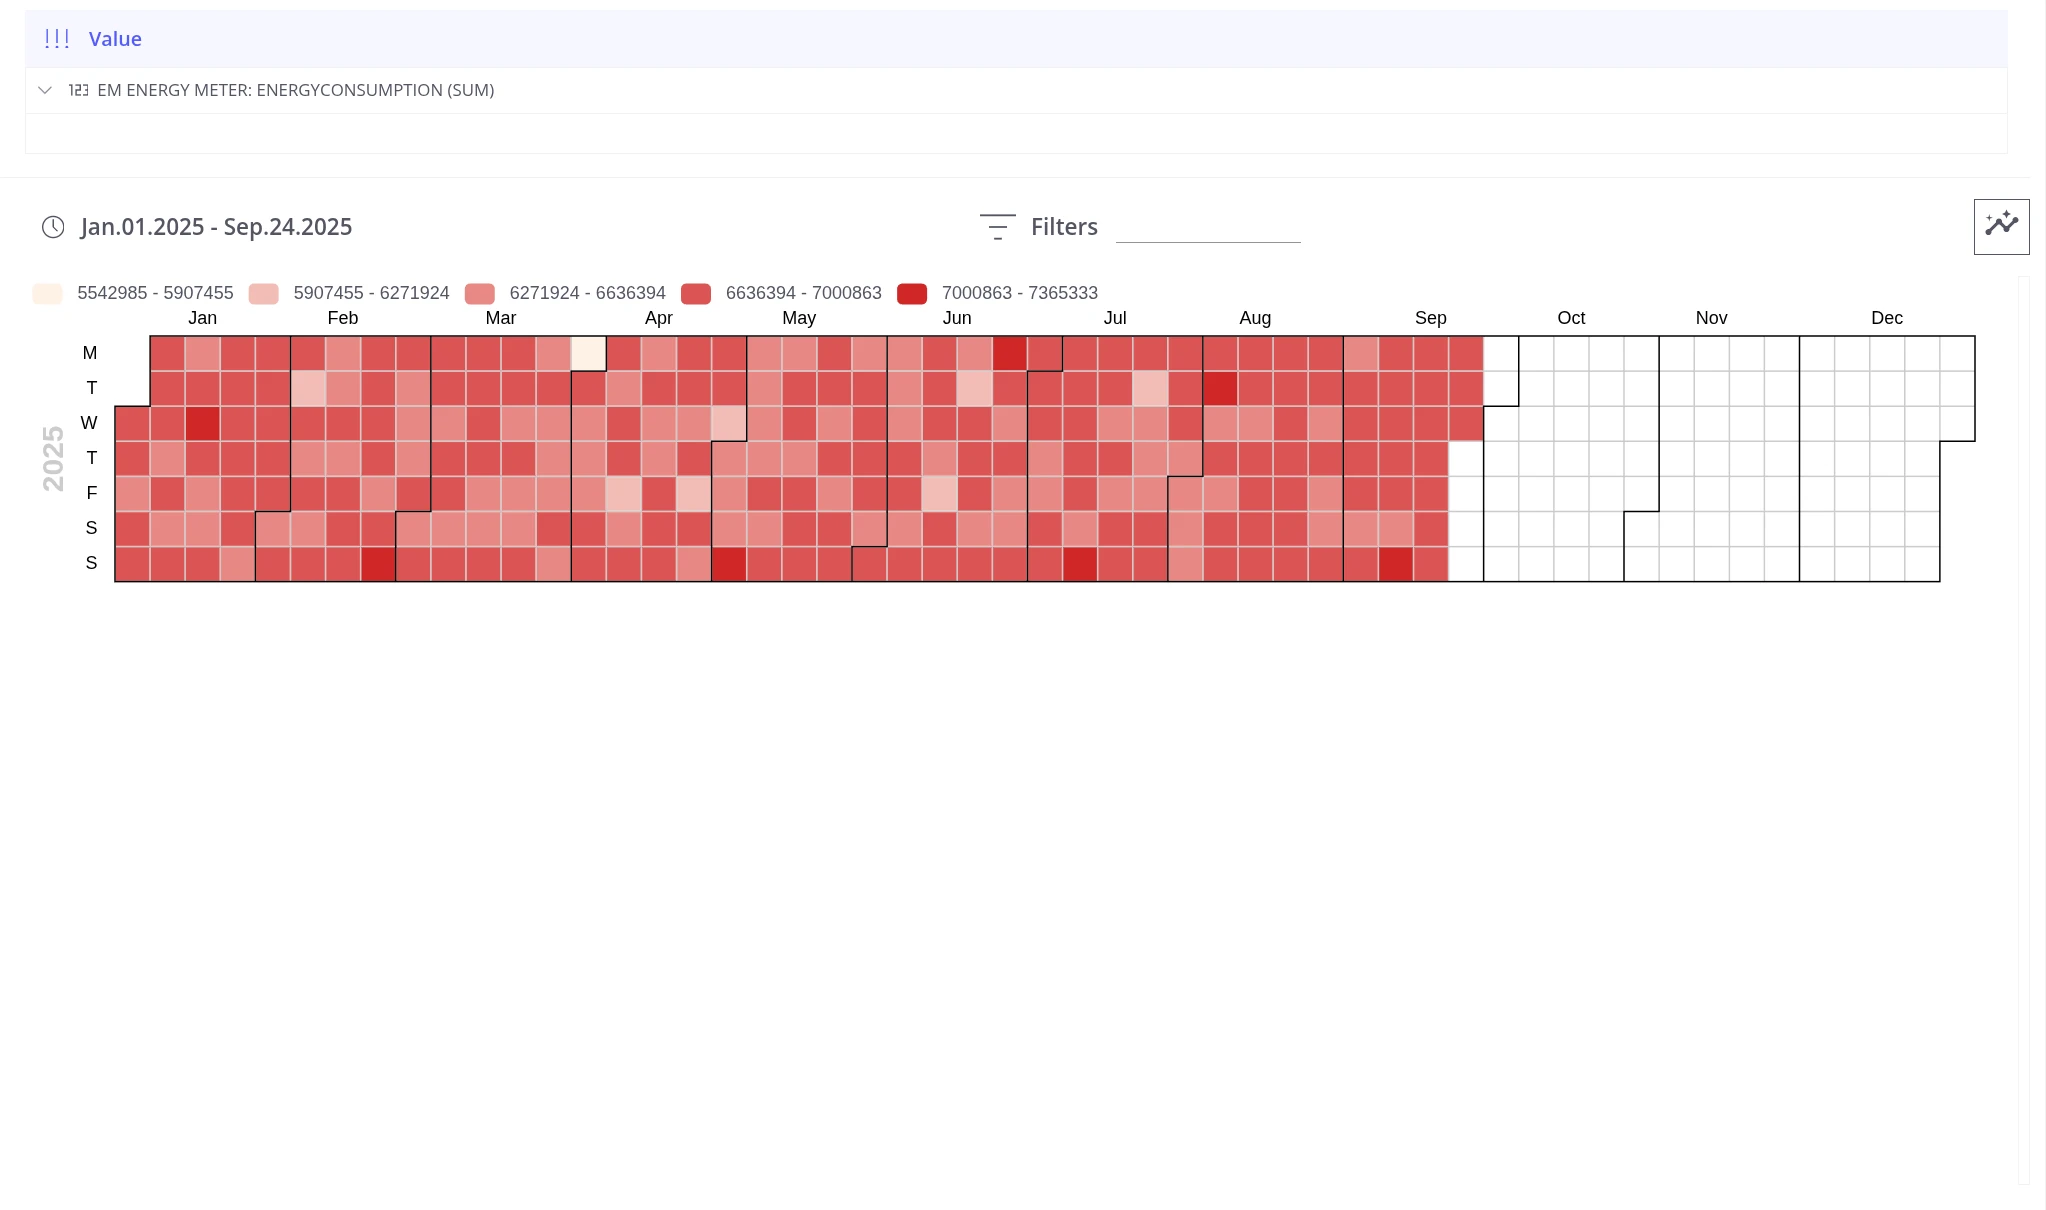
The Calendar Heatmap gives a day-by-day overview of how a metric changes over time. Each day is a colored cell — the color intensity reflects that day’s aggregated value, making seasonal patterns and anomalies visible at a glance. Hover over any cell to see the exact numeric value for that day.
The view supports any date range: a single year is displayed as a standard calendar grid; multiple years are stacked as separate rows. The start date can be set to any month — it is not limited to January.
Single field
Section titled “Single field”Drop one metric (telemetry, state, or calculated field) into the Value section and press Build Report. Multiple readings within a day are aggregated — configure the aggregation function (SUM, AVG, MAX, etc.) in the field settings. Days with no data are left blank.
Adjust the color scale, aggregation, and other display options in View Settings.
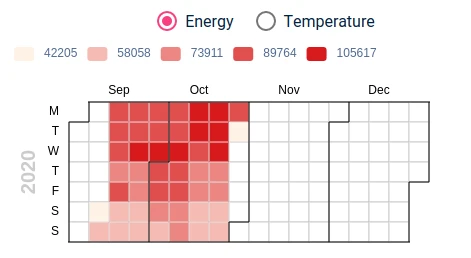
Multiple fields
Section titled “Multiple fields”Add more than one field to the Value section. Trendz renders a radio-button selector above the calendar so the viewer can switch between fields without rebuilding the view.
Select-date action
Section titled “Select-date action”When the calendar is embedded in a ThingsBoard dashboard, clicking a day cell can drive other widgets on the same dashboard by updating the shared time range and/or navigating to a new dashboard state.
-
Add the Trendz calendar view widget to a ThingsBoard dashboard.
-
Open widget edit mode and go to the Actions tab.
-
Click Add action.
-
Set Action source to date-selected.
-
Set Type to Custom action and paste the following function:
var newTimeRange = {aggregation: {limit: 30000,type: 'NONE',},hideAggInterval: false,hideAggregation: false,hideInterval: false,history: {historyType: 1,fixedTimewindow: {startTimeMs: additionalParams.startTs,endTimeMs: additionalParams.endTs,},},selectedTab: 1,};// Apply the selected date as the dashboard time rangewidgetContext.dashboard.dashboardTimewindowChangedSubject.next(newTimeRange);// Navigate to a new dashboard state with the selected entity contextwidgetContext.stateController.updateState('consumption_details',additionalParams.params,); -
Save the action and the widget.
When a day cell is clicked, this action sets the dashboard time range to that day and navigates to the consumption_details dashboard state, so all other widgets automatically refresh to show data for the selected date.
Switch-field action
Section titled “Switch-field action”When multiple fields are added to Value, Trendz emits an event whenever the user switches the active field using the radio buttons. You can bind a widget action to this event.
- Add the Trendz calendar view widget to a ThingsBoard dashboard.
- Open widget edit mode and go to the Actions tab.
- Click Add action.
- Set Action source to changed-radio-button.
- Configure the action as needed (navigate, update state, custom function, etc.).
- Save the action and the widget.
The name of the newly selected field is available as additionalParams.radioButton inside a custom action function.
Was this helpful?