- Function Tab
- Input Tab
- Output Tab
- Tasks Tab
- Examples
- Saving and Editing Calculations
- Using Calculations in View Fields
- Disabled Calculation
- Next Steps
Calculated fields are a powerful feature in Trendz for KPI monitoring and prediction. They allow you to apply statistical functions and create new data items based on your input data, all while processing calculations on the fly. This ensures that no data in the ThingsBoard database is damaged or subjected to additional load. Trendz offers a robust tool for creating and managing these calculated fields, enabling complex calculations and custom formulas for data analysis and visualization. Additionally, you can store your calculations as telemetry in ThingsBoard, enhancing the utility and integration of your data.
To access the calculated fields tool, click on the icon √x labeled “Calculation Fields” located on the left side of the workspace.
Within this section, a table lists all created calculated fields, along with key details. You can open, modify, or perform other actions on any of these fields. To create a new calculated field, click the “Create Calculation Field” button.

Function Tab
The Function tab is where you configure parameters that affect data calculations. Below is a breakdown of each option:
KEY: The identifier under which the calculated telemetry data is saved in ThingsBoard with prefix _ECD_. (Required)
ENTITY: The business entity to which this calculated field is linked. Affects entity settings, visualization, and filters. (Required)
LANGUAGE: The scripting language for the calculation function. Choose between JavaScript (default) and Python.
- JavaScript: Uses ECMAScript 5.1 for writing transformation functions.
- Python: Supports Python 3.8 and libraries such as Flask, NumPy, Pandas, etc.
GROUPING INTERVAL: Time interval for data grouping (e.g., hour, day, week, month).
FIELD TYPE:
- Simple: Processes one value at a time.
- Batch: Works with the entire raw telemetry array.
AGGREGATION: Method for data aggregation, including options like AVG, SUM, LATEST, MIN, MAX, COUNT, UNIQ, etc.
Aggregation function applied to a grouped dataset. Find more details about Aggregation in this article
Fill Gap: Handles missing telemetry data with different methods, which are selected in the TIME UNIT and STRATEGY settings.
TIMERANGE STRATEGY: Determines data loading strategy during refresh tasks:
- Dynamic Strategy: Loads new data since the last calculation.
- Fixed Strategy: Uses a predefined time range for each execution.
For details on writing functions for Calculated Fields, refer to the corresponding documentation section. Choose to work with aggregated or raw data by enabling batch mode as needed.

Input Tab
The Input section allows you to define and understand the data that will be used in your calculations. Here’s a breakdown of each field:
Data Field:
- Real Data: Displays read-only input data based on specified parameters.
- Manual: Allows custom data input for testing. Manual data entries can be deleted, copied, or modified. Editable fields are highlighted with a gray background.
Main Fields:
- startTs (Start Timestamp): Defines the calculation’s start period.
- endTs (End Timestamp): Defines the calculation’s end period.
- groupBy: Sets the time interval for data grouping.
- tzName (Time Zone Name): Selects the desired time zone.
- zOffsetMs (Time Zone Offset in Milliseconds): Adjusts data according to the local time zone.
This setup makes sure the data is defined correctly, allowing for accurate calculations and useful insights.

Output Tab
When you click “Run test,” you will access the Output tab, featuring the following modes:
Function: Modify previously defined calculations for testing.
Output Data: View calculation results (simple values or arrays). Results can be displayed as a table or line chart.
Logs: Shows logs similar to those in the browser console.

Tasks Tab
The Tasks tab provides an overview of all tasks initiated for a specific calculation, including their status (completed, in progress, or pending). For more detailed task management information, refer to the corresponding section in the documentation.
Examples
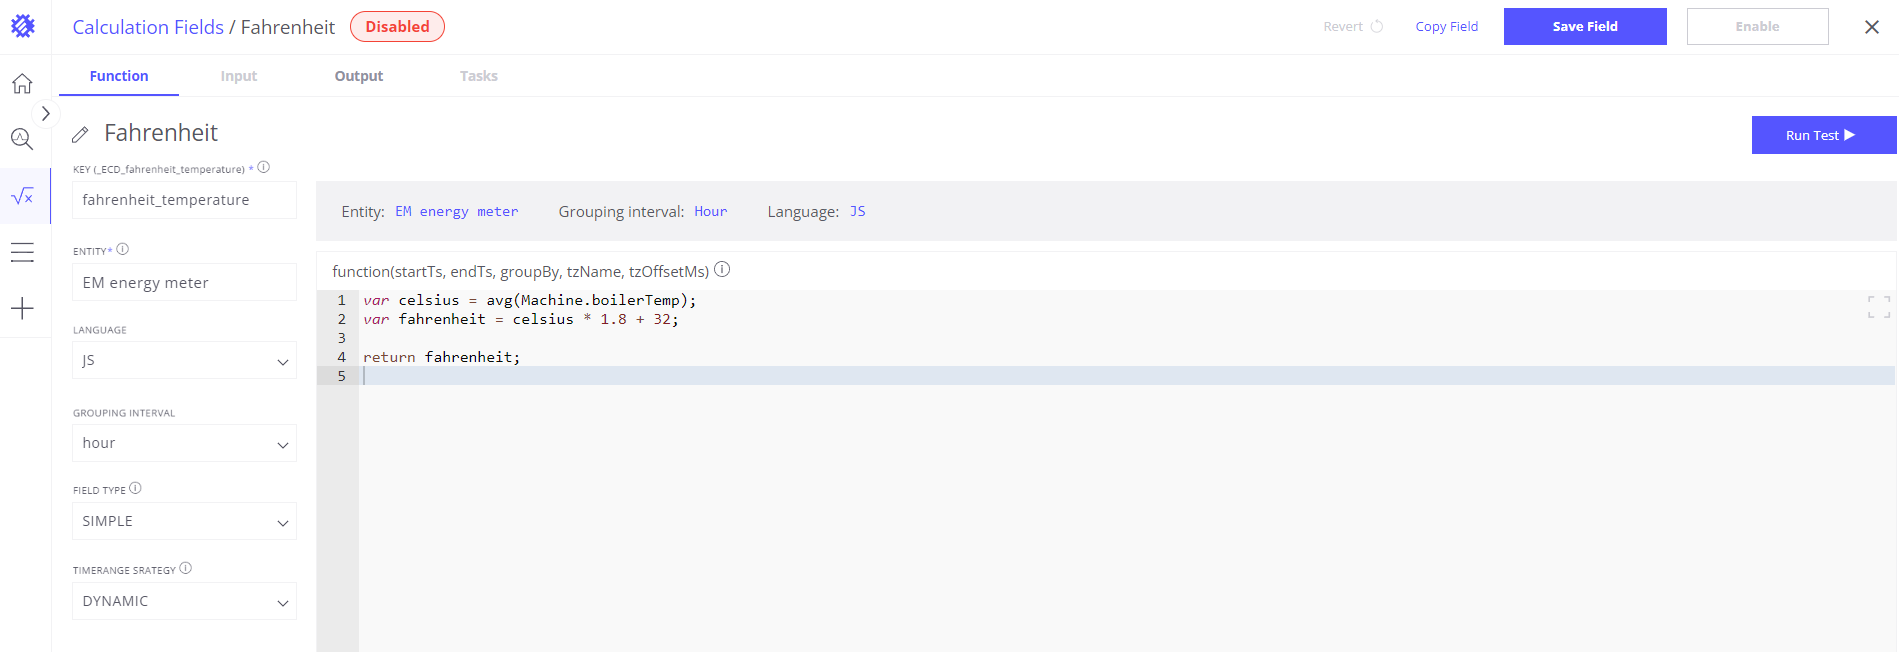
Simple calculation
Let’s assume that sensor submit boiler temperature in Celsius and we want convert it to Fahrenheit:
1
2
3
var celsius = avg(Machine.boilerTemp);
var fahrenheit = celsius*1.8 + 32;
return fahrenheit;
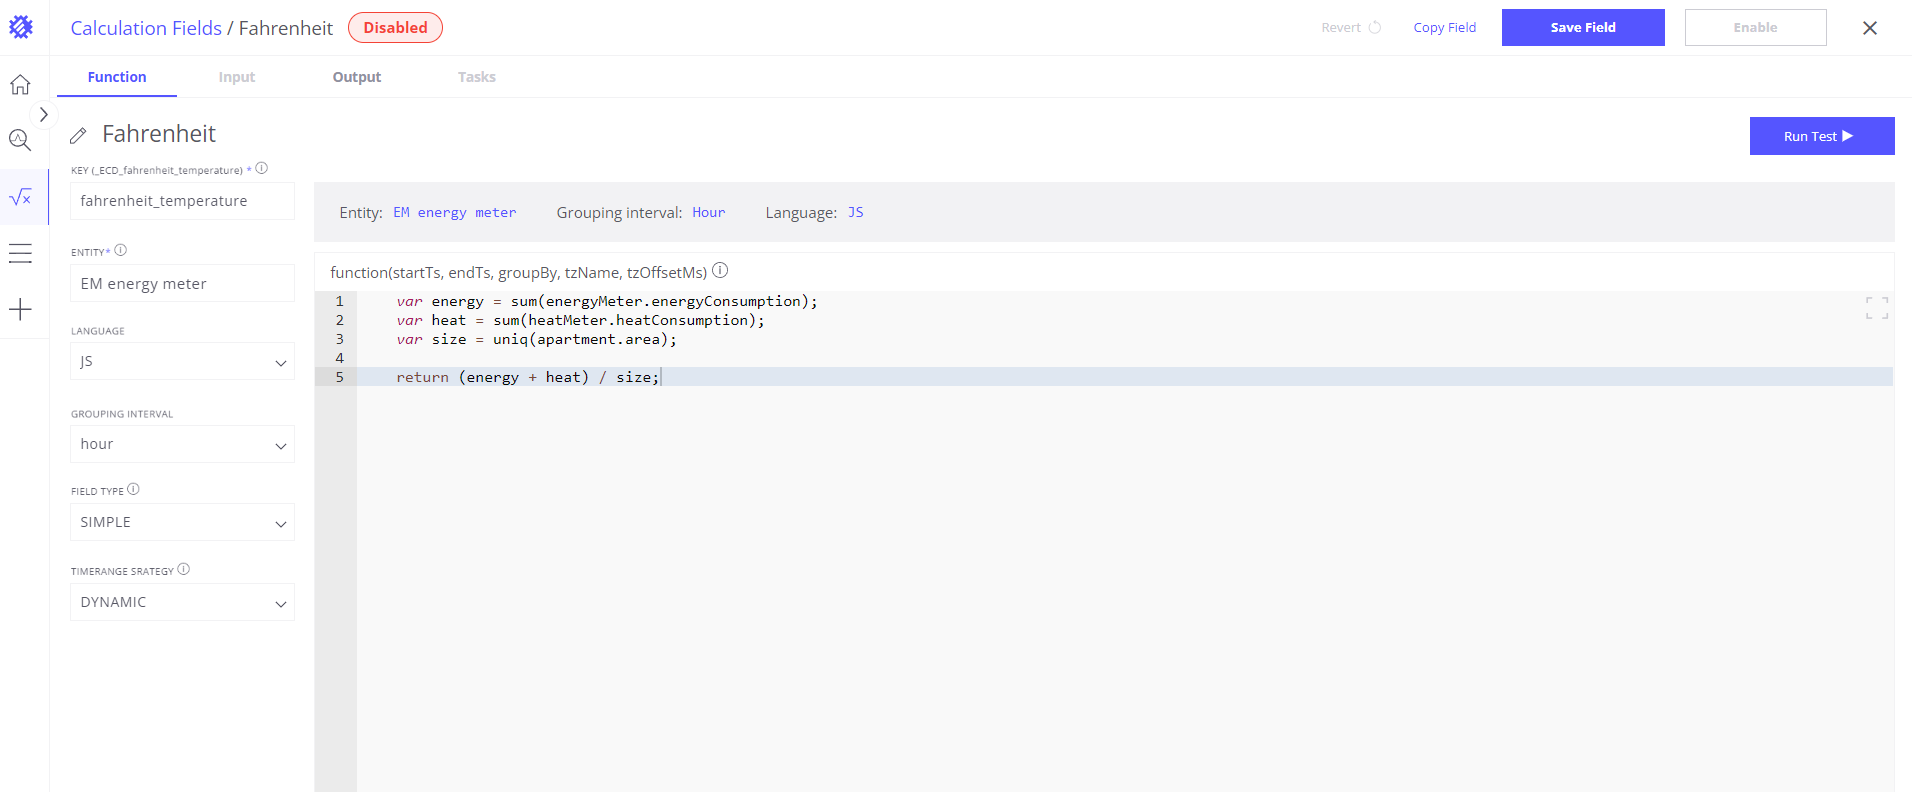
Multiple fields for calculation
In this example we have Apartment asset that has 2 sensors installed - HeatMeter and EnergyMeter. Both sensors submit how much energy was consumed. Also Apartment has area attribute that contains apartment size. We want calculate total energy consumed by HeatMeter and EnergyMeter in Apartment per square meter. Let’s break it to subtasks:
- Get amount of energy consumed by HeatMeter - heatConsumption telemetry
- Get amount of energy consumed by EnergyMeter - energyConsumption telemetry
- Get Appartment size - area attribute
- Sum heatConsumption and energyConsumption
- Devide it by area
1
2
3
4
5
var energy = sum(energyMeter.energyConsumption);
var heat = sum(heatMeter.heatConsumption);
var size = uniq(apartment.area);

    return (energy + heat) / size;
Get original field value
Before applying transformation you need to get a reference to the original field value. Here is an example how to do this:
1
var temp = avg(Machine.temperature);
- avg() - aggregation function
- Machine - Entity Name (it can be Asset Type or Device Type)
- temperature - Field Name
All 3 parts are required, you can not access original field value without aggregation function.
If original field value is an attribute, entity name or owner name - you should use uniq() aggregation function.
Saving and Editing Calculations
After creating a calculated field, you can save it for future use by clicking the “Save Field” button located in the upper right corner. The saved field will appear in the list of business entities within the view fields, using the specified name from the calculation. If a field with the same name or key already exists, the system will notify you of the duplicate.
Enabling Calculated Fields
During the saving process, you have the option to “Enable” the calculated field. When enabled, the calculated field will be recorded as telemetry in ThingsBoard with the specified parameters.

For more details, refer to the Save Metric to ThingsBoard section.
Modifying and Re-Saving Calculations
Once saved, you can modify your calculations as needed. Here’s how the process works:
Modifying the Calculation:
- Access the Calculation: Navigate to the specific calculation you want to adjust. You can make changes to the formula, update parameters, or modify data sources.
Re-Saving the Calculation:
- Save Changes: After making modifications, save the calculation again.
Applying Changes to View Fields:
- Prompt for Update: Upon re-saving, Trendz will prompt you to apply these changes across all view fields based on this calculation, ensuring consistency in data representation.
- Automatic Update: If you choose to apply the changes, all relevant view fields will automatically update with the new logic or parameters.
Handling Enabled Calculations:
- Reprocess Task: If the calculation was enabled and you modify and re-save it, you will need to run the Reprocess Task to apply the updated logic to historical data.
- Future Data: Without running the Reprocess Task, the updated calculation only applies to new data recorded after re-saving, leaving historical data unchanged.
- How to Run the Reprocess Task: Go to the Tasks tab and click the “Run Reprocess Task” button to apply the updated calculation to all relevant historical data.

This functionality ensures seamless management of calculations, consistently reflecting updates across all areas where the calculation is applied.
Using Calculations in View Fields
Once you have created and saved a calculation in Trendz, it can be used in view fields to enhance data representation and analysis. Here’s how to effectively use these calculations:
Accessing the Calculations in View Fields
- Business Entities List: Calculations created by a tenant will appear in the list of business entities under the name provided during creation. This allows for easy selection and integration into view fields.
- Telemetry Display for Customers: Once enabled, the calculated data becomes visible to end users as telemetry. It will be displayed under the key name defined in the calculation, making it accessible in dashboards and widgets.

Using the Calculation in Views
Simply select the desired calculation to include it in the view field. The data generated by this calculation will now be part of the visual representation in the selected view.
Using Real-Time (RT) and ThingsBoard (TB) Data
- ThingsBoard Data (TB): Calculations saved as telemetry in ThingsBoard can be displayed in view fields for historical or periodically updated data. These calculations update according to the schedule set in the task settings.
- Real-Time Data (RT): For immediate data needs, real-time calculations can be utilized. Note that RT calculations might take longer to process than batch-calculated data.

Editing and Managing Calculations:
To adjust or manage a calculation after adding it to a view field, access the calculation settings directly from the view field configuration by pressing the “Go to calculation field” button.

Disabled Calculation
If a calculated field is disabled isn’t saved in ThingsBoard as telemetry, it will appear normally in the list of business entity fields. However, when you drag this field into the chart-building area, a red bell icon will appear next to it. By clicking on the red bell icon, you can go directly to the created calculated field, where you can enable it as telemetry.

By following these steps, you can effectively use created calculations within view fields, making sure your data analysis is both complete and exact.
Next Steps
-
Getting started guide - These guide provide quick overview of main Trendz features.
-
Installation guides - Learn how to setup ThingsBoard on various available operating systems.
-
States - Learn how to define and analyse states for assets based on raw telemetry.
-
Prediction - Learn how to make forecasts and predict telemetry behavior.
-
Anomaly Detection - Learn how to identify anomalies in the data.
-
Filters - Learn how filter dataset during analysis.
-
Available Visualizations - Learn about visualization widgets available in Trendz and how to configure them.
-
Share and embed Visualizations - Learn how to add Trendz visualizations on ThingsBoard dashboard or 3rd party web pages.
-
AI Assistant - Learn how to utilize Trendz AI capabilities.