Pie Charts
The Pie Chart view splits a total value into proportional slices. Two sections define the chart:
| Section | Purpose |
|---|---|
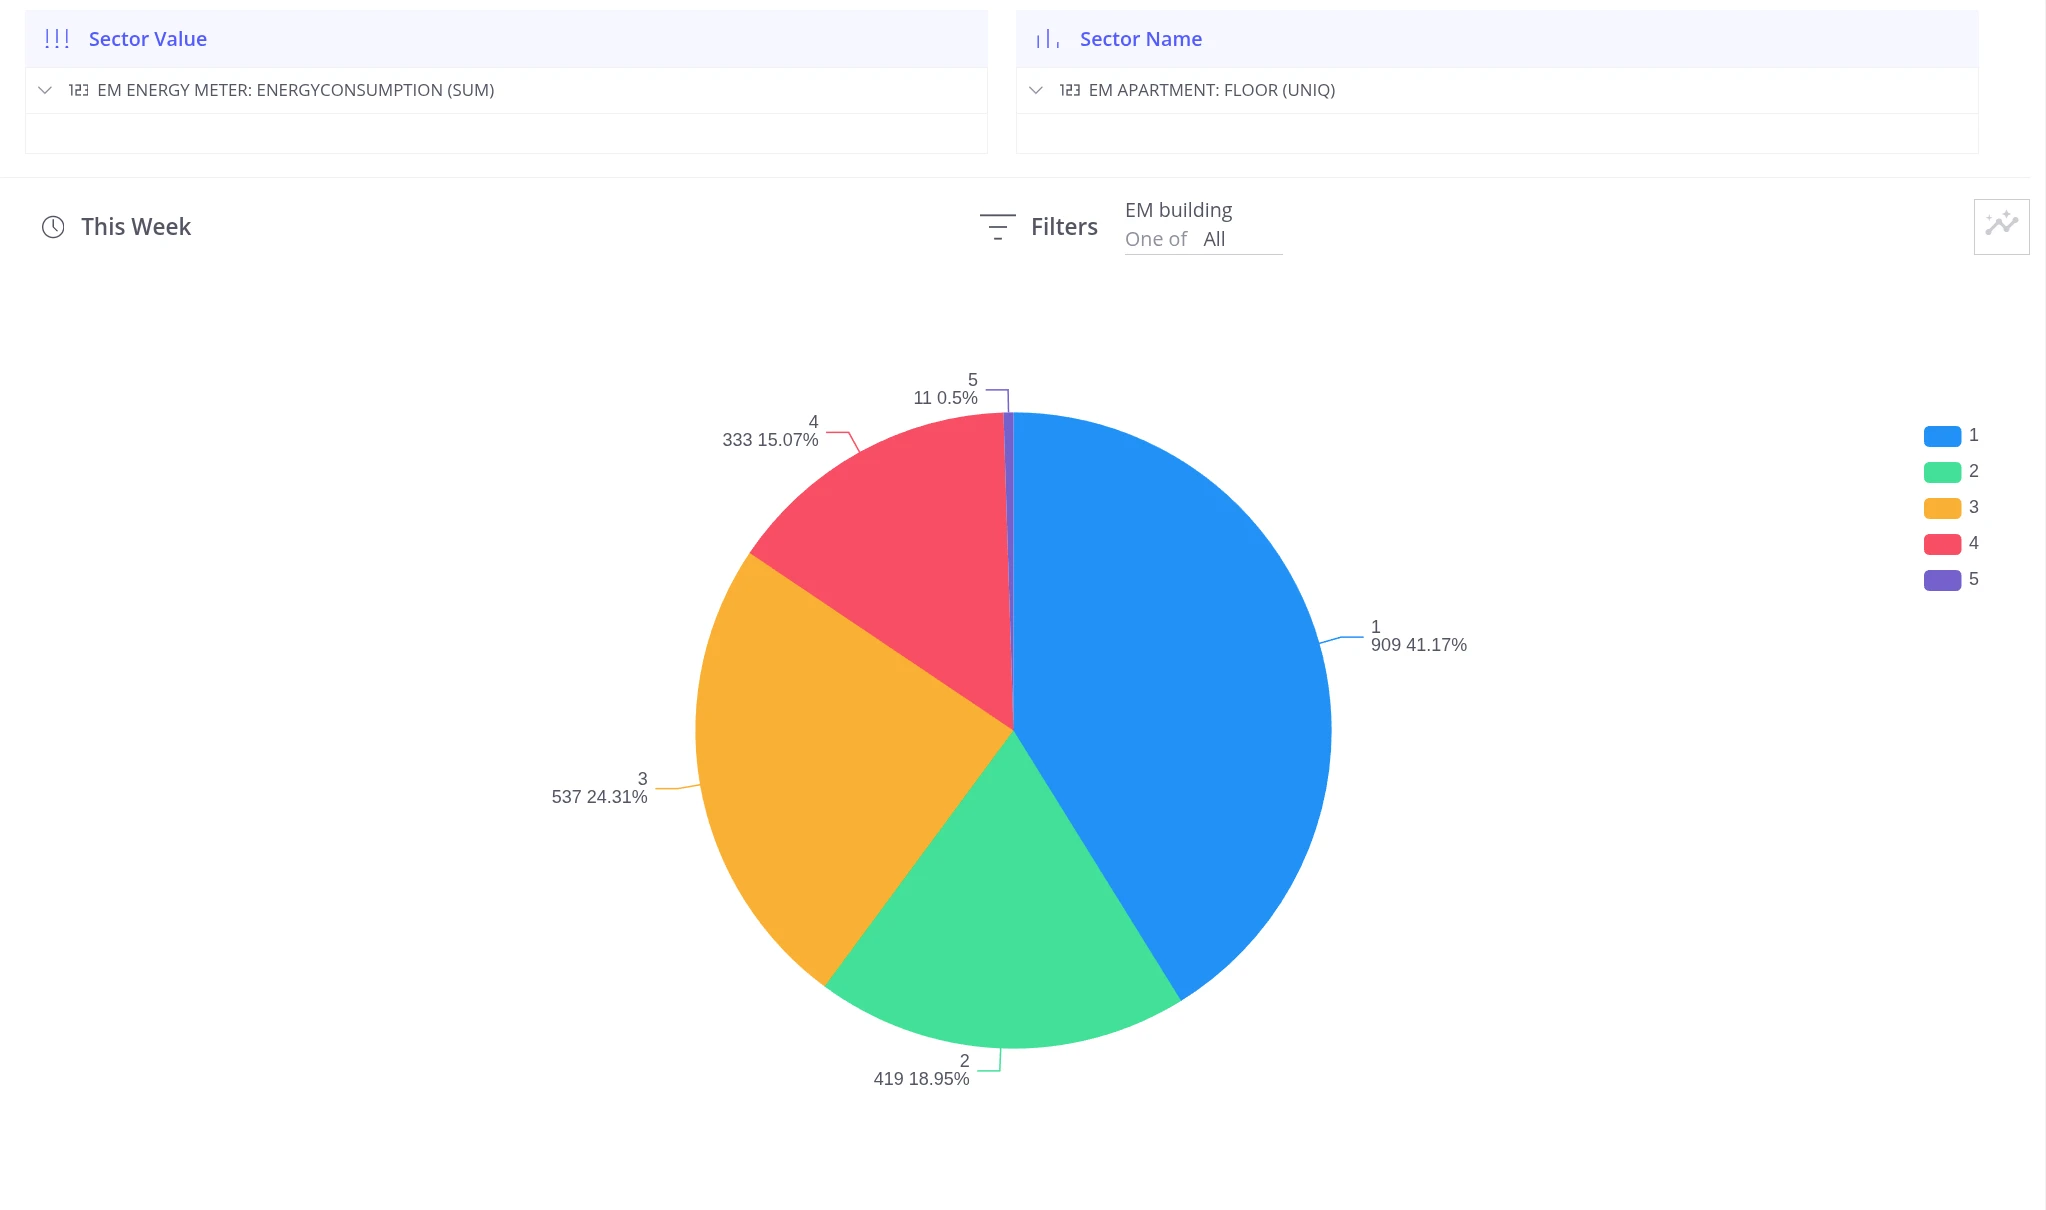
| Sector Value | The numeric field that determines each slice’s size — drop a telemetry field here with the required aggregation (SUM, AVG, etc.). Multiple fields can be added; a separate tab is created for each. |
| Sector Name | The field that splits the data into groups — each unique value becomes a separate slice (device name, asset attribute, telemetry value, etc.). |
Was this helpful?
Thank you for your feedback!