Add View on Dashboard
Any visualization saved in Trendz Analytics can be added to a ThingsBoard dashboard. This page covers two ways to do it — using the Share button for a one-click setup, or manually configuring the widget with a direct link.
Before you start, make sure the Advanced analytics Bundle is imported into ThingsBoard.
Option 1 — Using the Share Button
Section titled “Option 1 — Using the Share Button”The fastest way to add a Trendz view to a dashboard. Trendz generates the widget and places it on the selected dashboard state automatically.
-
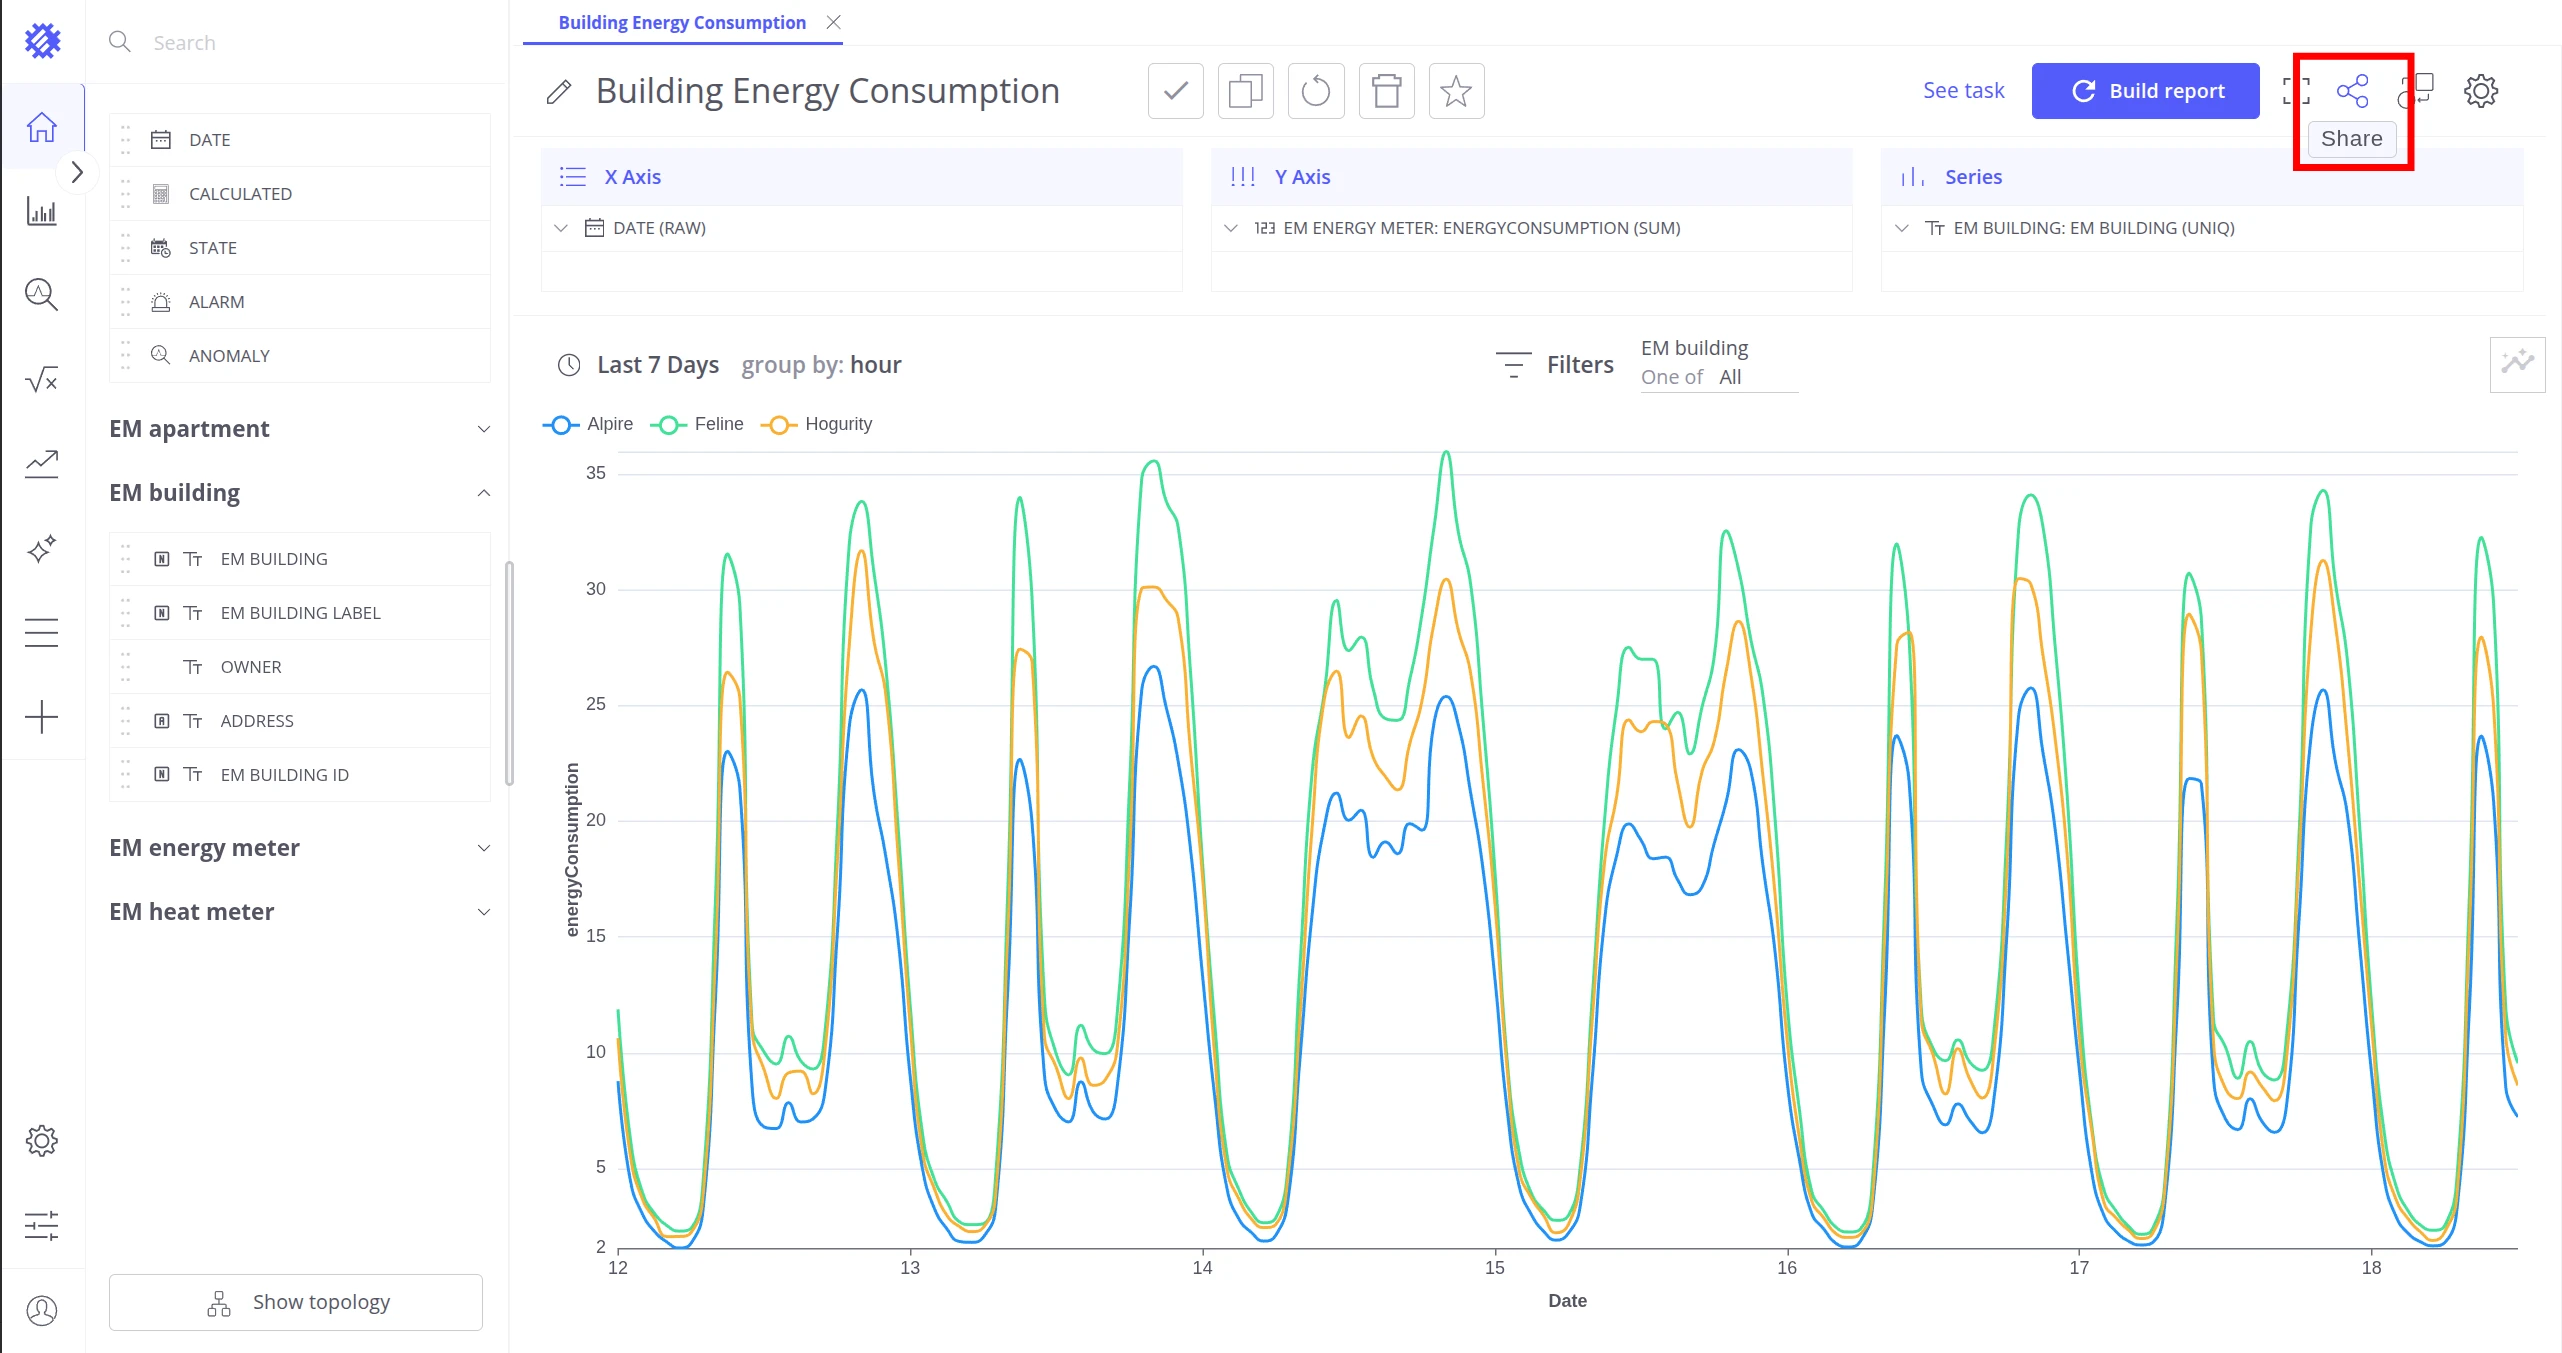
Open the visualization in Trendz and click Share in the top-right corner.
-
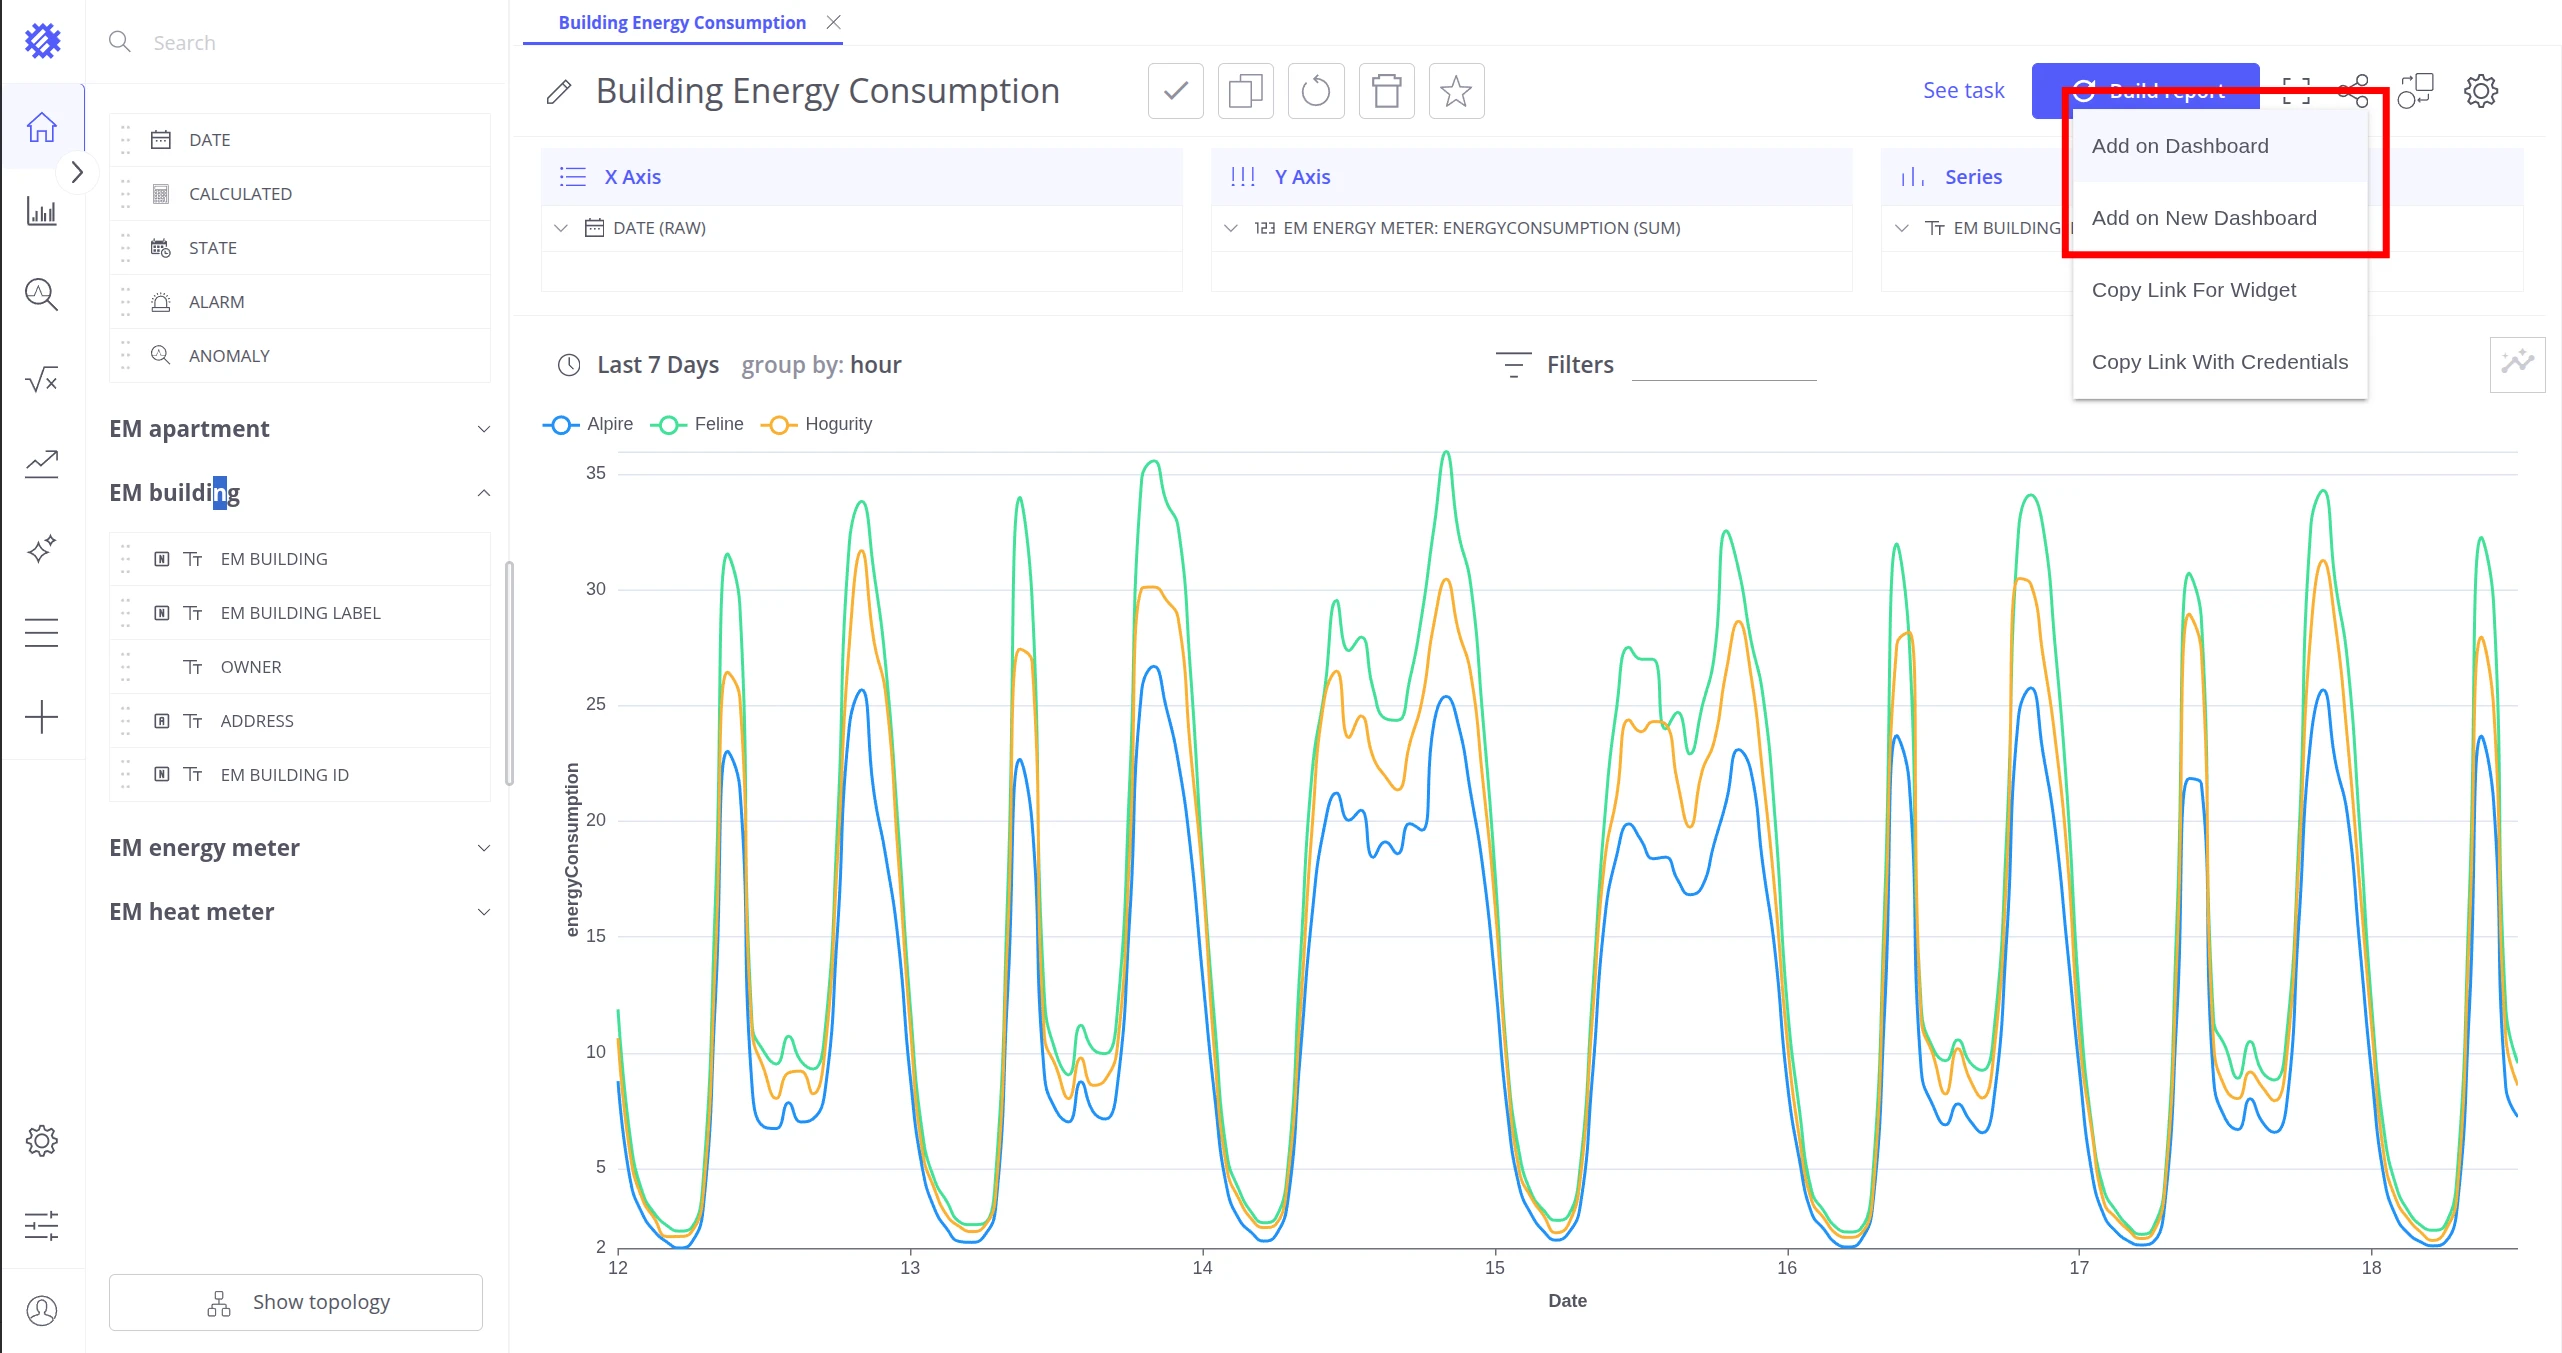
Select Add on Dashboard to add the view to an existing dashboard, or Add on New Dashboard to create one.
-
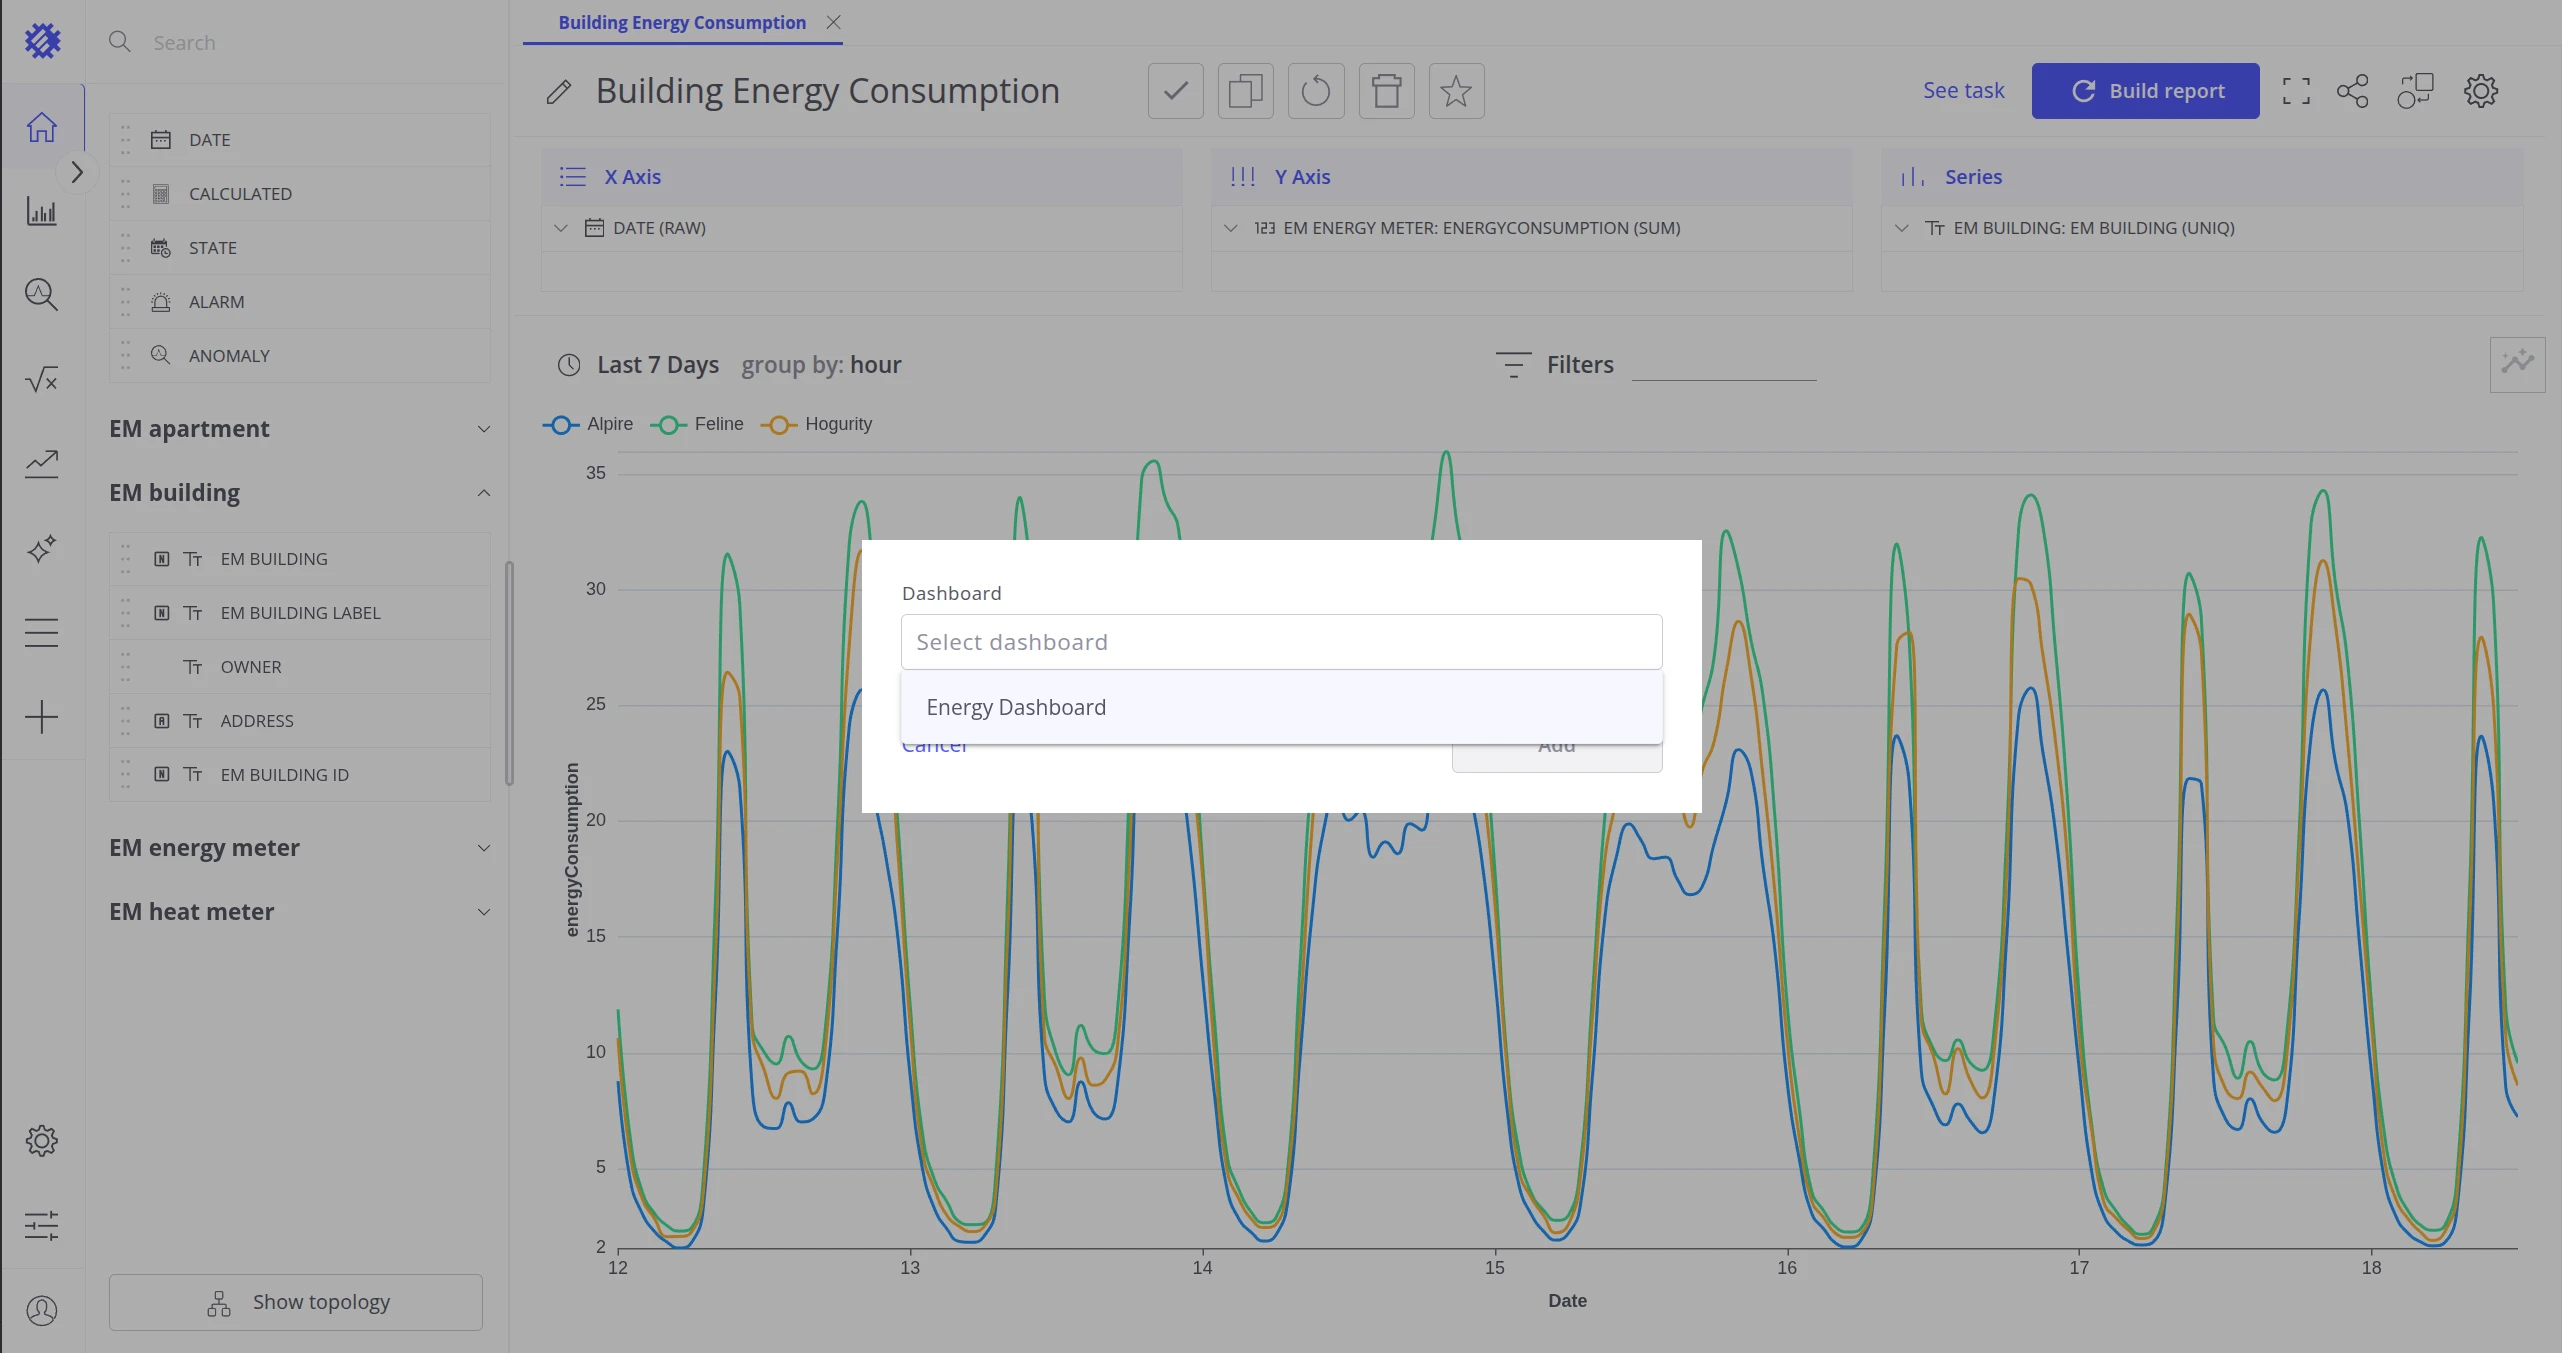
Select the target dashboard from the list.
-
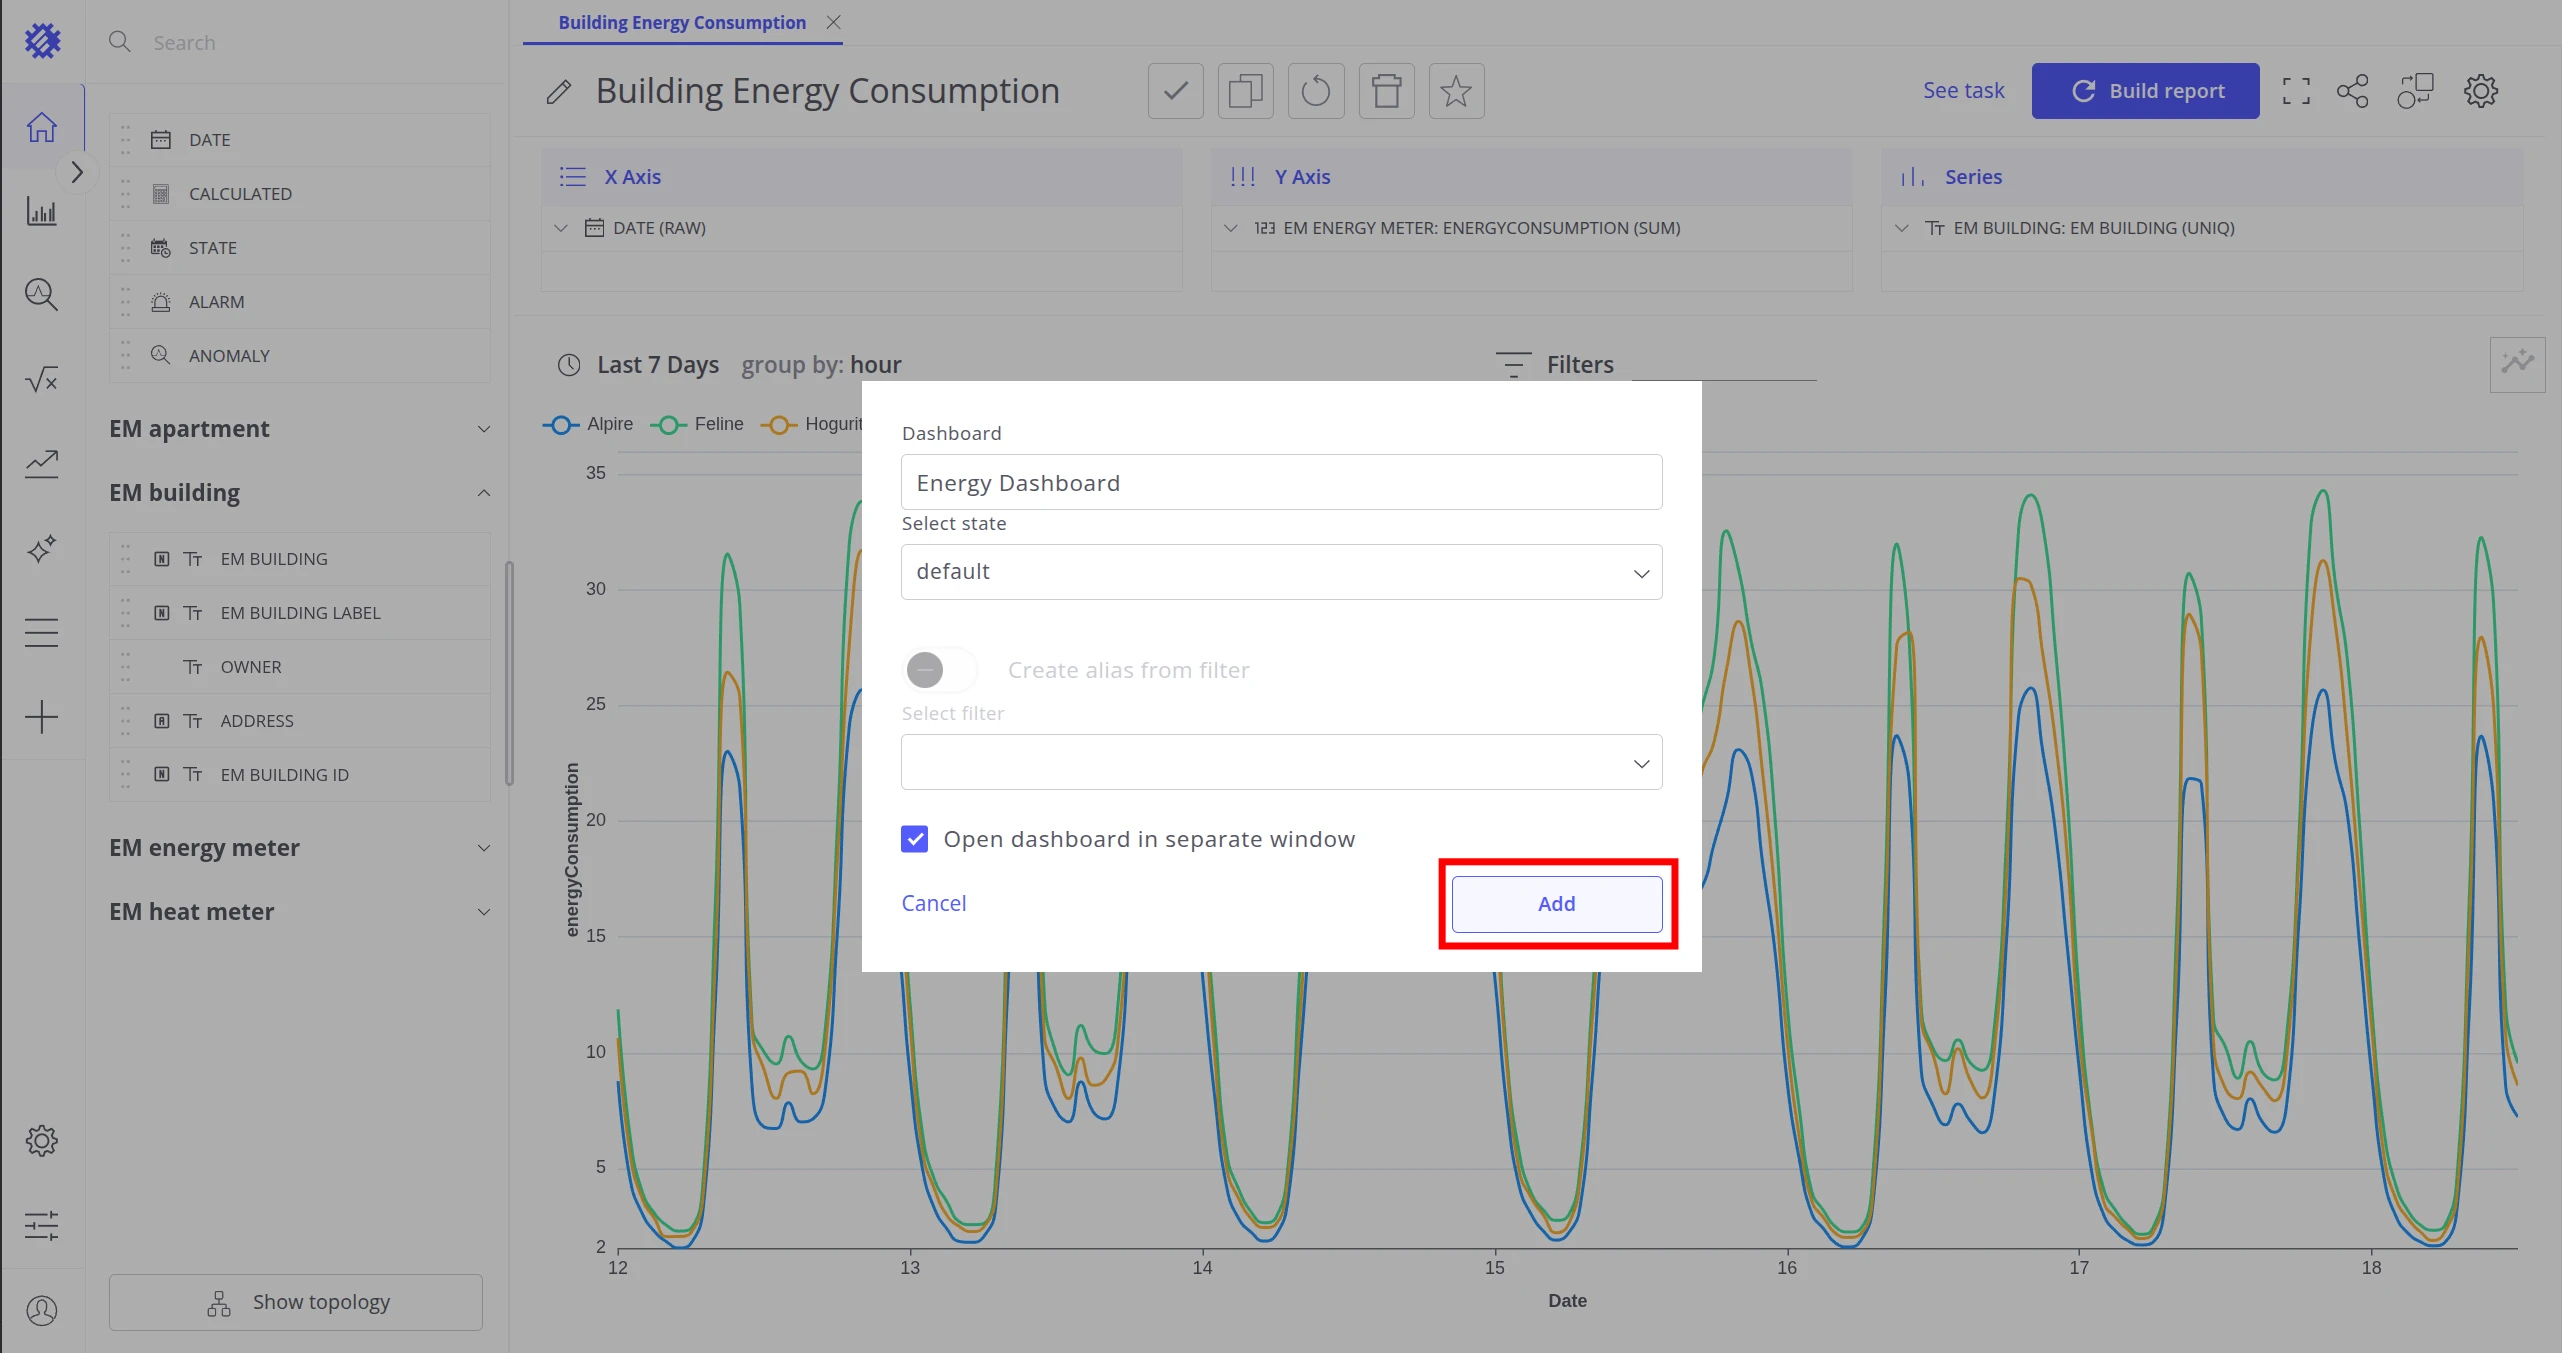
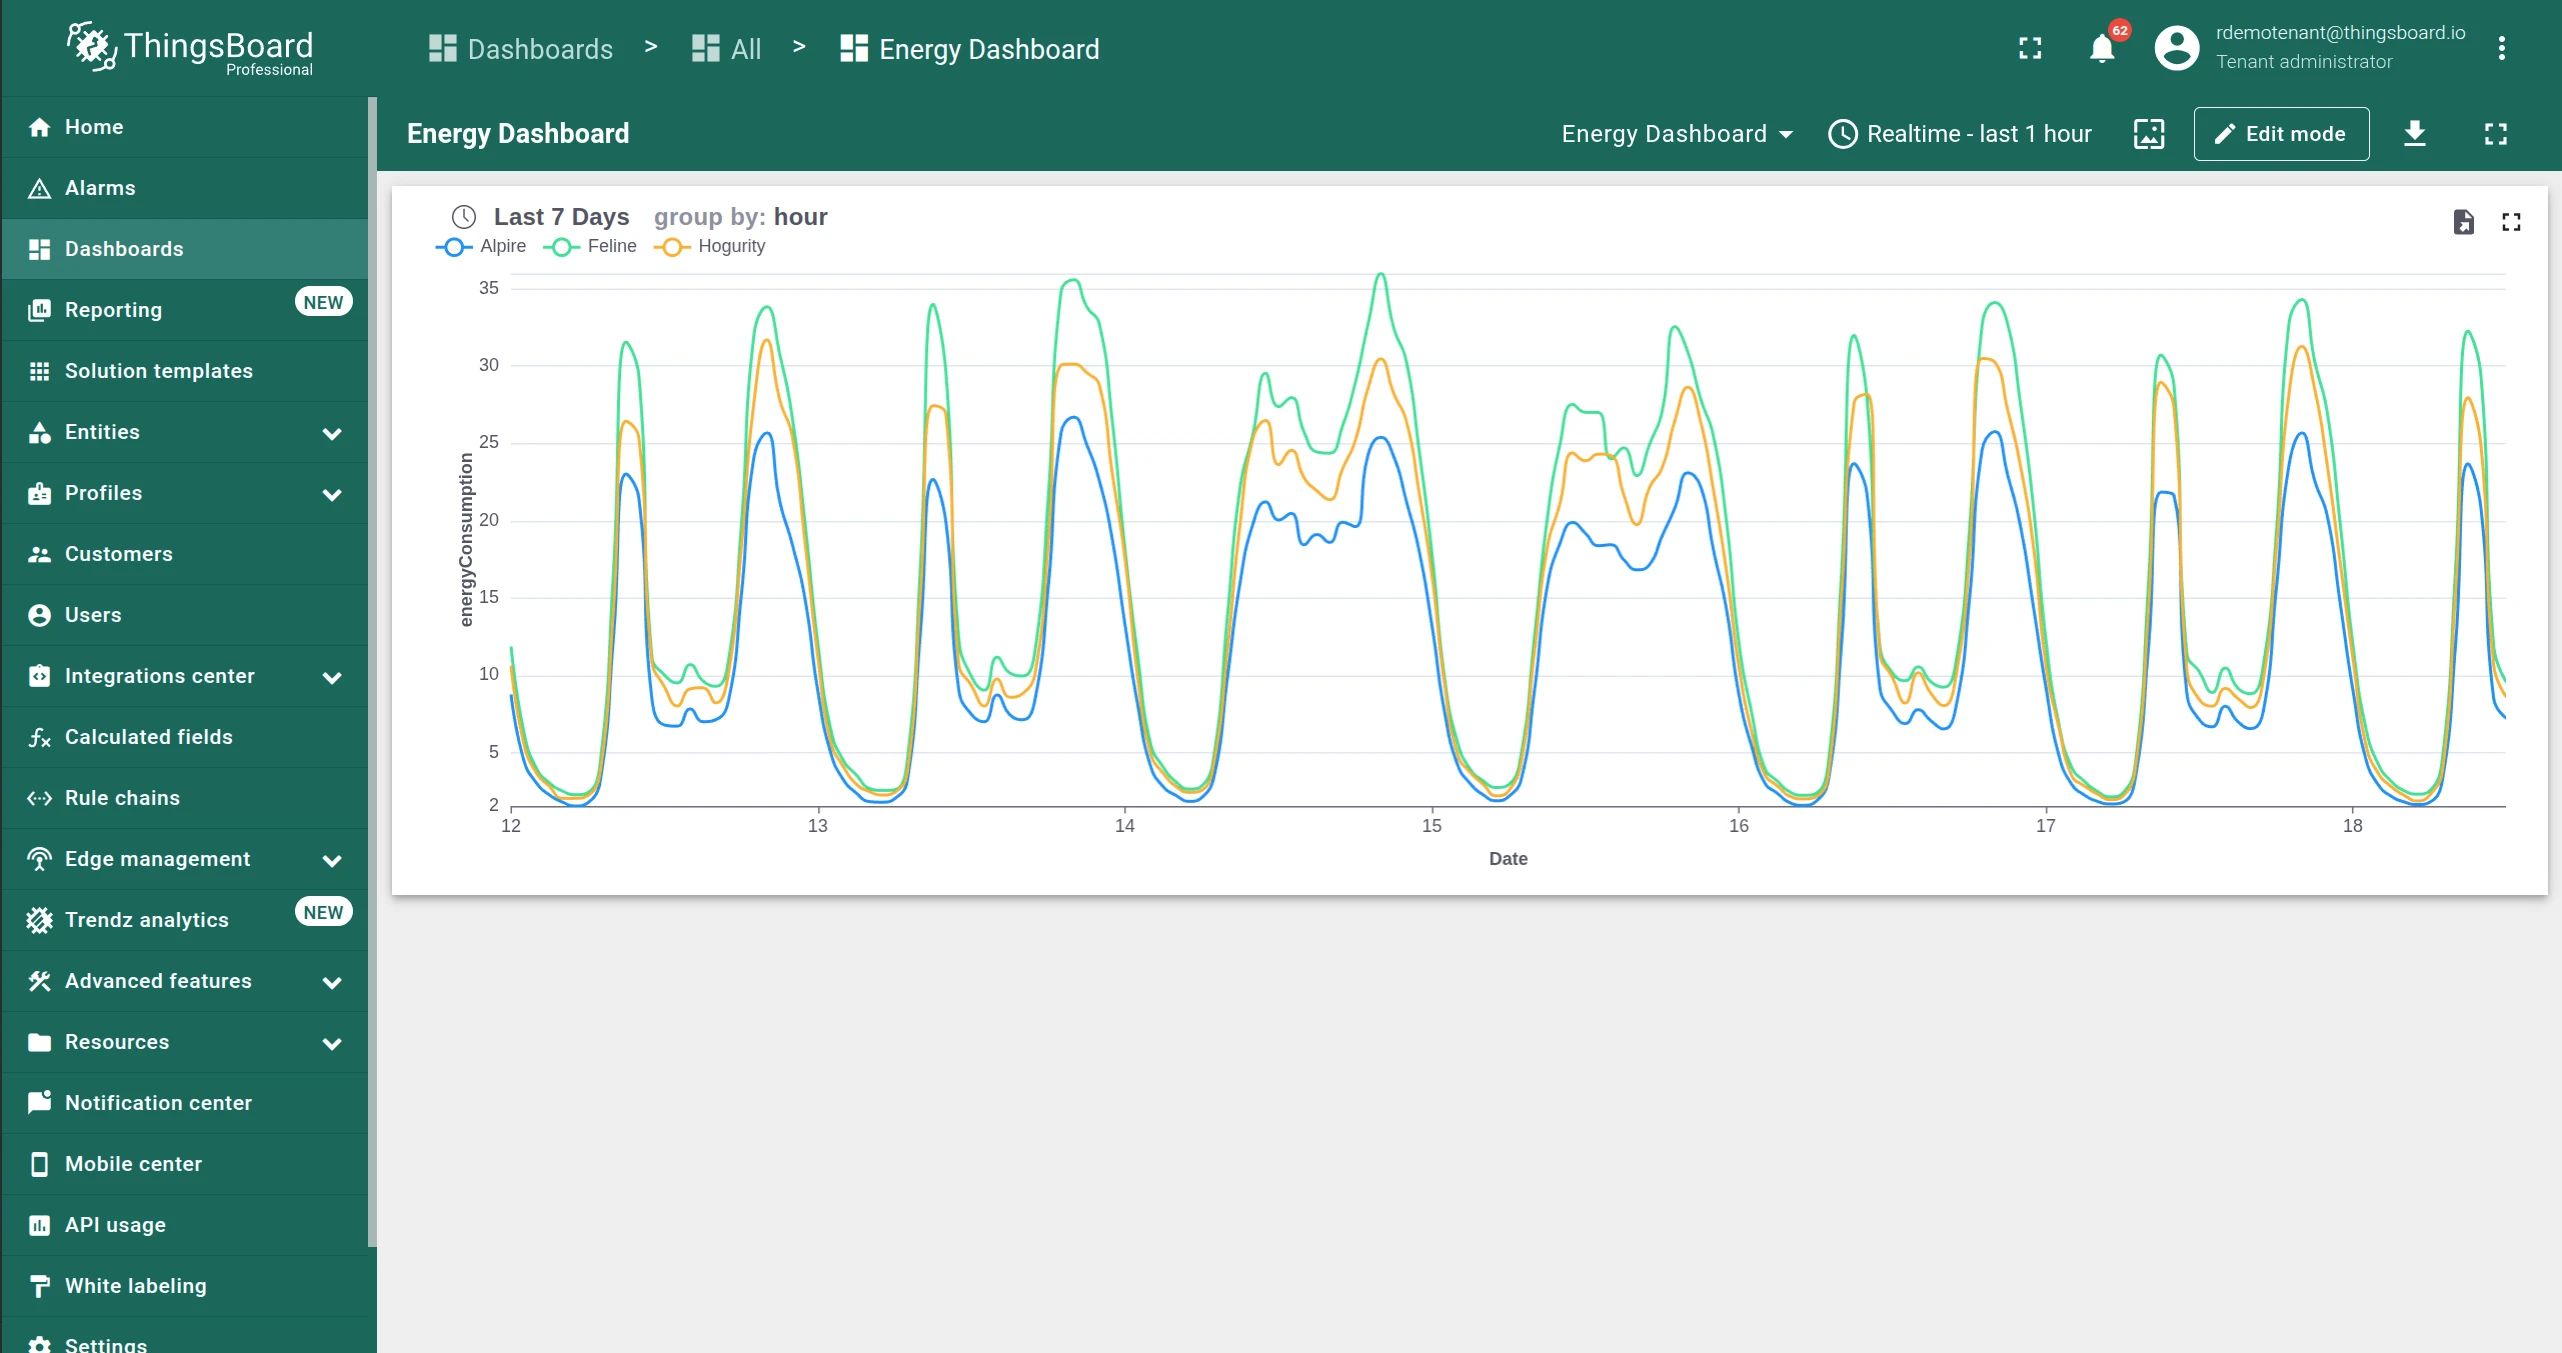
Select the dashboard state and click Add. The widget appears on the selected dashboard state.
Create alias from filter
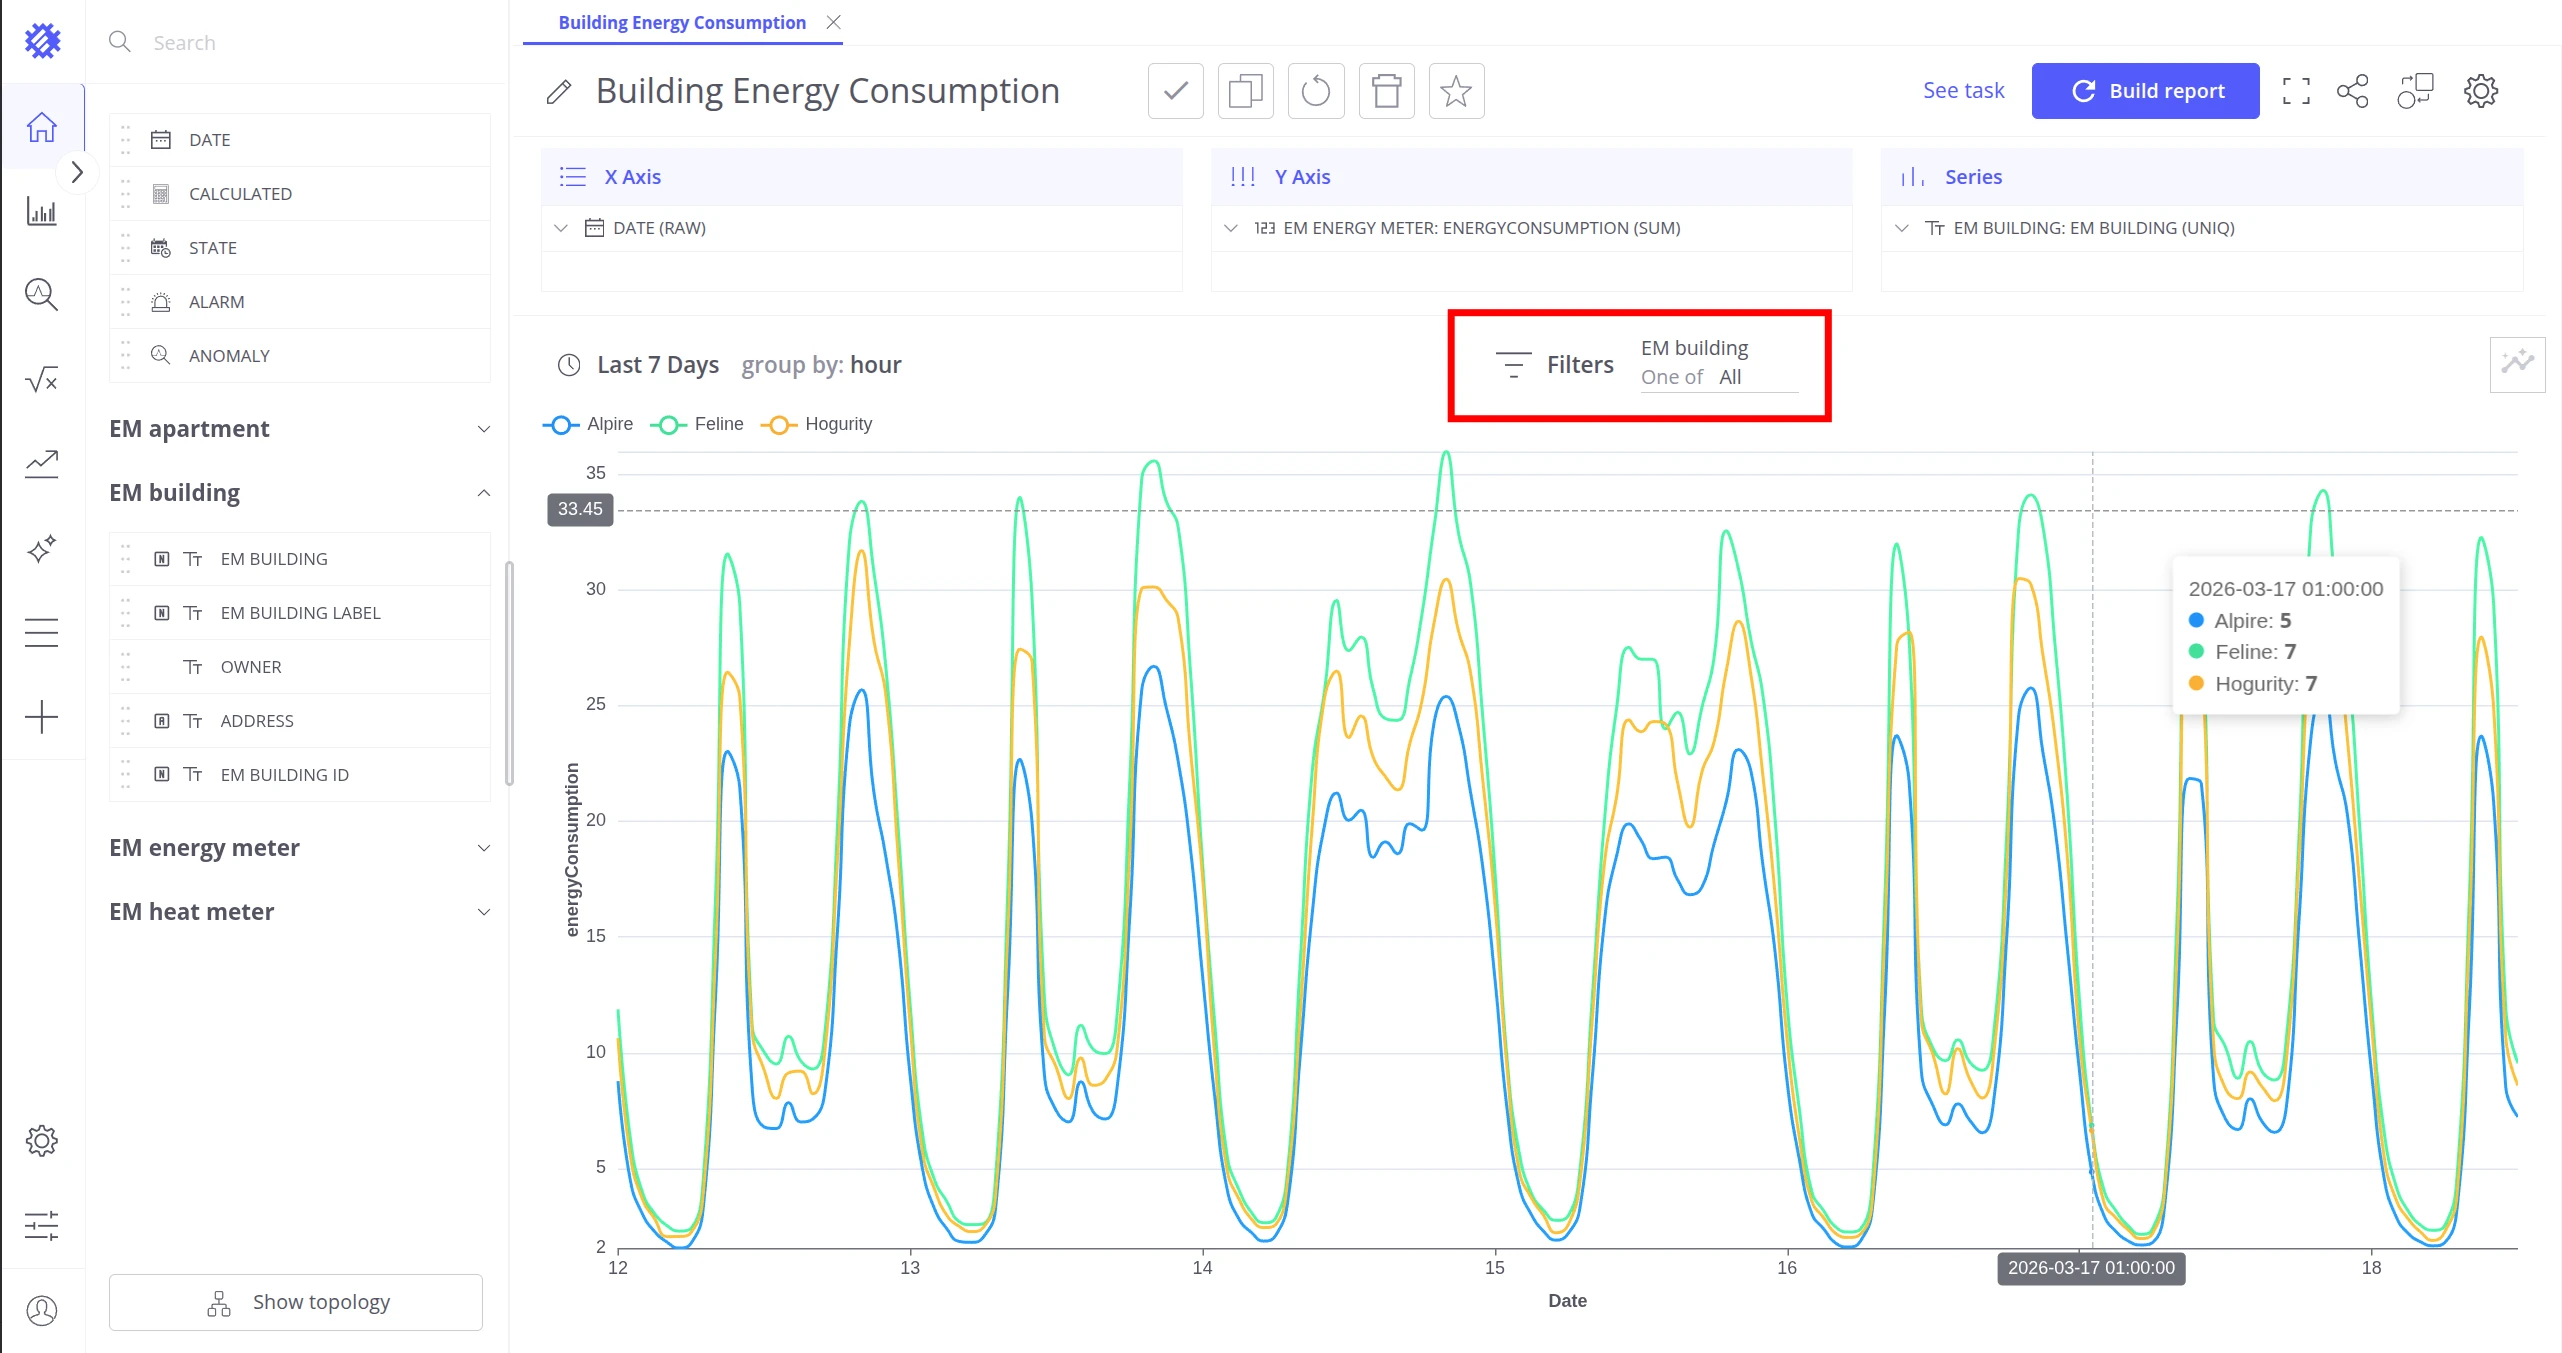
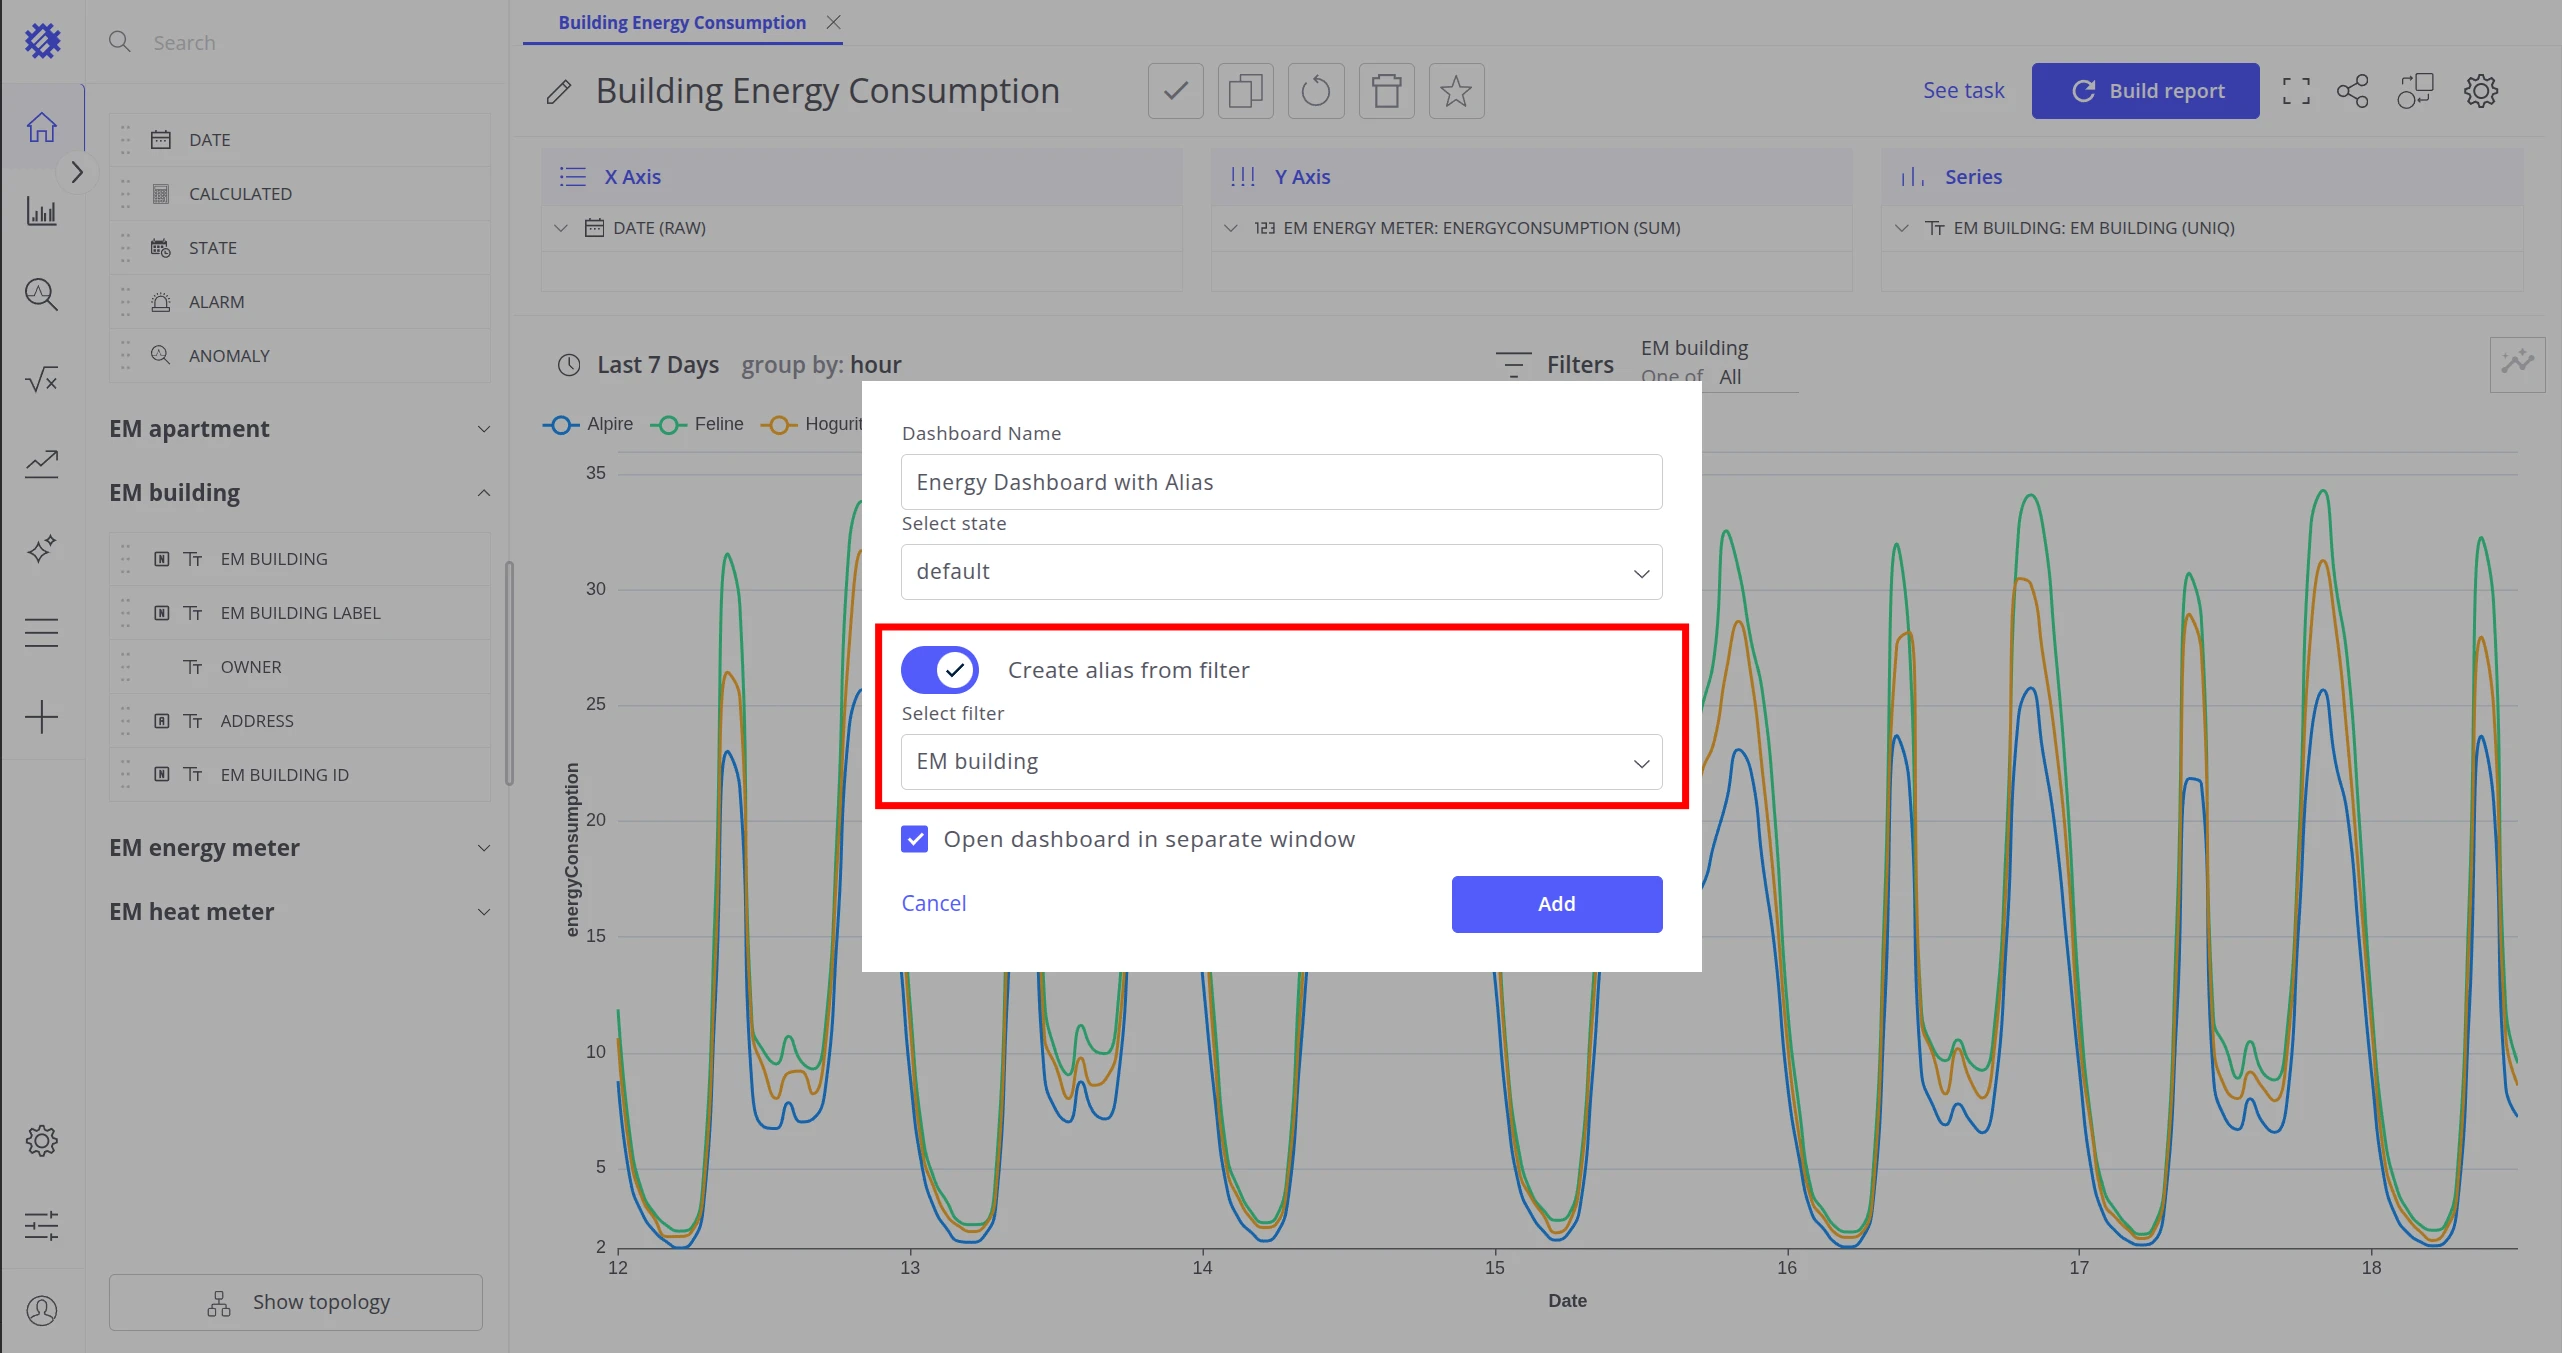
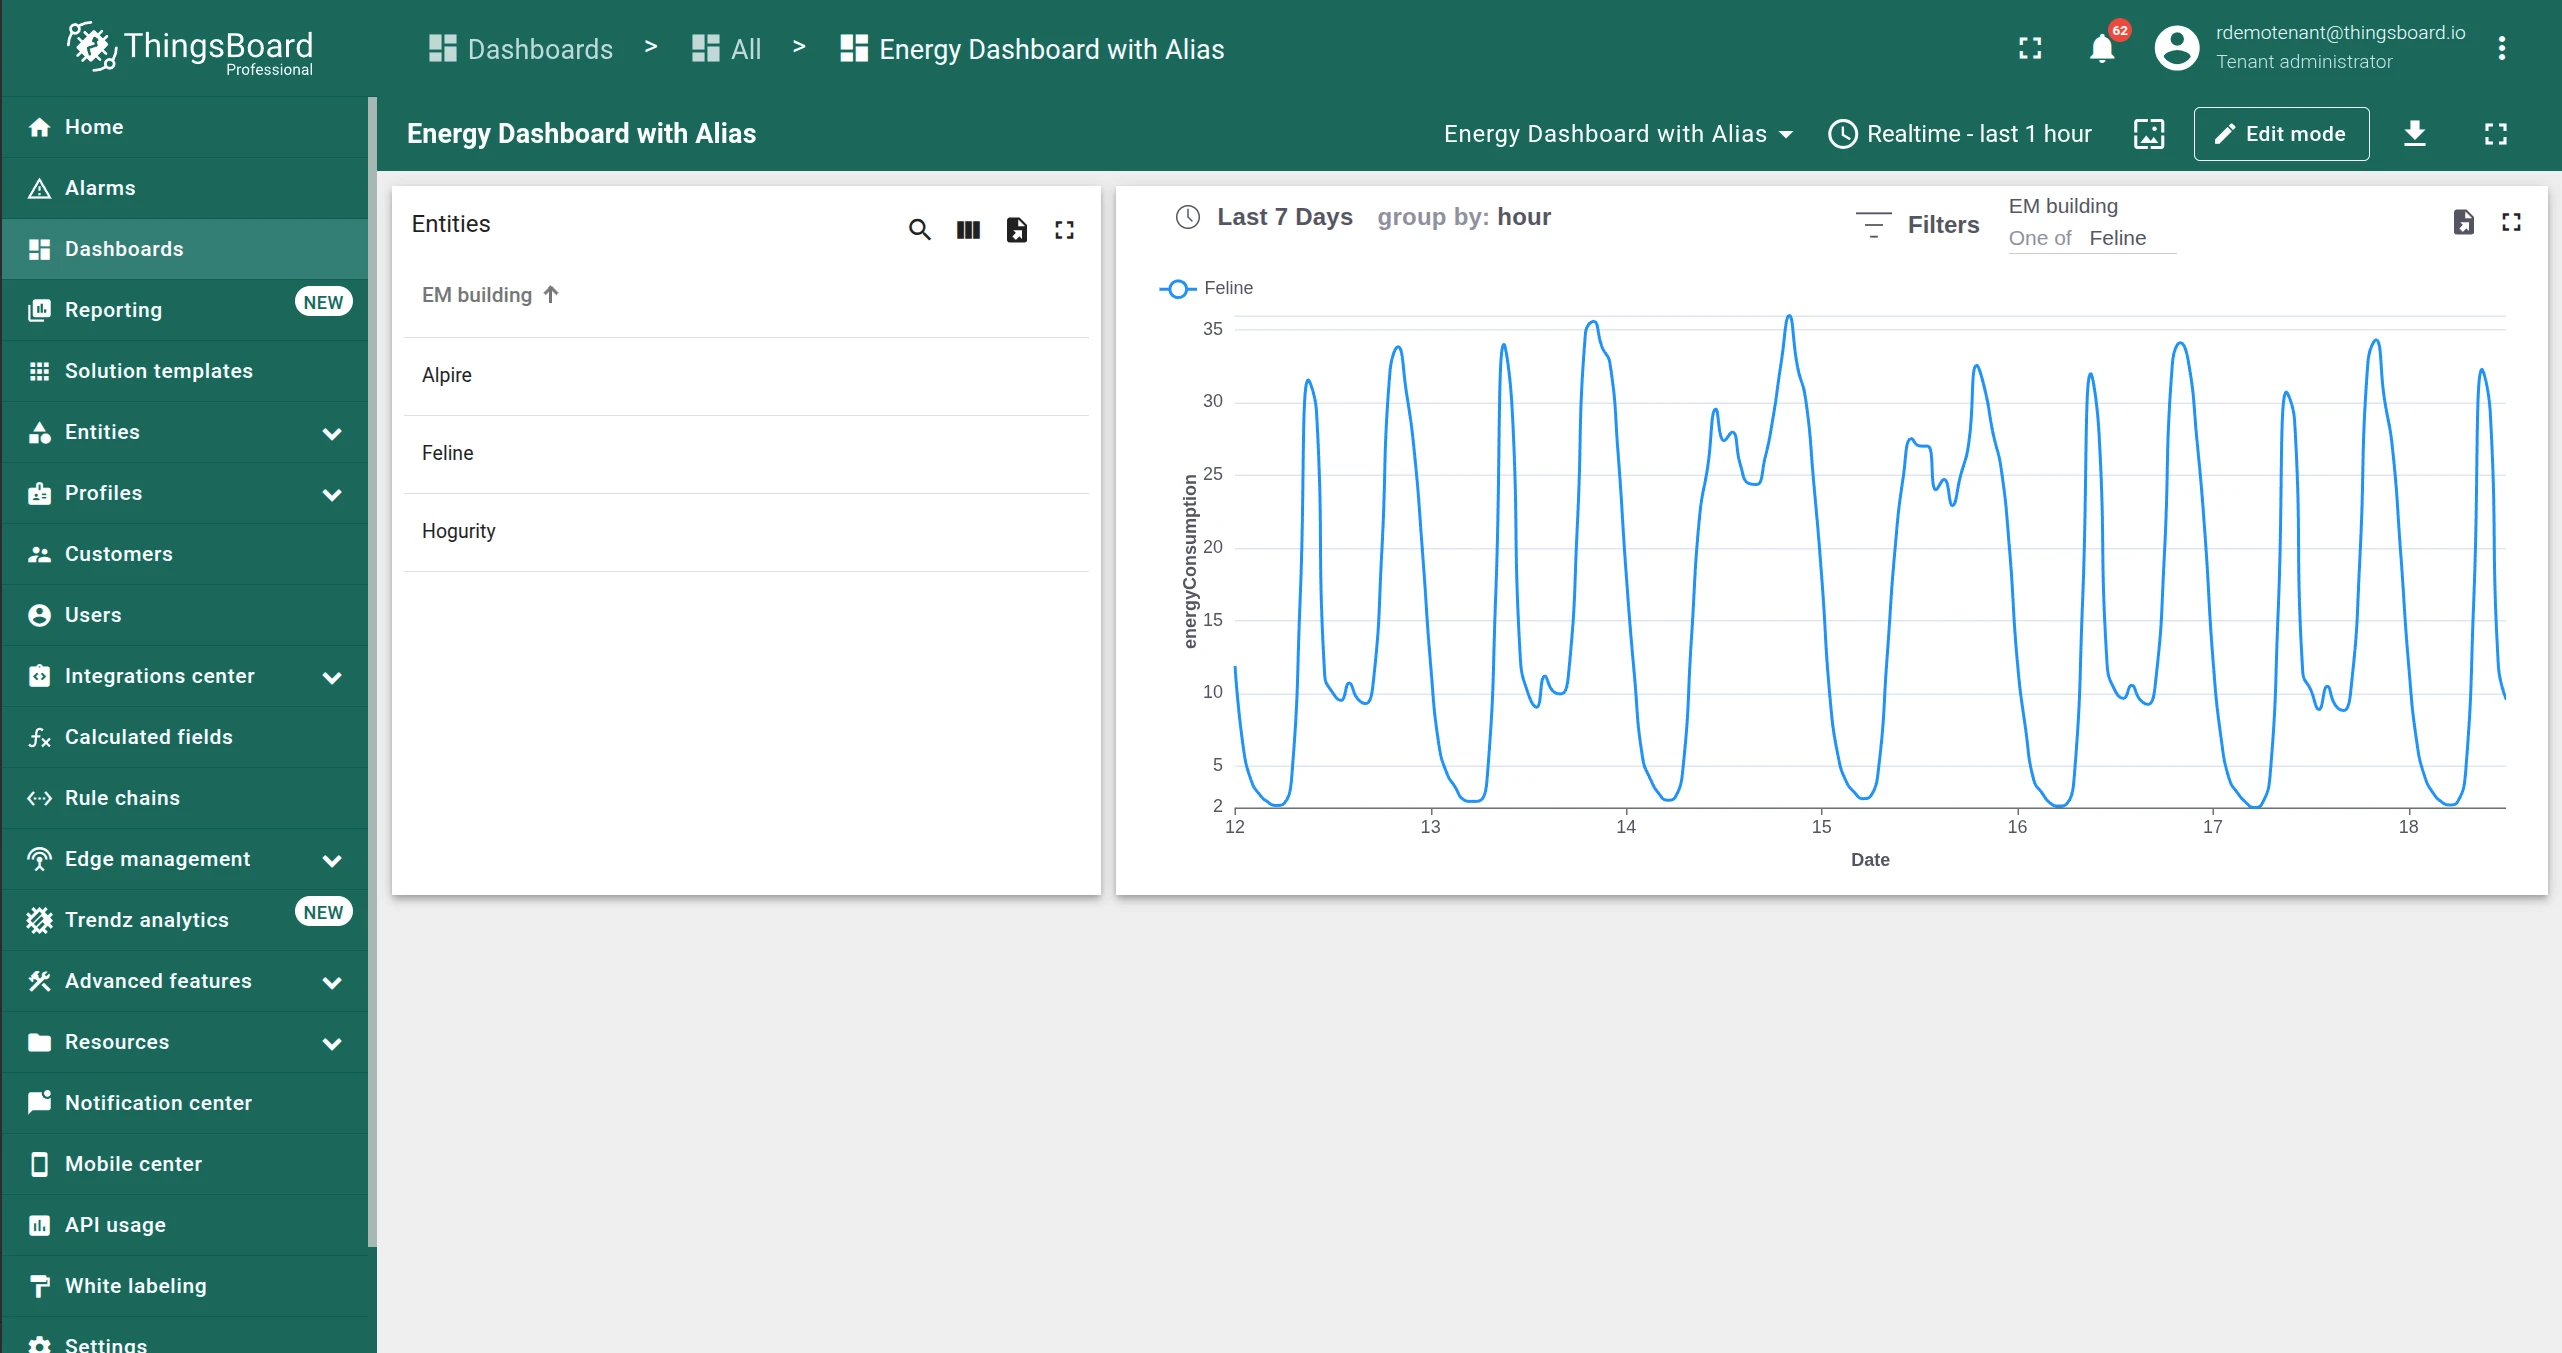
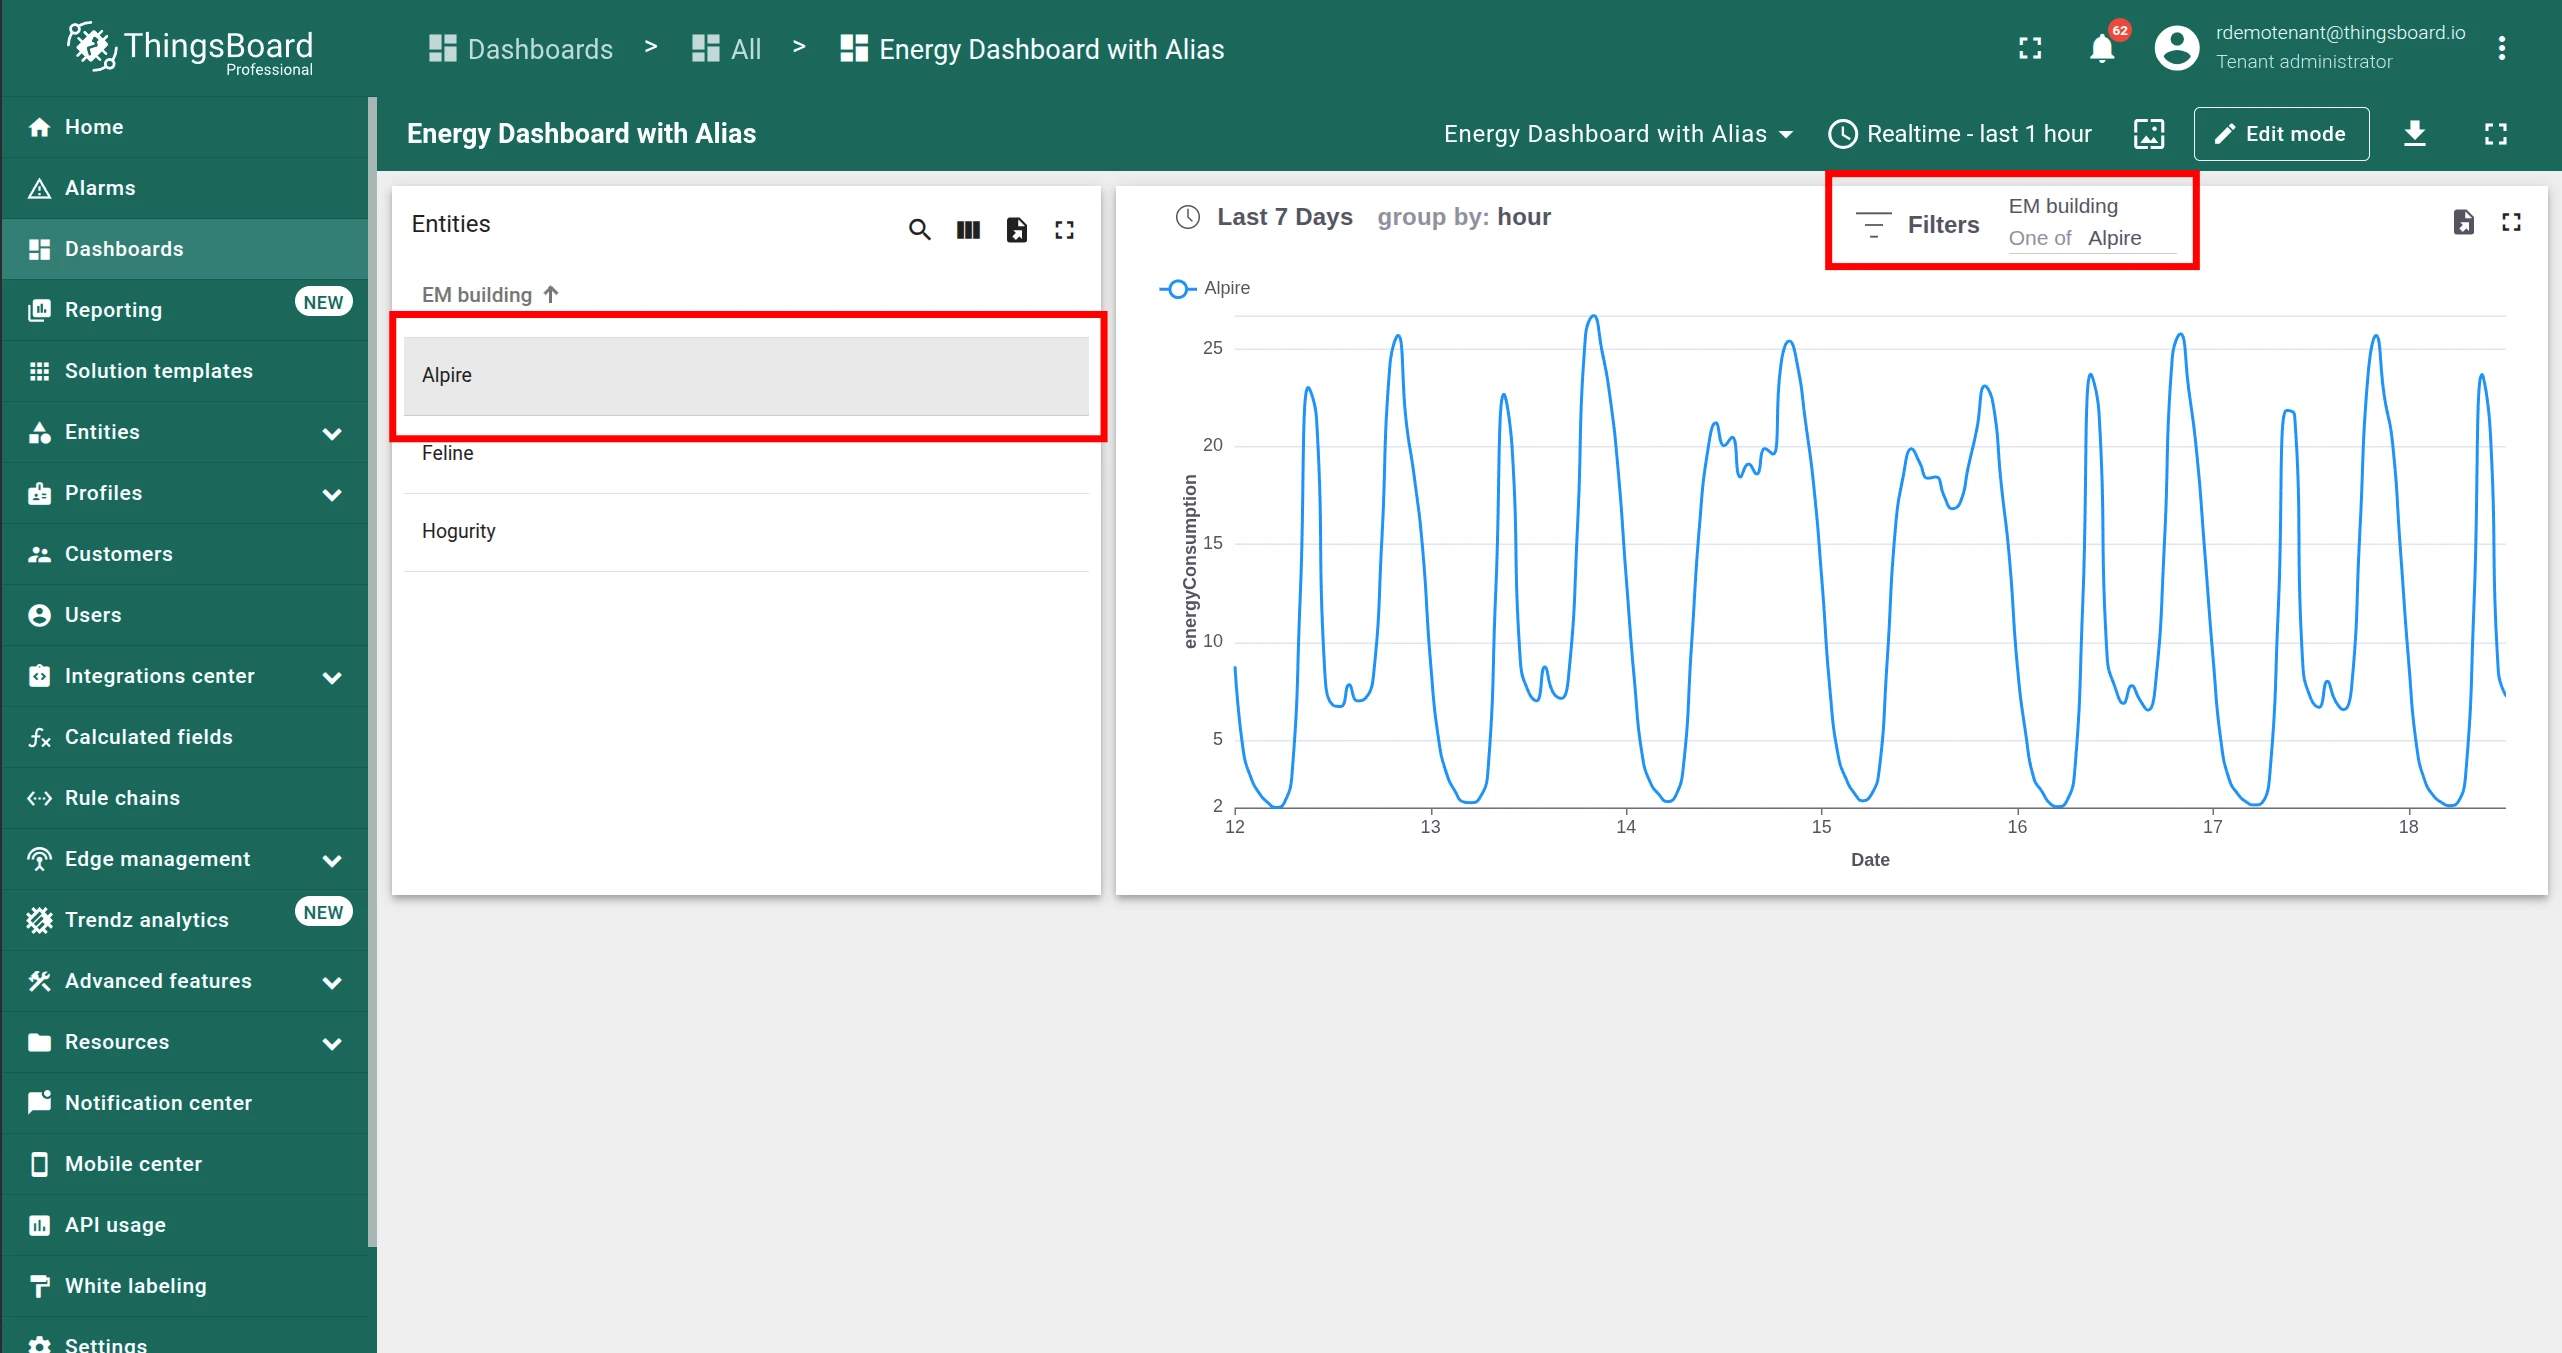
Section titled “Create alias from filter”When the view has entity filters, the Create alias from filter option appears in the Share dialog and is enabled by default. ThingsBoard creates an entity alias in the dashboard and connects it to the view’s filter — the widget re-renders automatically when a user selects a different entity in the entities table.
Disable it before clicking Add if you want the widget to remain standalone.
Option 2 — Using a Direct Widget Link
Section titled “Option 2 — Using a Direct Widget Link”Use this approach when you need to place the widget manually — for example, when configuring a specific dashboard layout or connecting the view to an existing alias.
Copy the view URL
Section titled “Copy the view URL”-
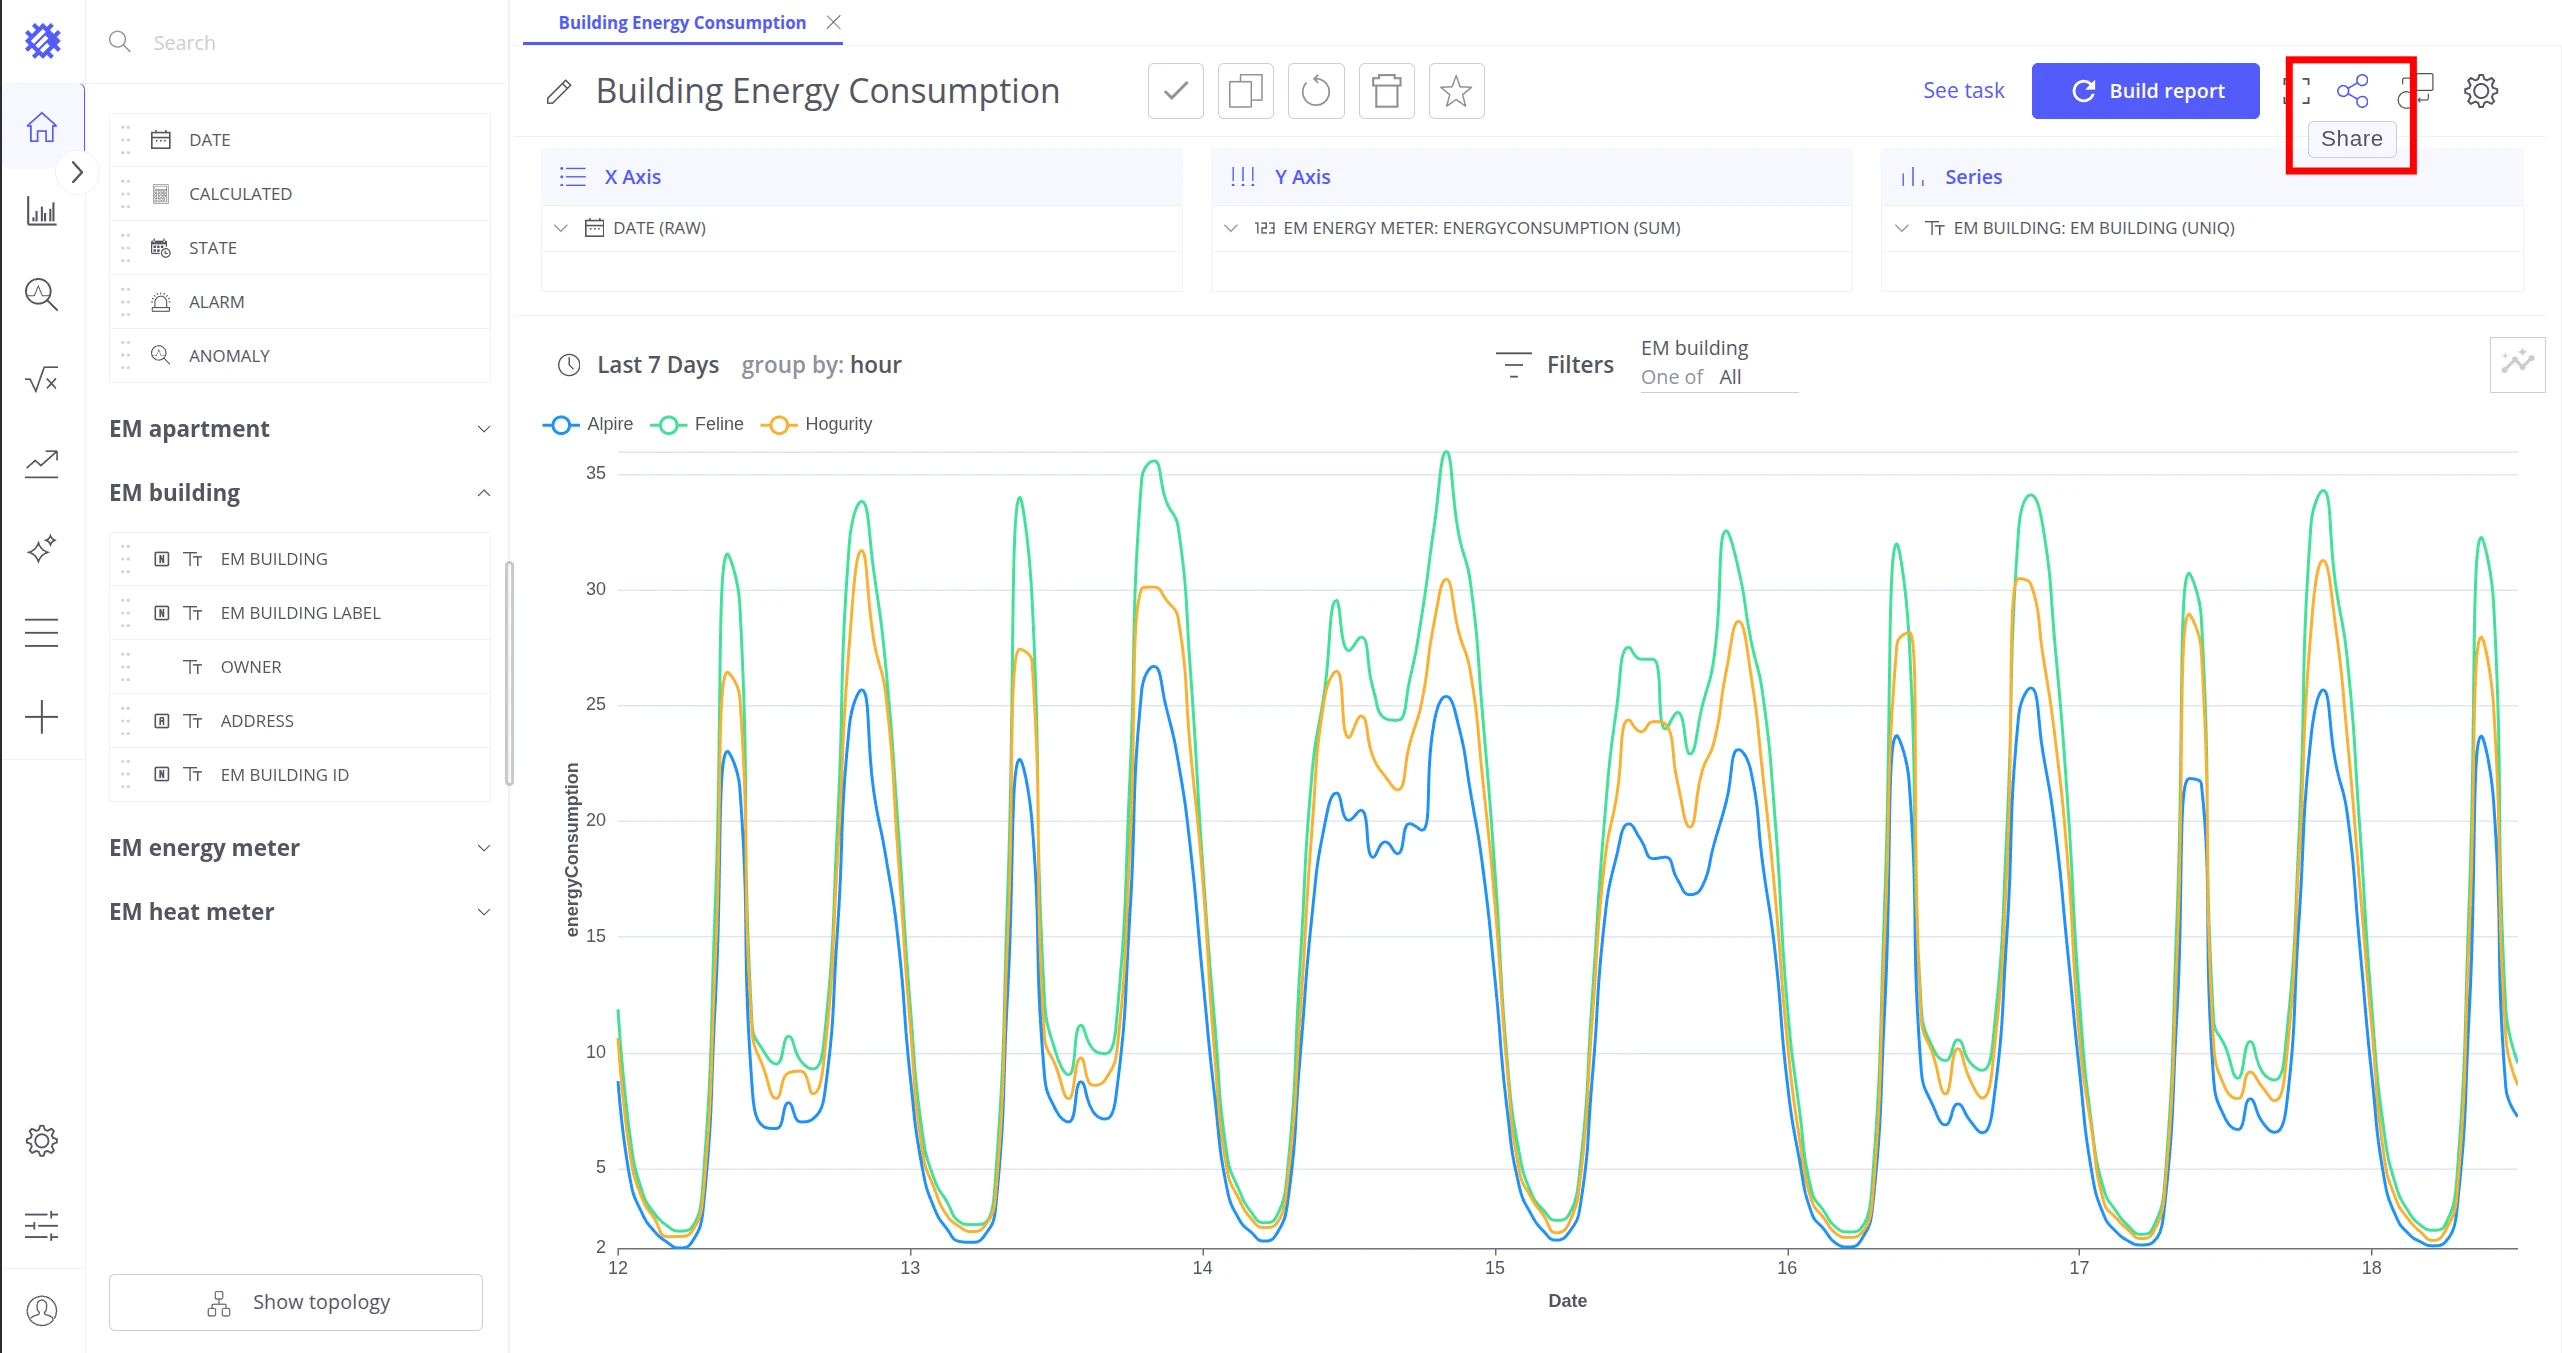
Open the visualization in Trendz and click Share in the top-right corner.
-
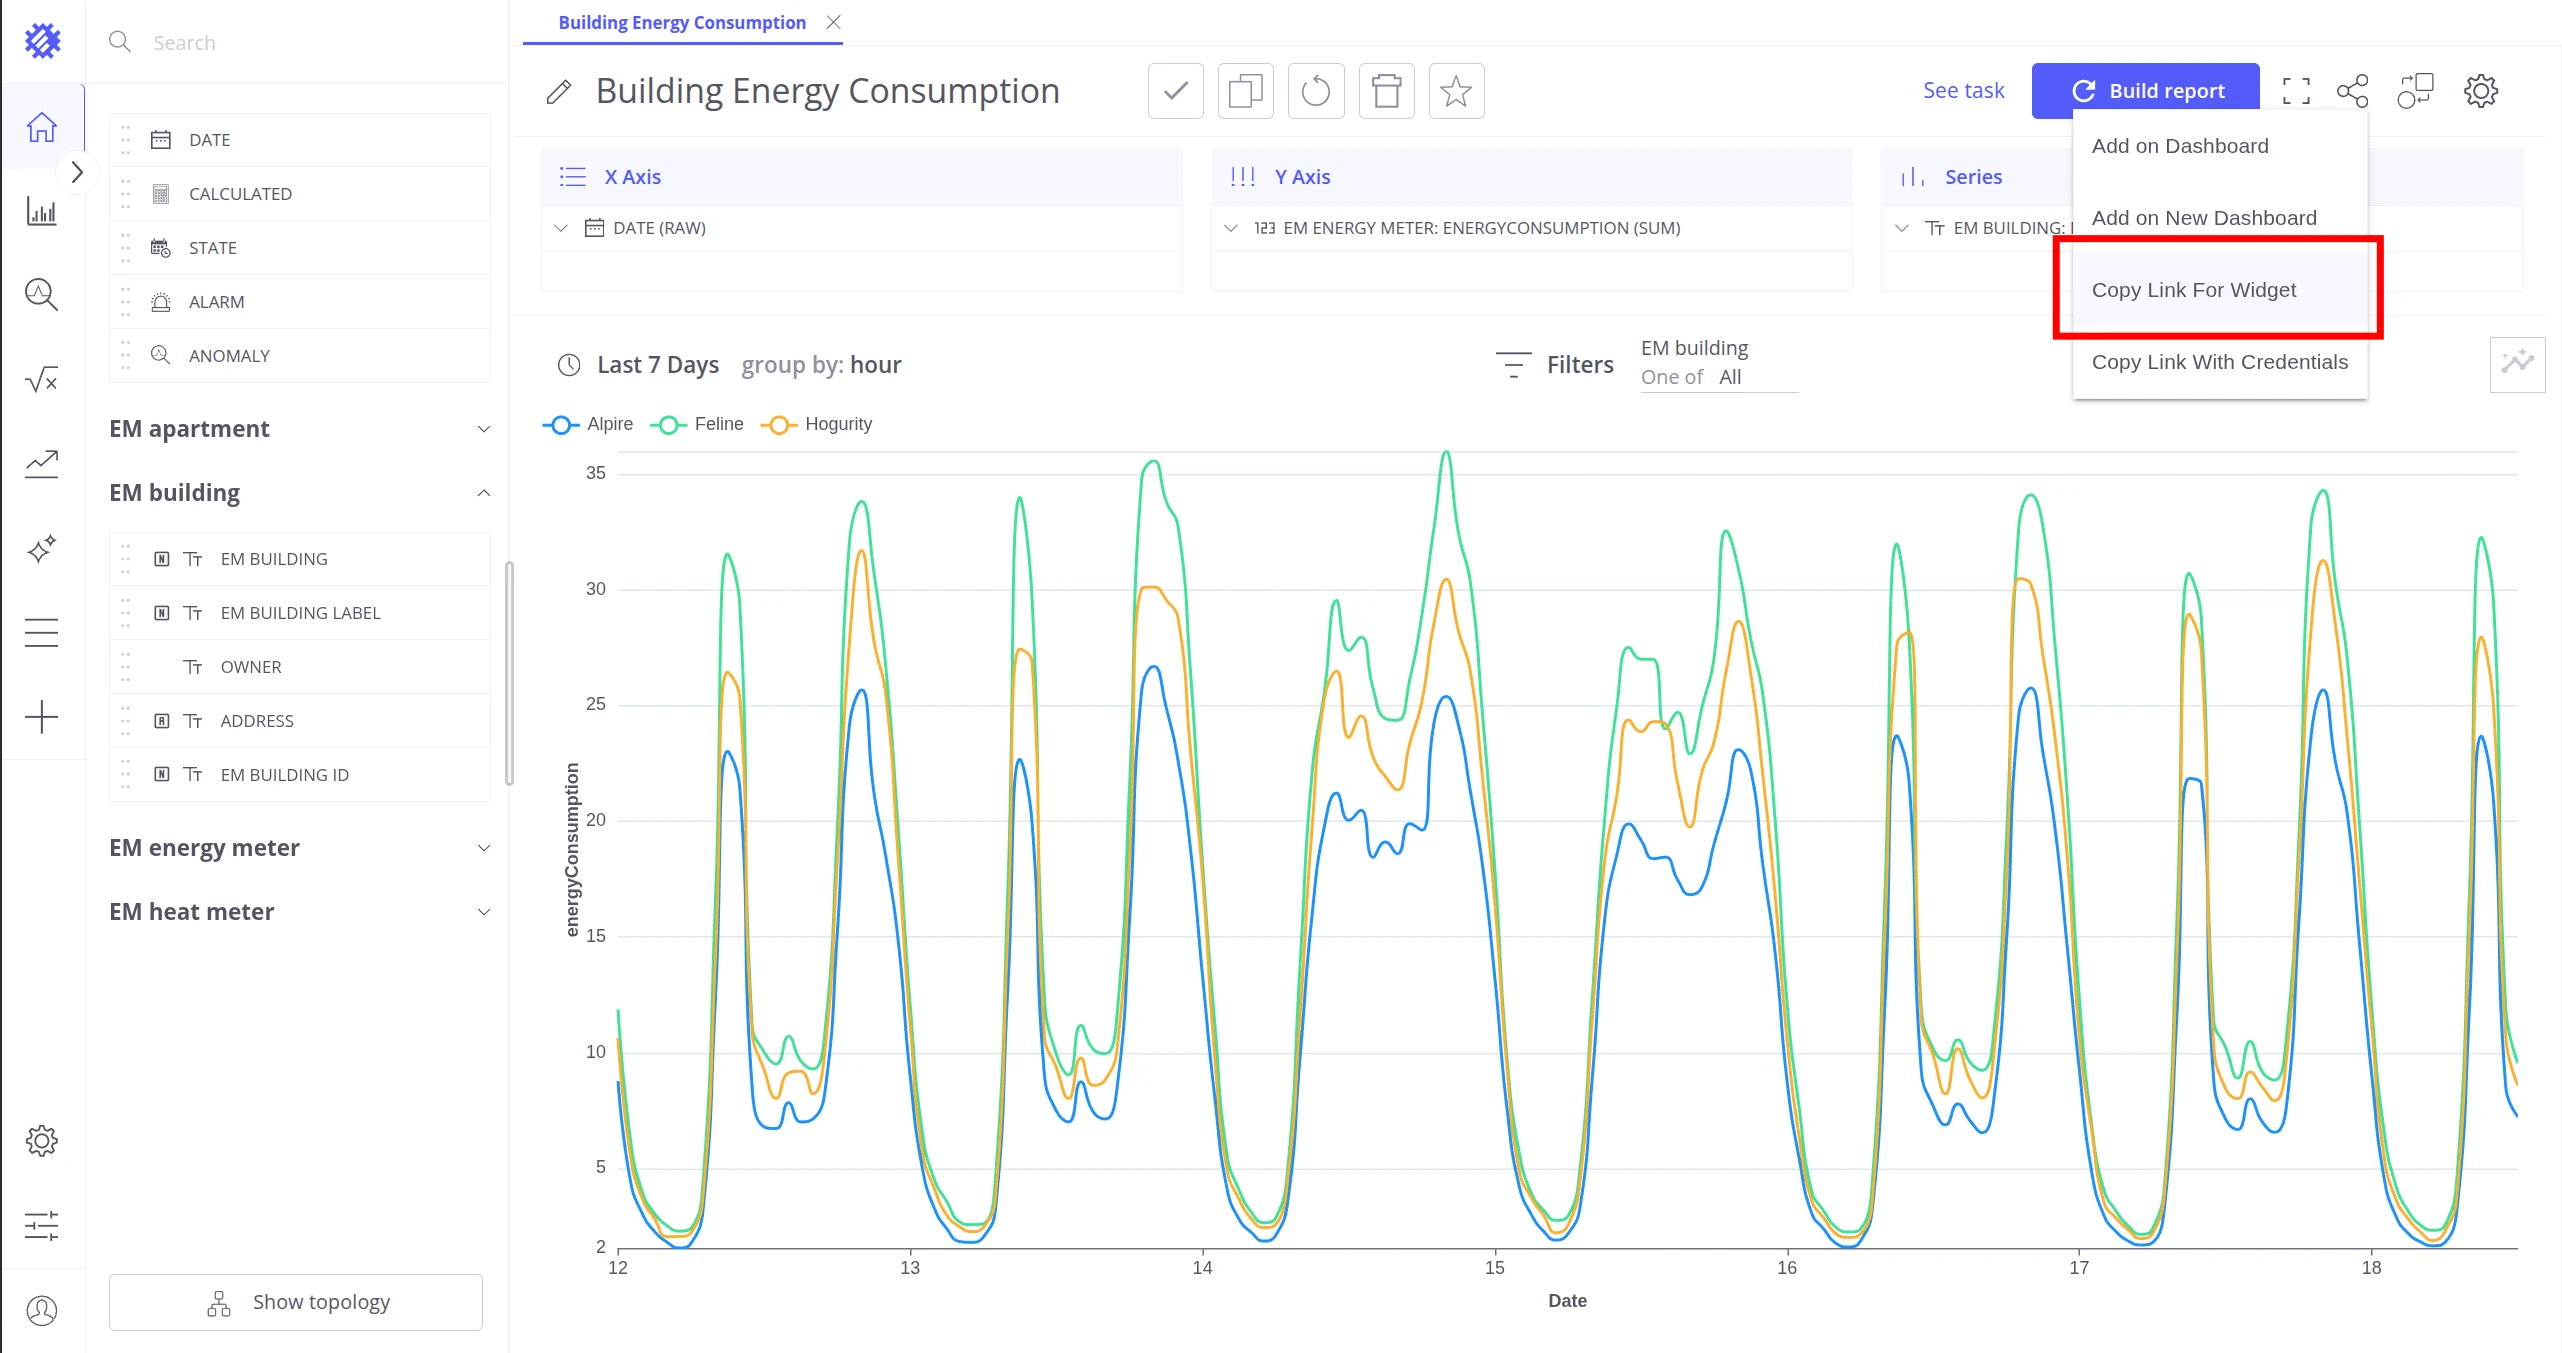
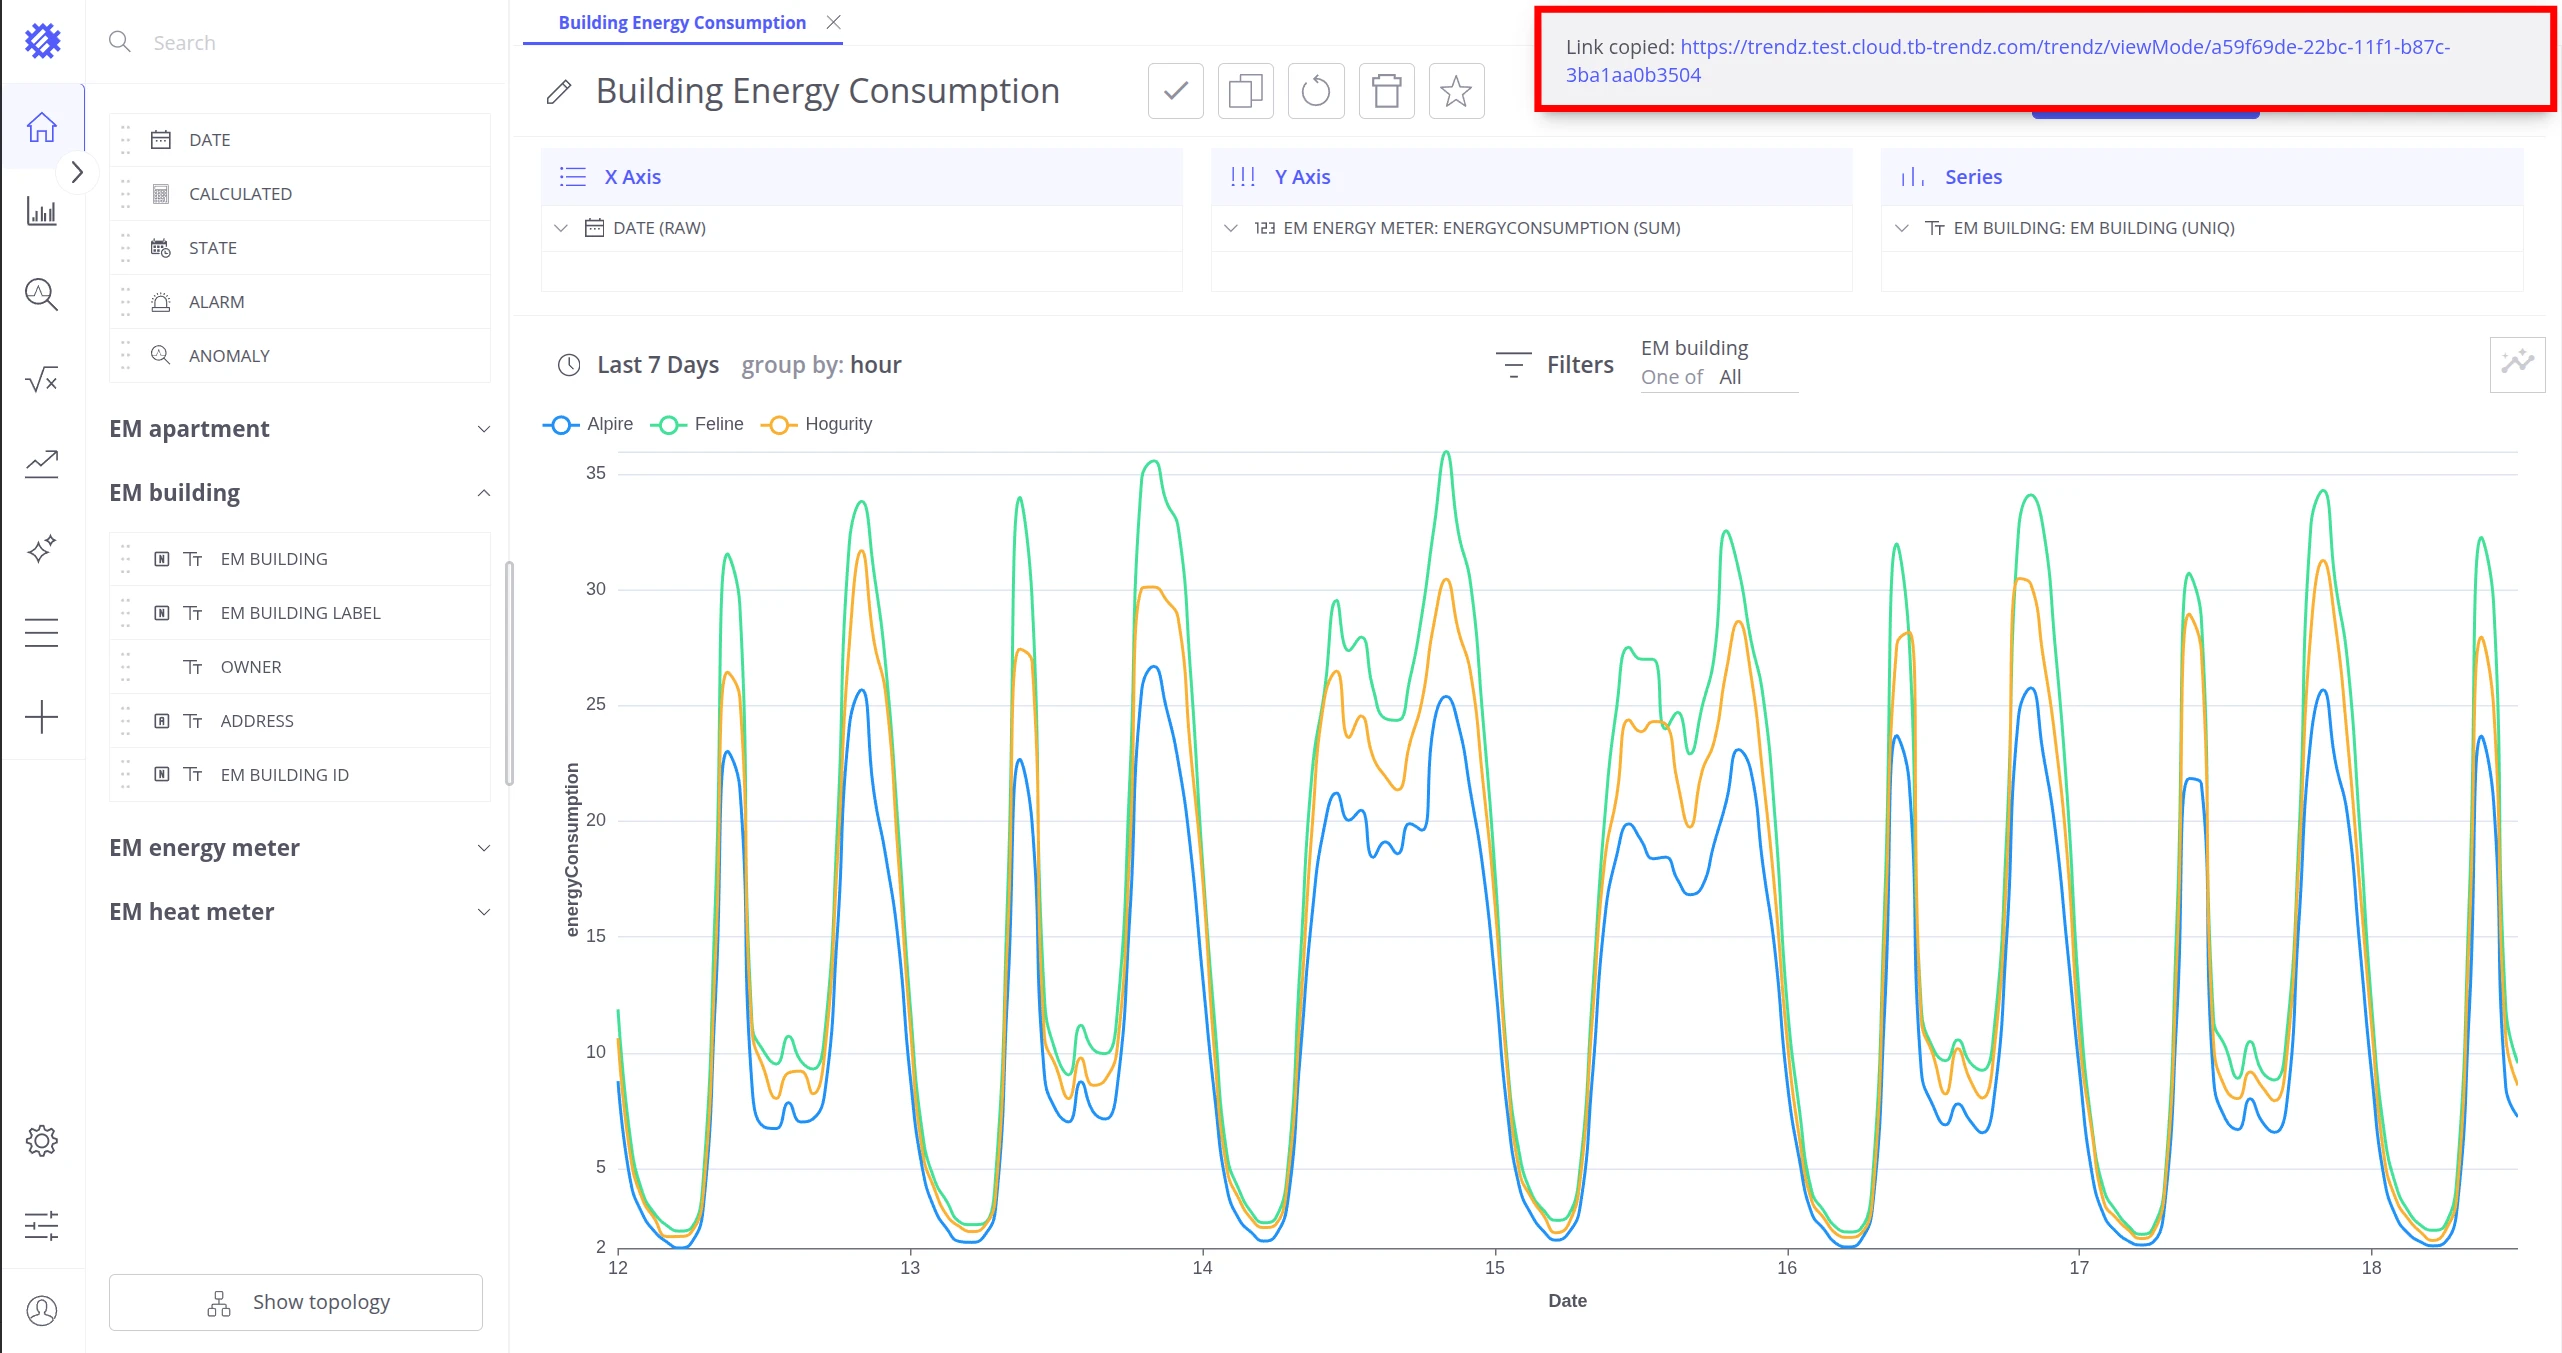
Select Copy Link For Widget. The URL is copied to your clipboard.
Add the widget to the dashboard
Section titled “Add the widget to the dashboard”-
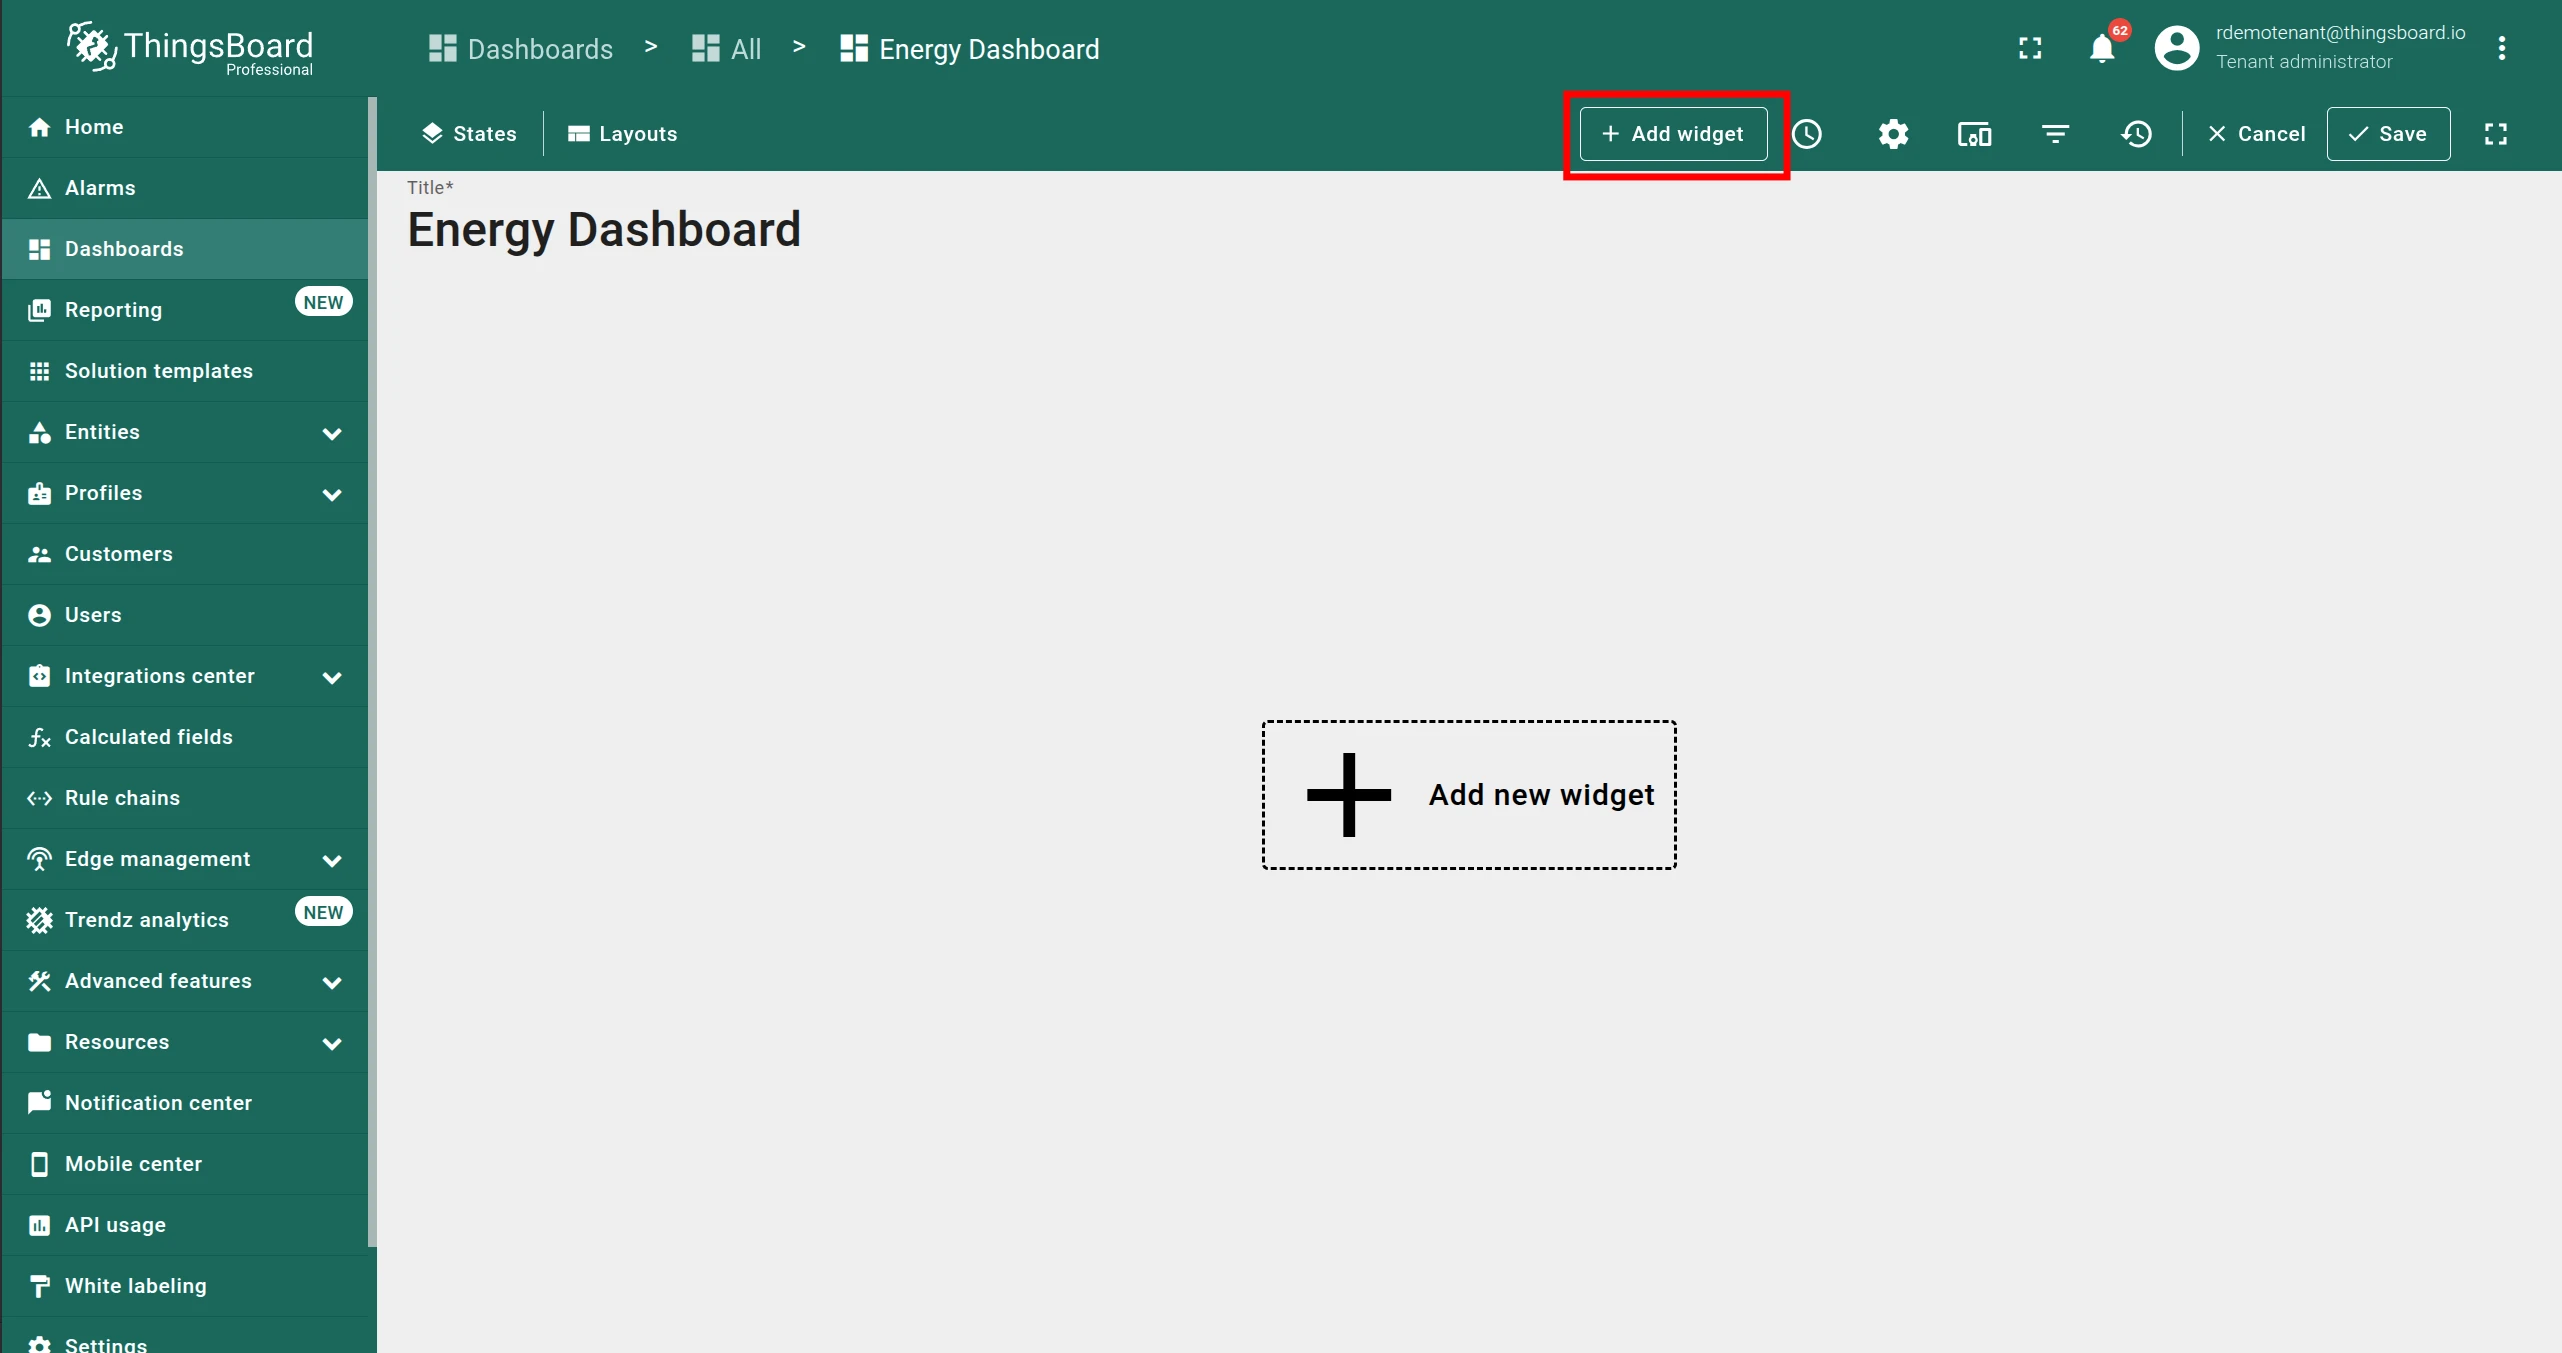
Open the target ThingsBoard dashboard in edit mode and click Add widget (+).
-
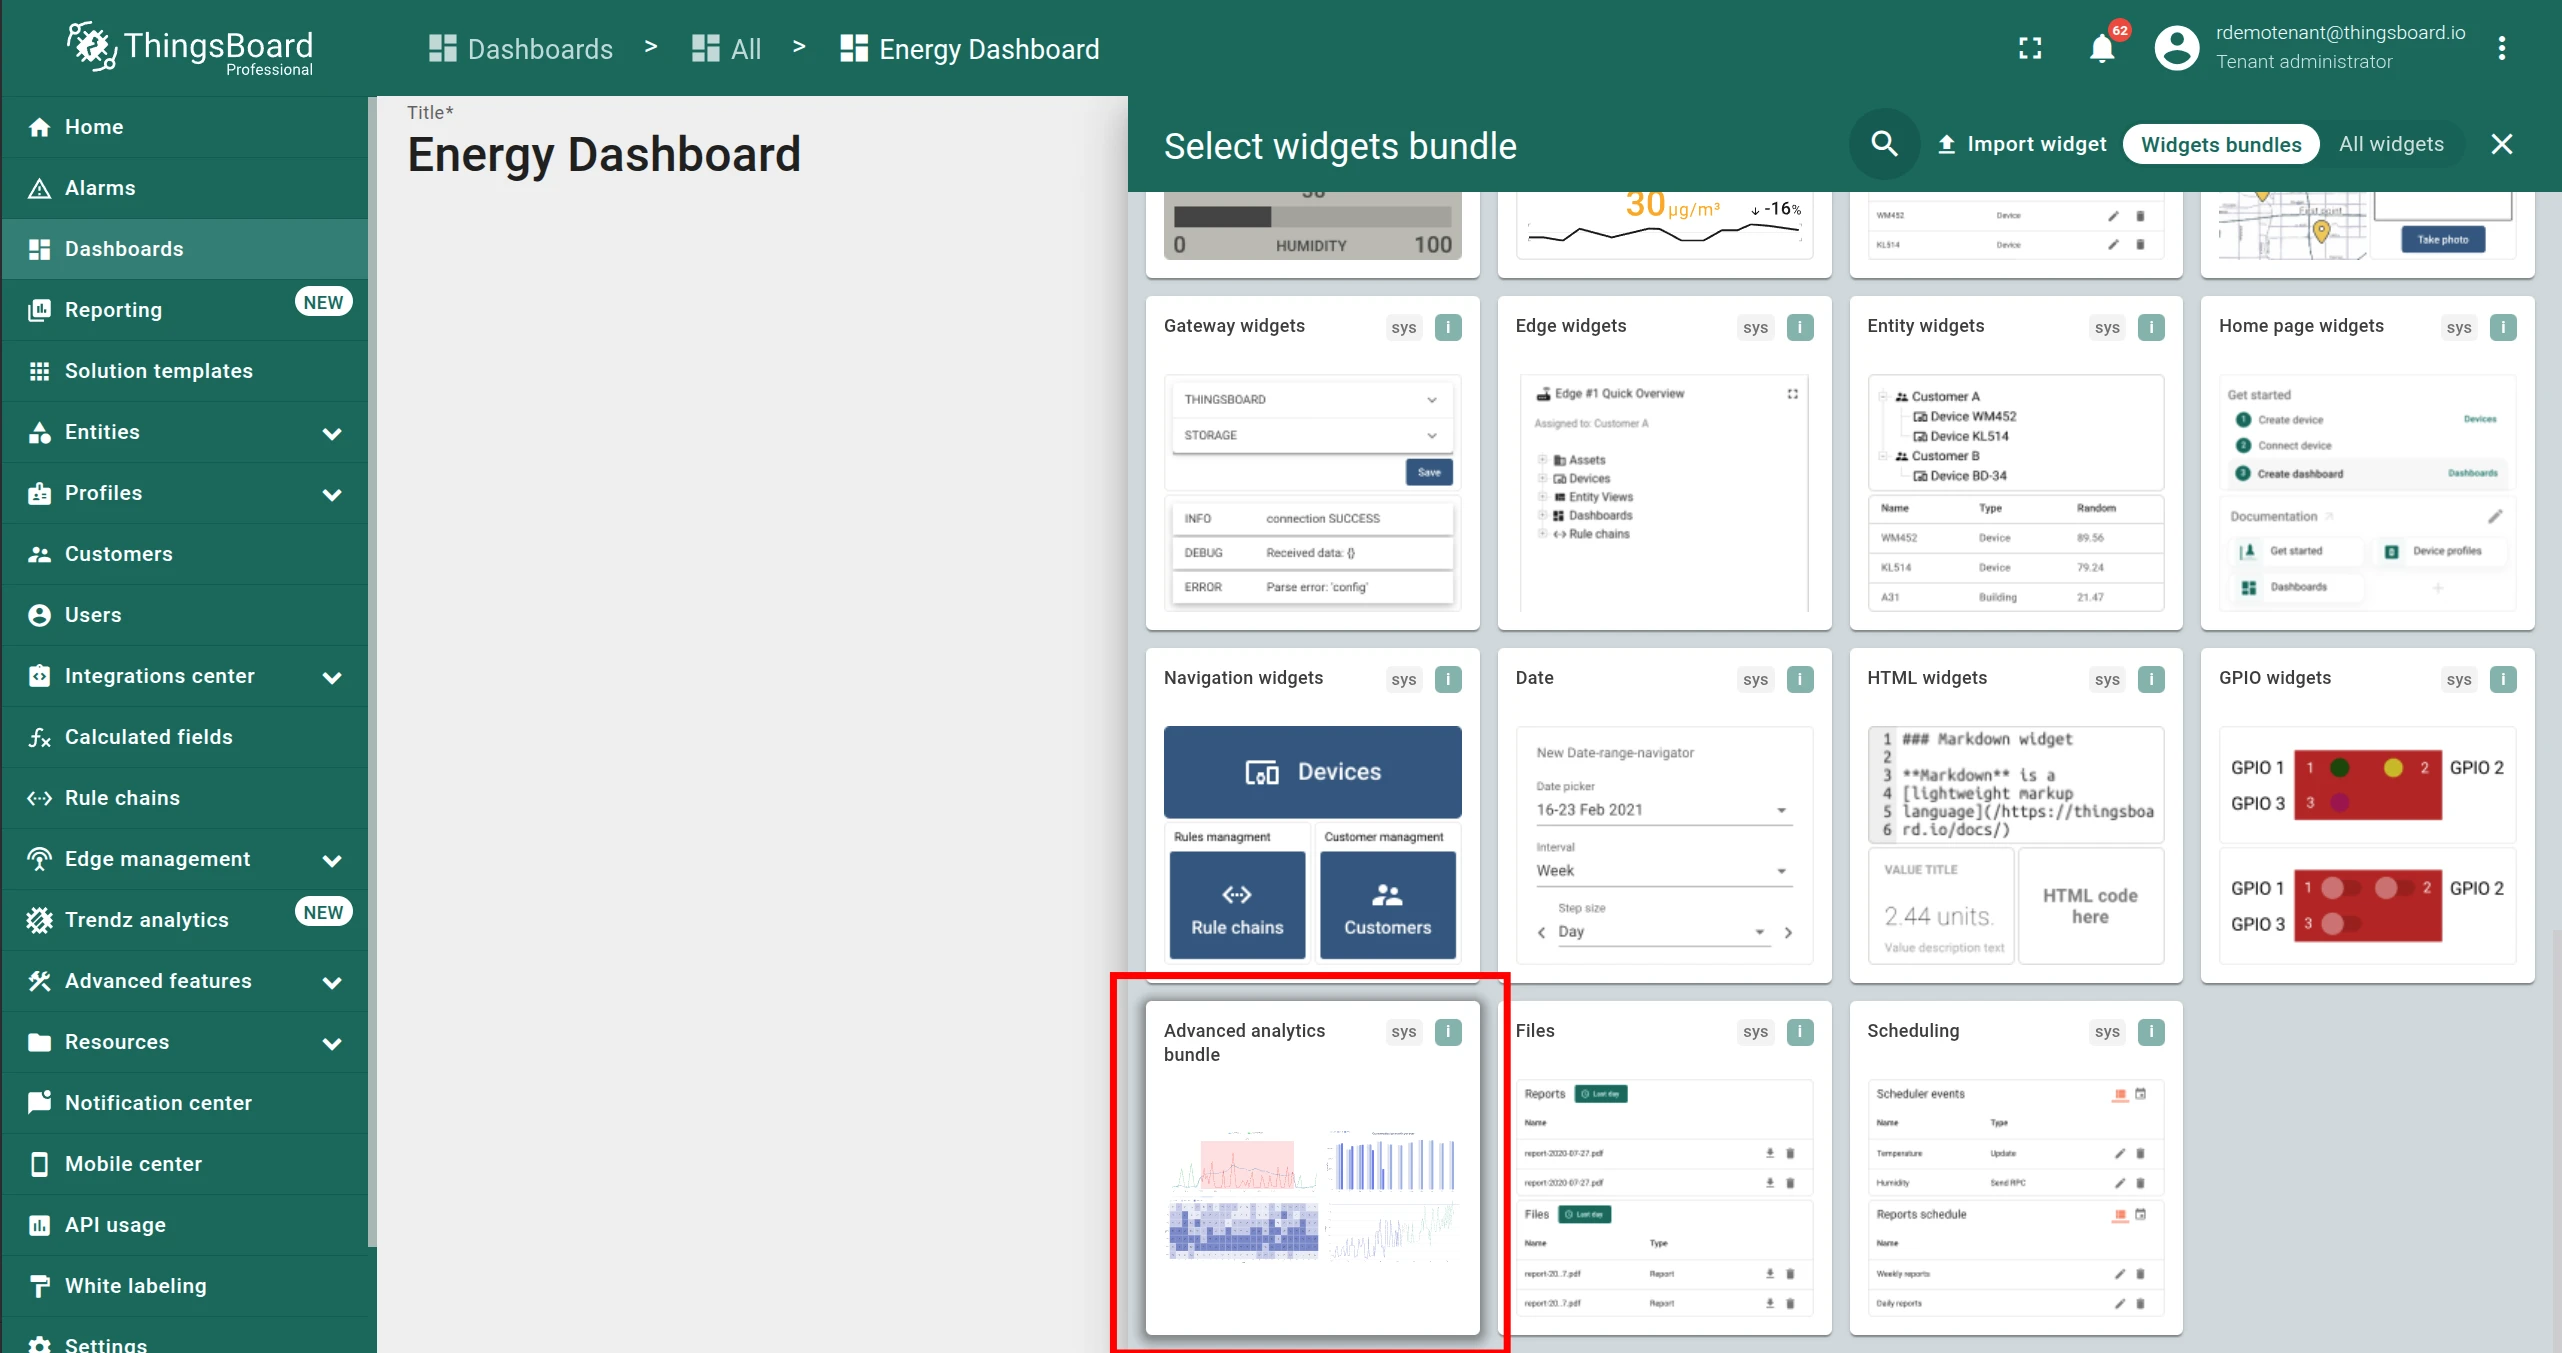
Select Advanced analytics bundle from the widget bundles panel.
-
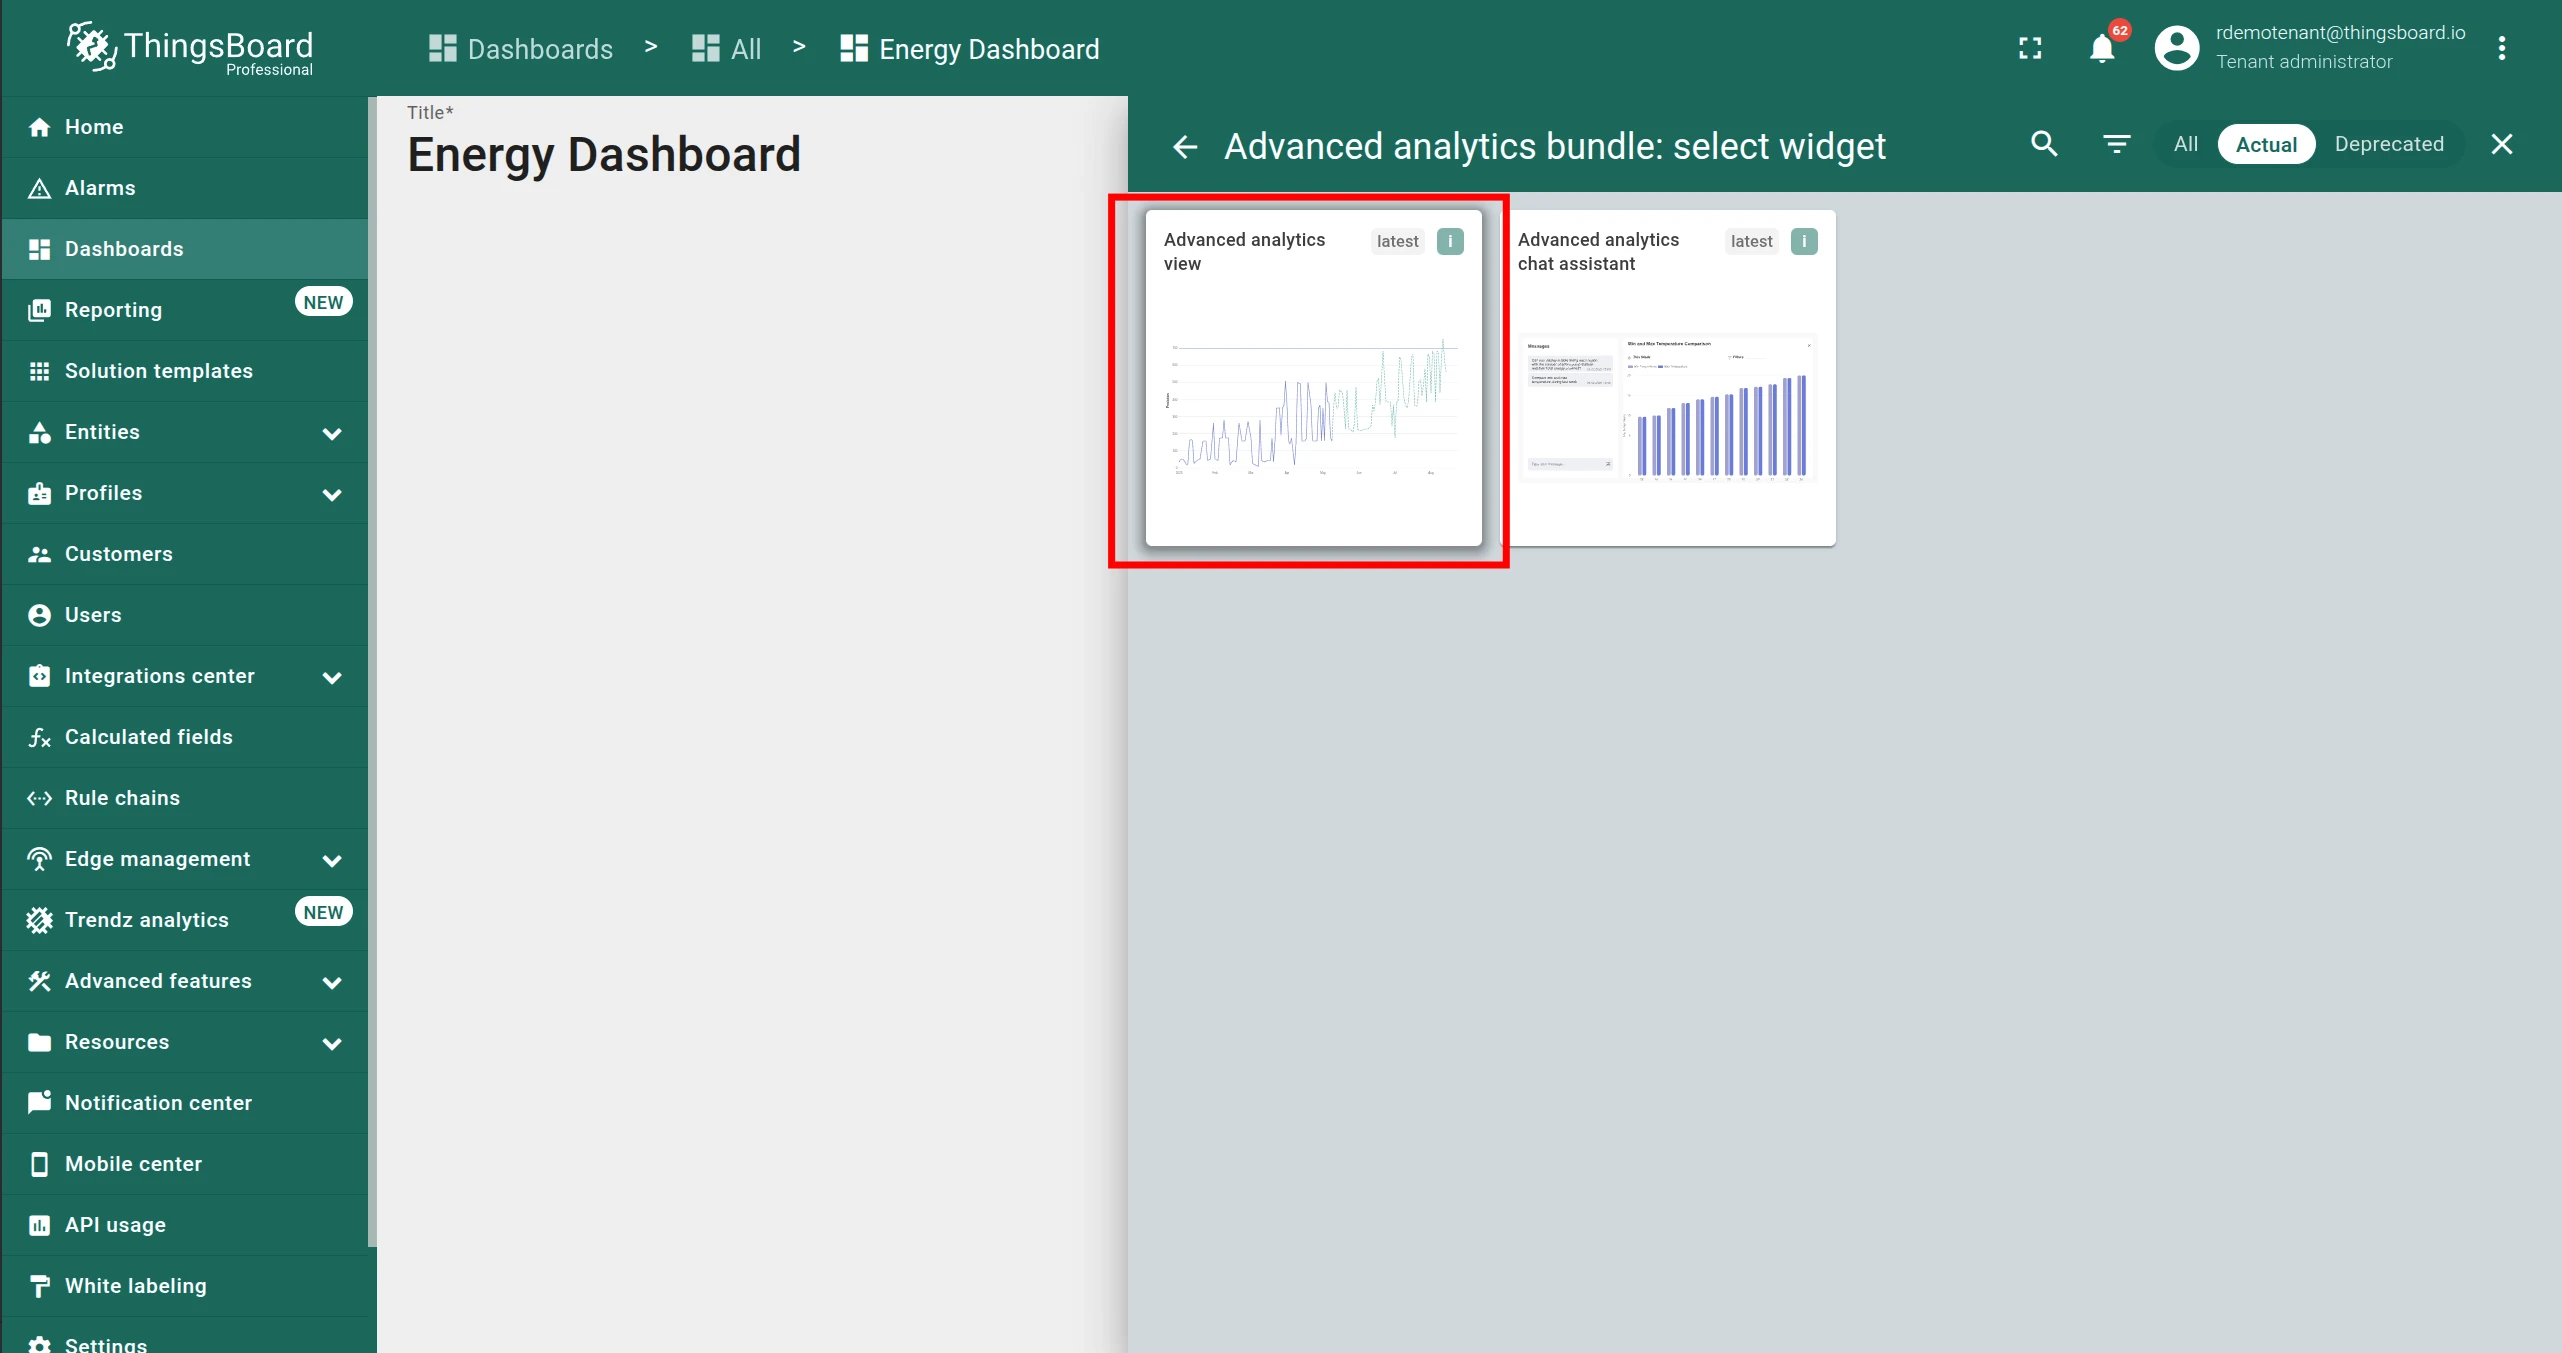
Select Advanced analytics view. The widget configuration dialog opens.
-
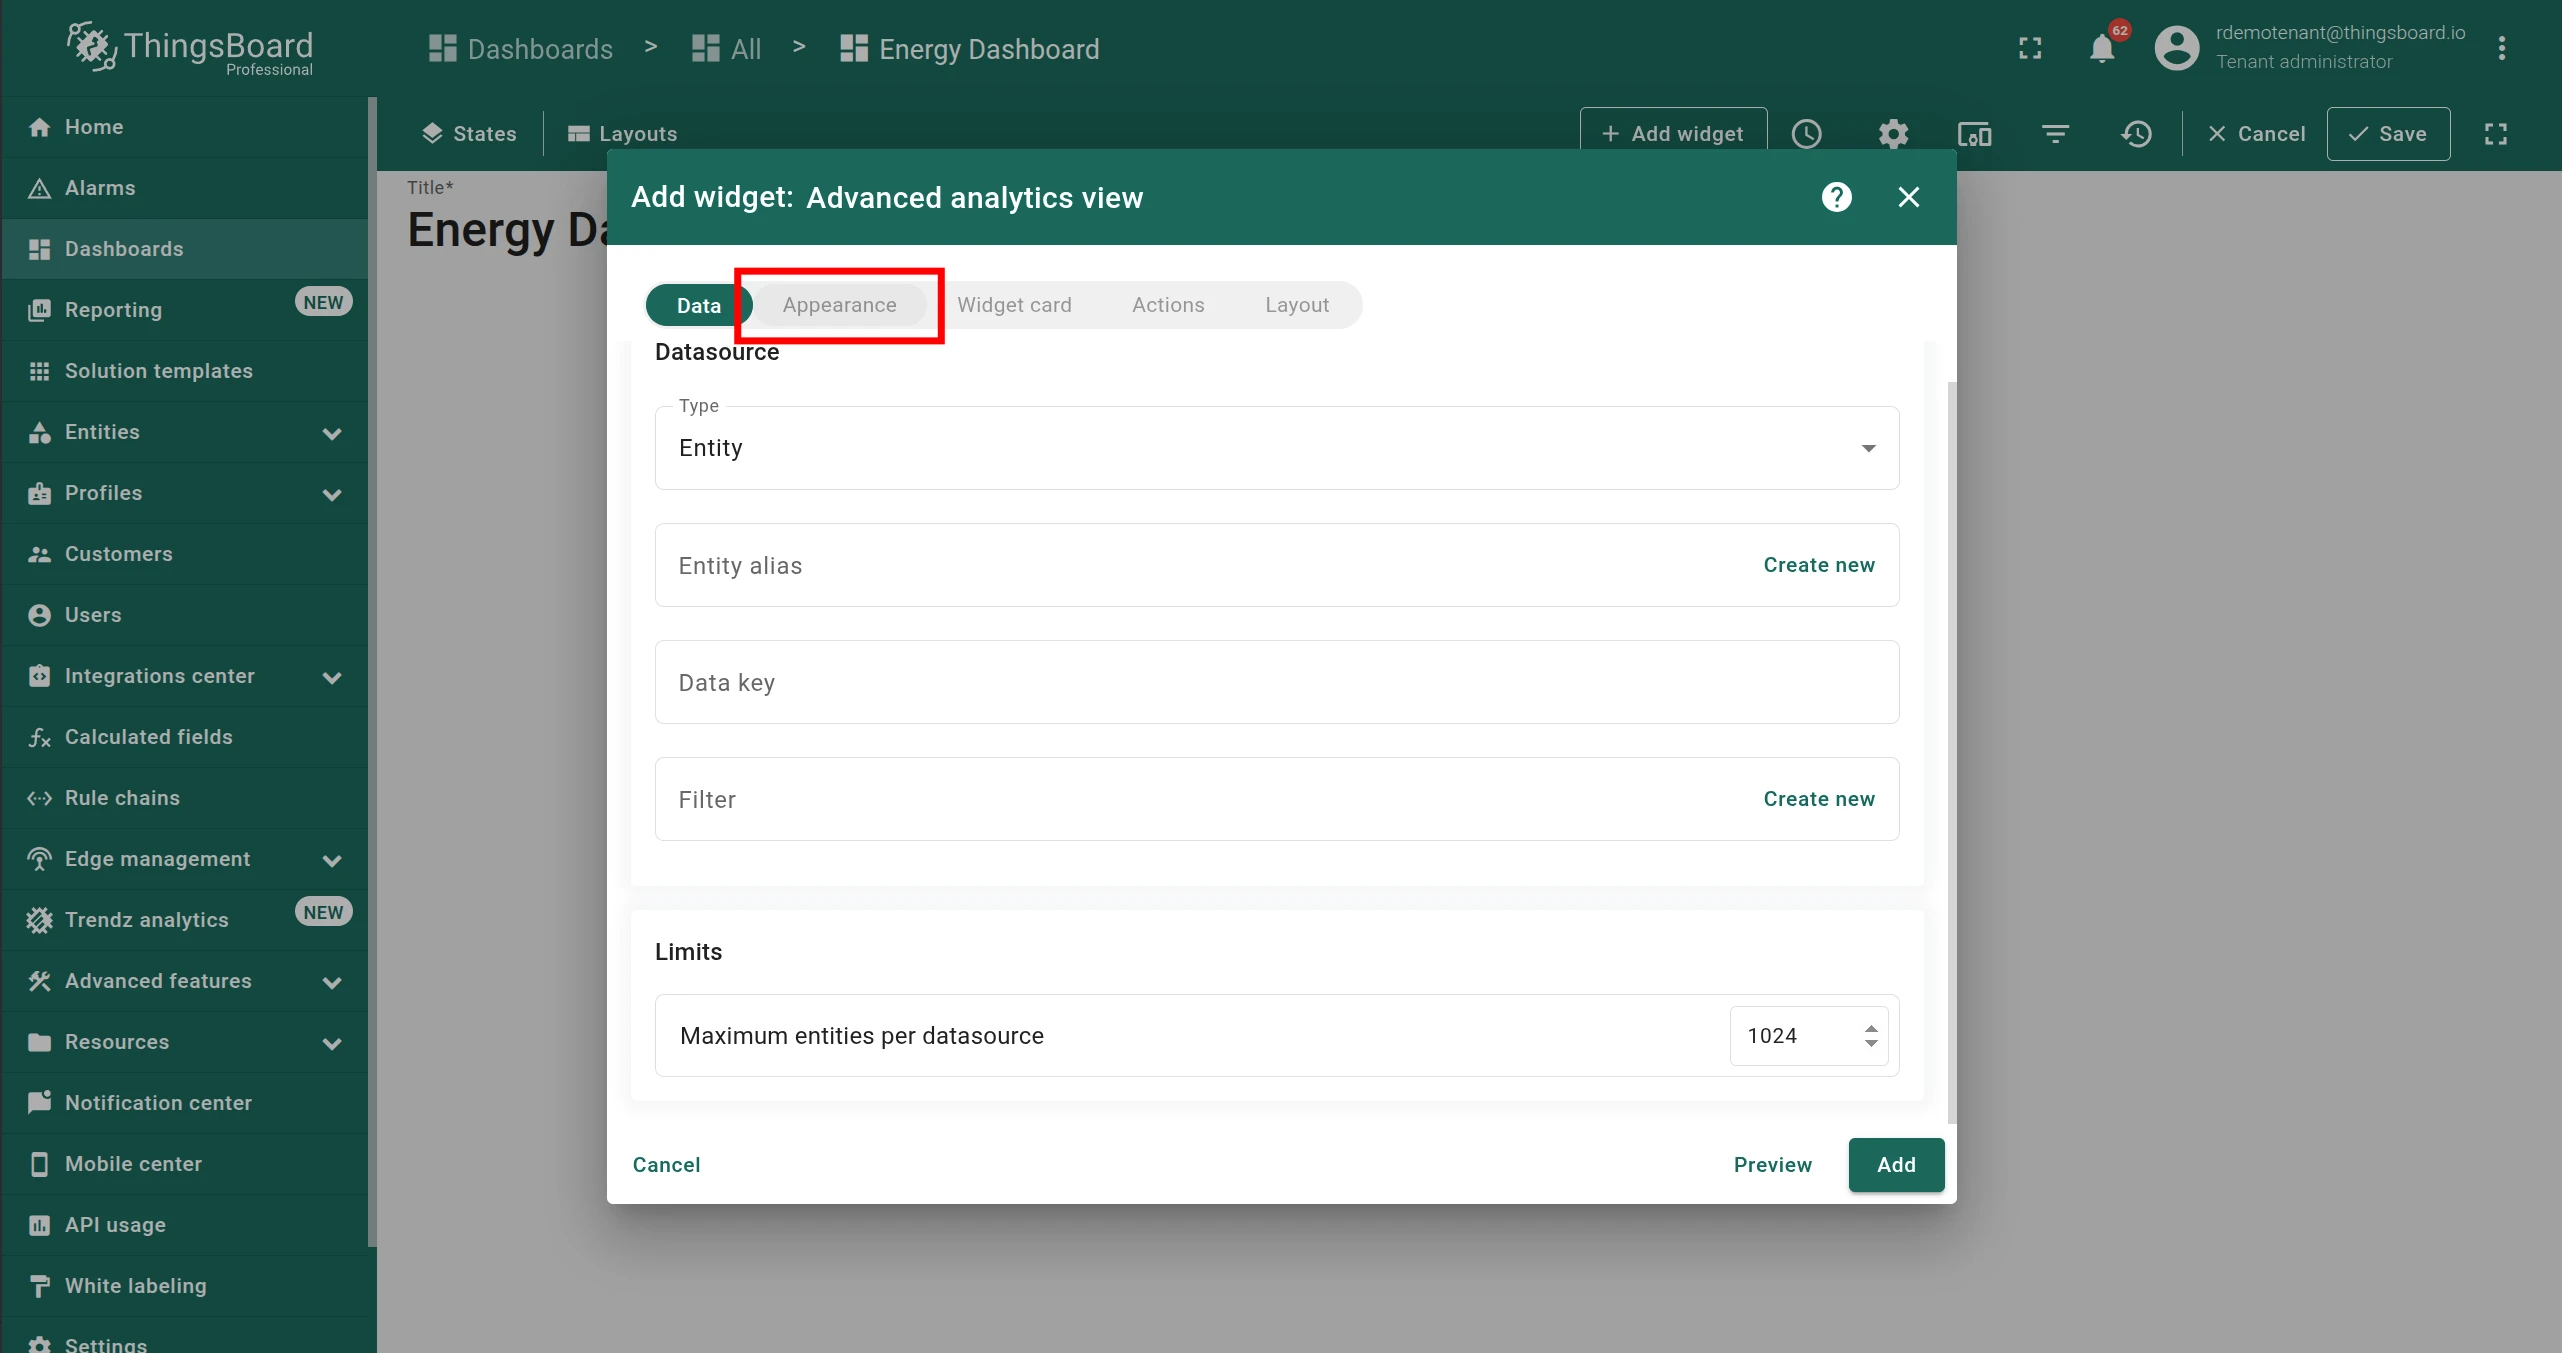
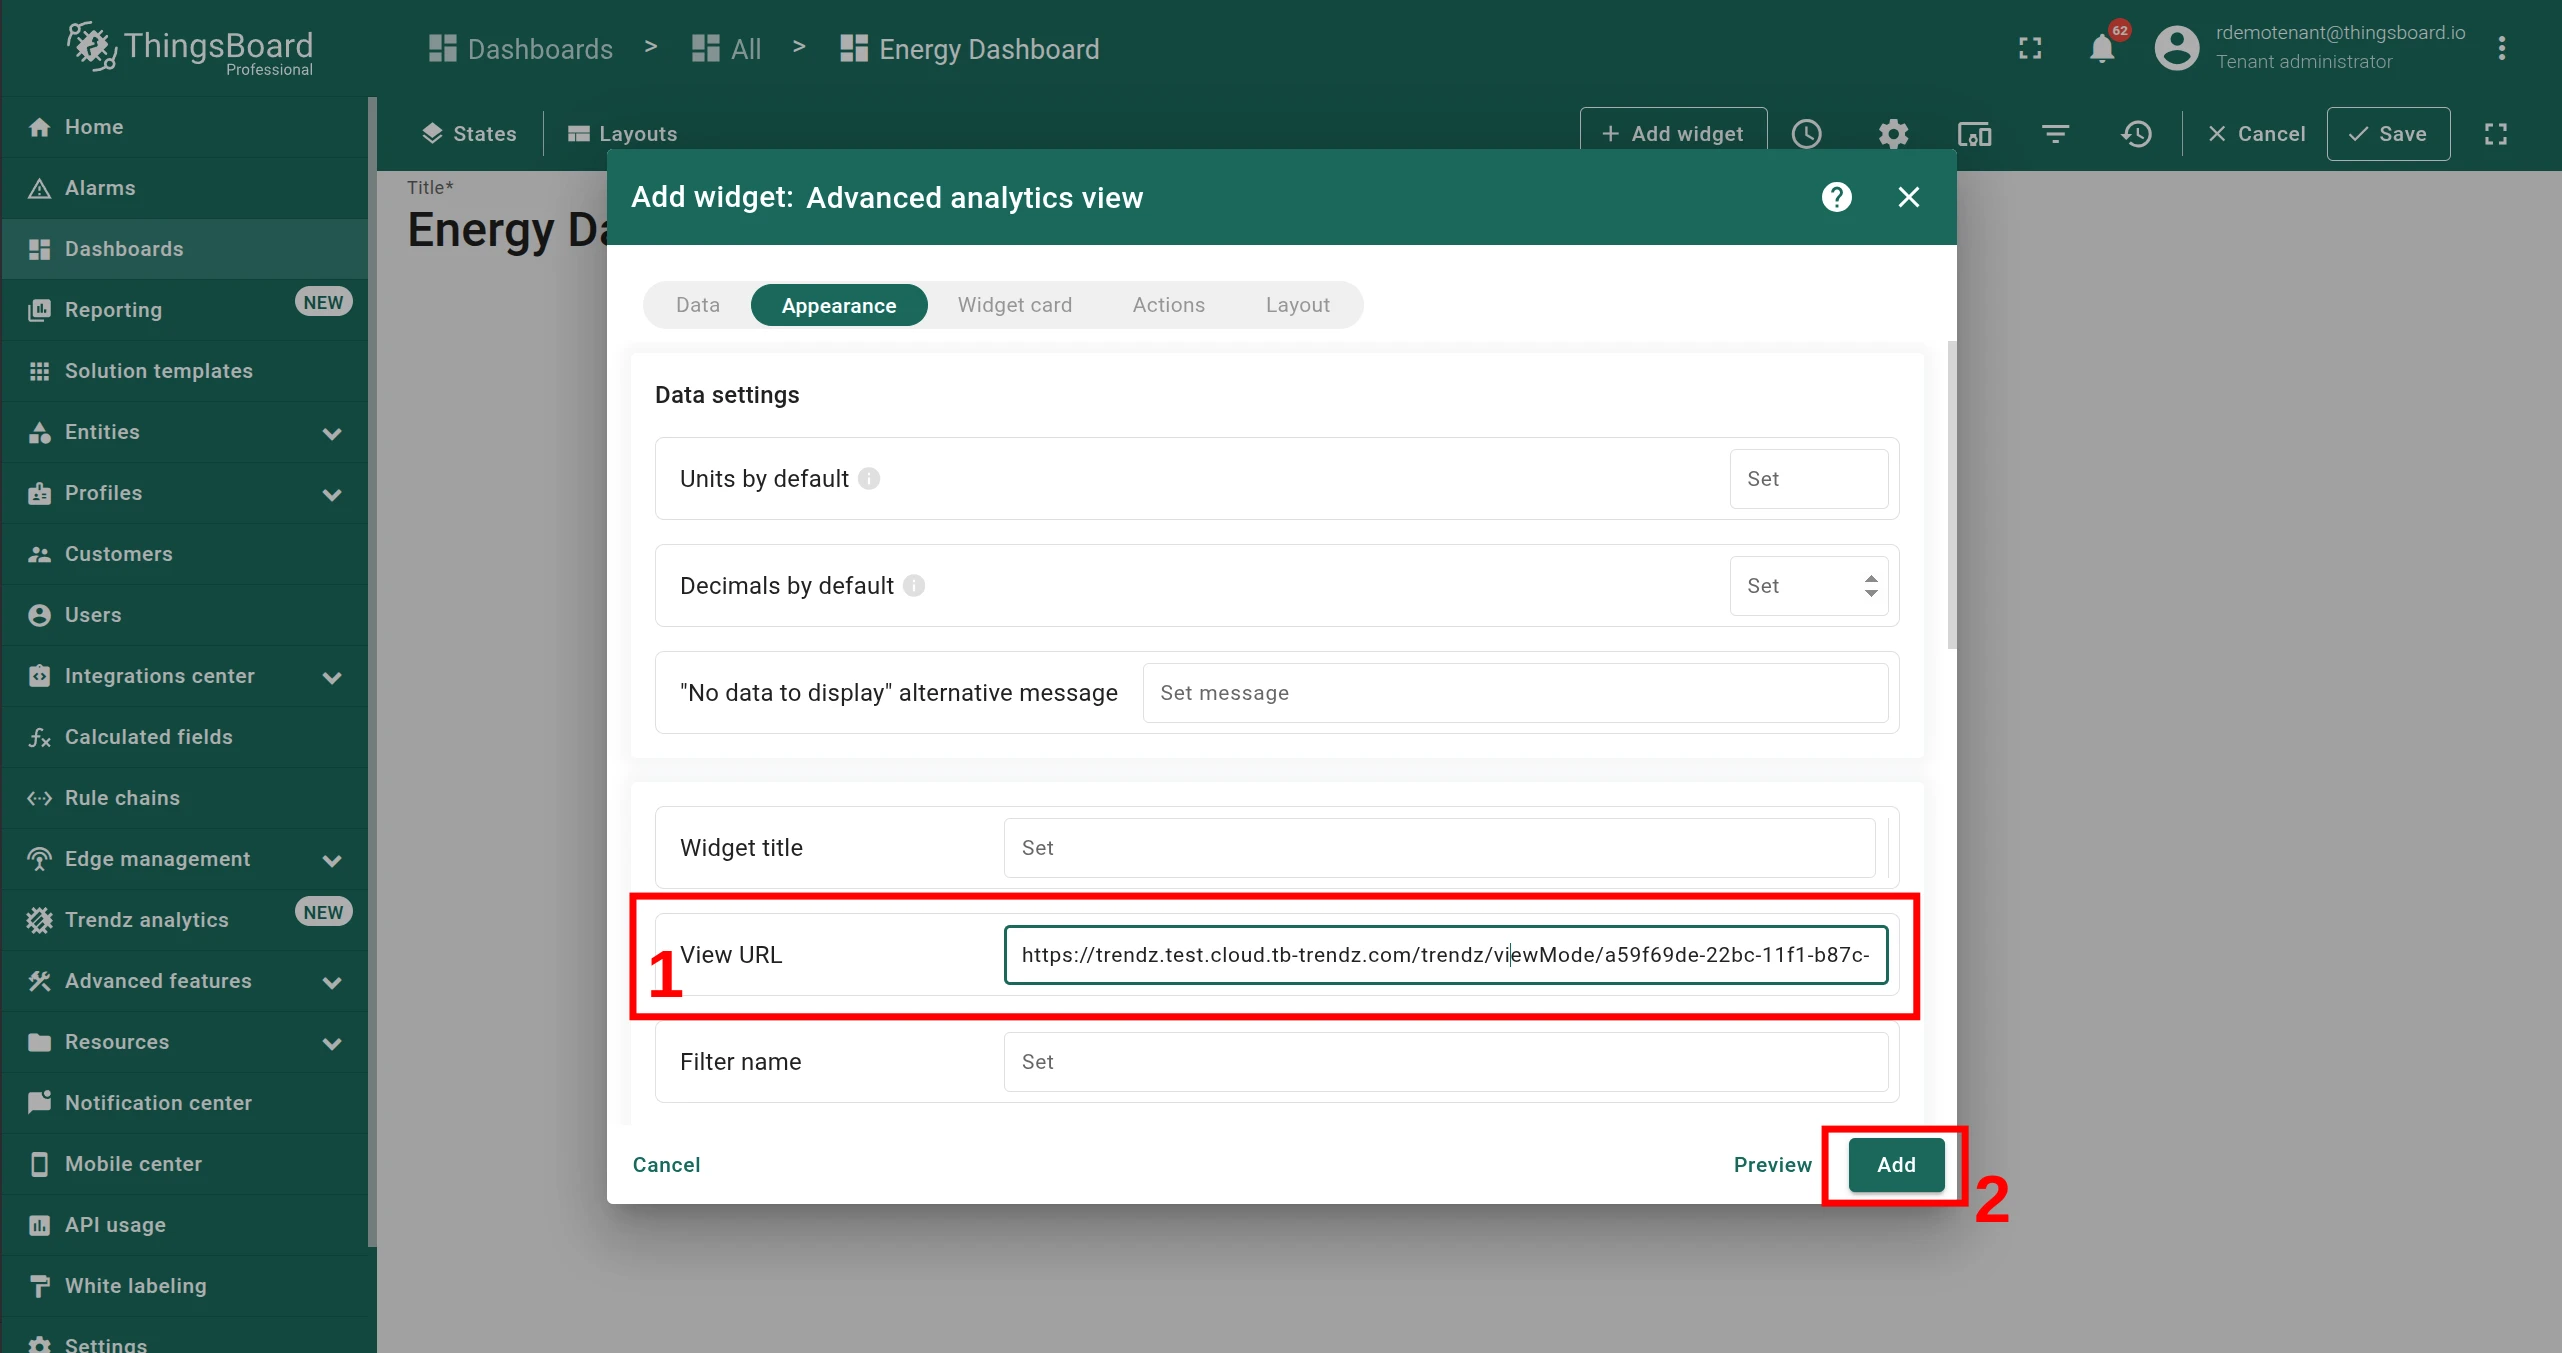
Switch to the Appearance tab.
-
Paste the copied URL into the View URL field and click Add.
-
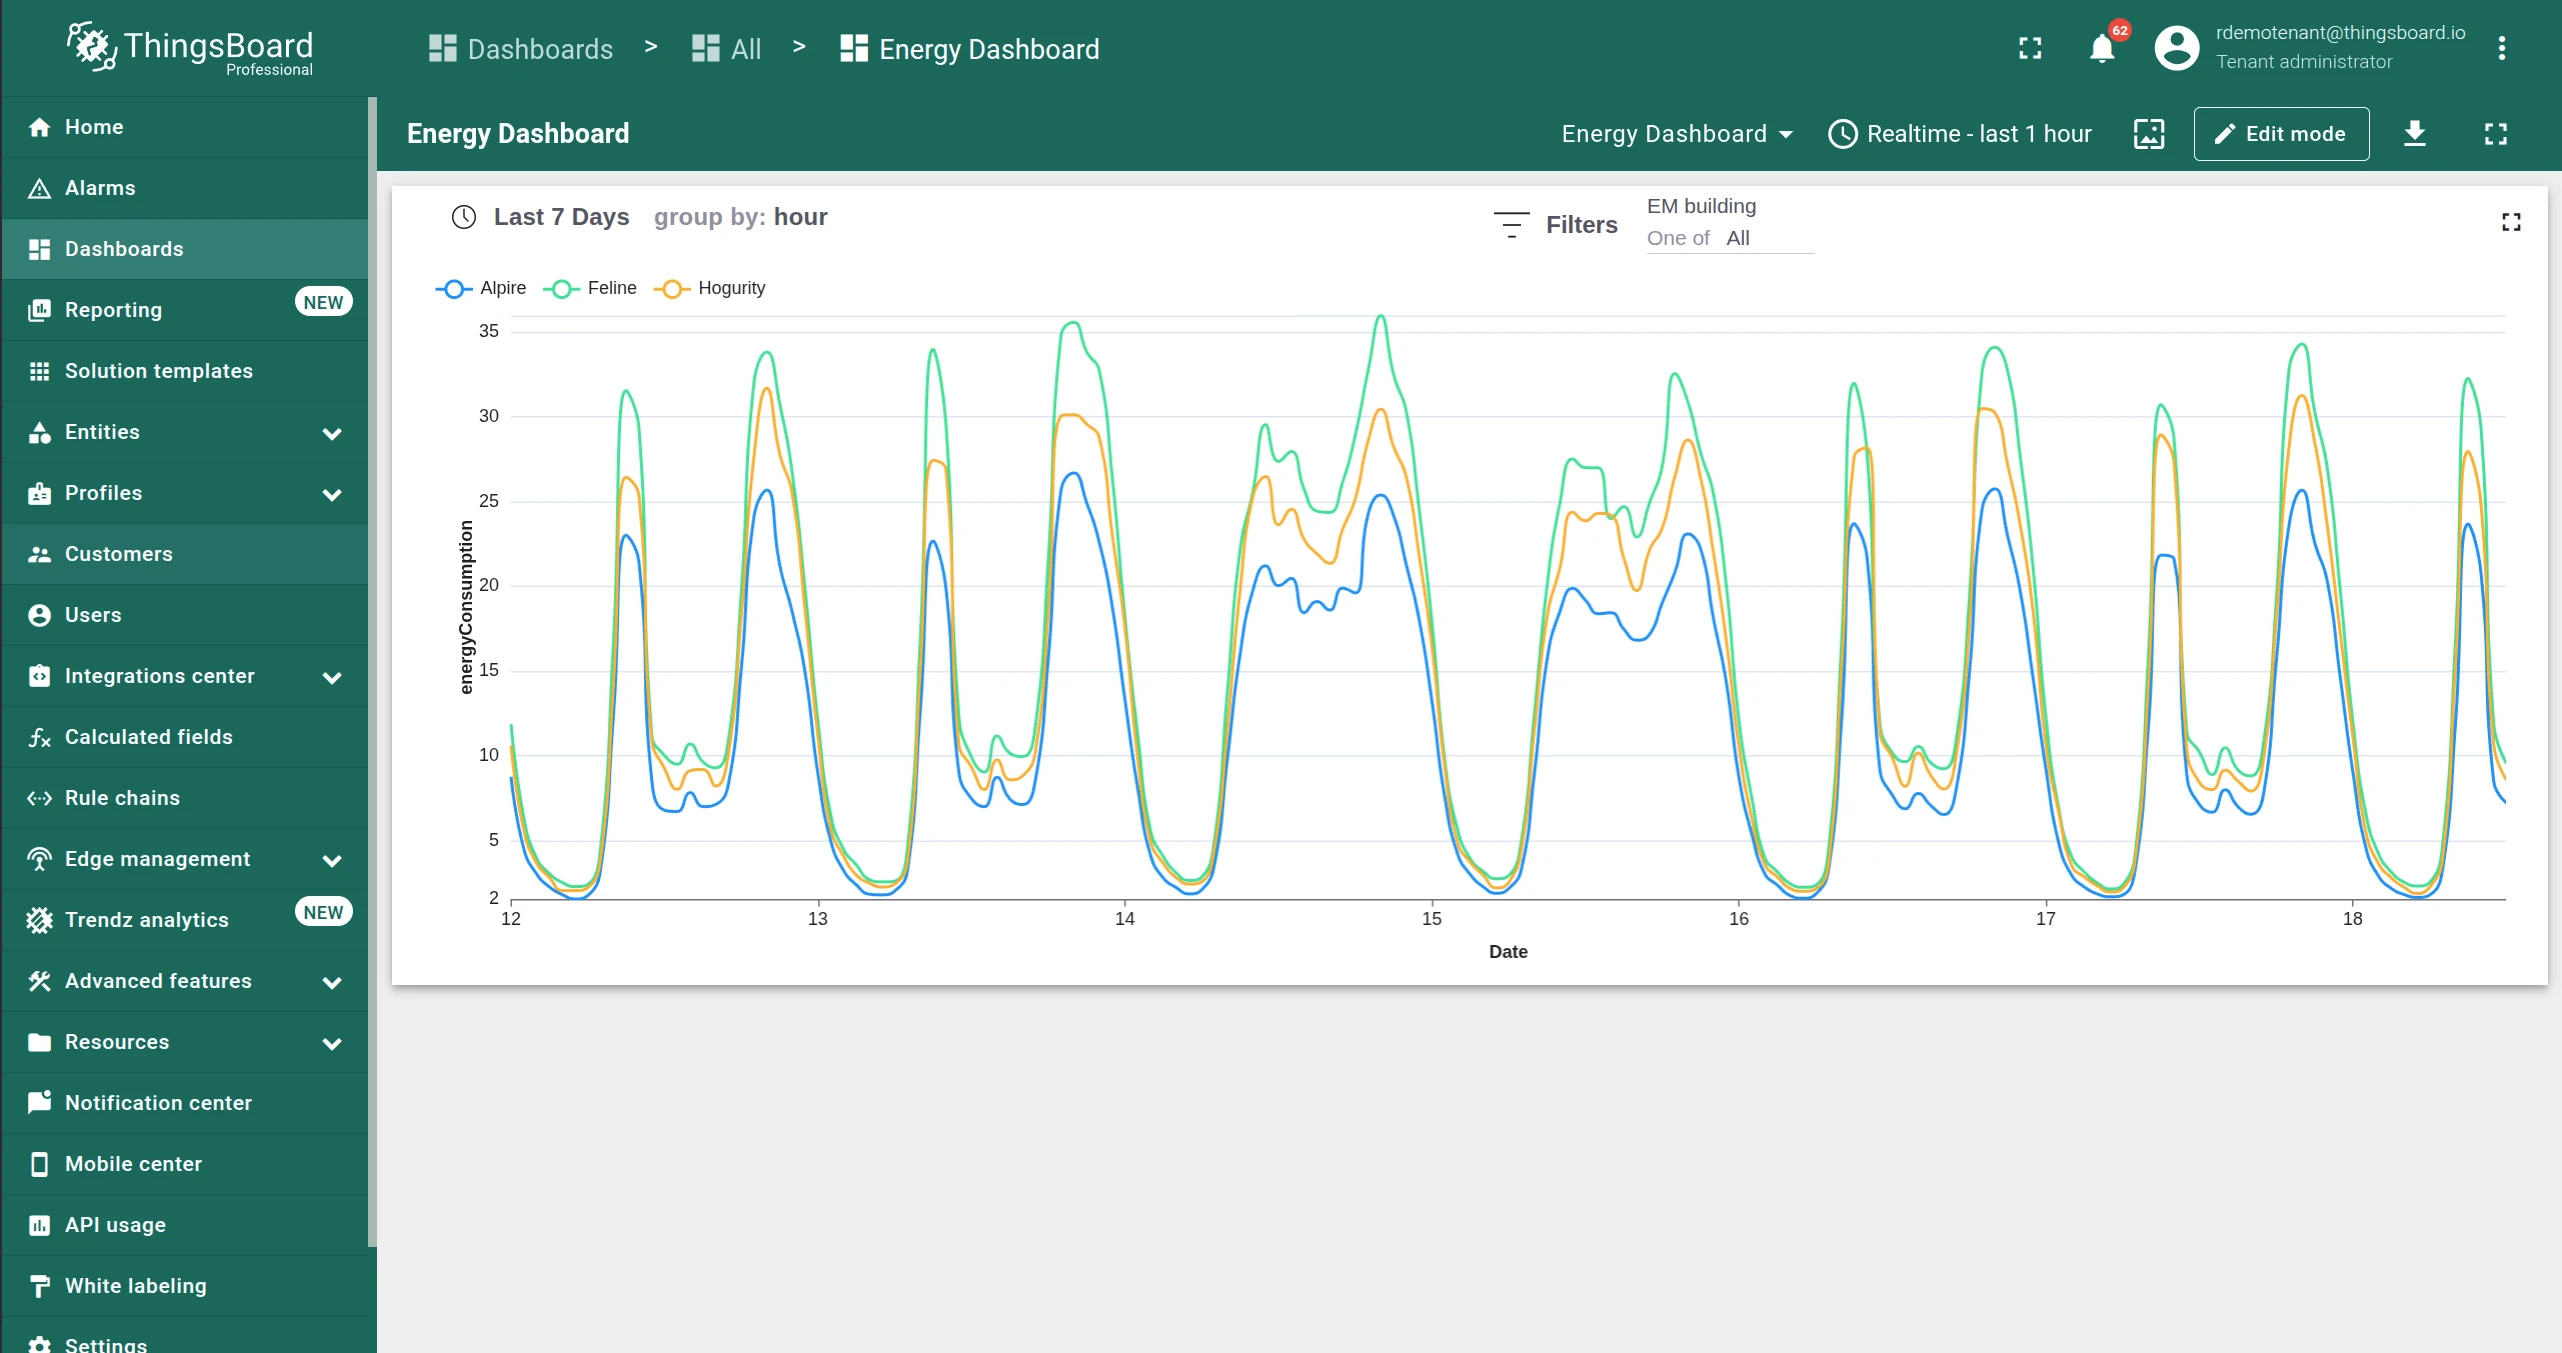
Click Save. The widget appears on the dashboard.
Troubleshooting
Section titled “Troubleshooting”Blank view (mixed content / HTTPS issue)
Section titled “Blank view (mixed content / HTTPS issue)”If ThingsBoard uses HTTPS and Trendz uses HTTP, the browser blocks requests to Trendz as mixed content. The widget appears blank and an error is visible in the browser console.
To fix this, enable HTTPS for Trendz. See the Trendz installation guide for details.
Was this helpful?