Anomaly view widget
To visualize anomalies discovered during model creation and anomalies that we re discovered during anomaly refresh job, you can use Anomaly view widget from Trendz.
View Anomaly widget shows anomalies that anomaly model detected. It consists of two parts:
- List with all detected anomalies that allows you to select a specific anomaly to see its information in the chart.
- Line chart displaying selected anomaly information.
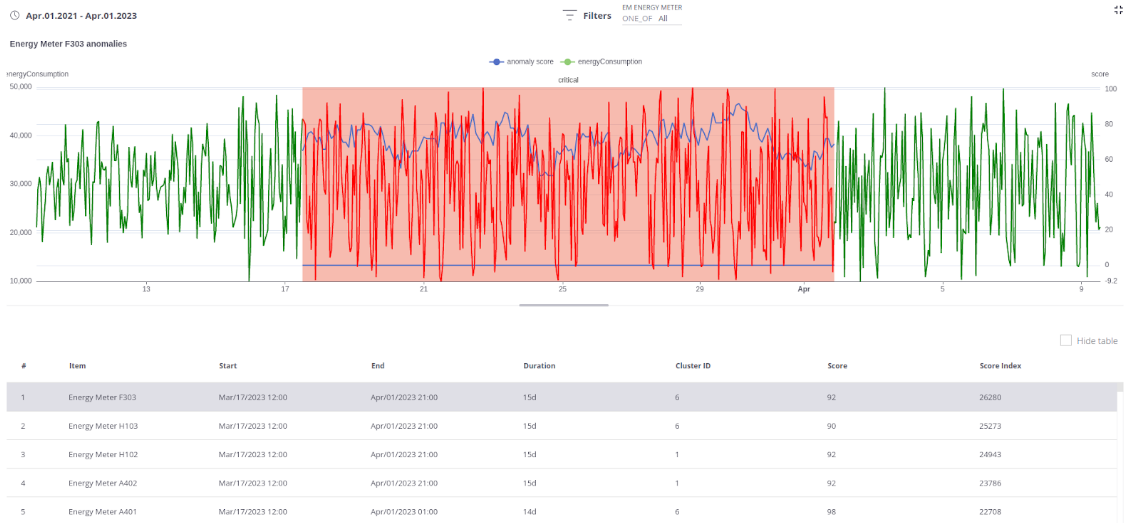
To create Anomaly View, you can choose an already created anomaly model from the list or create a new one.

Default anomaly selection
By default, the first anomaly that we see on the Anomaly View widget is the anomaly with the highest score index. However, in certain cases, it would be more useful to show the last detected anomaly first. To configure the widget to display the most recent anomaly first, follow these steps:
- Open View Settings
- Select last option in Default Anomaly Selection menu

Hide anomalies list or chart
If you want to display only a specific part of Anomaly View Widget in View Mode, such as the chart or the list of anomalies, you can configure it in Chart Settings - View Mode fields. In this section, you can choose to enable or disable the Hide anomalies list/chart option to show the desired part of the Anomaly View.

Anomaly field
Also, you can use Anomaly field on any visualization that are available in Trendz. IT may help to visualize bigger picture of anomalies - apply required filtering, data grouping, etc.
For example, you can create a pie chart that will show amount of anomalies discovered grouped by device, so user can understand most problematic devices.