Tables
The Table view in Trendz lets you build structured reports from device and asset data. Drag fields into the Columns, Dynamic Value, or Dynamic Column sections to control how rows and columns are assembled.
Video tutorial
Section titled “Video tutorial”Simple table
Section titled “Simple table”In this mode, drag fields only to the Columns section. Each field becomes one column in the table. You can sort and filter rows and reorder columns.
How aggregation works depends on whether a Date field is present:
  Without Date field  ──────────────────────────────────────────────  Time range: Jan 1 – Jan 31
  Columns section: [ Device name ] [ temperature ]
  ┌─────────────────┬─────────────────┐  │  Device name    │  temperature    │  ├─────────────────┼─────────────────┤  │  Sensor A       │  22.4  (avg)    │  ← whole range  │  Sensor B       │  19.1  (avg)    │  └─────────────────┴─────────────────┘
  With Date field  ──────────────────────────────────────────────  Columns section: [ Device name ] [ date ] [ temperature ]
┌─────────────────┬────────────┬─────────────┐ │ Device name │ date │ temperature│ ├─────────────────┼────────────┼─────────────┤ │ Sensor A │ Jan 1 │ 21.0 (avg) │ ← per interval │ Sensor A │ Jan 2 │ 22.8 (avg) │ │ Sensor B │ Jan 1 │ 18.5 (avg) │ └─────────────────┴────────────┴─────────────┘- No Date field — Trendz applies the aggregation function across the entire selected time range and produces one row per entity.
- Date field present — Trendz splits the time range into intervals matching the date grouping and applies aggregation to each interval separately.
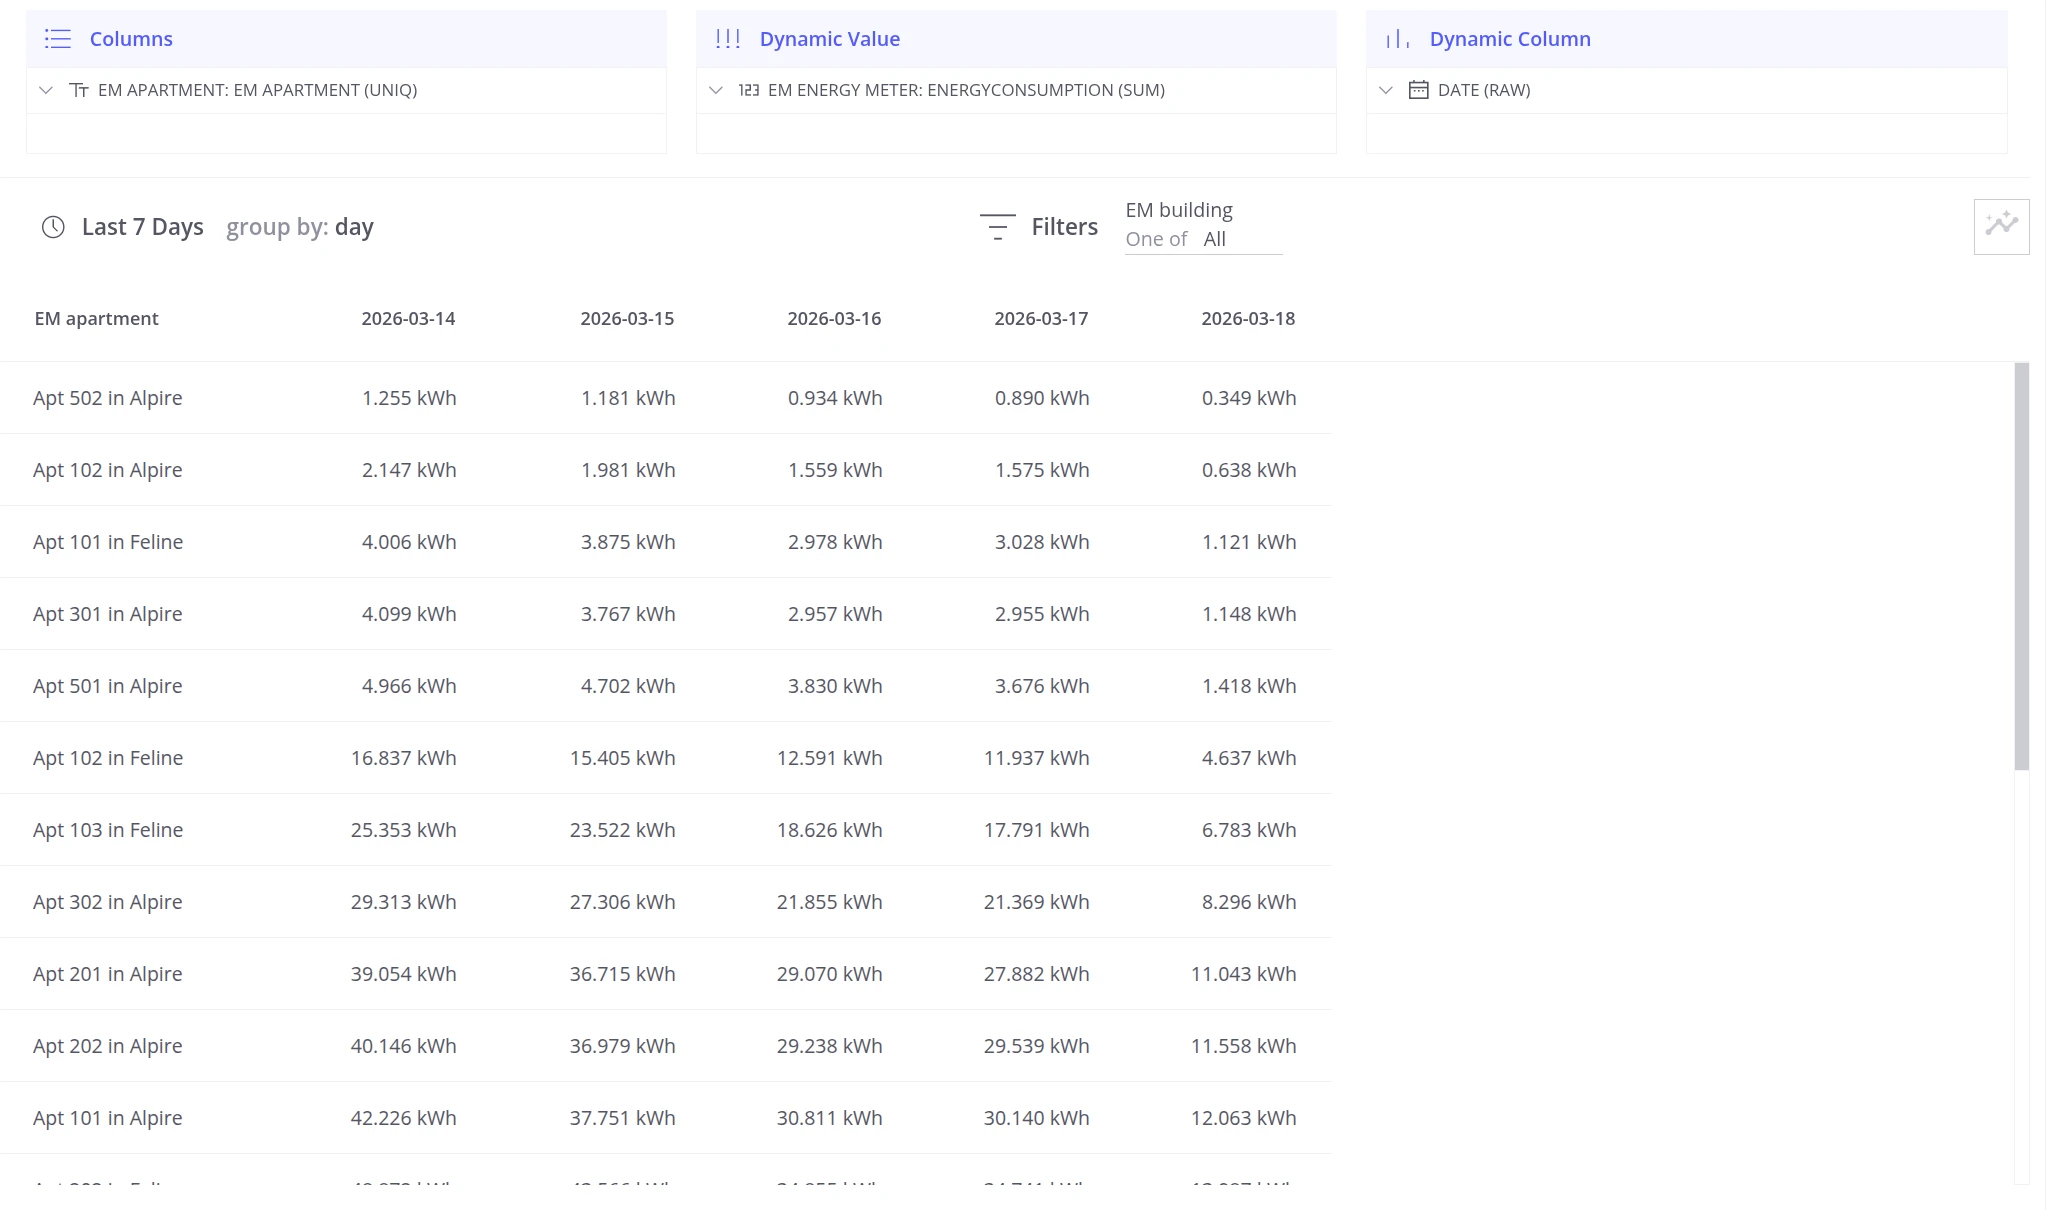
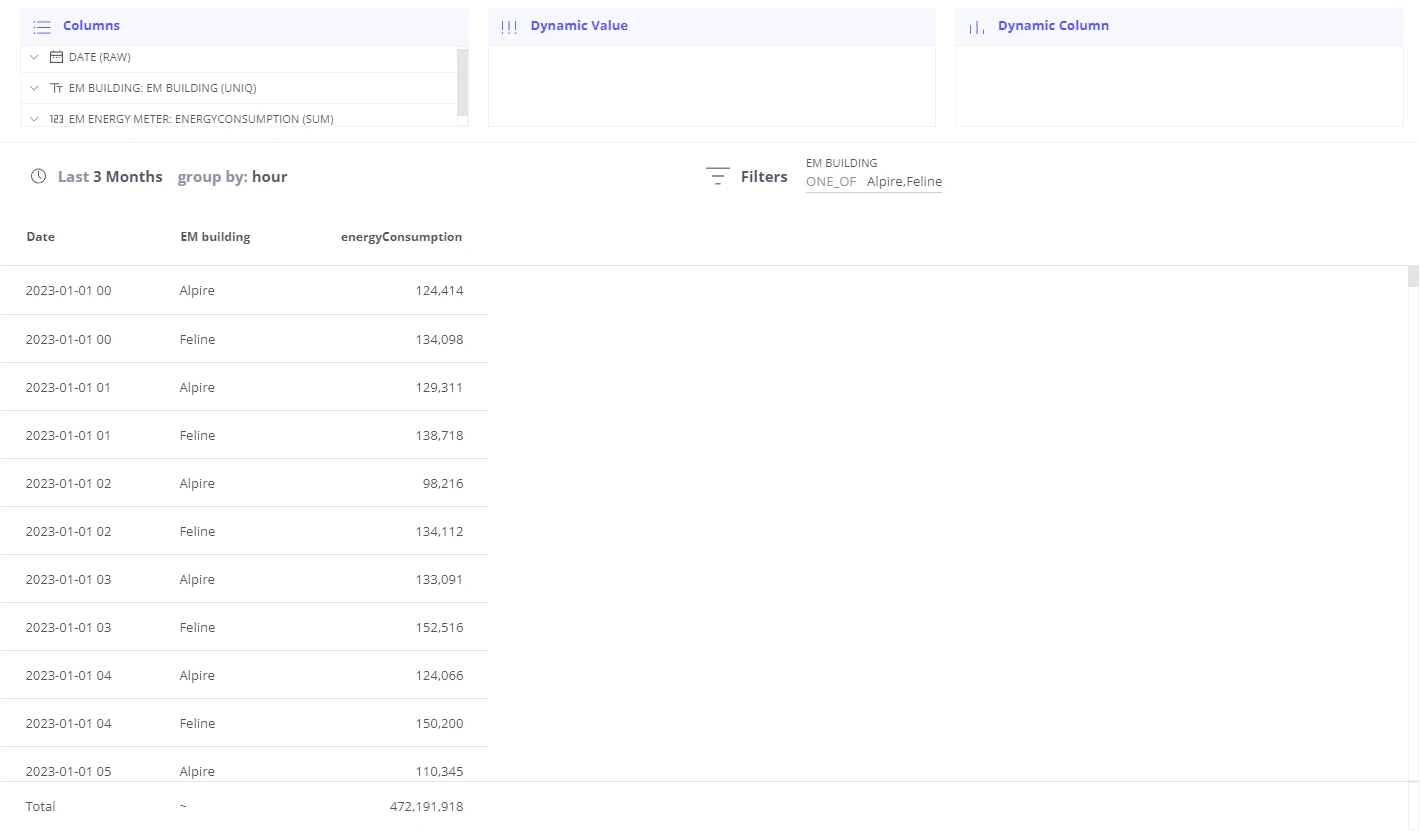
Table with dynamic columns
Section titled “Table with dynamic columns”This mode turns telemetry values into column headers instead of separate rows. Add the telemetry field to Dynamic Value and a Date (or attribute) field to Dynamic Column.
  Dynamic Value: energy_consumption  Dynamic Column: date (monthly)
  ┌──────────────┬──────────┬──────────┬──────────┐  │  Building    │  Jan     │  Feb     │  Mar     │  ├──────────────┼──────────┼──────────┼──────────┤  │  Building A  │  4 200   │  3 800   │  4 500   │  │  Building B  │  6 100   │  5 900   │  6 300   │  └──────────────┴──────────┴──────────┴──────────┘        ↑ Columns section    ↑─────────────────────                              Dynamic Column values                              become column headers
You can use any attribute or date field in Dynamic Column, not just dates. For example, putting a building name in Dynamic Column creates one column per building.
If no data exists for a given time bucket, the corresponding column still appears in the table but shows -.
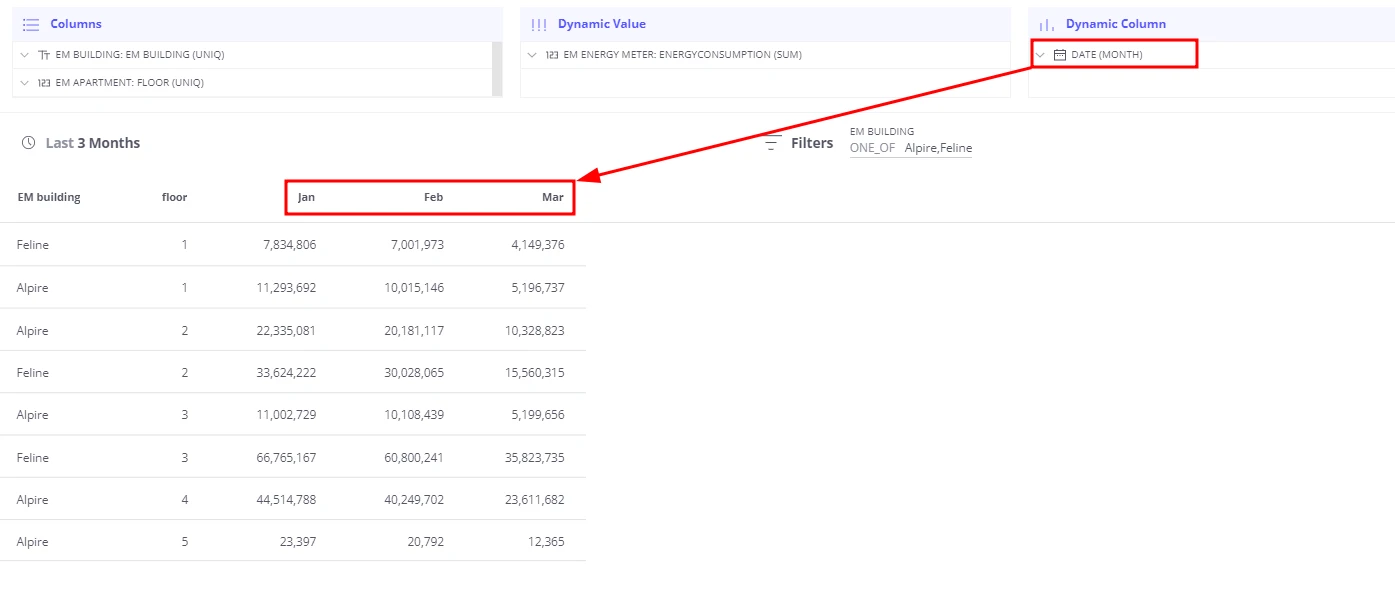
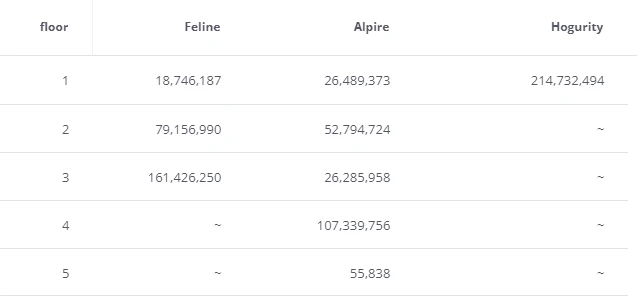
Table with individual time range per column
Section titled “Table with individual time range per column”Use this to compare different time periods for the same entity side by side — for example, today vs. yesterday vs. the last month.
Add the same telemetry field to Dynamic Value multiple times, enable Local date for each instance, and select a different date range per instance. Leave Dynamic Column empty.
  Dynamic Value (3 instances of energy_consumption):    • energy_consumption  local date = Today    • energy_consumption  local date = Yesterday    • energy_consumption  local date = Last month
  Dynamic Column: (empty)
  ┌──────────────┬──────────┬───────────┬────────────┐  │  Building    │  Today   │ Yesterday │ Last month │  ├──────────────┼──────────┼───────────┼────────────┤  │  Building A  │  140 kWh │  132 kWh  │  4 200 kWh │  └──────────────┴──────────┴───────────┴────────────┘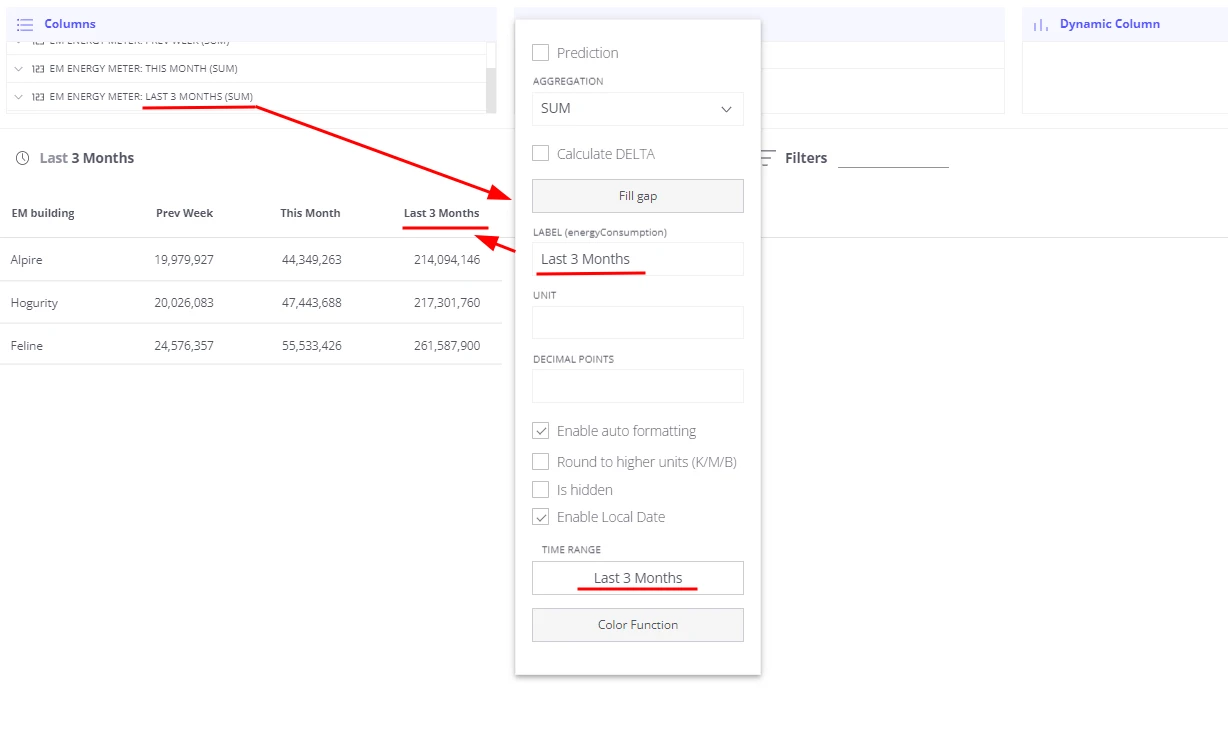
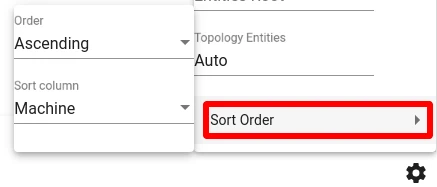
Default sorting
Section titled “Default sorting”You can pre-configure the sort order for any column so the table opens already sorted.
-
Open Settings for the view.
-
Find the column you want to sort.
-
Set the sort order to Ascending or Descending.
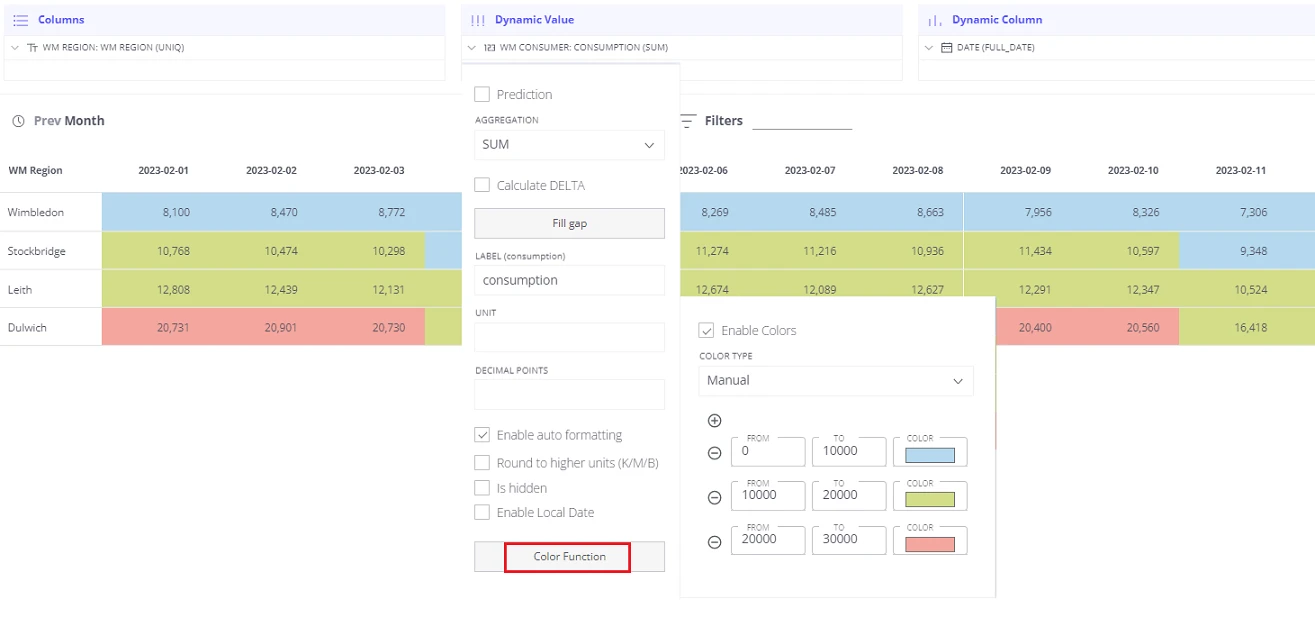
Cell colors
Section titled “Cell colors”Apply color rules to cells based on their values to make important data stand out at a glance.
-
Open the settings card for the field you want to color.
-
Enable Color function.
-
Choose a color type:
- Auto — Trendz divides the data range into four grades and assigns colors automatically.
- Manual — You define specific color ranges and assign a color to each range. You can create as many ranges as needed.
On row click action
Section titled “On row click action”You can configure a dashboard action that fires when a user clicks any row in the table. Common uses: saving the clicked entity to a dashboard state alias or navigating to a different dashboard state.
-
Add the Trendz Table view to a ThingsBoard dashboard widget.
-
Open the widget in edit mode and go to the Actions tab.
-
Click Add action.
-
In the Action source field, select On row click.
-
Complete the standard widget action configuration.
Because each row can contain data from multiple devices or assets, you must tell Trendz which entity to select when a row is clicked:
-
Open View Settings in the Trendz view editor.
-
Expand the View Mode fields section.
-
Select the desired device or asset type from the Row click entity dropdown.
-
Save the view.
Was this helpful?