- Architecture
- Prerequisites
- Telemetry Input and Output
- Calculated field configuration
- Rule chain configuration
- Testing
- Performance & Cost Controls
- Troubleshooting
- Next steps
This document describes a ThingsBoard solution that turns raw device telemetry into actionable maintenance insights:
Workflow:
- Devices send
vibration(mm/s),temperature(°C), andacousticDev(% deviation from baseline). - Calculated Fields maintain a rolling window of the last N values (default: 100) and/or last M minutes for each metric.
- The rolling window is forwarded to an AI Rule Node (OpenAI or another LLM provider).
- If the AI detects an anomaly, the rule chain creates a ThingsBoard Alarm and optionally sends a notification.
Architecture

Prerequisites
- ThingsBoard version 4.2+
- Device(s) capable of sending the required telemetry values (for this guide, we will emulate them)
- LLM provider credentials (OpenAI, Azure OpenAI, etc.)
Telemetry Input and Output
Expected telemetry keys (per device):
vibration— mm/s (float)temperature— °C (float)acousticDev— % deviation from baseline (float)
AI Output:
anomaly— short label (e.g.,"Bearing Wear")summary— concise human-readable recommendation (e.g.,"Vibration has reached 7.4 mm/s and temperature is at 86°C accompanied by irregular acoustic patterns, indicating bearing wear. Recommend immediate bearing inspection and replacement to avoid catastrophic failure.")
Calculated field configuration
Purpose: Maintain a rolling window of the last N readings (default 100, configurable) efficiently and forward them directly to the AI node.
Steps:
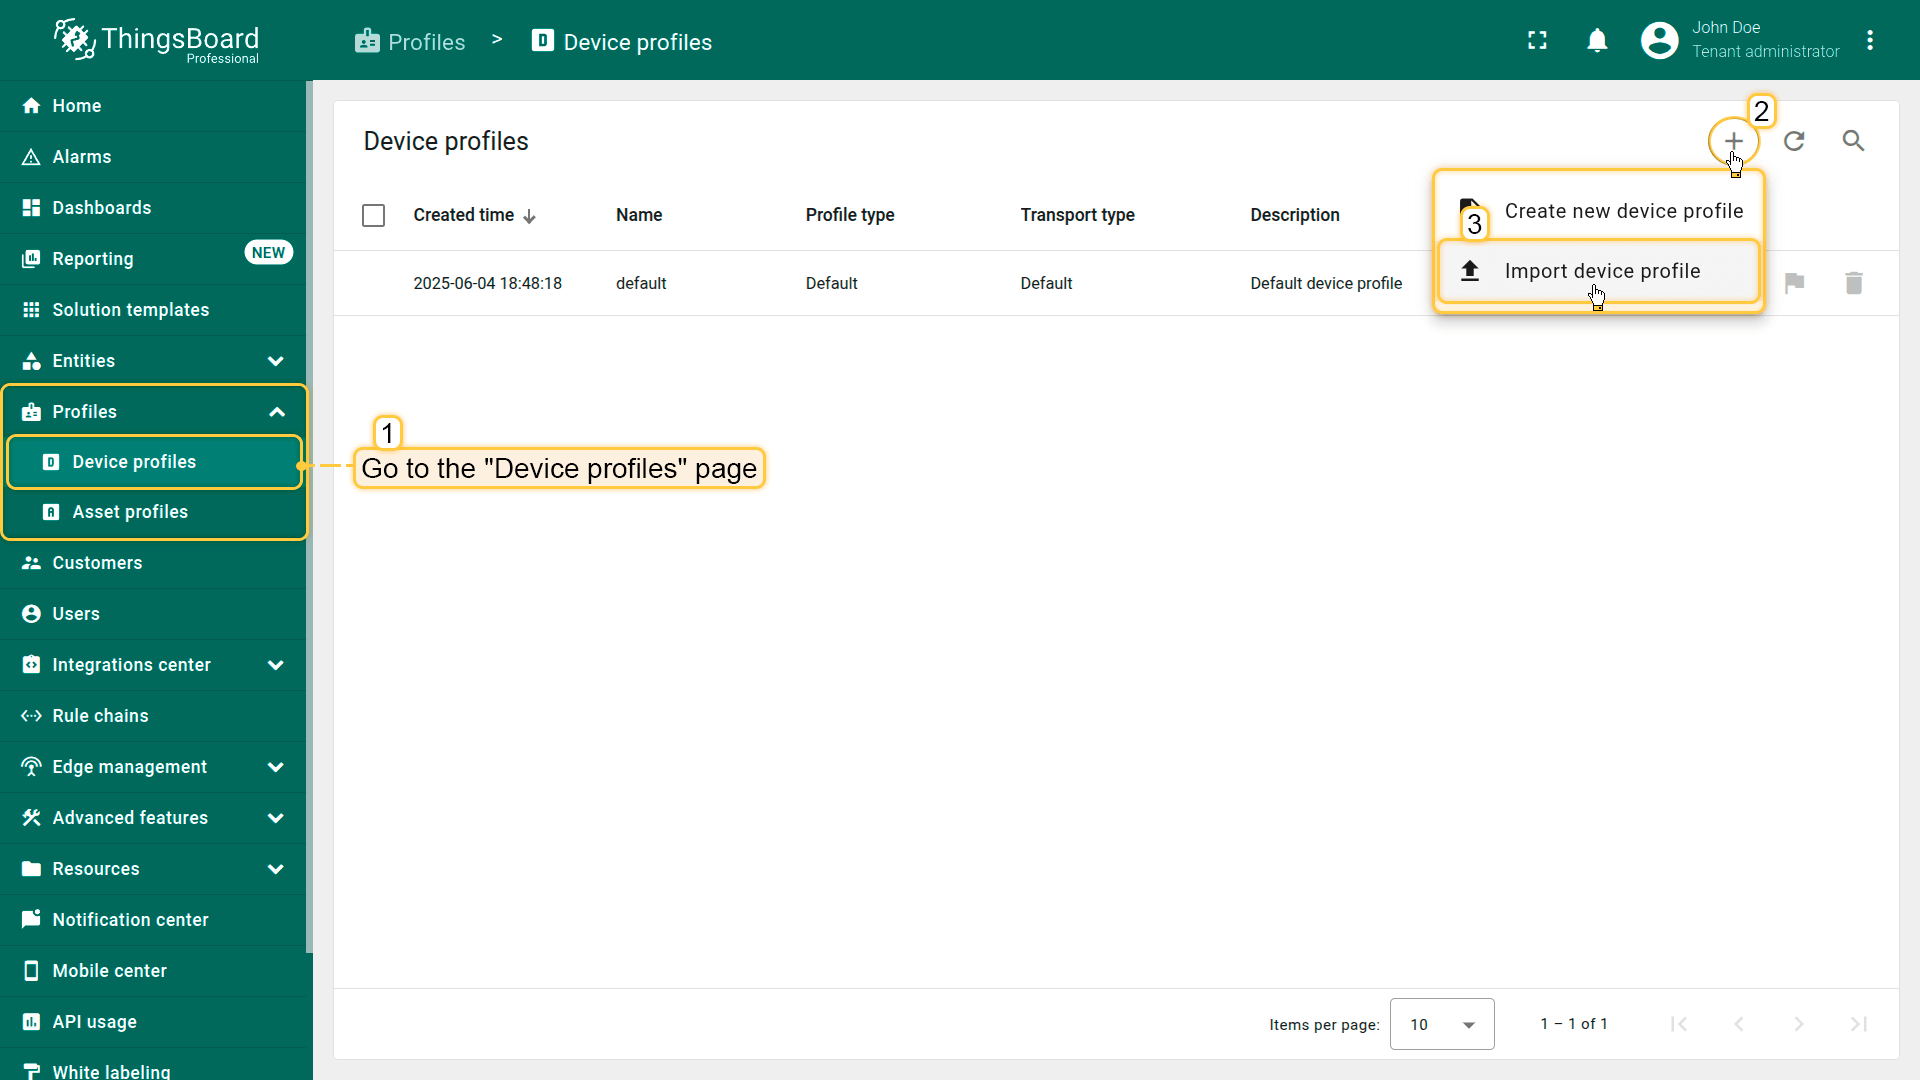
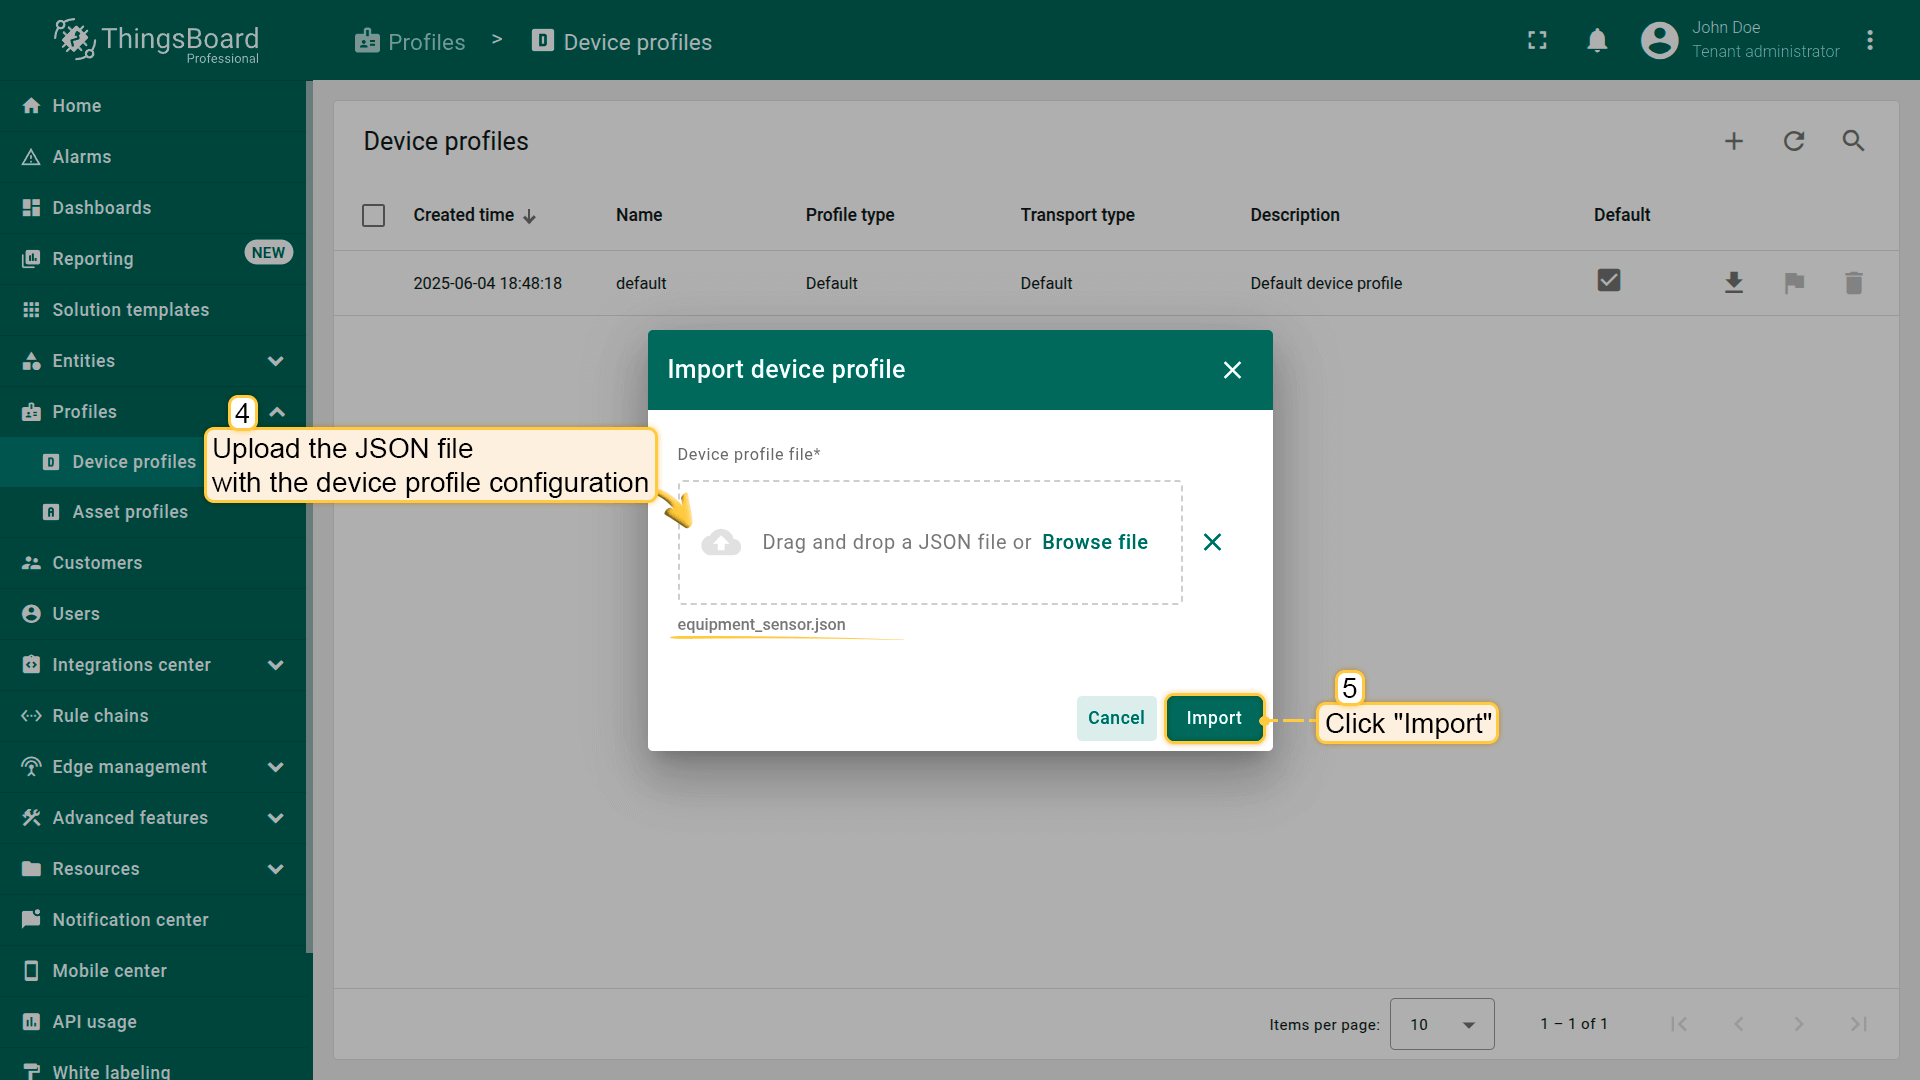
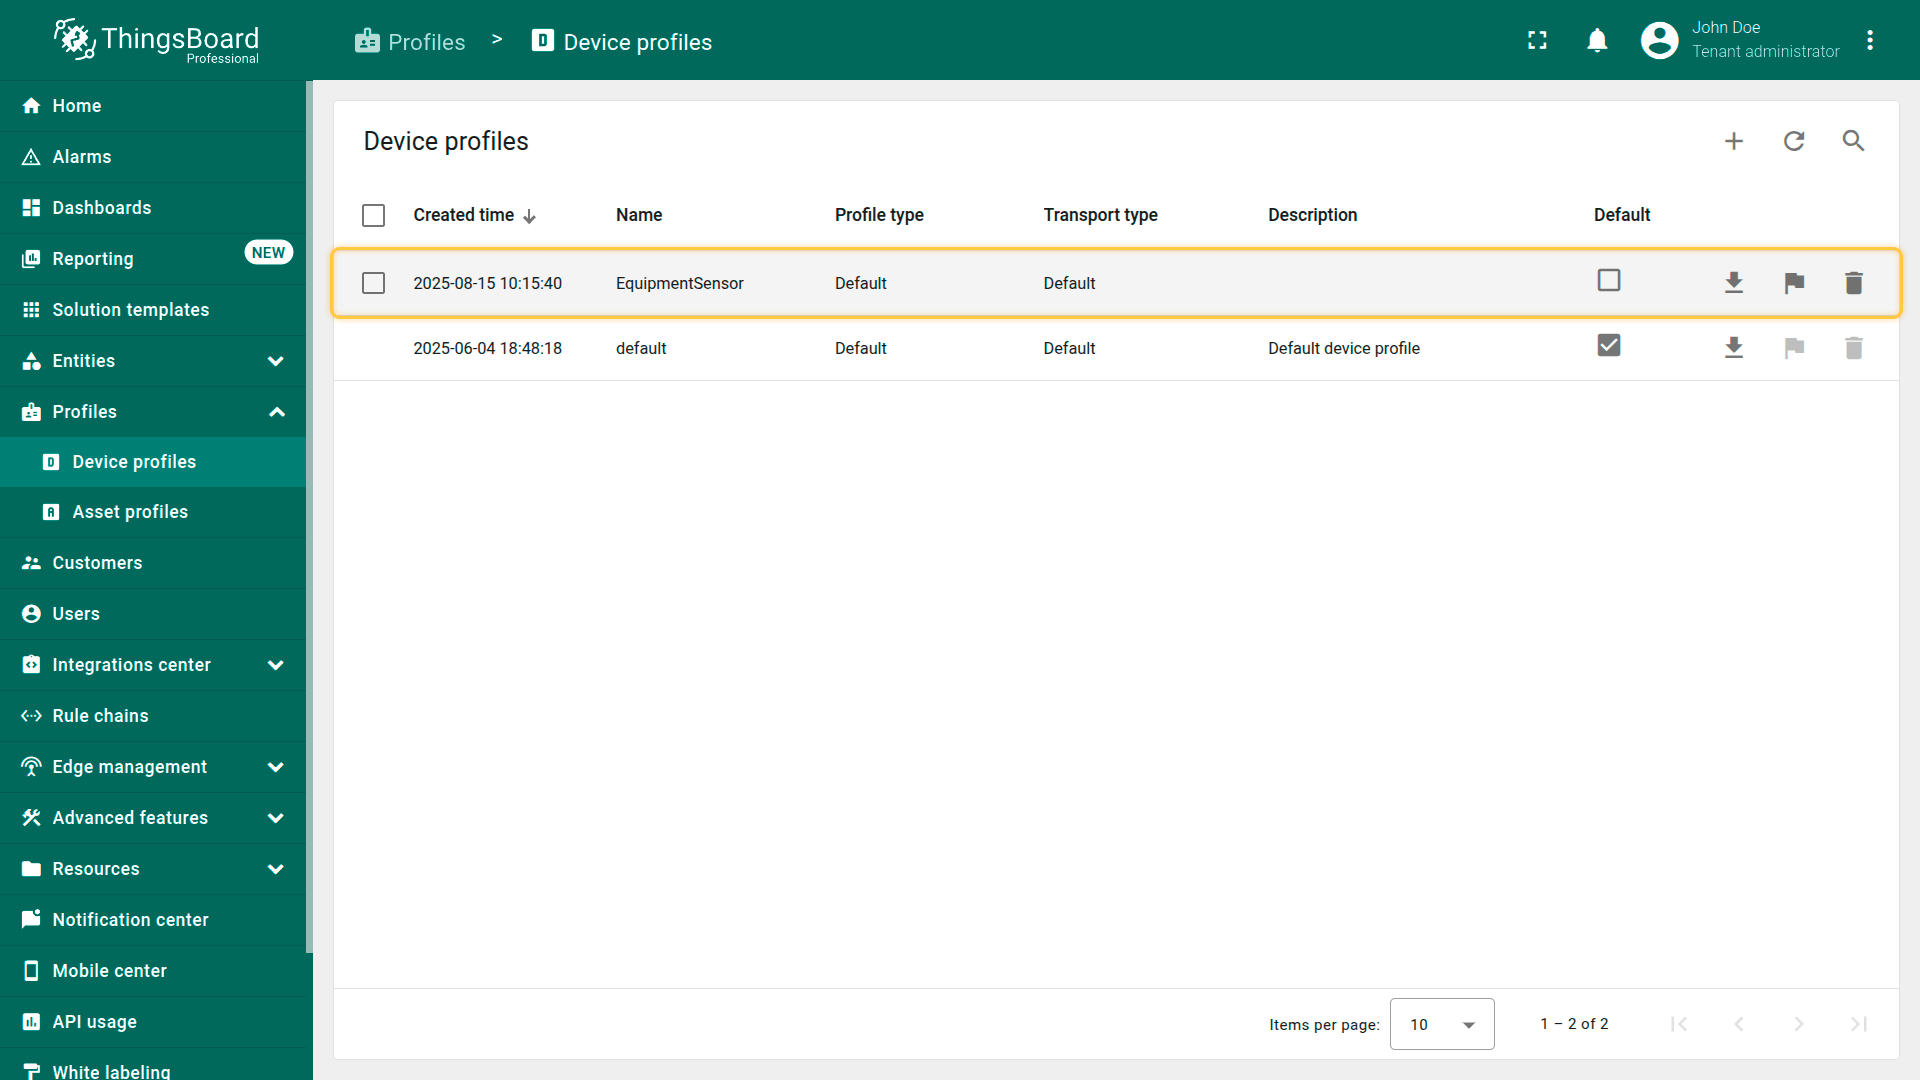
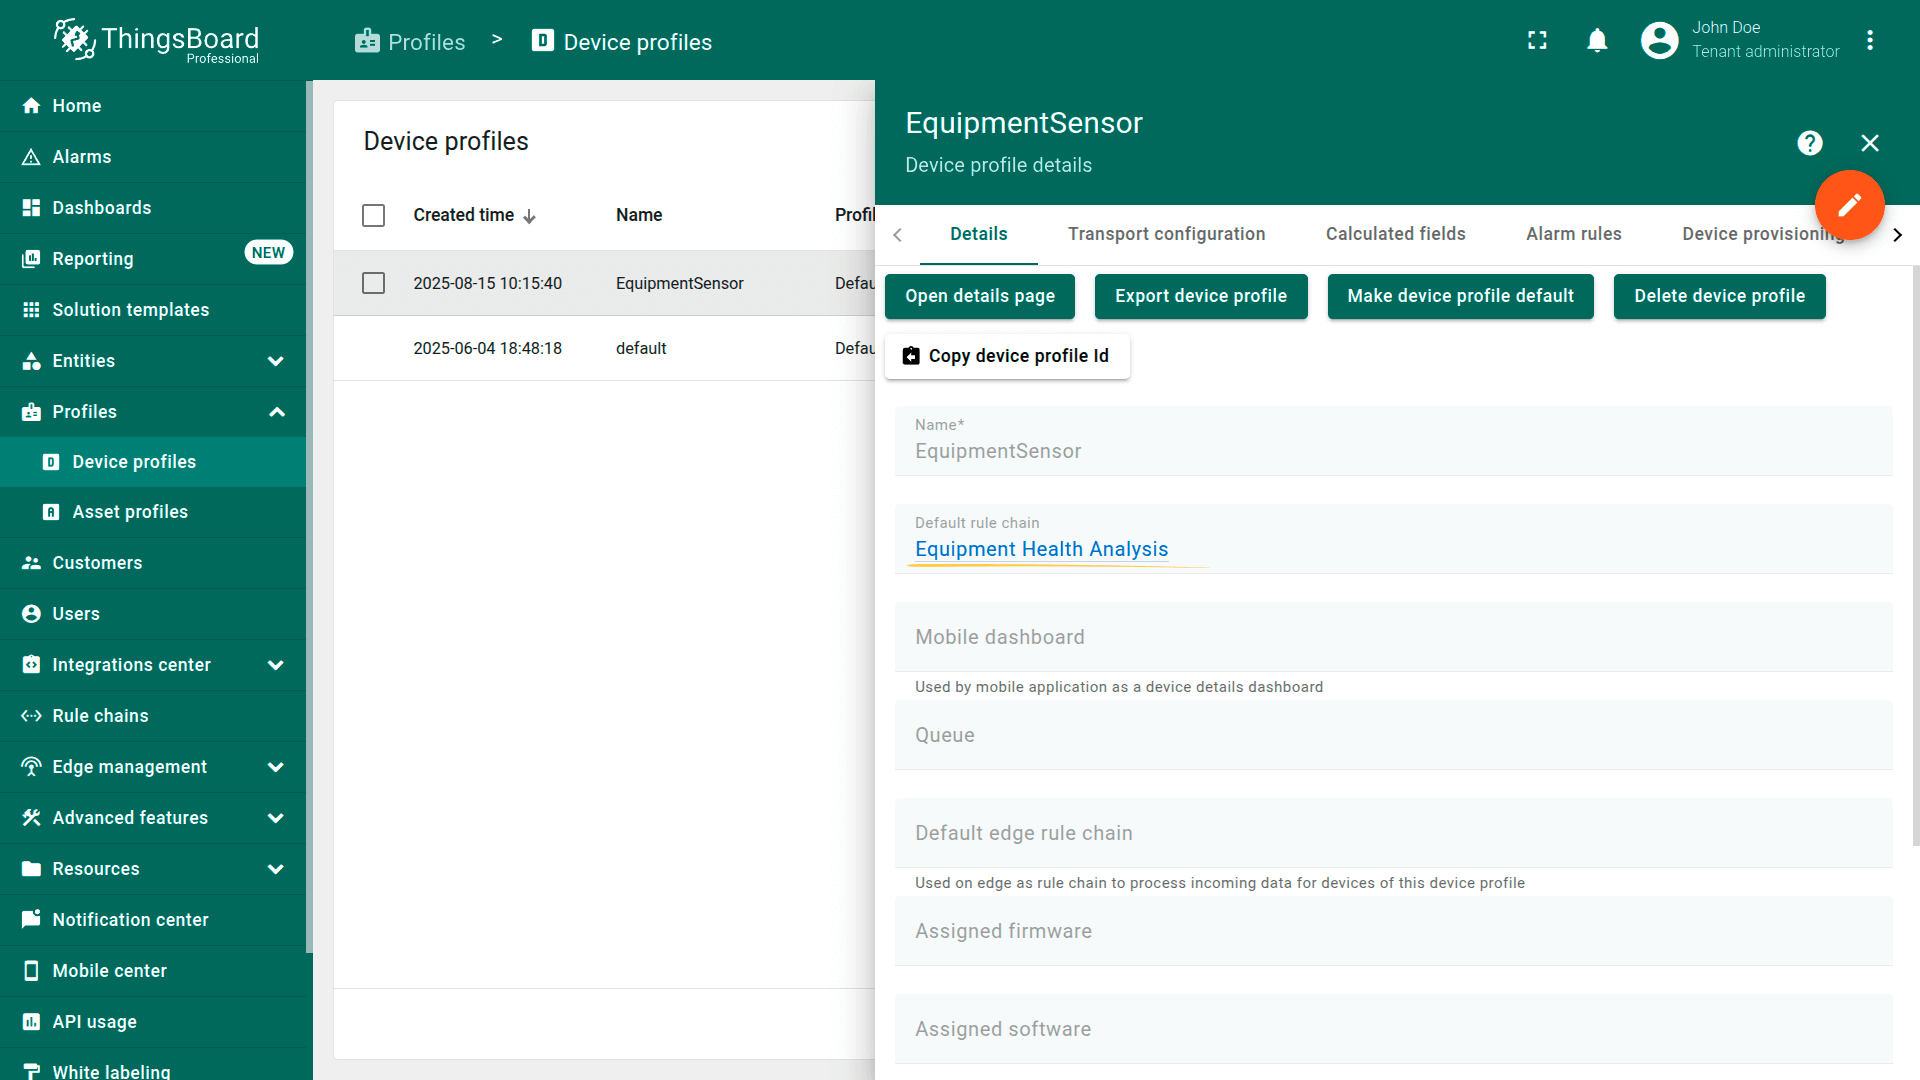
1. Download and import the EquipmentSensor device profile into your ThingsBoard instance.
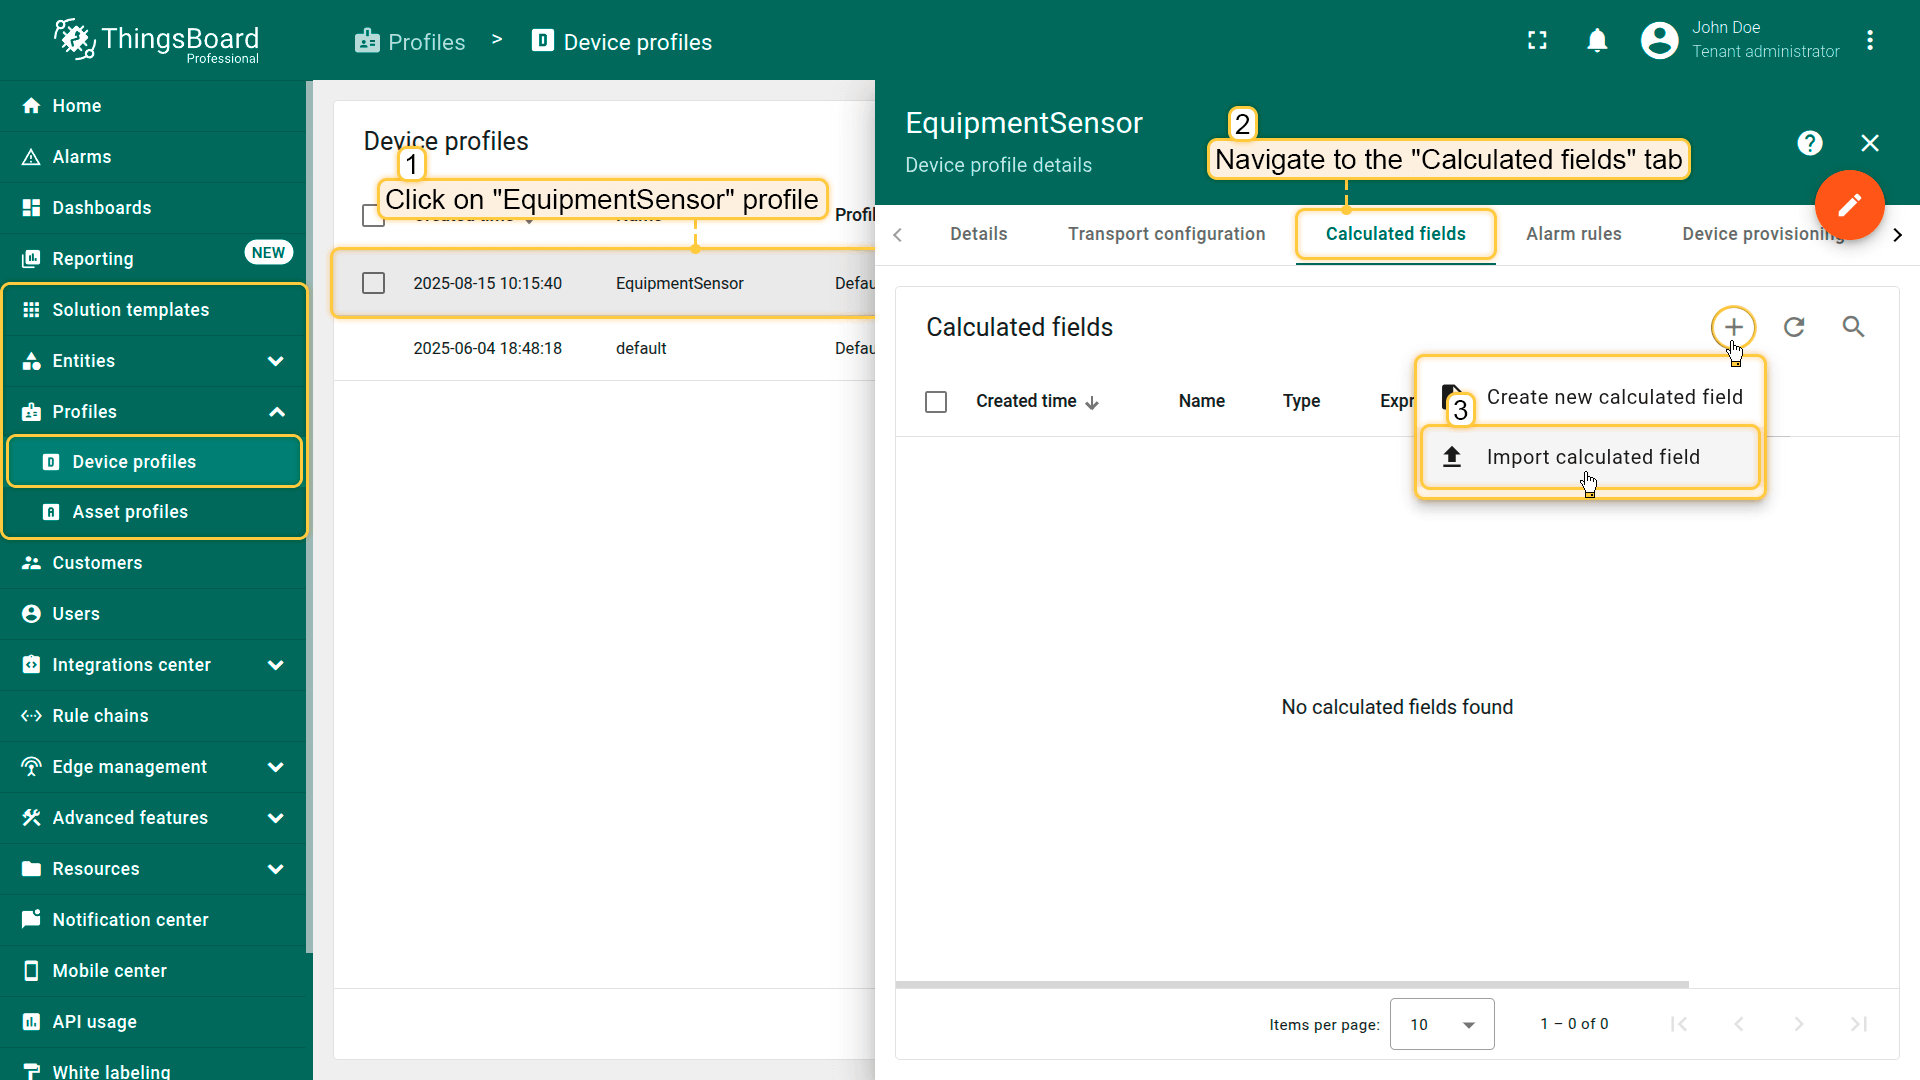
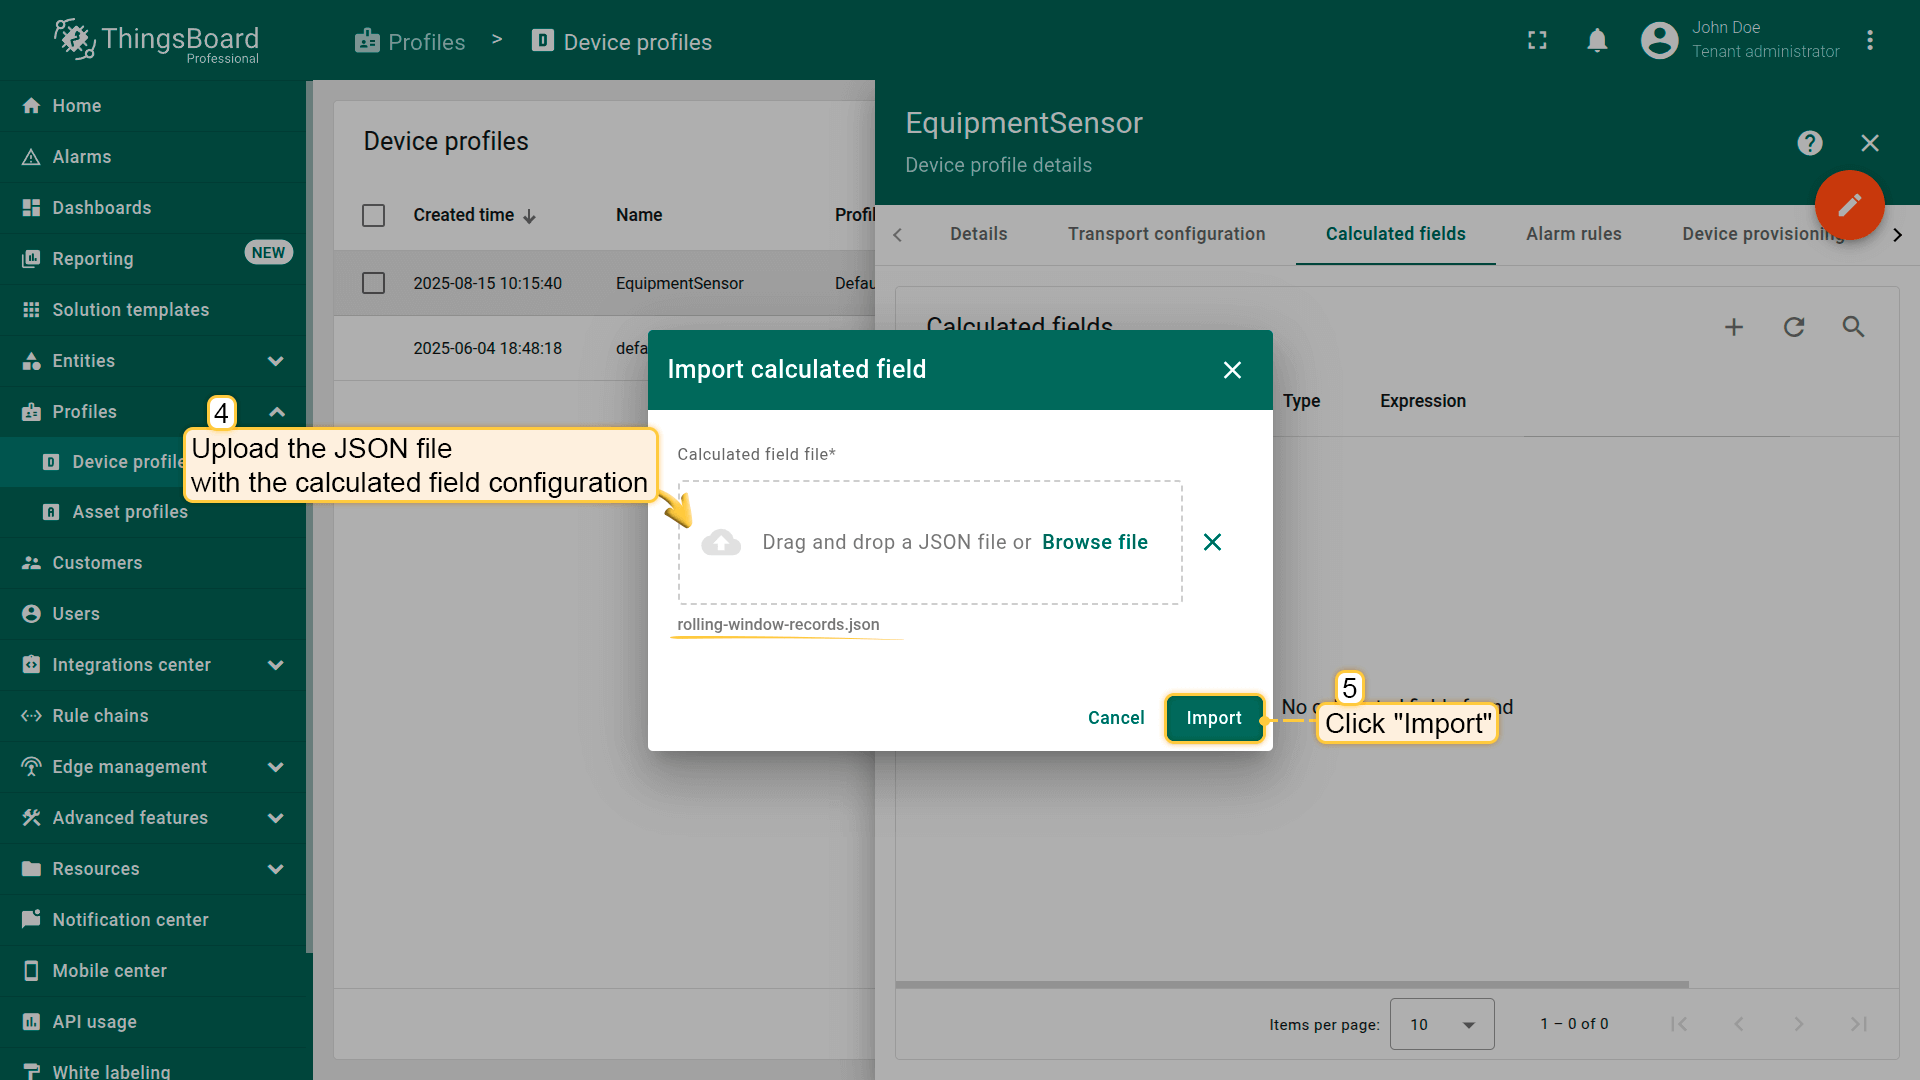
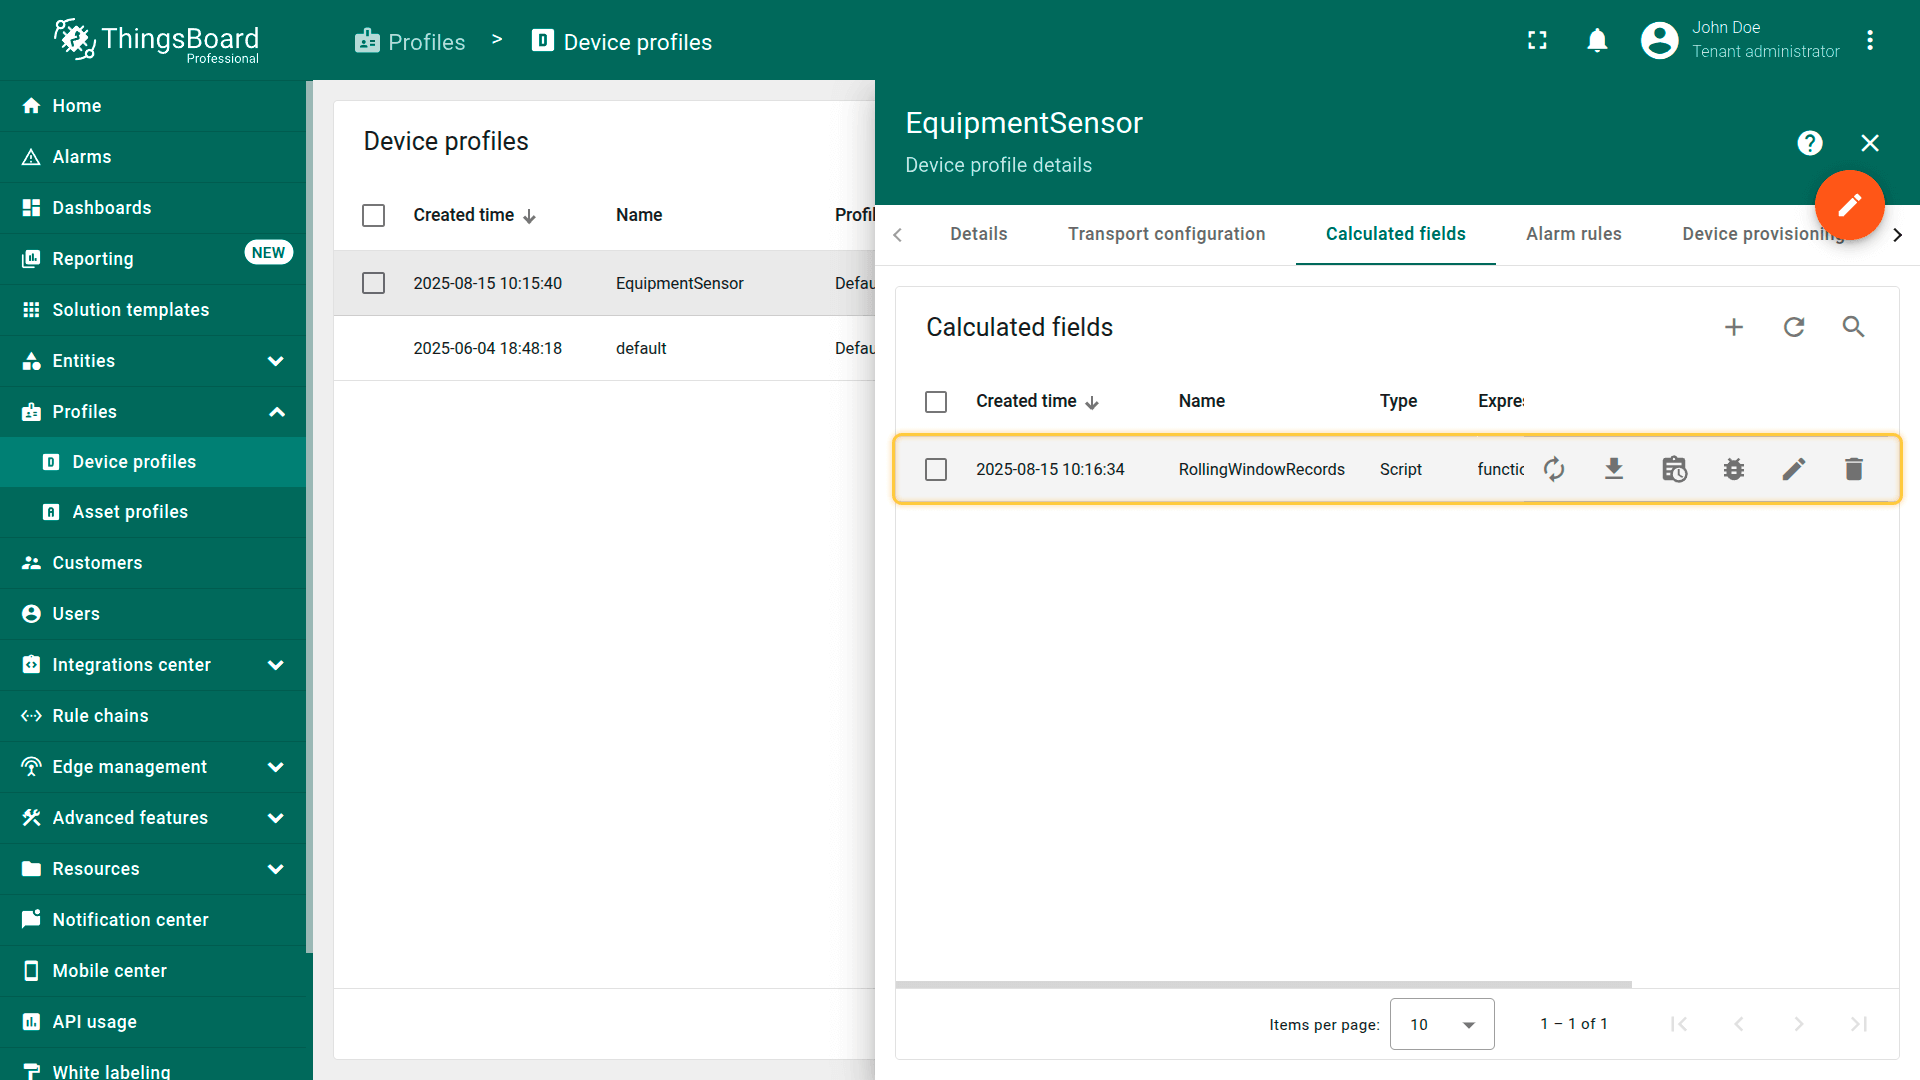
2. Download and import the calculated field into the EquipmentSensor device profile.
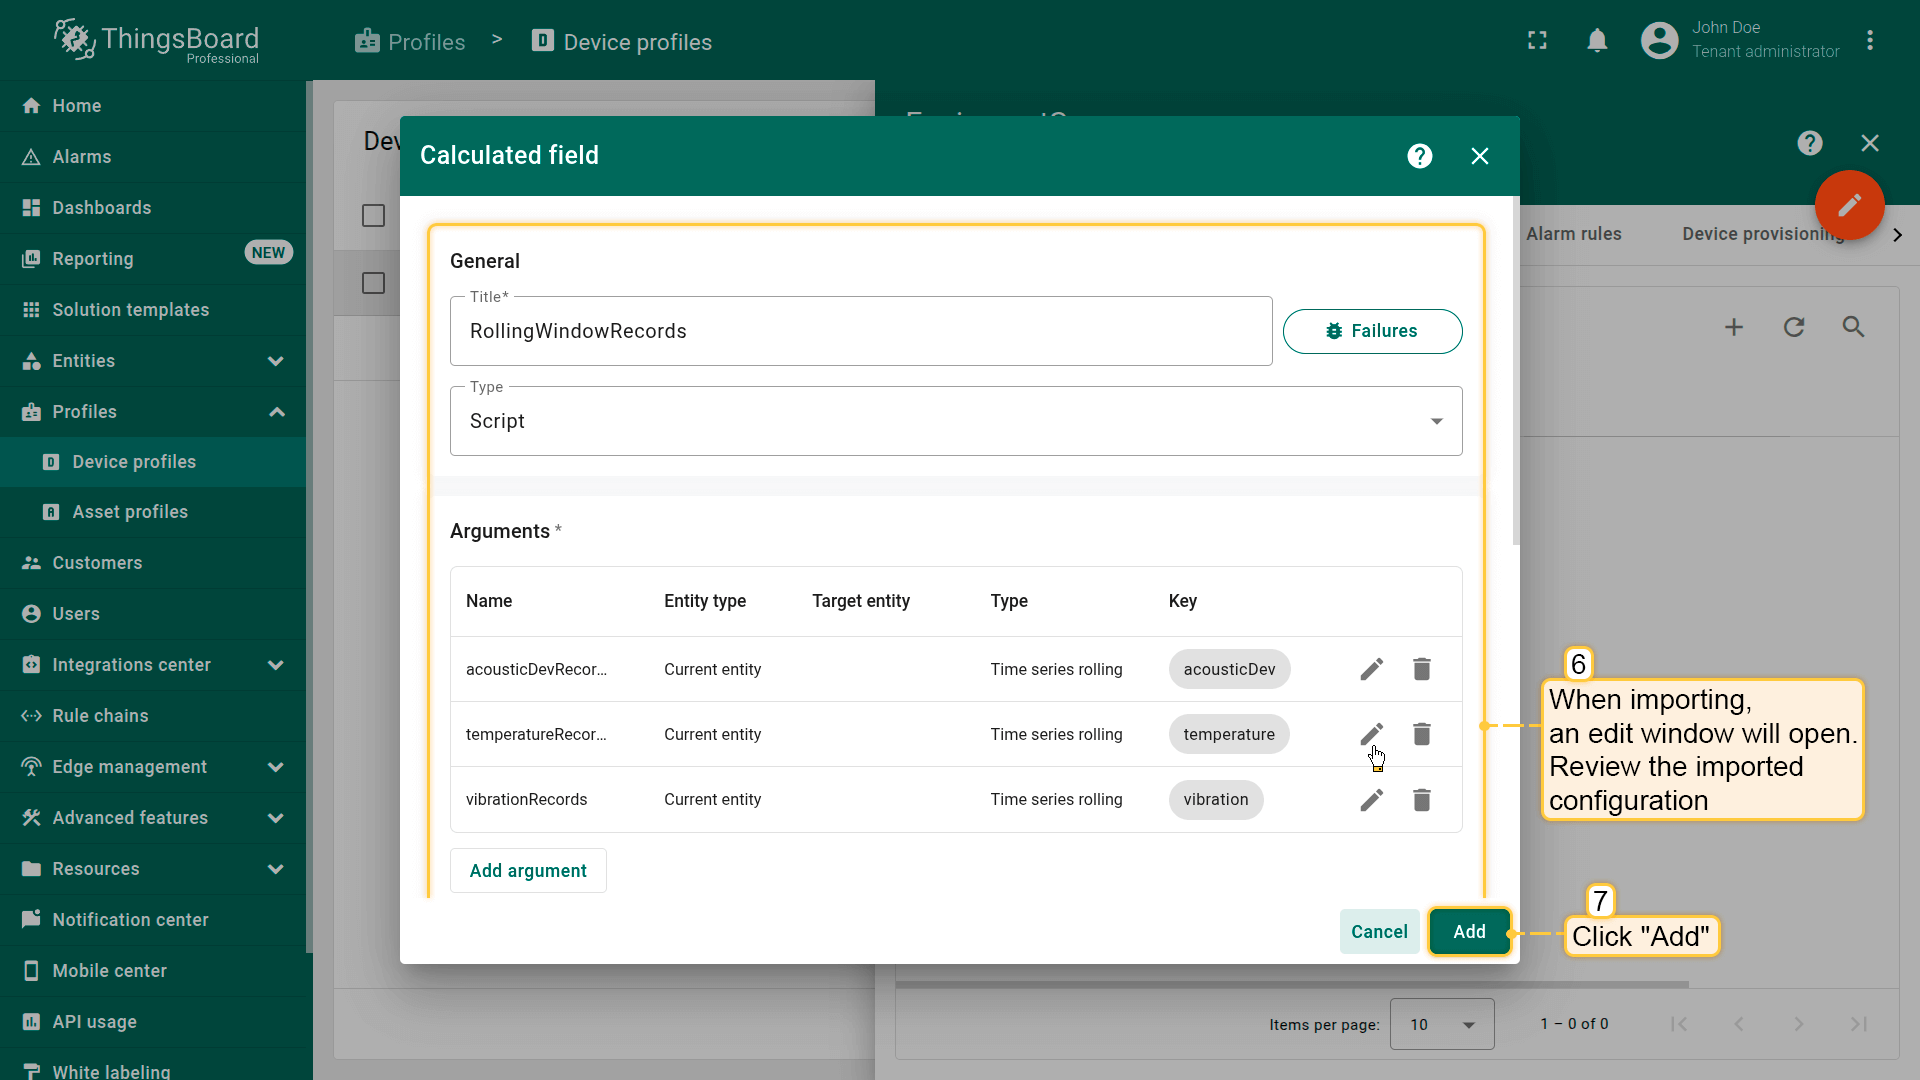
Key notes:
- Rolling window time range is set to 1 day.
- The number of stored values is set to 100. The default maximum is 1000, configurable in system settings.
- The TBEL script outputs the rolling values in a single message to the rule engine:
1
2
3
4
5
6
// Sample script to output raw values of the rolling arguments;
return {
    "acousticDevRecords": acousticDevRecords,
    "temperatureRecords": temperatureRecords,
    "vibrationRecords": vibrationRecords
};
Rule chain configuration
Purpose: Analyze the rolling window data, classify anomalies, and generate a plain-language summary. Works with OpenAI or other LLM providers.
Steps:
- Download the json file with the “Equipment Health Analysis” rule chain configuration.
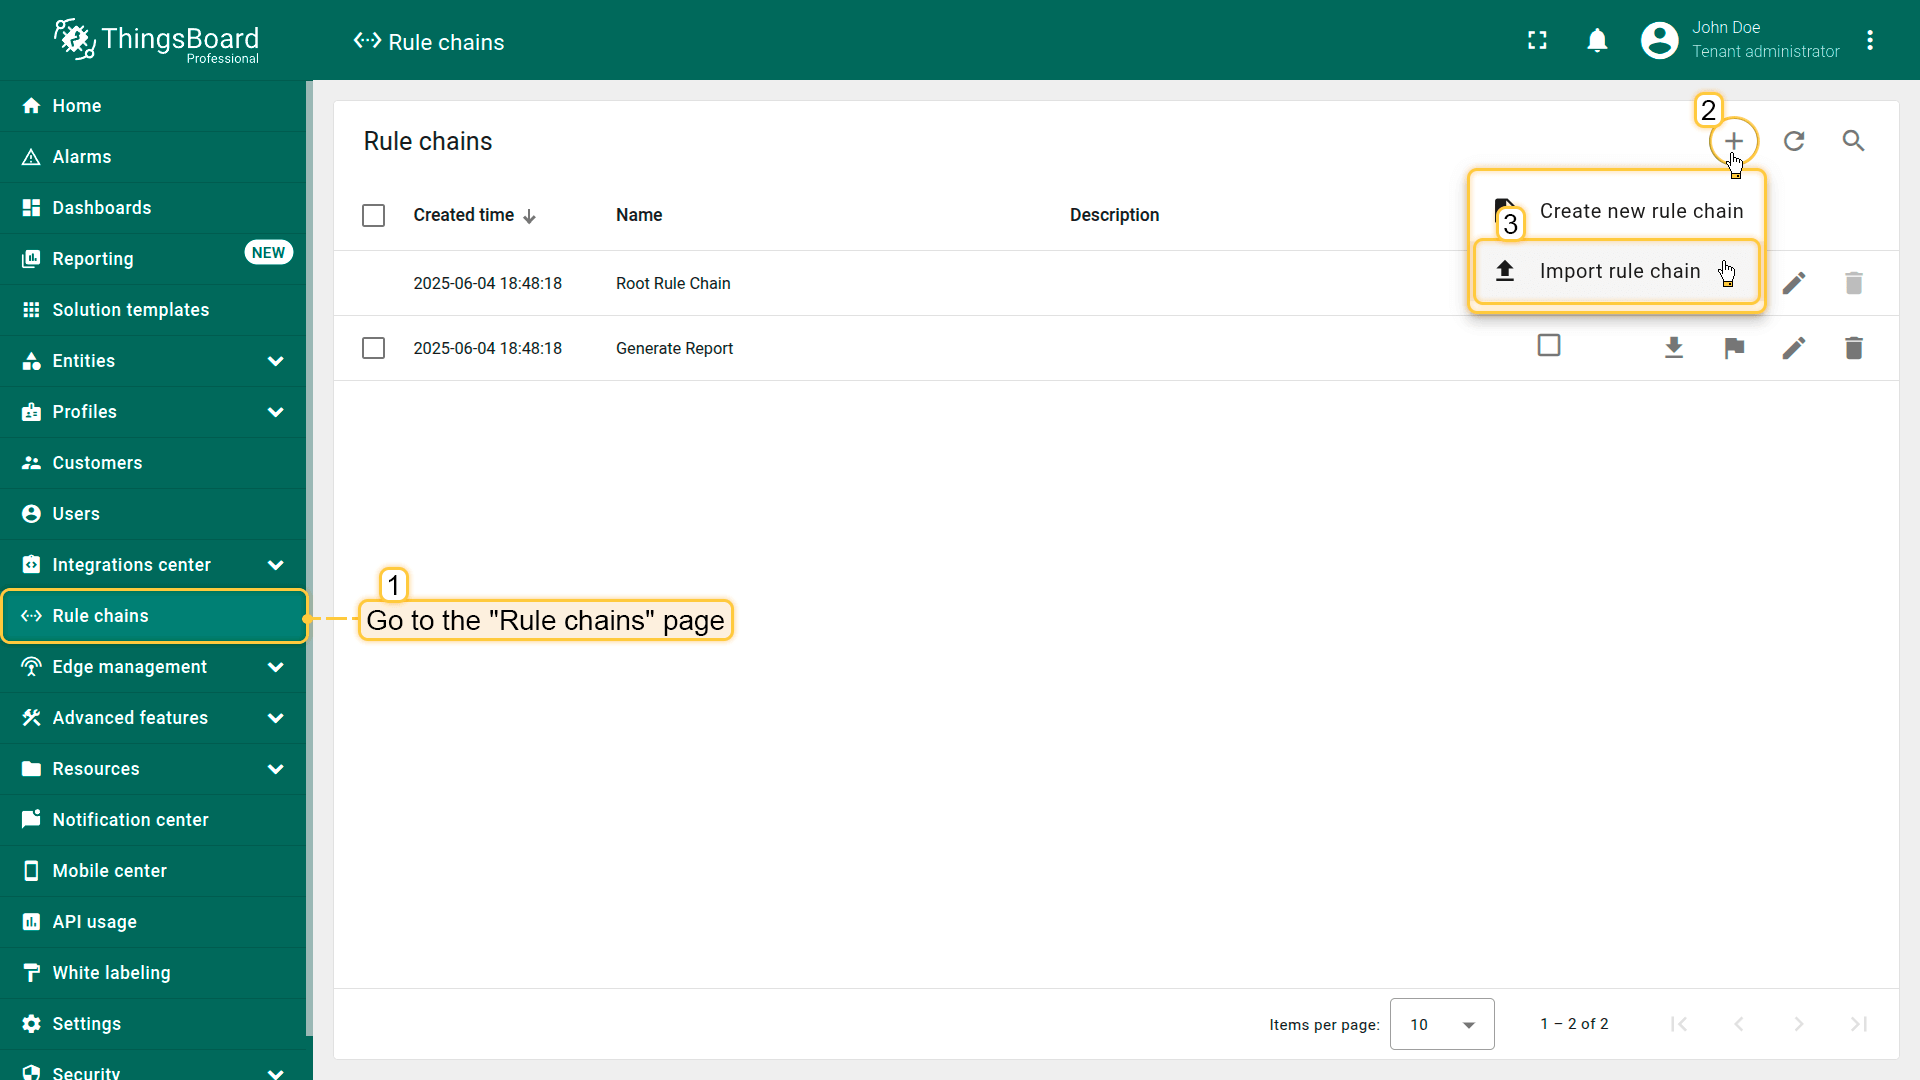
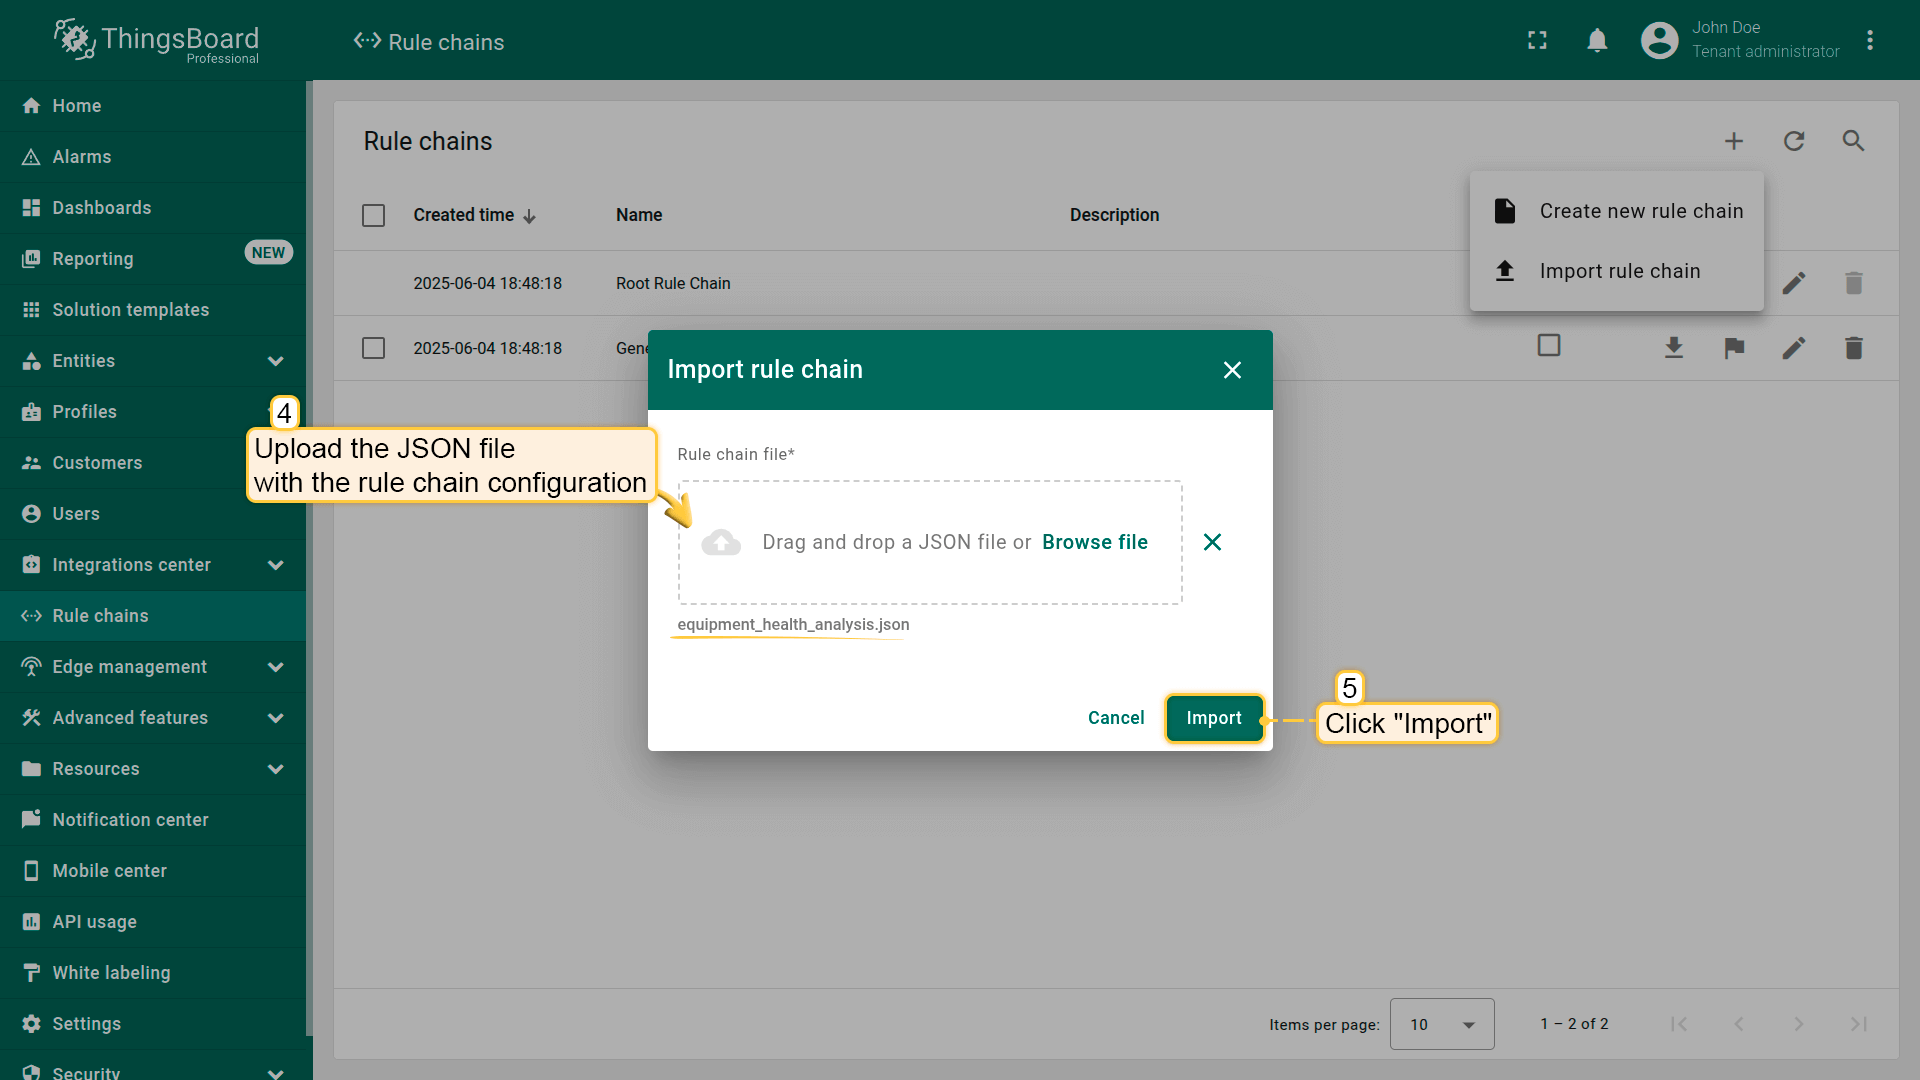
- Navigate to the "Rule chains" page. Click the "plus" icon button, and select "Import rule chain" from the dropdown menu.
- In the opened window, upload the JSON file with the rule chain configuration and click "Import".
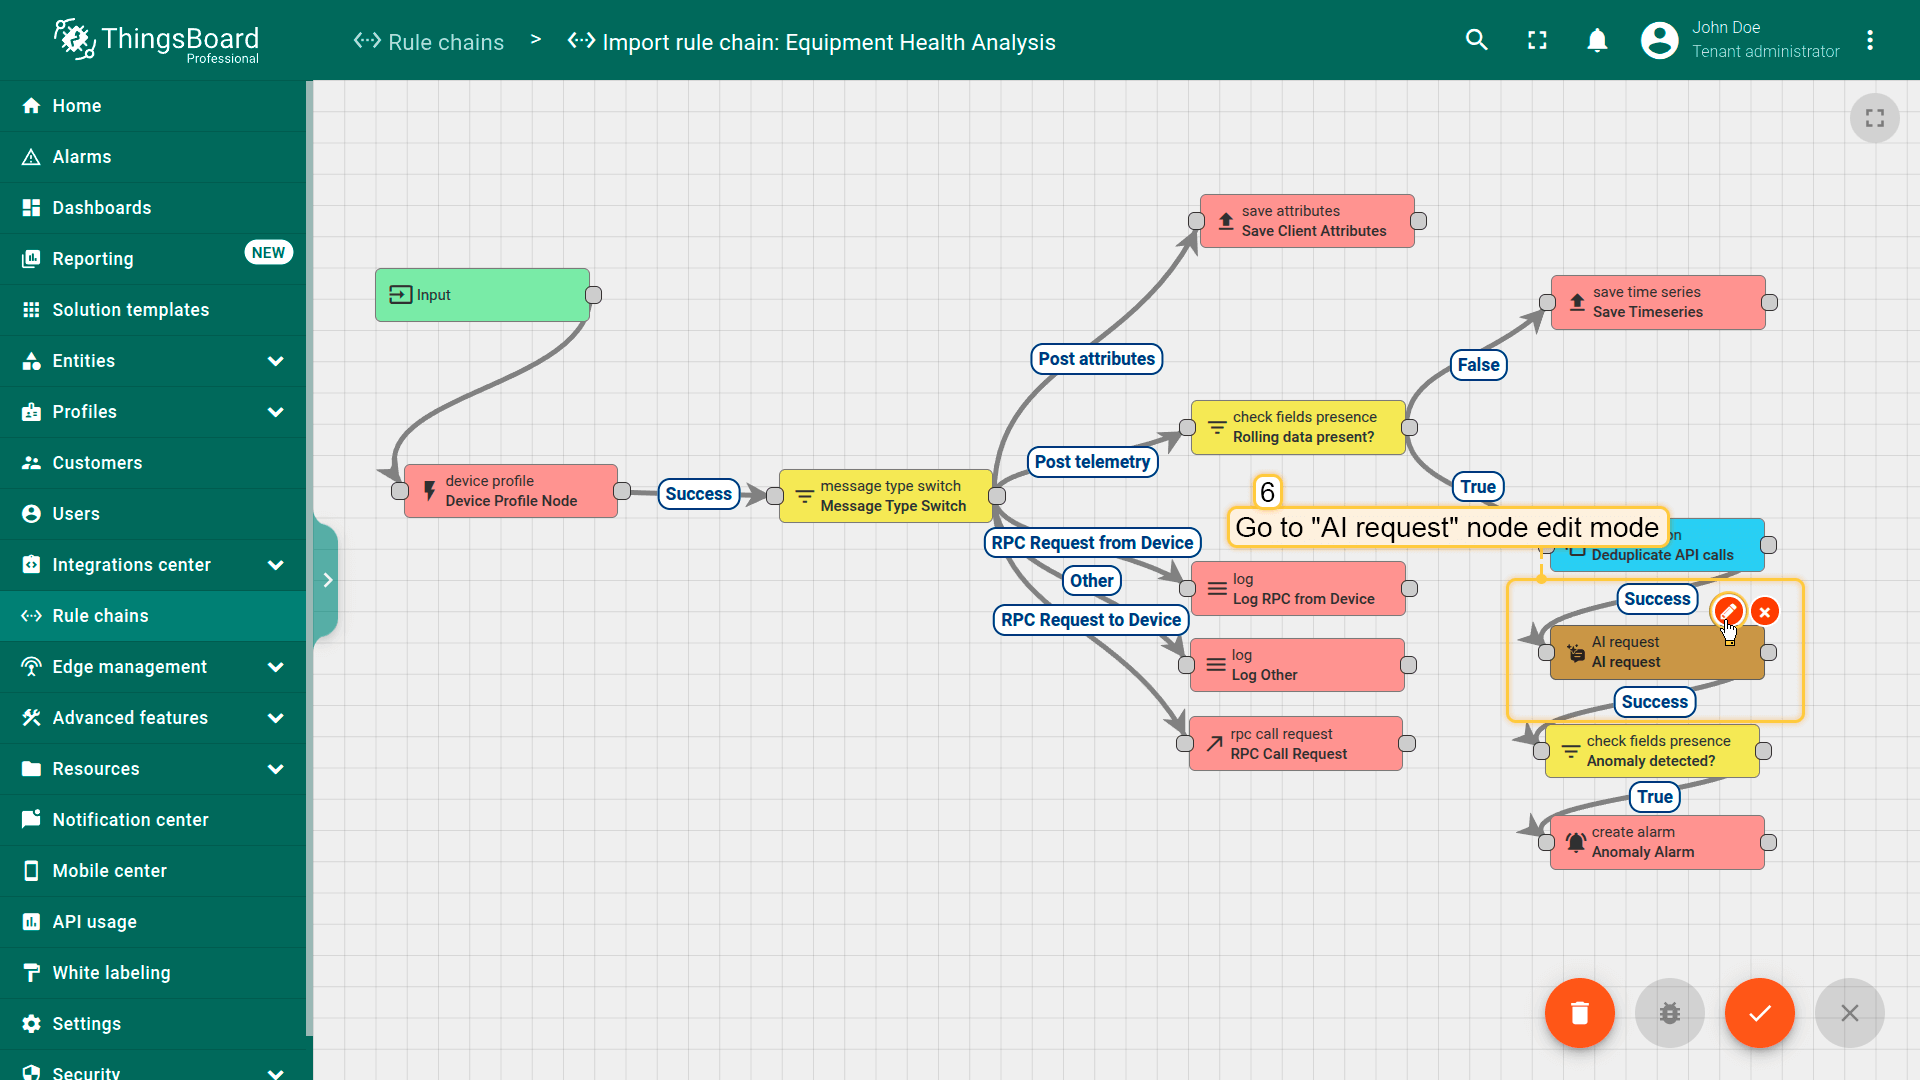
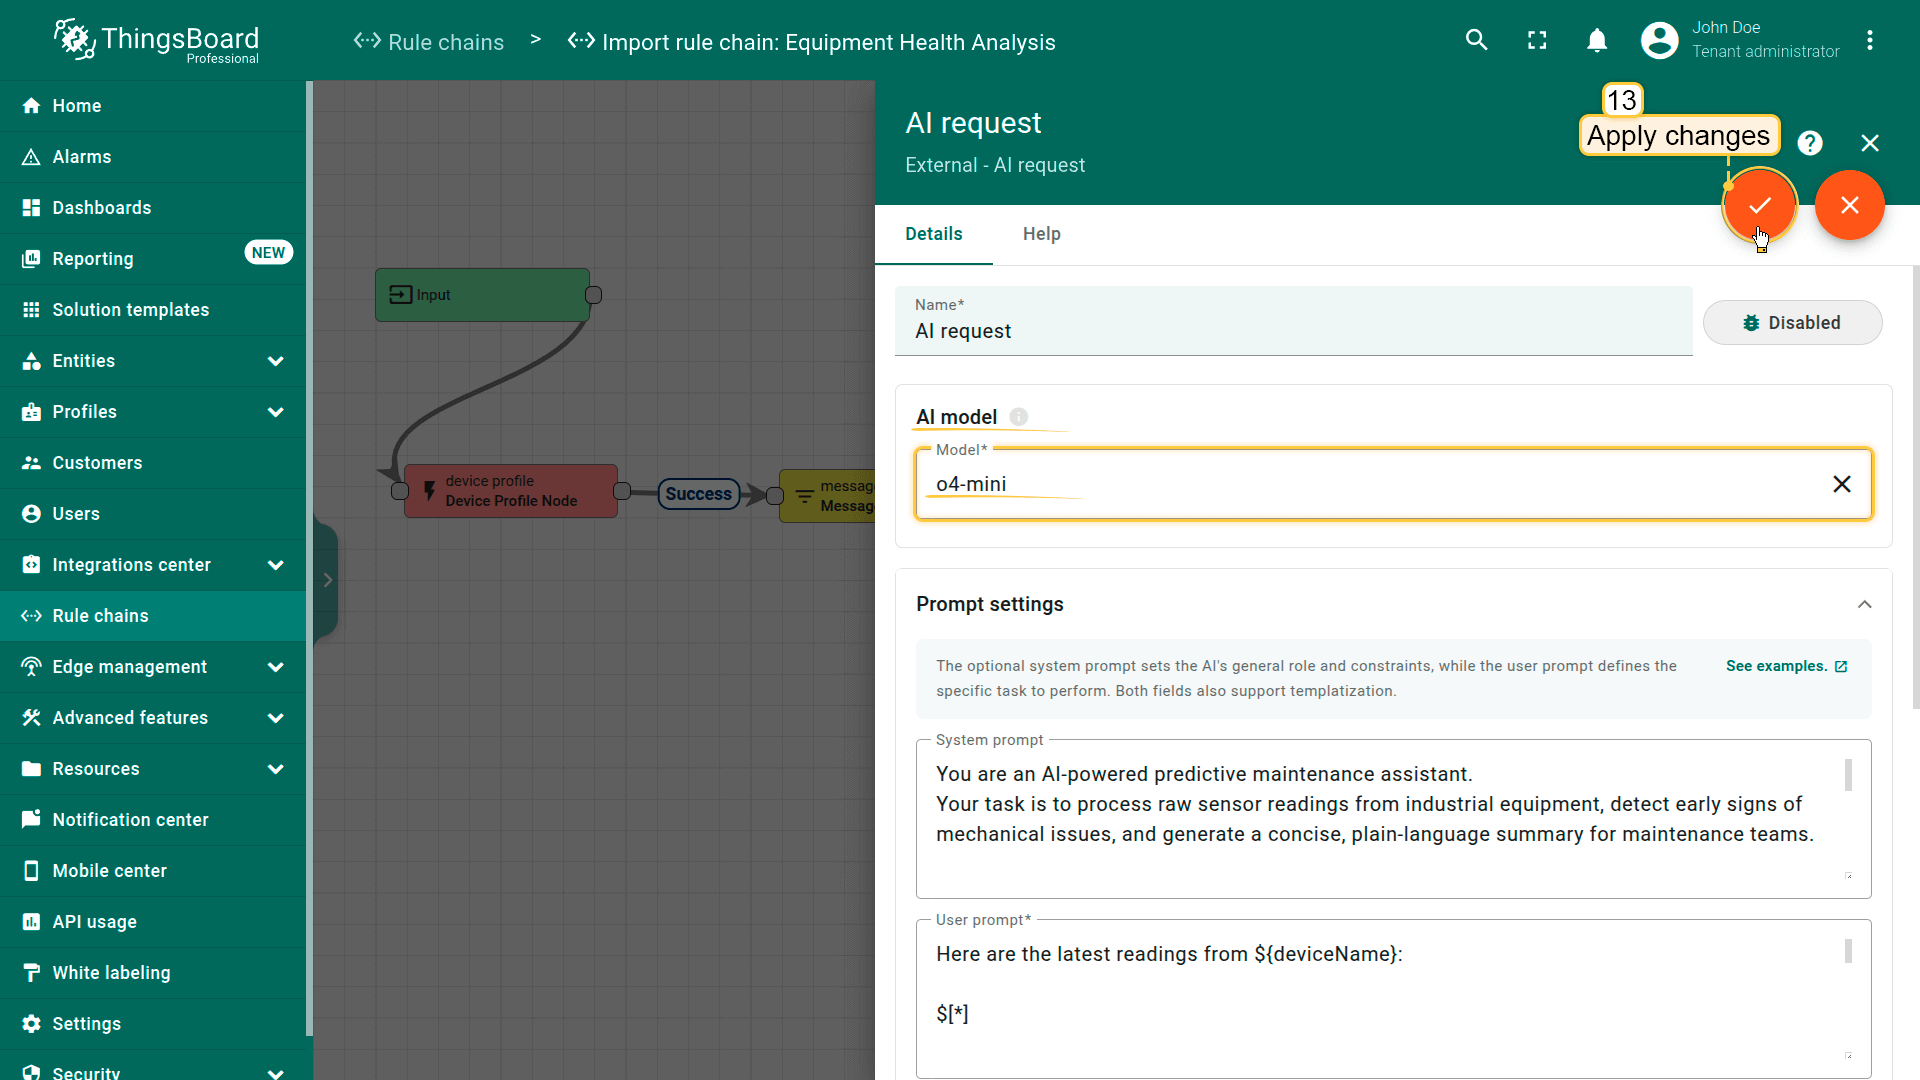
- Locate "AI request" node and enter its edit mode.
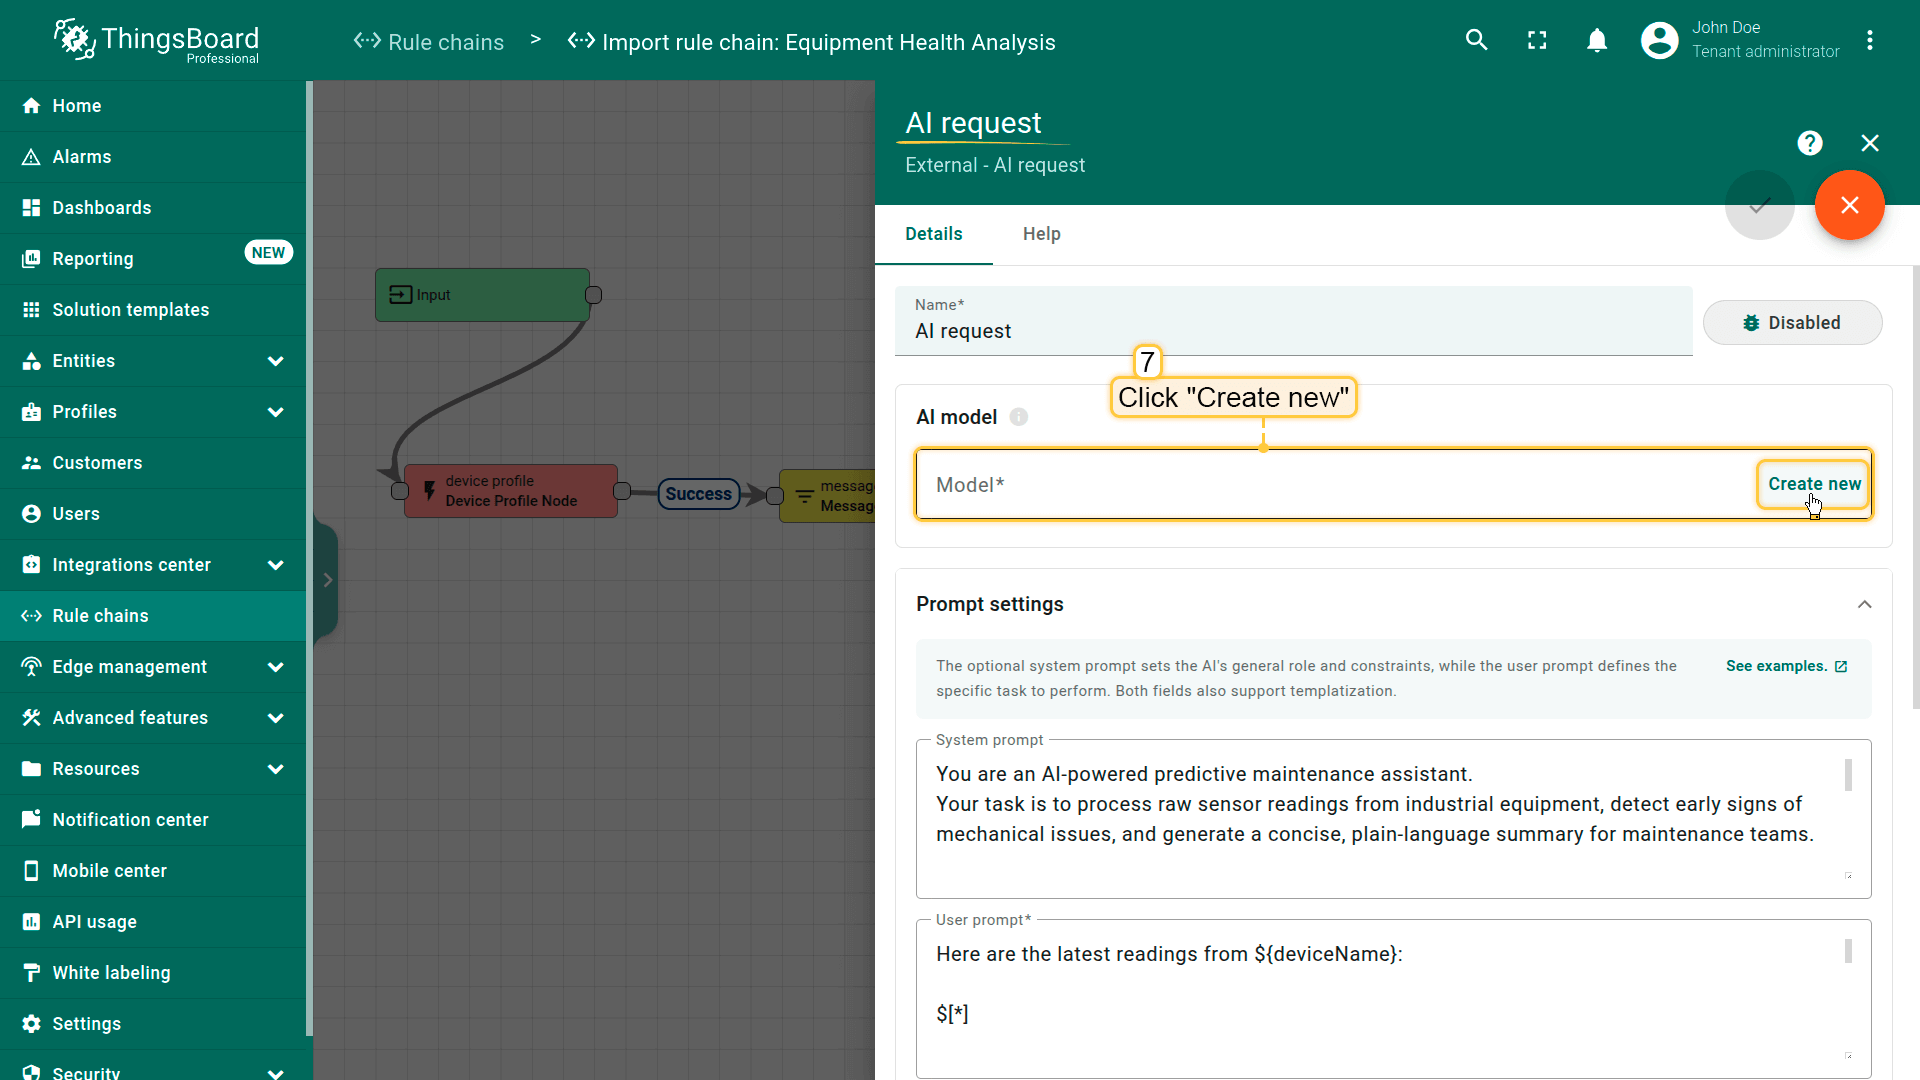
- Click "Create new" AI model.
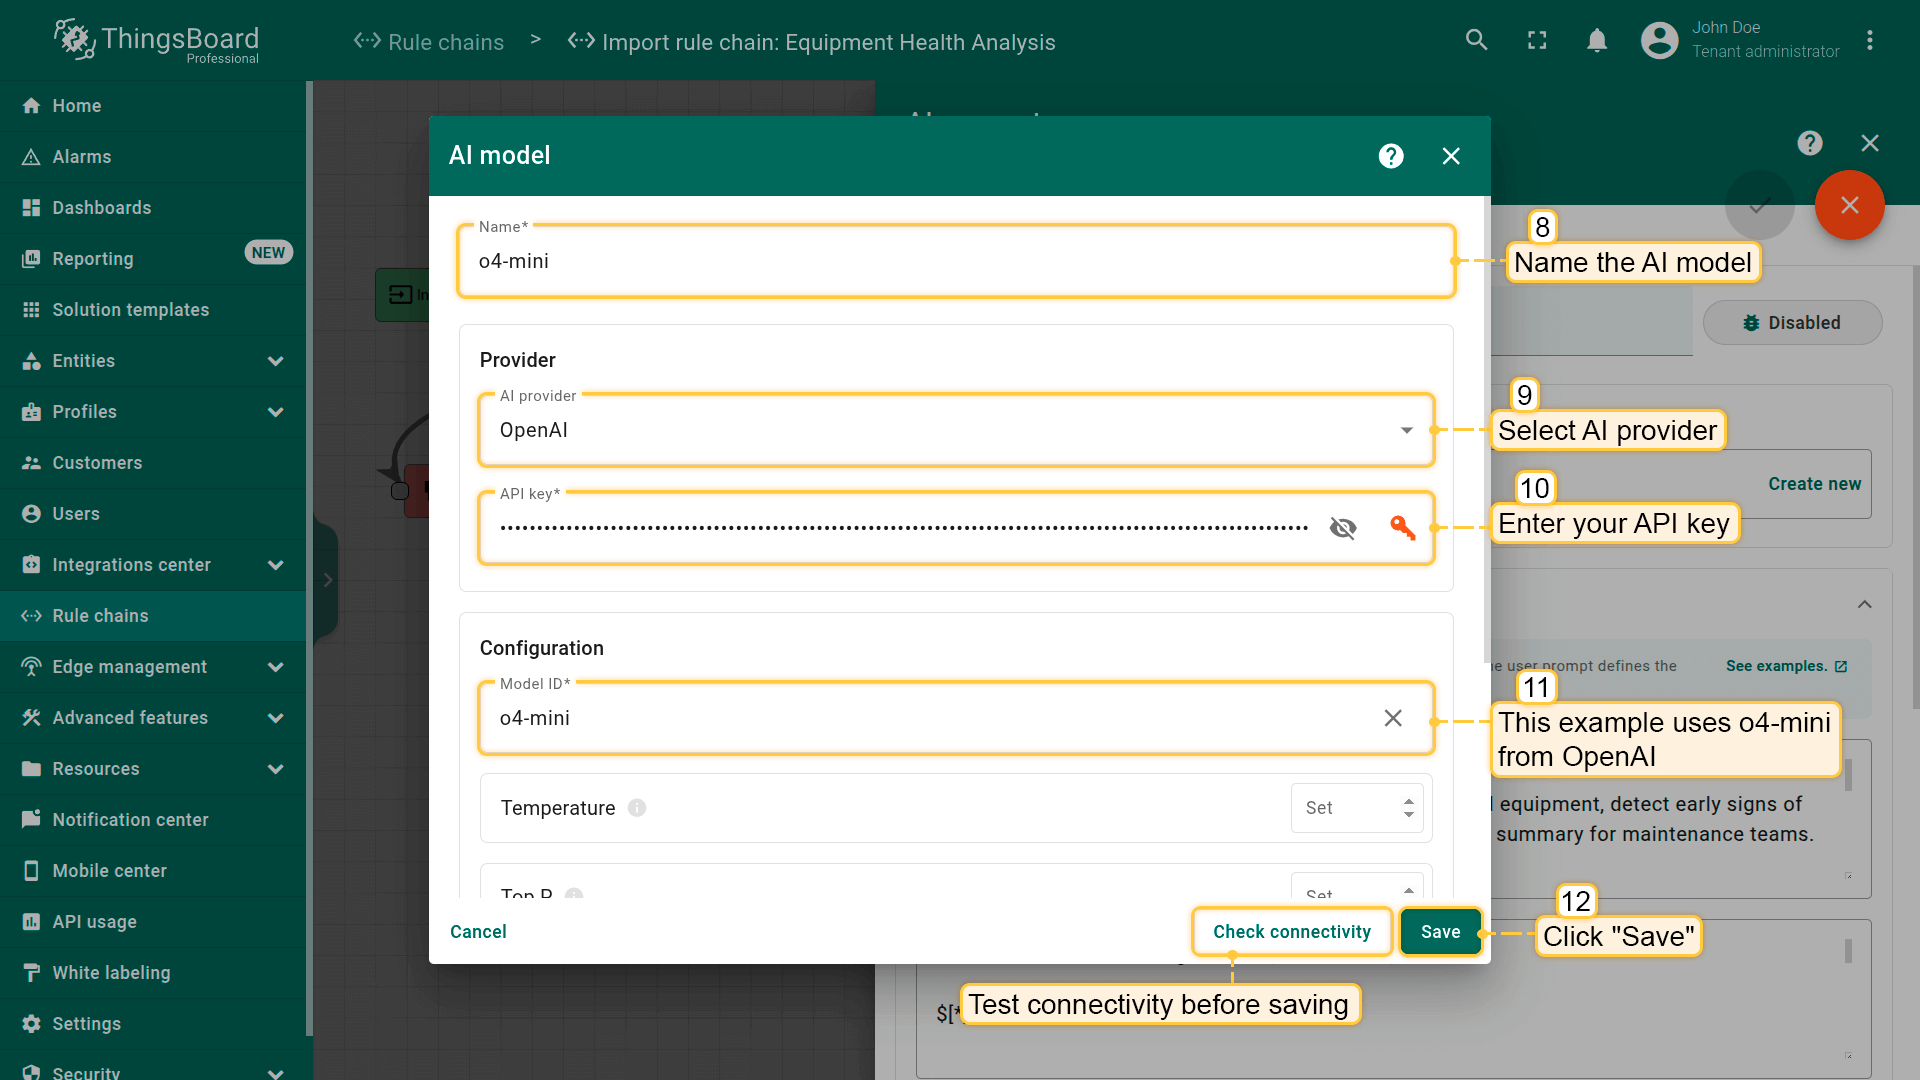
- Enter a name for the AI model, choose the AI provider, and paste your API key. This example uses o4-mini from OpenAI. Test connectivity before saving. Then, click "Save".
- Apply changes to "AI request" node.
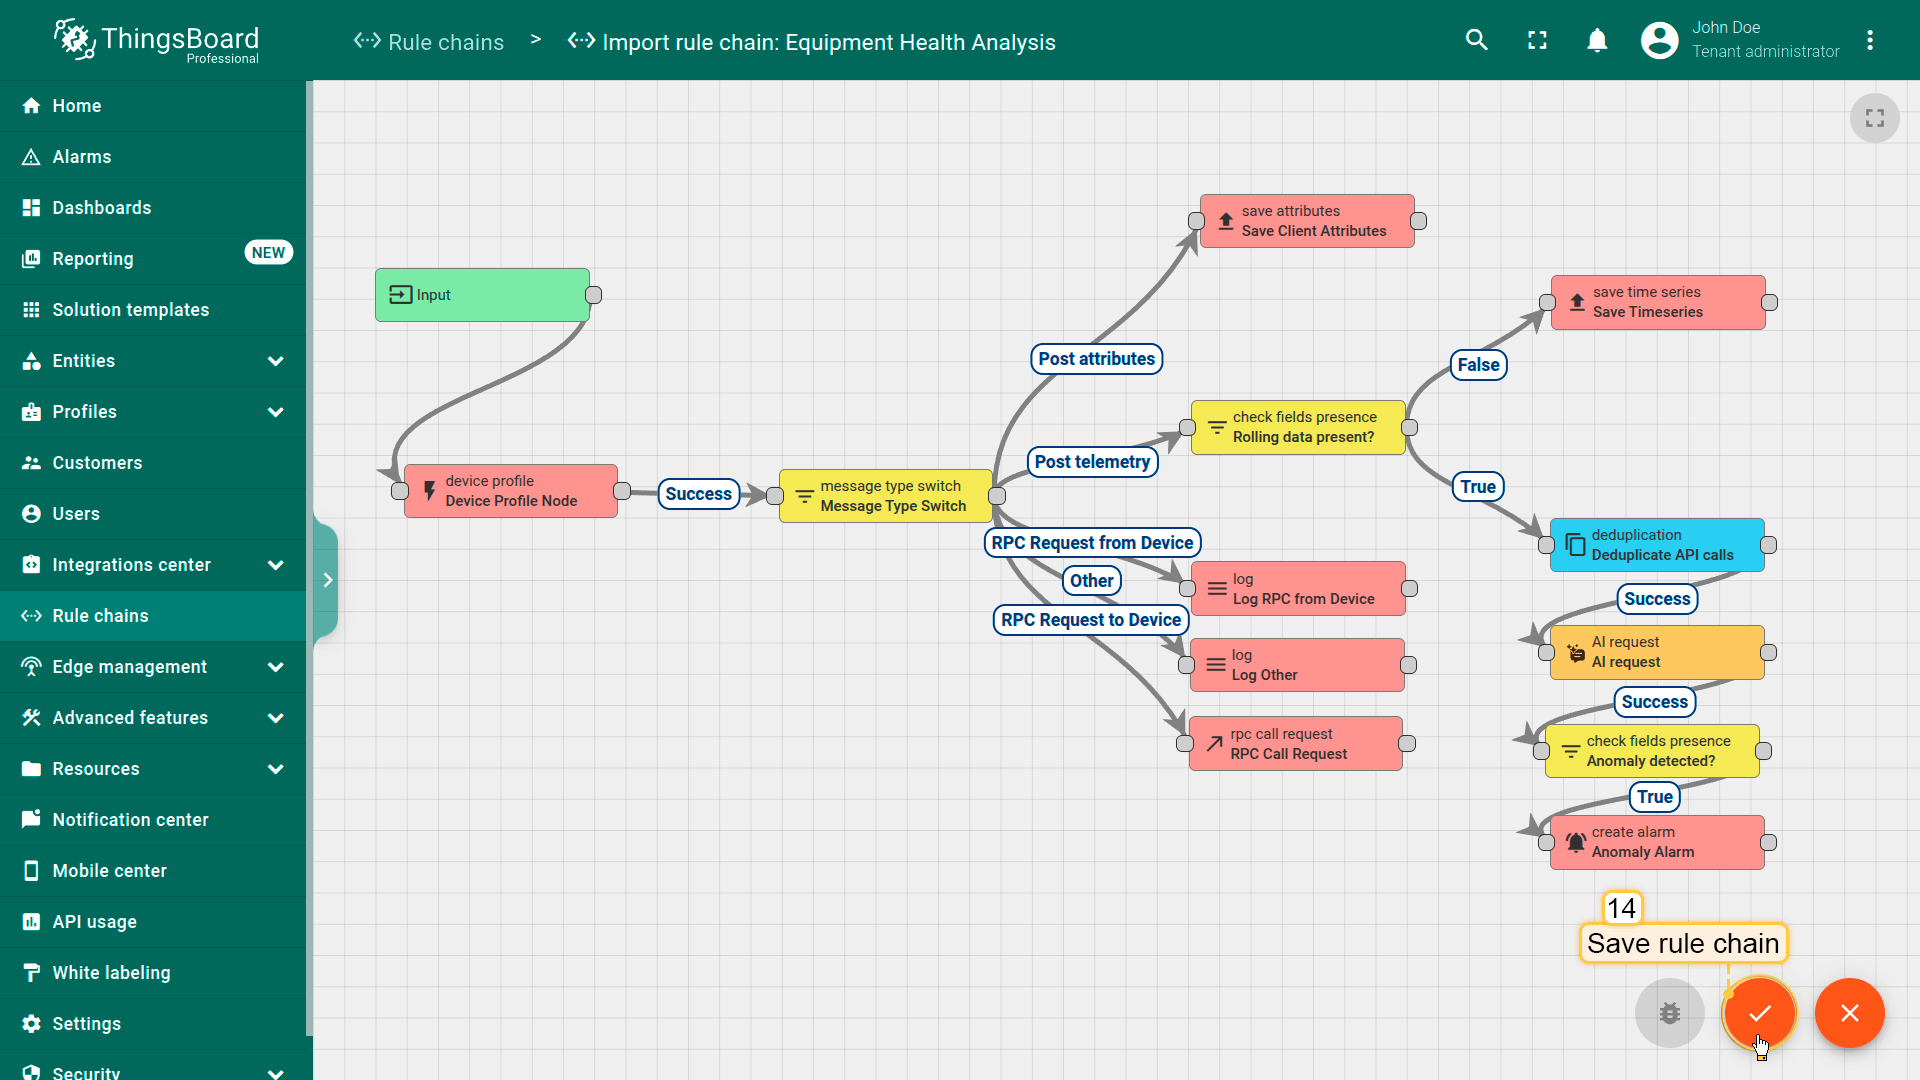
- Save rule chain.
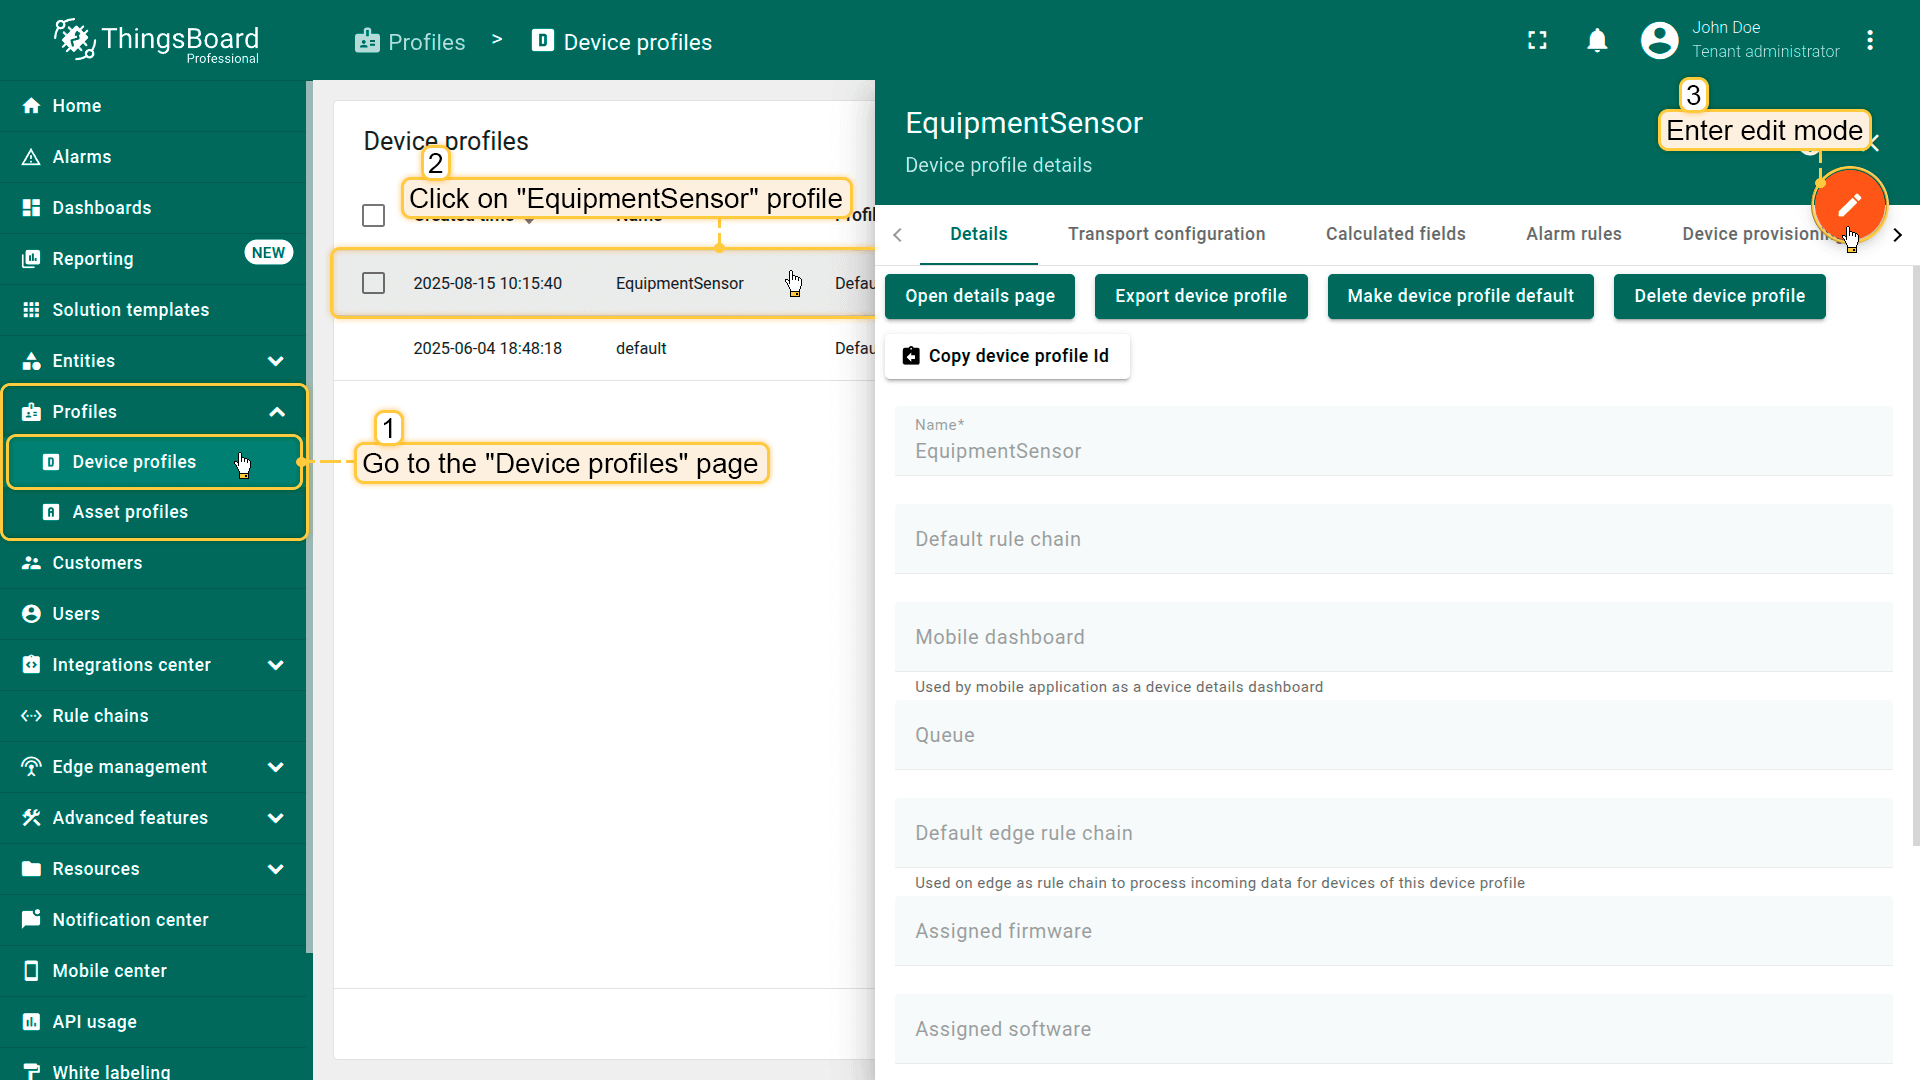
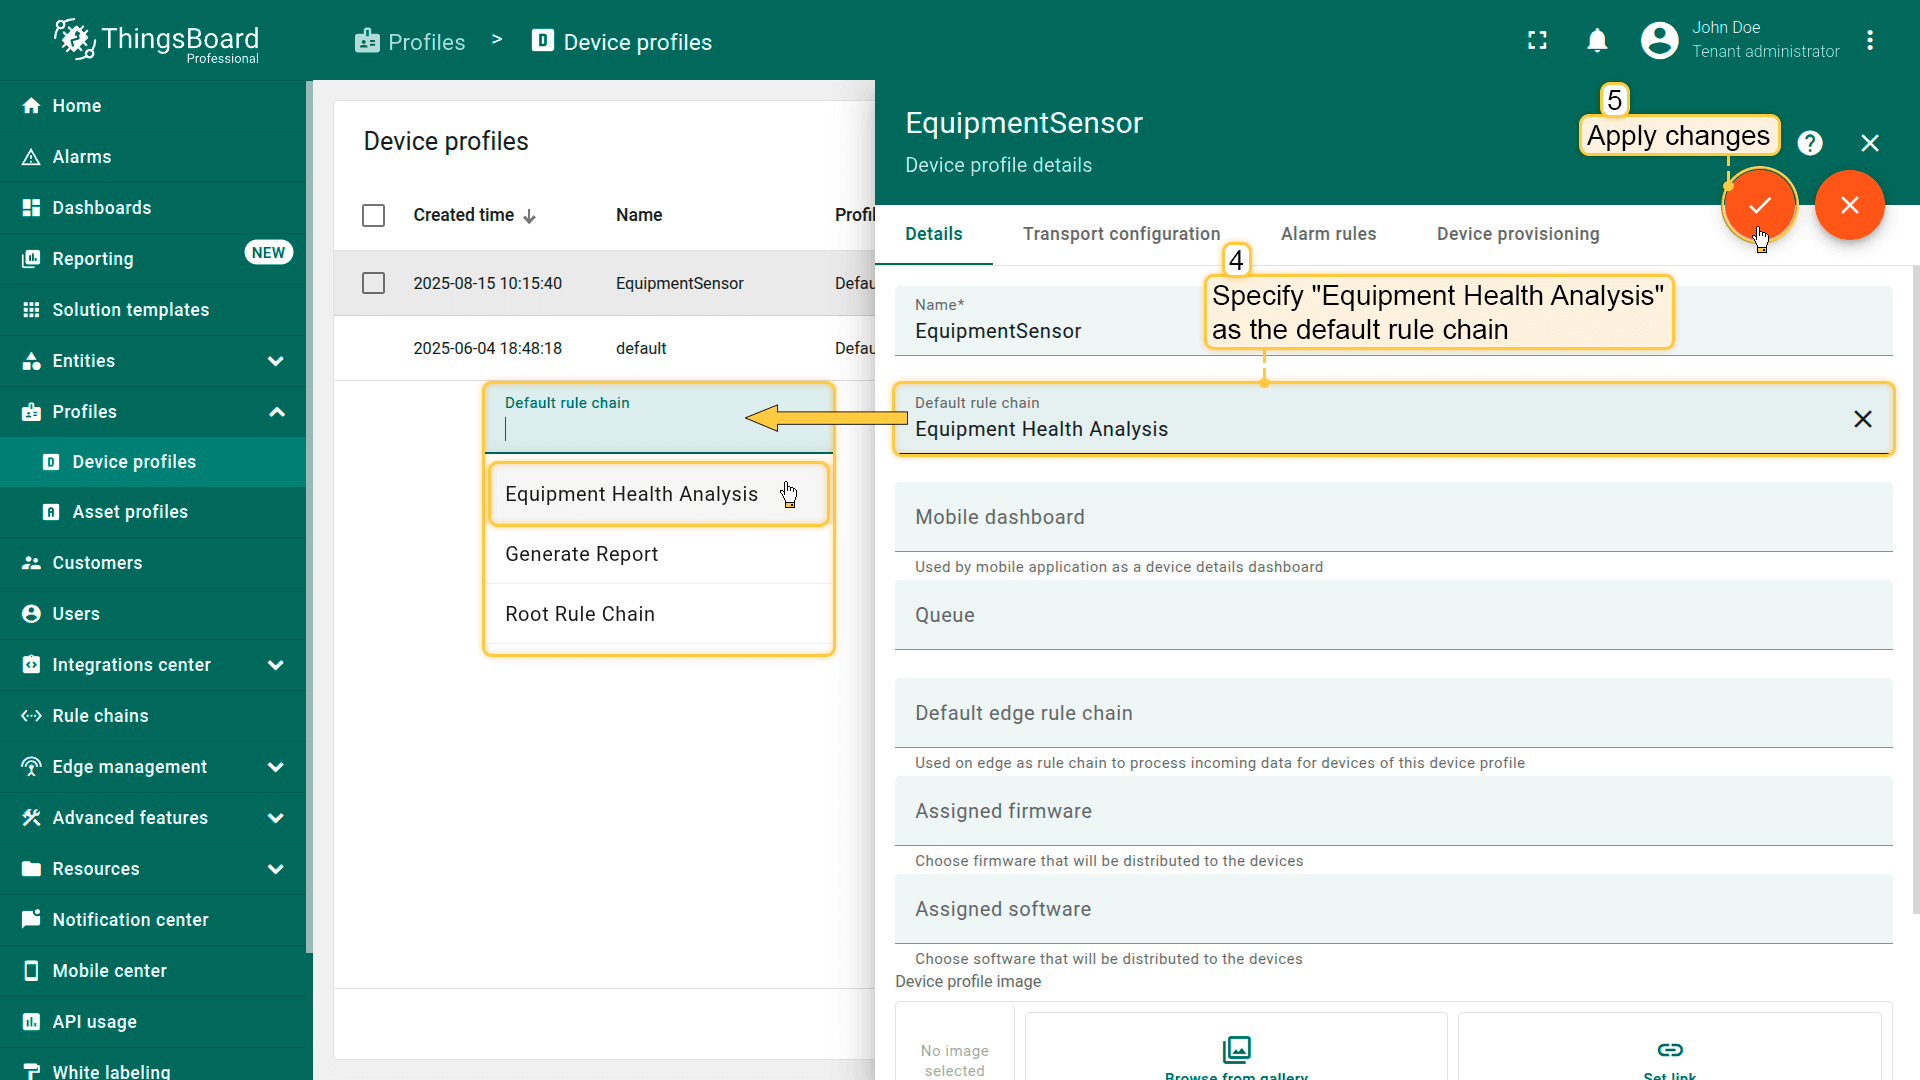
5. Update the EquipmentSensor profile to reference the “Equipment Health Analysis” rule chain.
Important details:
- System and user prompts can reference incoming message data:
$[*]— entire message body${*}— entire message metadata$[key]— a specific message body field${key}— a specific metadata value
- Supported response formats: TEXT, JSON, and JSON Schema (we use JSON Schema here).
- A deduplication node with a 5-second interval is used to reduce AI token usage.
Testing
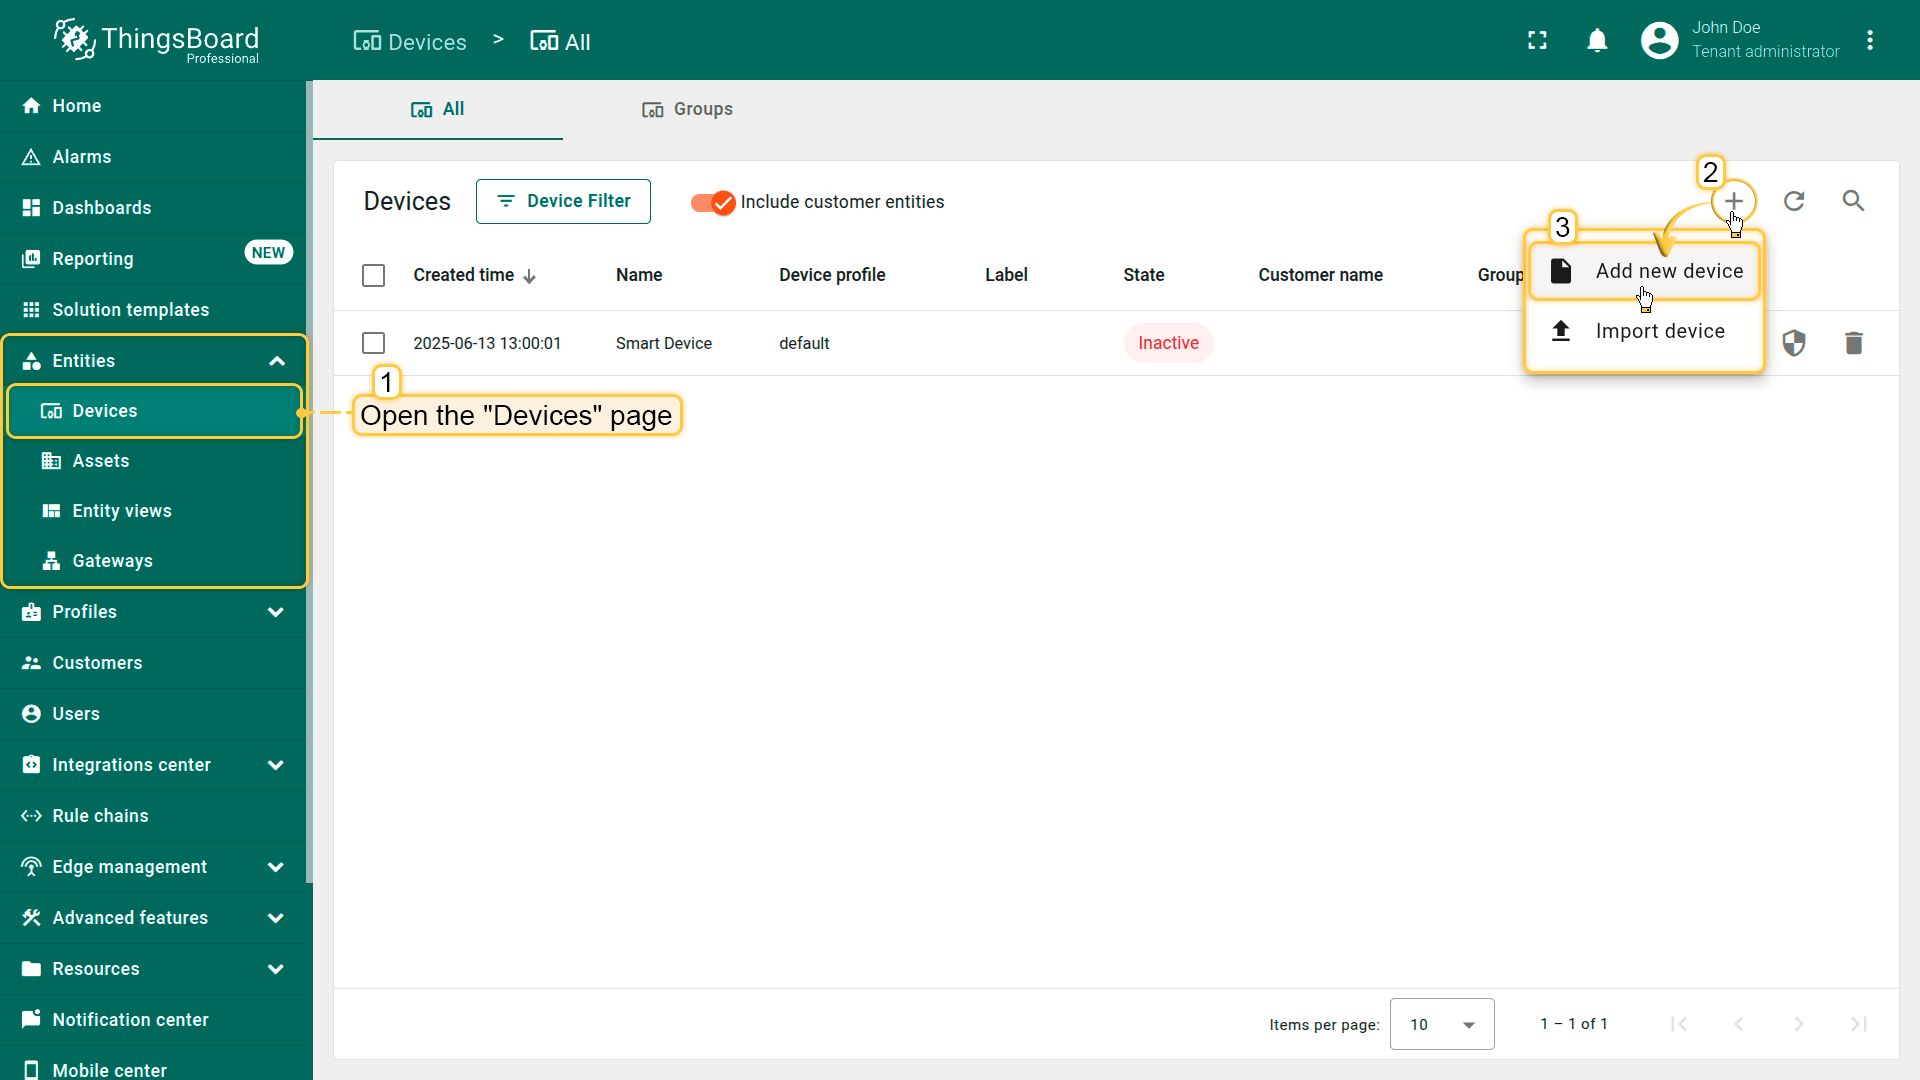
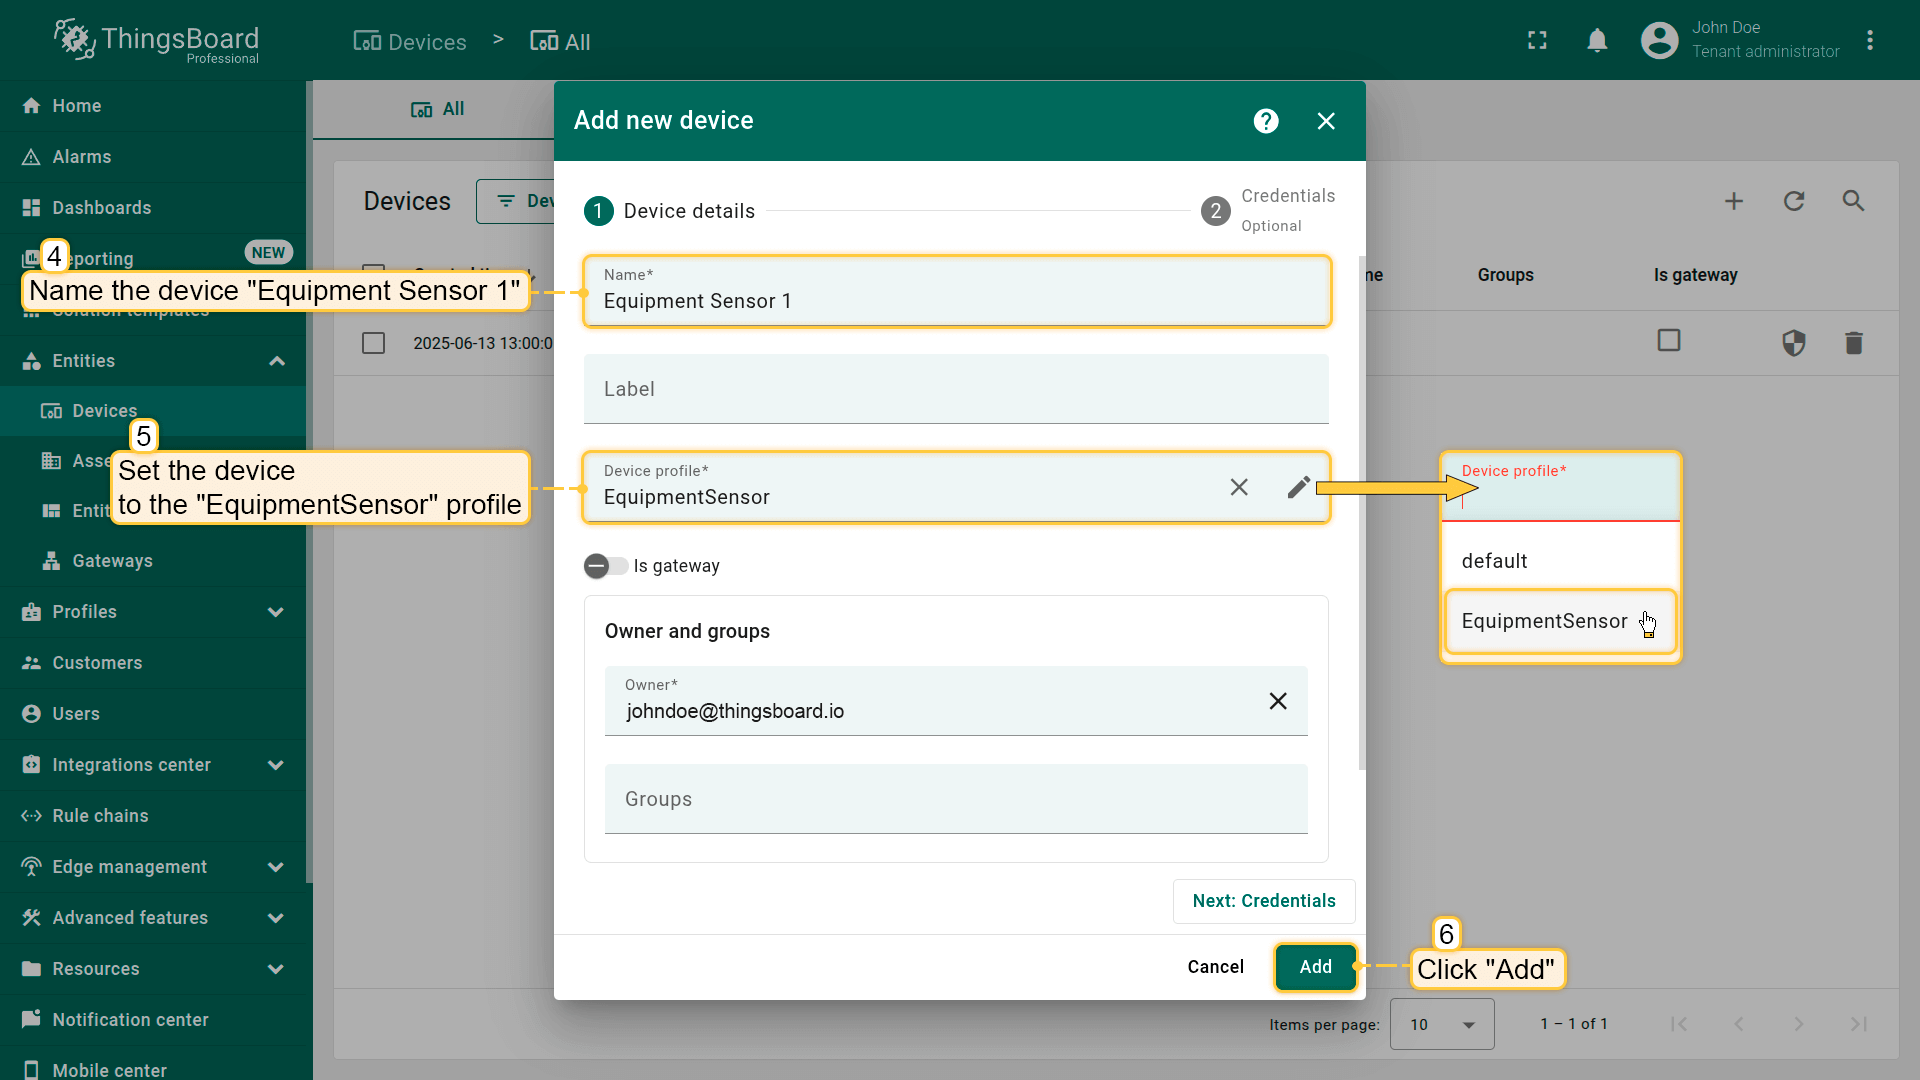
Step 1. Create a test device Equipment Sensor 1 with the EquipmentSensor profile.
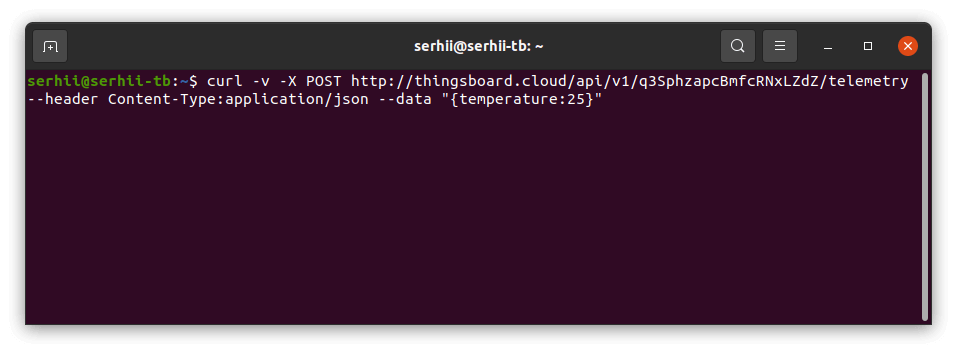
Step 2. Copy the “Check connectivity” command from the device details.
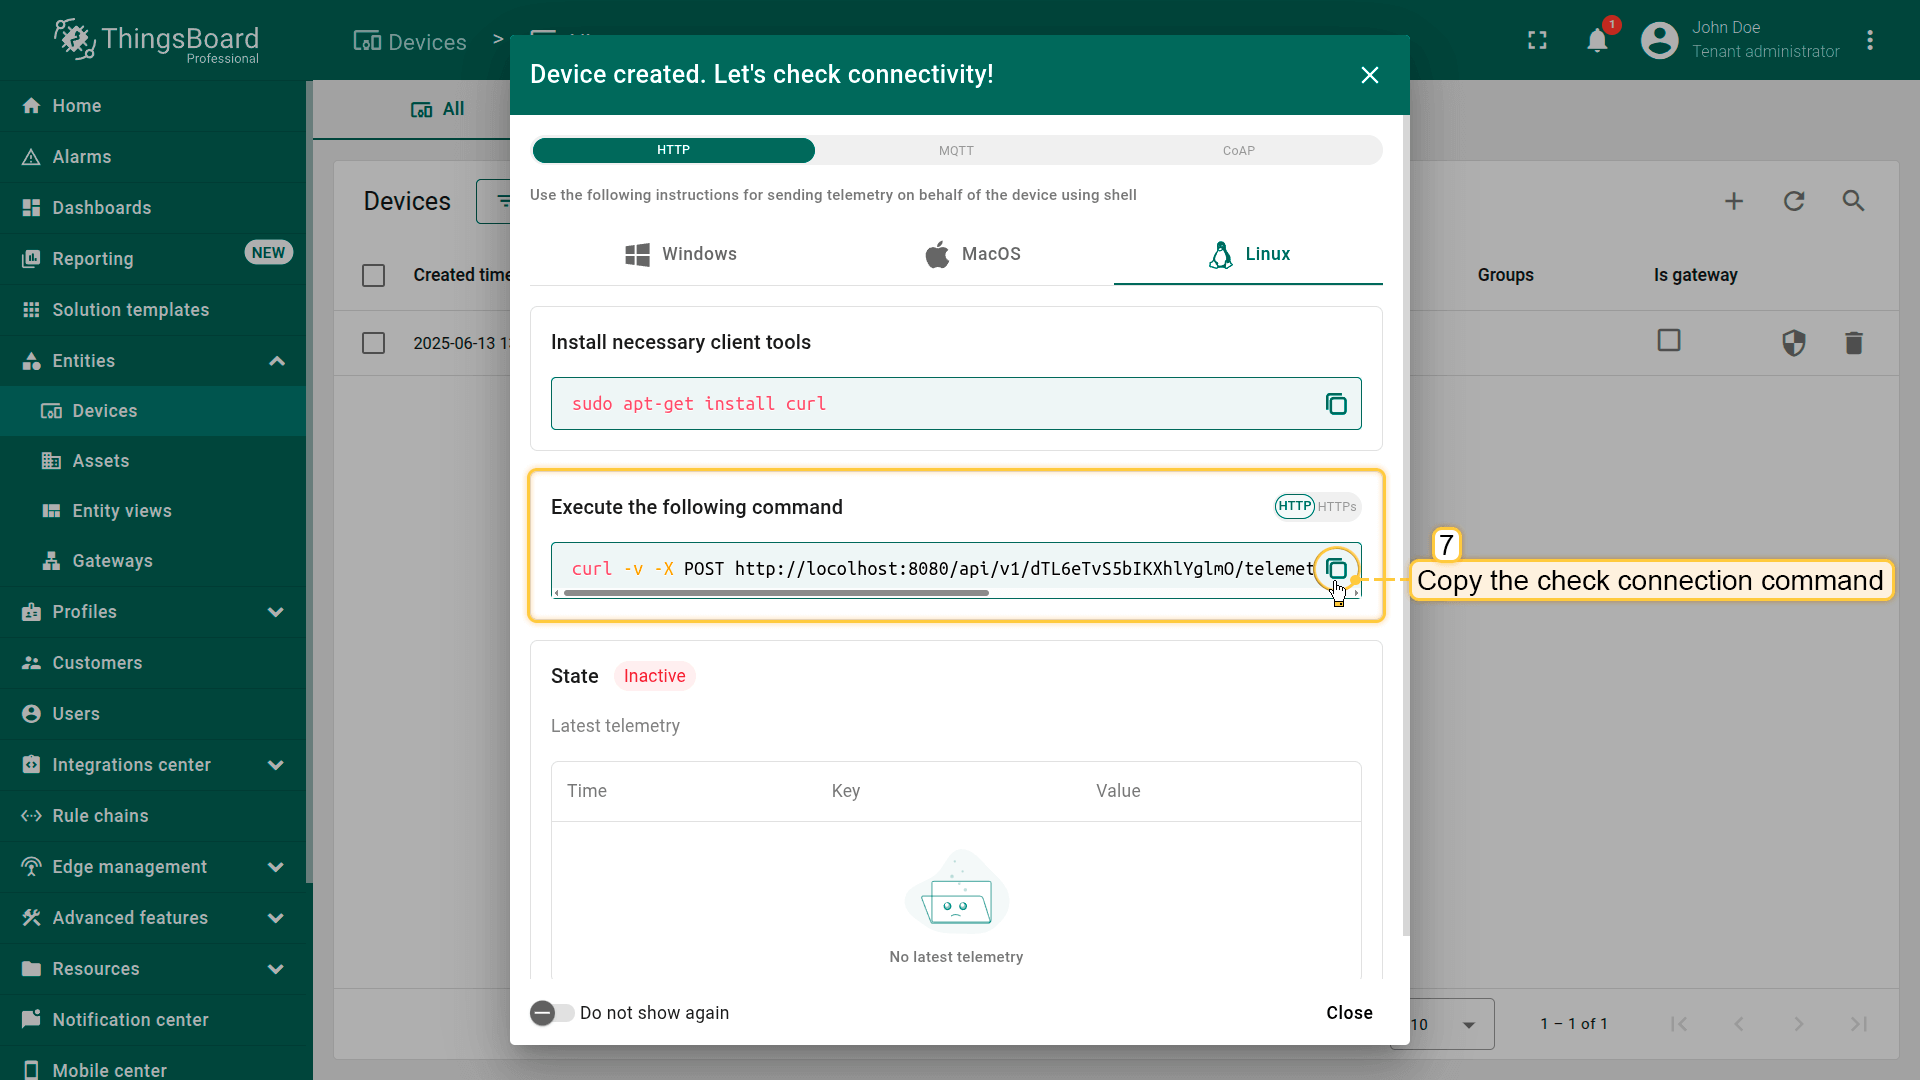
Your command will look something like this:
1
2
3
curl -v -X POST http://localhost:8080/api/v1/6sED1ALqyJg0P6ezIODH/telemetry \
--header Content-Type:application/json \
--data "{temperature:25}"
* Where localhost:8080 is the host of your ThingsBoard instance, and 6sED1ALqyJg0P6ezIODH is the device access token.
Step 3. Modify and send test data.
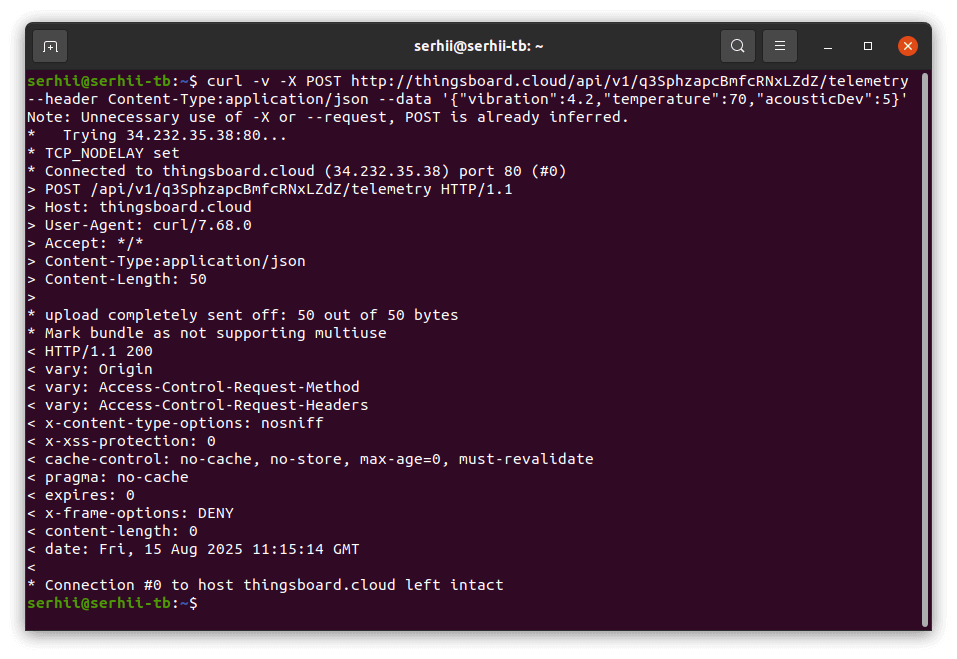
Step 3.1 No alarm case:
Send the following test data to ThingsBoard. Be sure to replace:
$THINGSBOARD_HOST_NAMEwith the host of your ThingsBoard instance,$YOUR_DEVICE_ACCESS_TOKENwith your device's access token.
1
2
3
curl -v -X POST http://$THINGSBOARD_HOST_NAME/api/v1/$YOUR_DEVICE_ACCESS_TOKEN/telemetry \
--header Content-Type:application/json \
--data '{"vibration":4.2,"temperature":70,"acousticDev":5}'
There won't be an alarm created.
Step 3.2 Bearing wear detection:
Simulate a bearing wear event by sending the following test data to ThingsBoard. Be sure to replace:
$THINGSBOARD_HOST_NAMEwith the host of your ThingsBoard instance,$YOUR_DEVICE_ACCESS_TOKENwith your device's access token.
1
2
3
curl -v -X POST http://$THINGSBOARD_HOST_NAME/api/v1/$YOUR_DEVICE_ACCESS_TOKEN/telemetry \
--header Content-Type:application/json \
--data '{"vibration":8.2,"temperature":88,"acousticDev":5}'
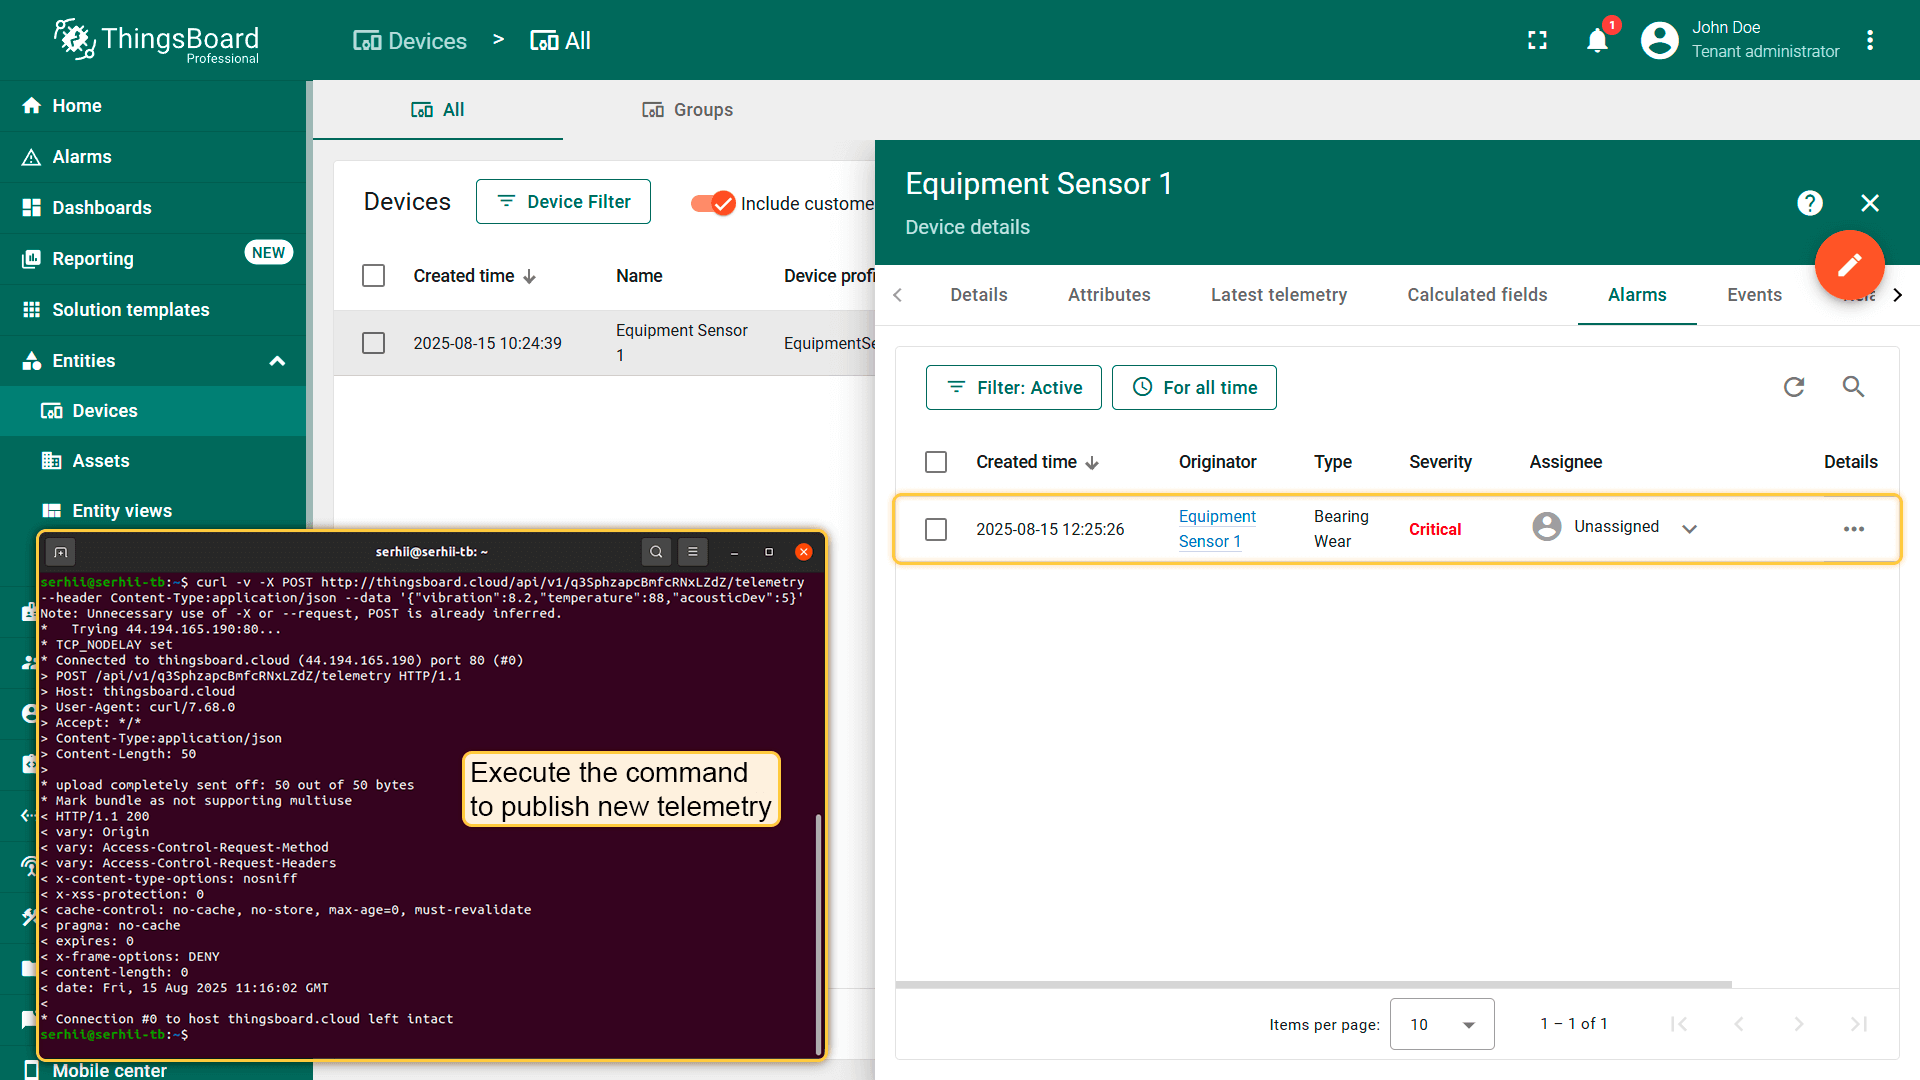
An alarm will be created. Below is an example of the AI output:
1
2
3
4
{
  "anomaly": "Bearing Wear",
  "summary": "Vibration has reached 7.4 mm/s and temperature is at 86 °C accompanied by irregular acoustic patterns, indicating bearing wear. Recommend immediate bearing inspection and replacement to avoid catastrophic failure."
}
Step 3.3 Misalignment detection:
Simulate a misalignment event by sending the following test data to ThingsBoard. Be sure to replace:
$THINGSBOARD_HOST_NAMEwith the host of your ThingsBoard instance,$YOUR_DEVICE_ACCESS_TOKENwith your device's access token.
1
2
3
curl -v -X POST http://$THINGSBOARD_HOST_NAME/api/v1/$YOUR_DEVICE_ACCESS_TOKEN/telemetry \
--header Content-Type:application/json \
--data '{"vibration":32.2,"temperature":38,"acousticDev":5}'
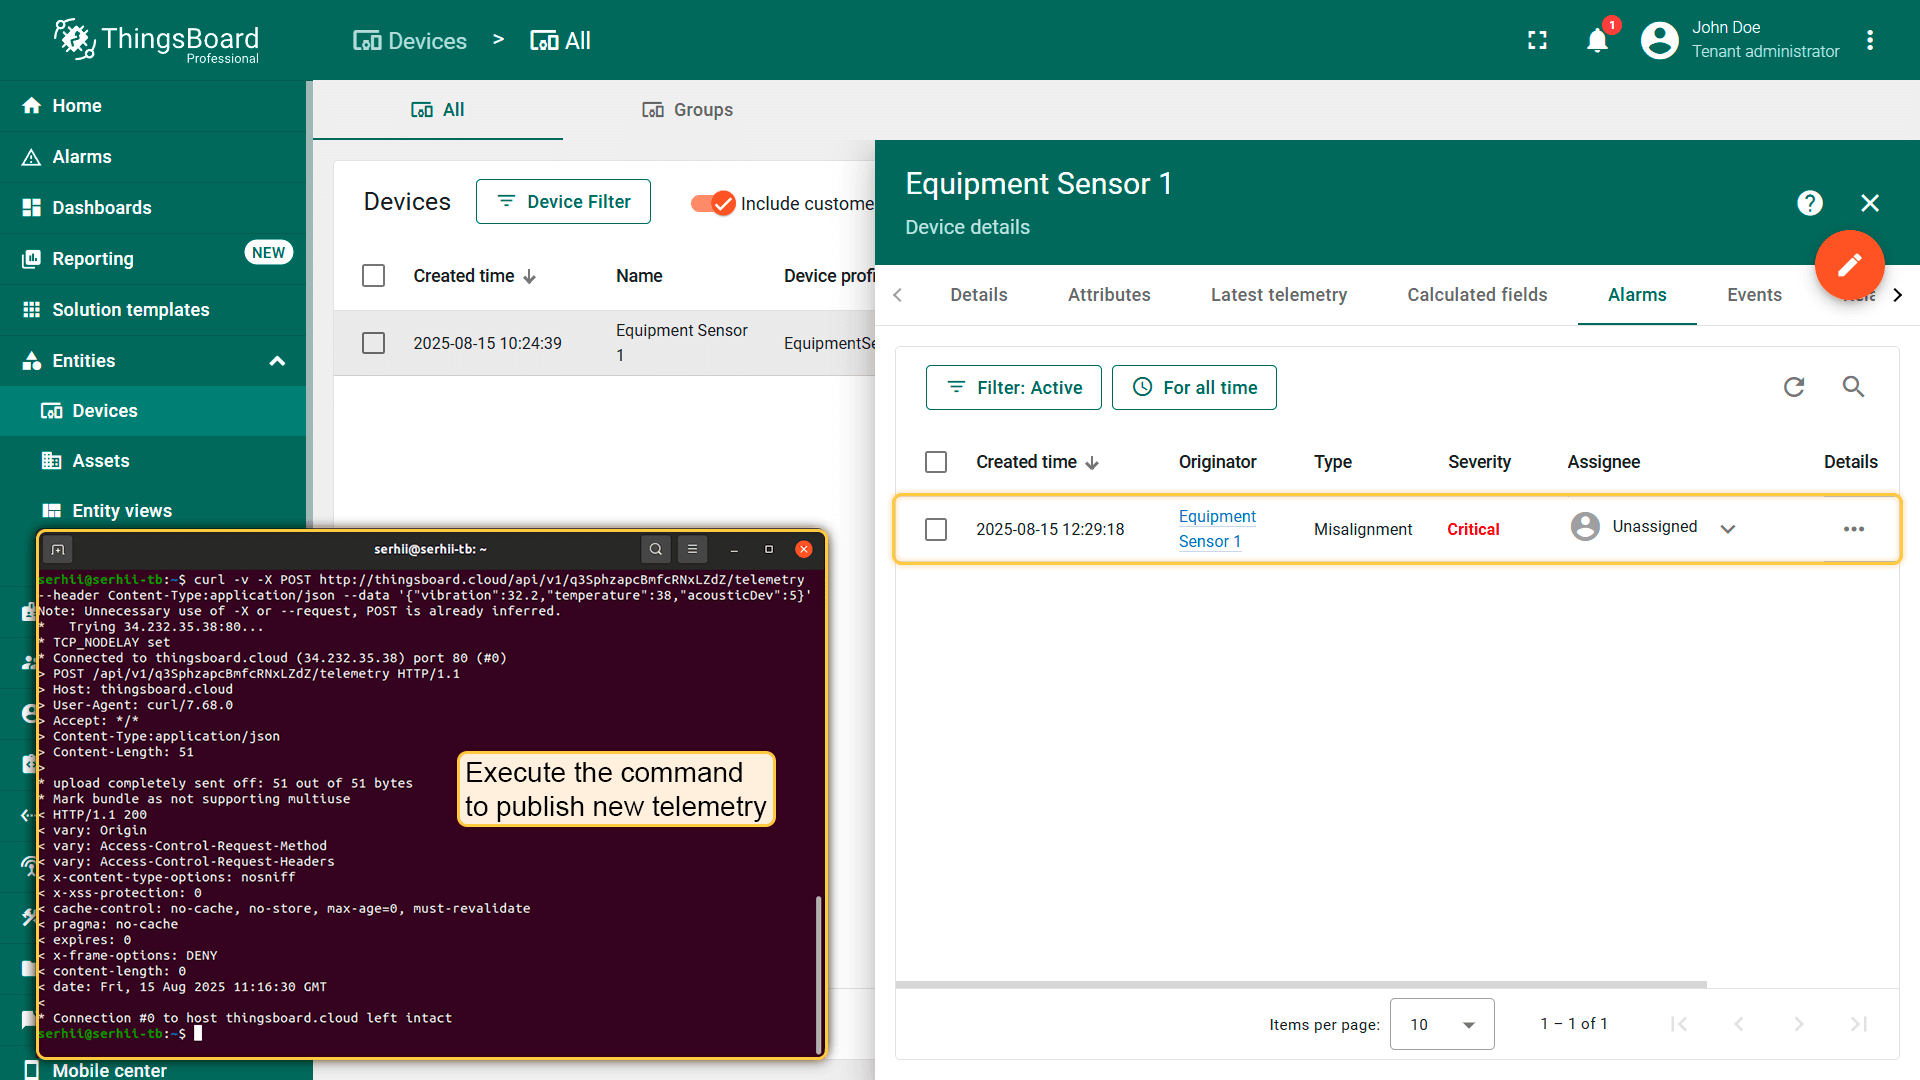
An alarm will be created. Below is an example of the AI output:
1
2
3
4
{
  "anomaly": "Misalignment",
  "summary": "A sudden vibration spike to 32.2 mm/s without a corresponding temperature rise or acoustic deviation indicates likely misalignment in the drive train. Please perform an immediate shaft-and-coupling alignment check to prevent further mechanical damage."
}
Performance & Cost Controls
- Batching & debounce: Send to AI only after N points or every T seconds.
- Early filters: Skip AI call if all metrics are comfortably within normal bands.
- Payload compacting: Send statistics (min/mean/max/std, trend) instead of full arrays if prompt allows.
Troubleshooting
- No alarms:
- Verify raw device data is available in ‘Latest telemetry’ tab.
- Enable and browse the calculated field debug events.
- Enable and browse the corresponding rule nodes debug events.
- High costs: Increase the de-duplication period, tune prompt or switch AI model.
Next steps
Experiment with AI prompts and share your feedback with community!