- Adding the component
- Configuration
- Example: Embedding the Environmental Monitor dashboard
- Next steps
- Your feedback
| Available since TB Version 4.2 |
Only Professional Edition supports Reporting feature.
Use ThingsBoard Cloud or install your own platform instance.
The Dashboard component allows you to take a snapshot of a selected dashboard and insert it into a report as an image.
As a result, the report displays a static view of the dashboard at the time the report was generated.
This is useful when you want to:
- include dashboards in scheduled reports
- archive dashboard data for historical reference
- share a dashboard snapshot without exposing live data access
Adding the component
- Navigate to the Templates tab on the Reporting page.
- Open an existing report (or subreport) template or create a new one.
- In the Components library, find the Dashboard component and drag it into the content area of your report.
Configuration
Datasource
The widgets on the dashboard you embed may:
- have their own data source defined in their widget settings,
- have no data source at all (e.g., a static info card),
- or be configured to display data from the entity (or entities) defined in the Dashboard component of the report template.
If widgets on the dashboard are configured to display data from the entity (or entities) set in the component:
- Define the component's data source (either a device or an entity alias).
- If needed, configure filters.
If the alias contains multiple entities, the report will generate a copy of the dashboard for each entity.
Target dashboard
- Select the dashboard you want to embed in the report.
- Optionally, specify a particular dashboard state.
- You can also configure a custom time window and time zone for the snapshot.
Layout settings
Adjust the appearance of the component by setting:
- width
- alignment
- paddings and margins
- background and border style
Saving and Testing
- Once the dashboard component is configured, click Save.
- To verify that your template is set up correctly and the data displays as expected, click Generate test report (next to the Save button). The system will generate a sample report using the available test data from the selected device or entity alias.
Example: Embedding the Environmental Monitor dashboard
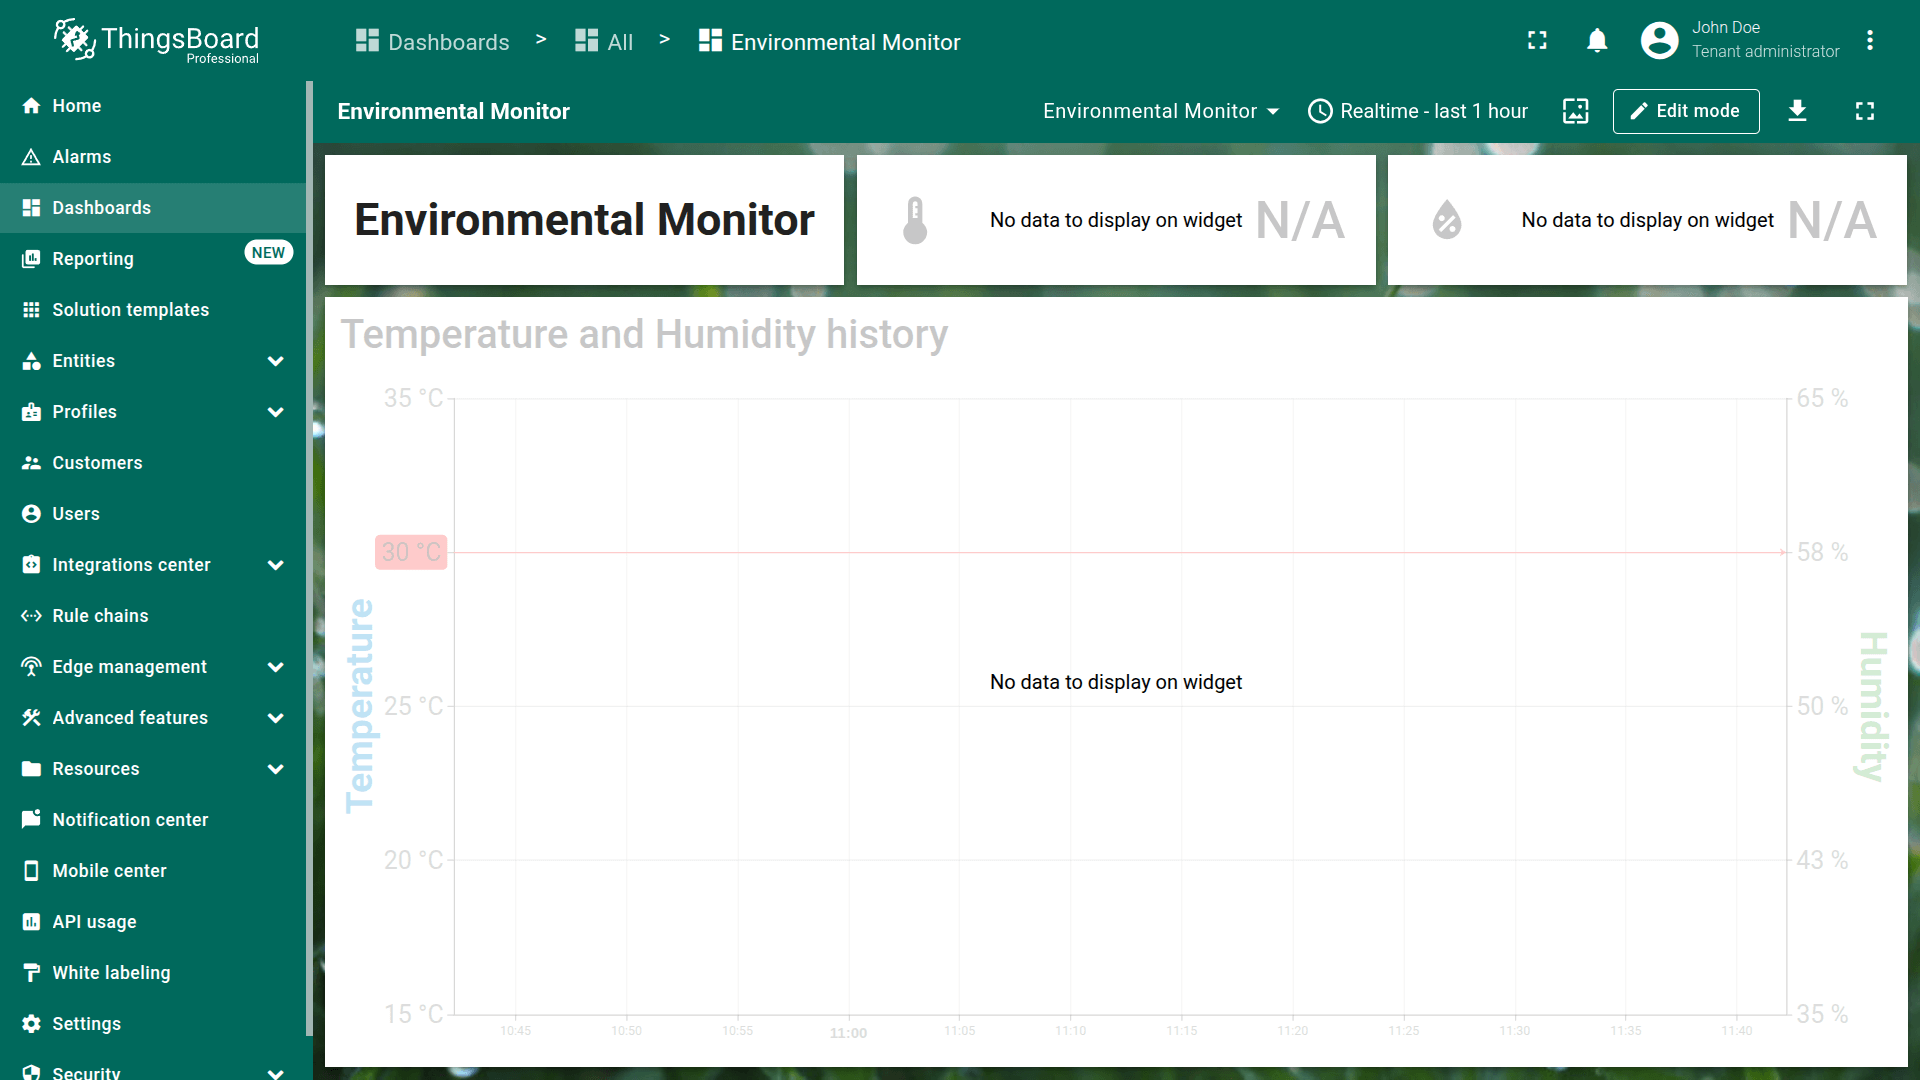
In this example, we will embed the preconfigured Environmental Monitor dashboard into the report.
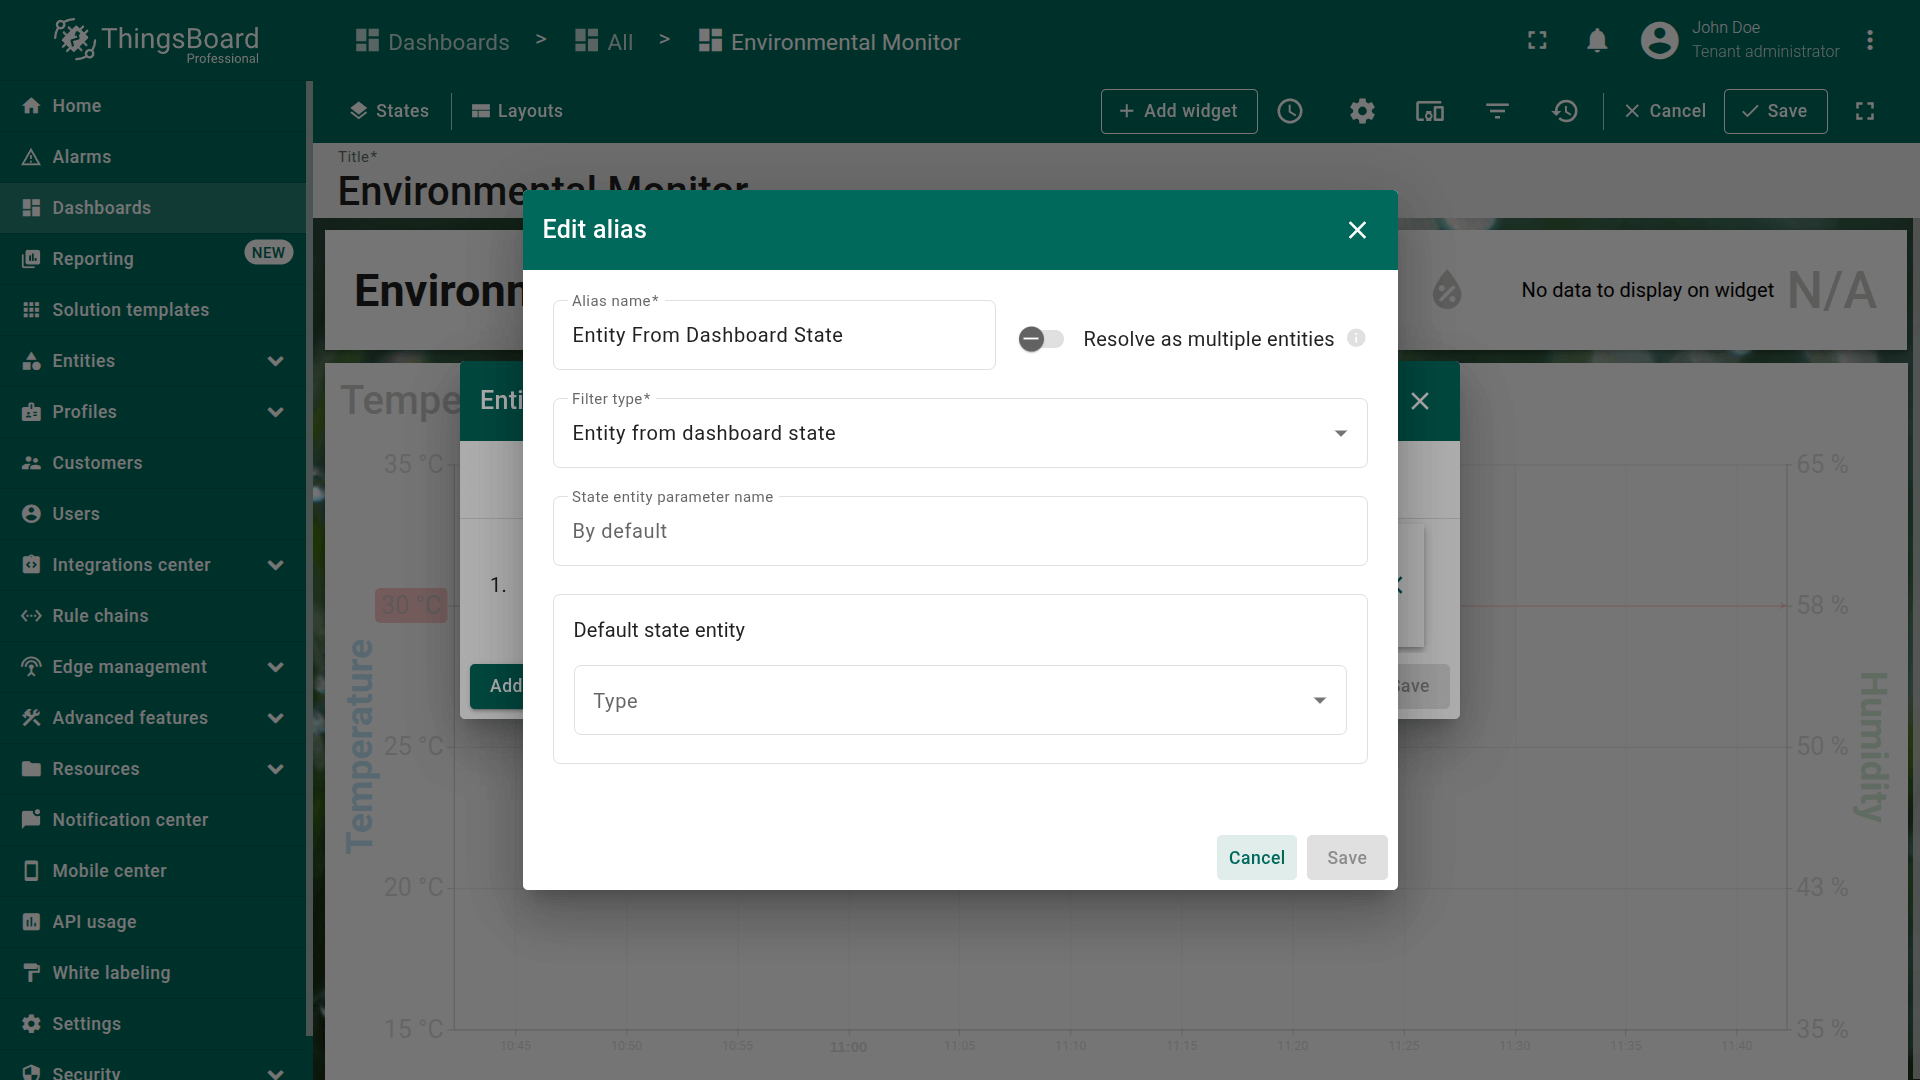
All widgets on this dashboard use the entity alias “Entity from dashboard state” as their data source.
This means they will display values from the entity you specify as the data source in the report template.
Step 1. Preparation
-
Prepare a device that sends temperature and humidity telemetry to ThingsBoard.
If you don't have a real device, you can simulate sending telemetry data in real time using the Rule Engine. See the guide here. -
Prepare the dashboard you want to embed:
- Download the Environmental Monitor dashboard in JSON format.
- Import it into your ThingsBoard instance.
- Or use your own existing dashboard.
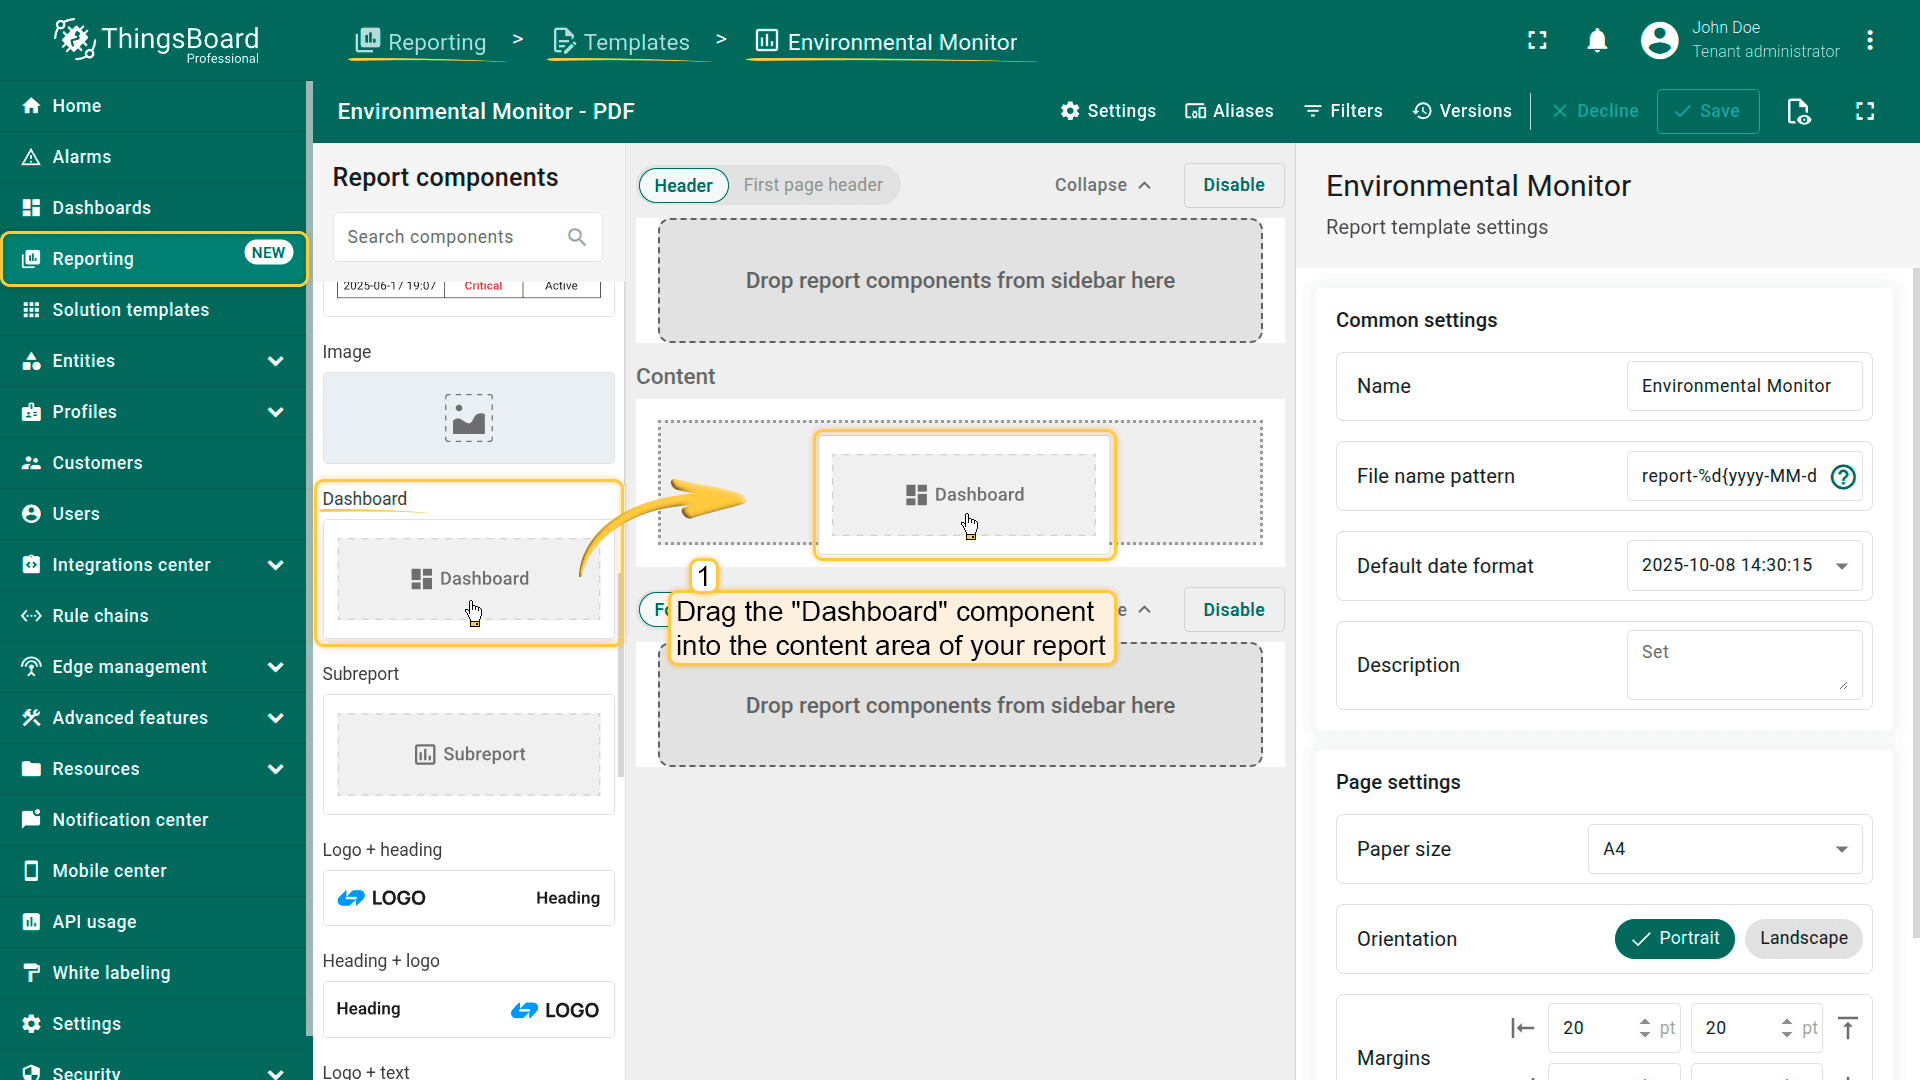
Step 2. Adding the component
- Go to the “Templates” tab on the “Reporting” page.
- Open an existing report template or create a new one.
- Drag the Dashboard component into the content area of your report.
- Open an existing report template or create a new one.
- Drag the Dashboard component into the content area of your report.
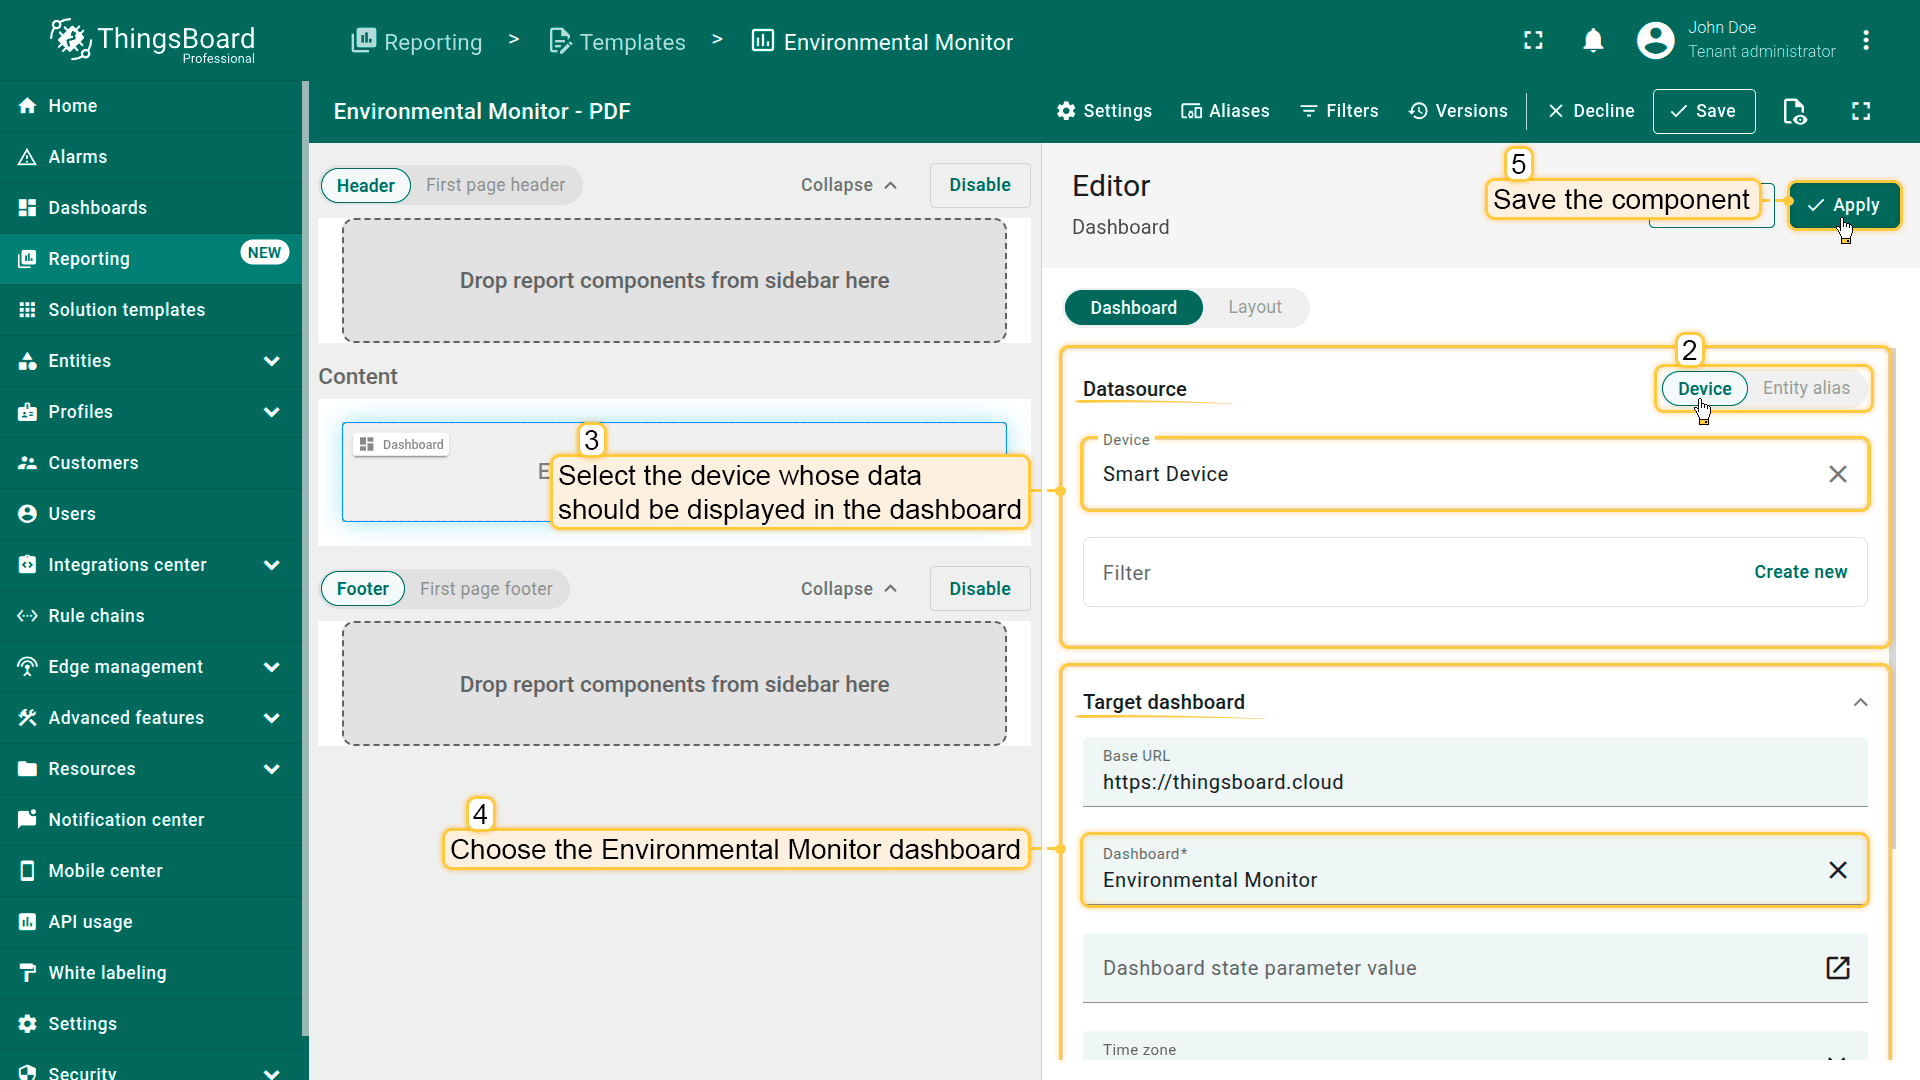
Step 3. Configure the data source
- In the “Datasource” section, select the device whose data should be displayed in the dashboard.
- In the “Target dashboard” section, choose the Environmental Monitor dashboard.
- Save the component.
- In the "Datasource" section, select the device whose data should be displayed in the dashboard.
- In the "Target dashboard" section, choose the Environmental Monitor dashboard.
- Save the component.
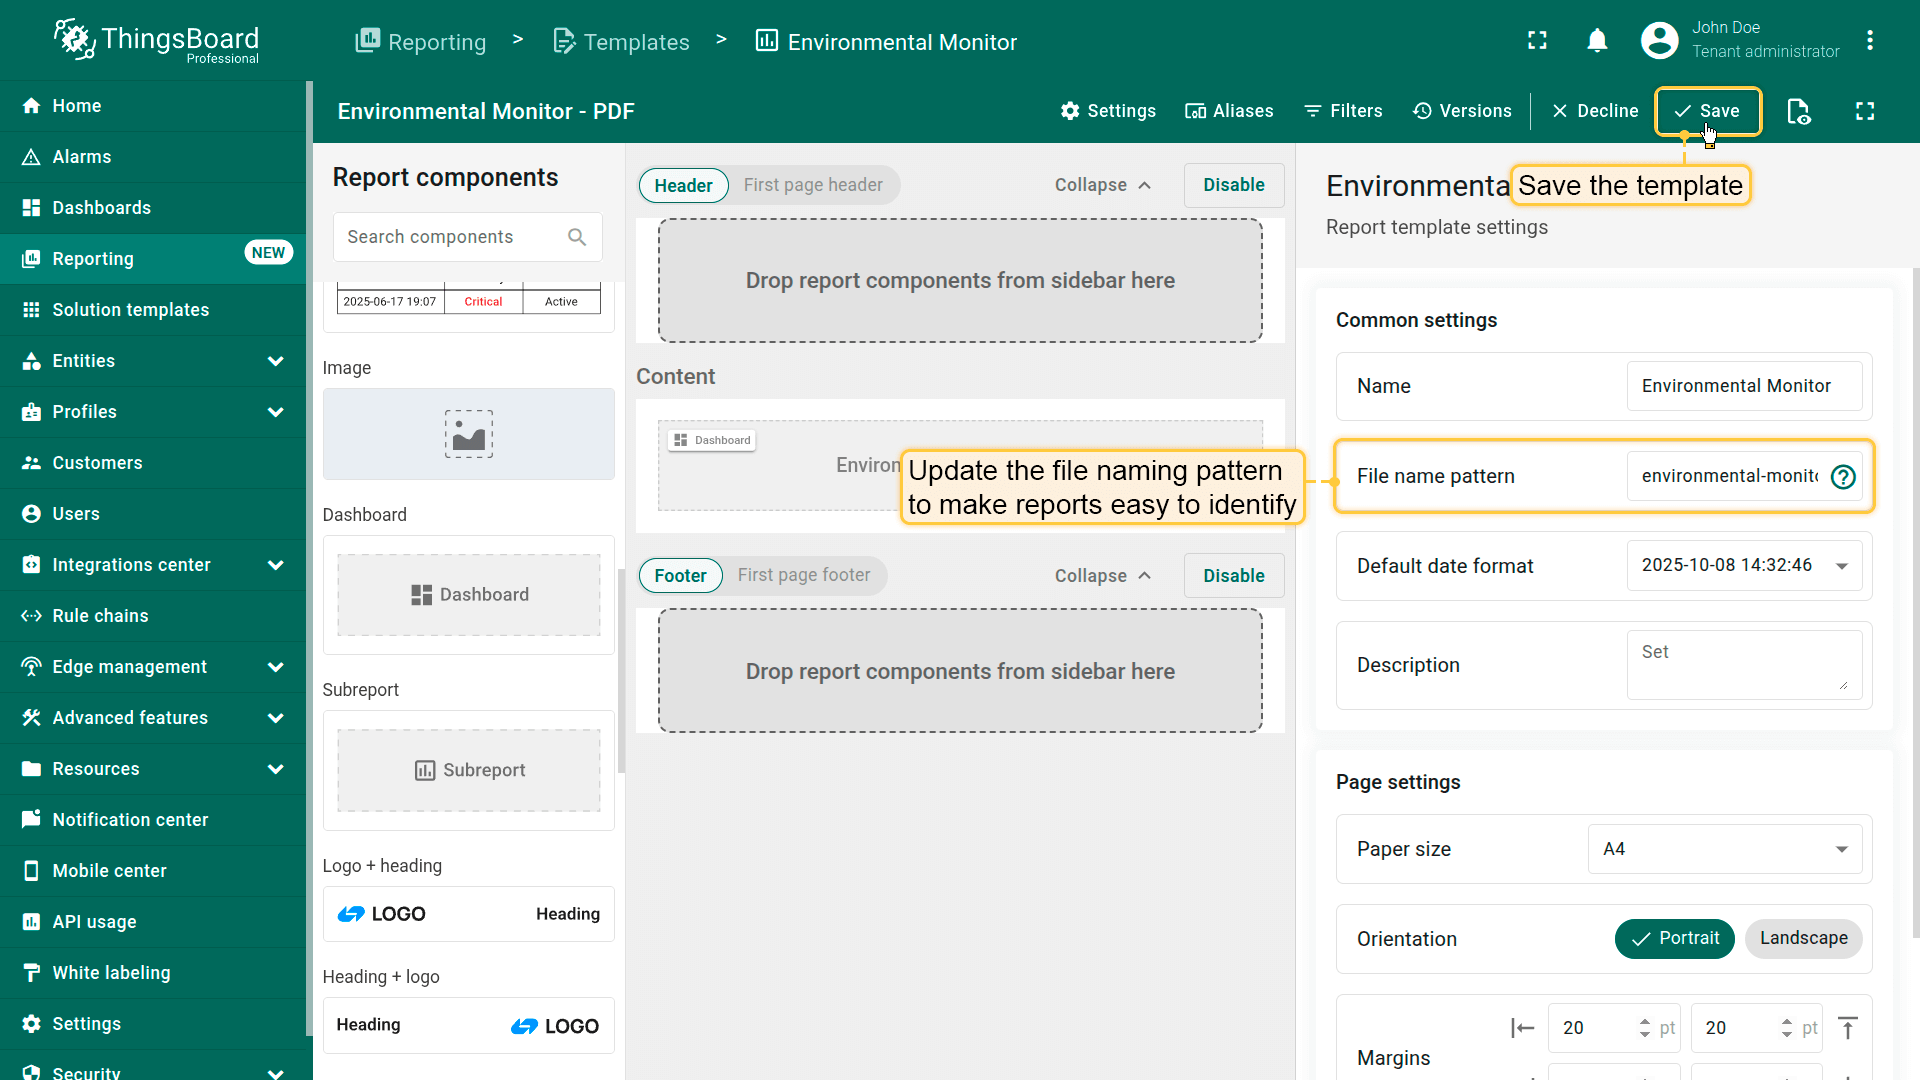
Step 4. Save the report template
- Update the file name pattern so that exported reports are easy to identify.
For example:
1
environmental-monitor-report-%d{yyyy-MM-dd_HH:mm:ss}
- Save the template.
- Save the template.
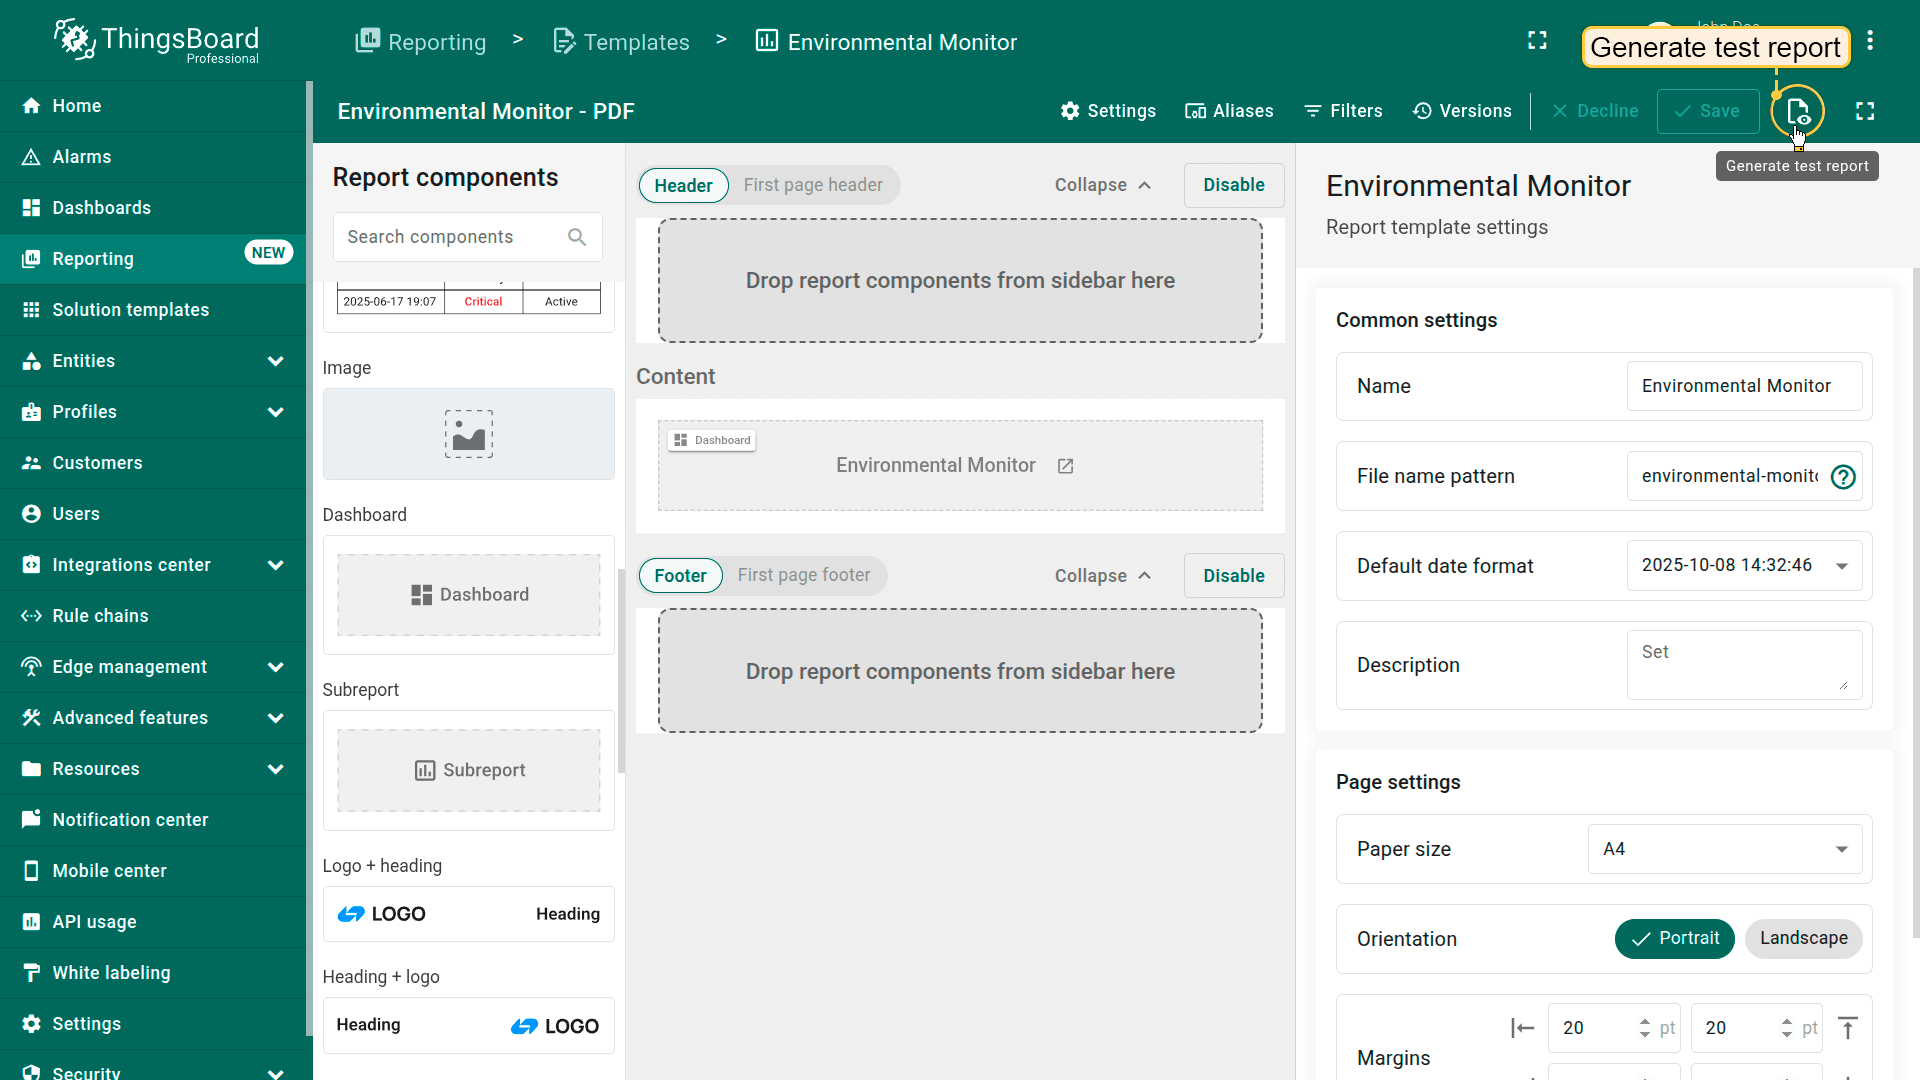
Step 5. Testing
- Click Generate test report to verify the configuration.
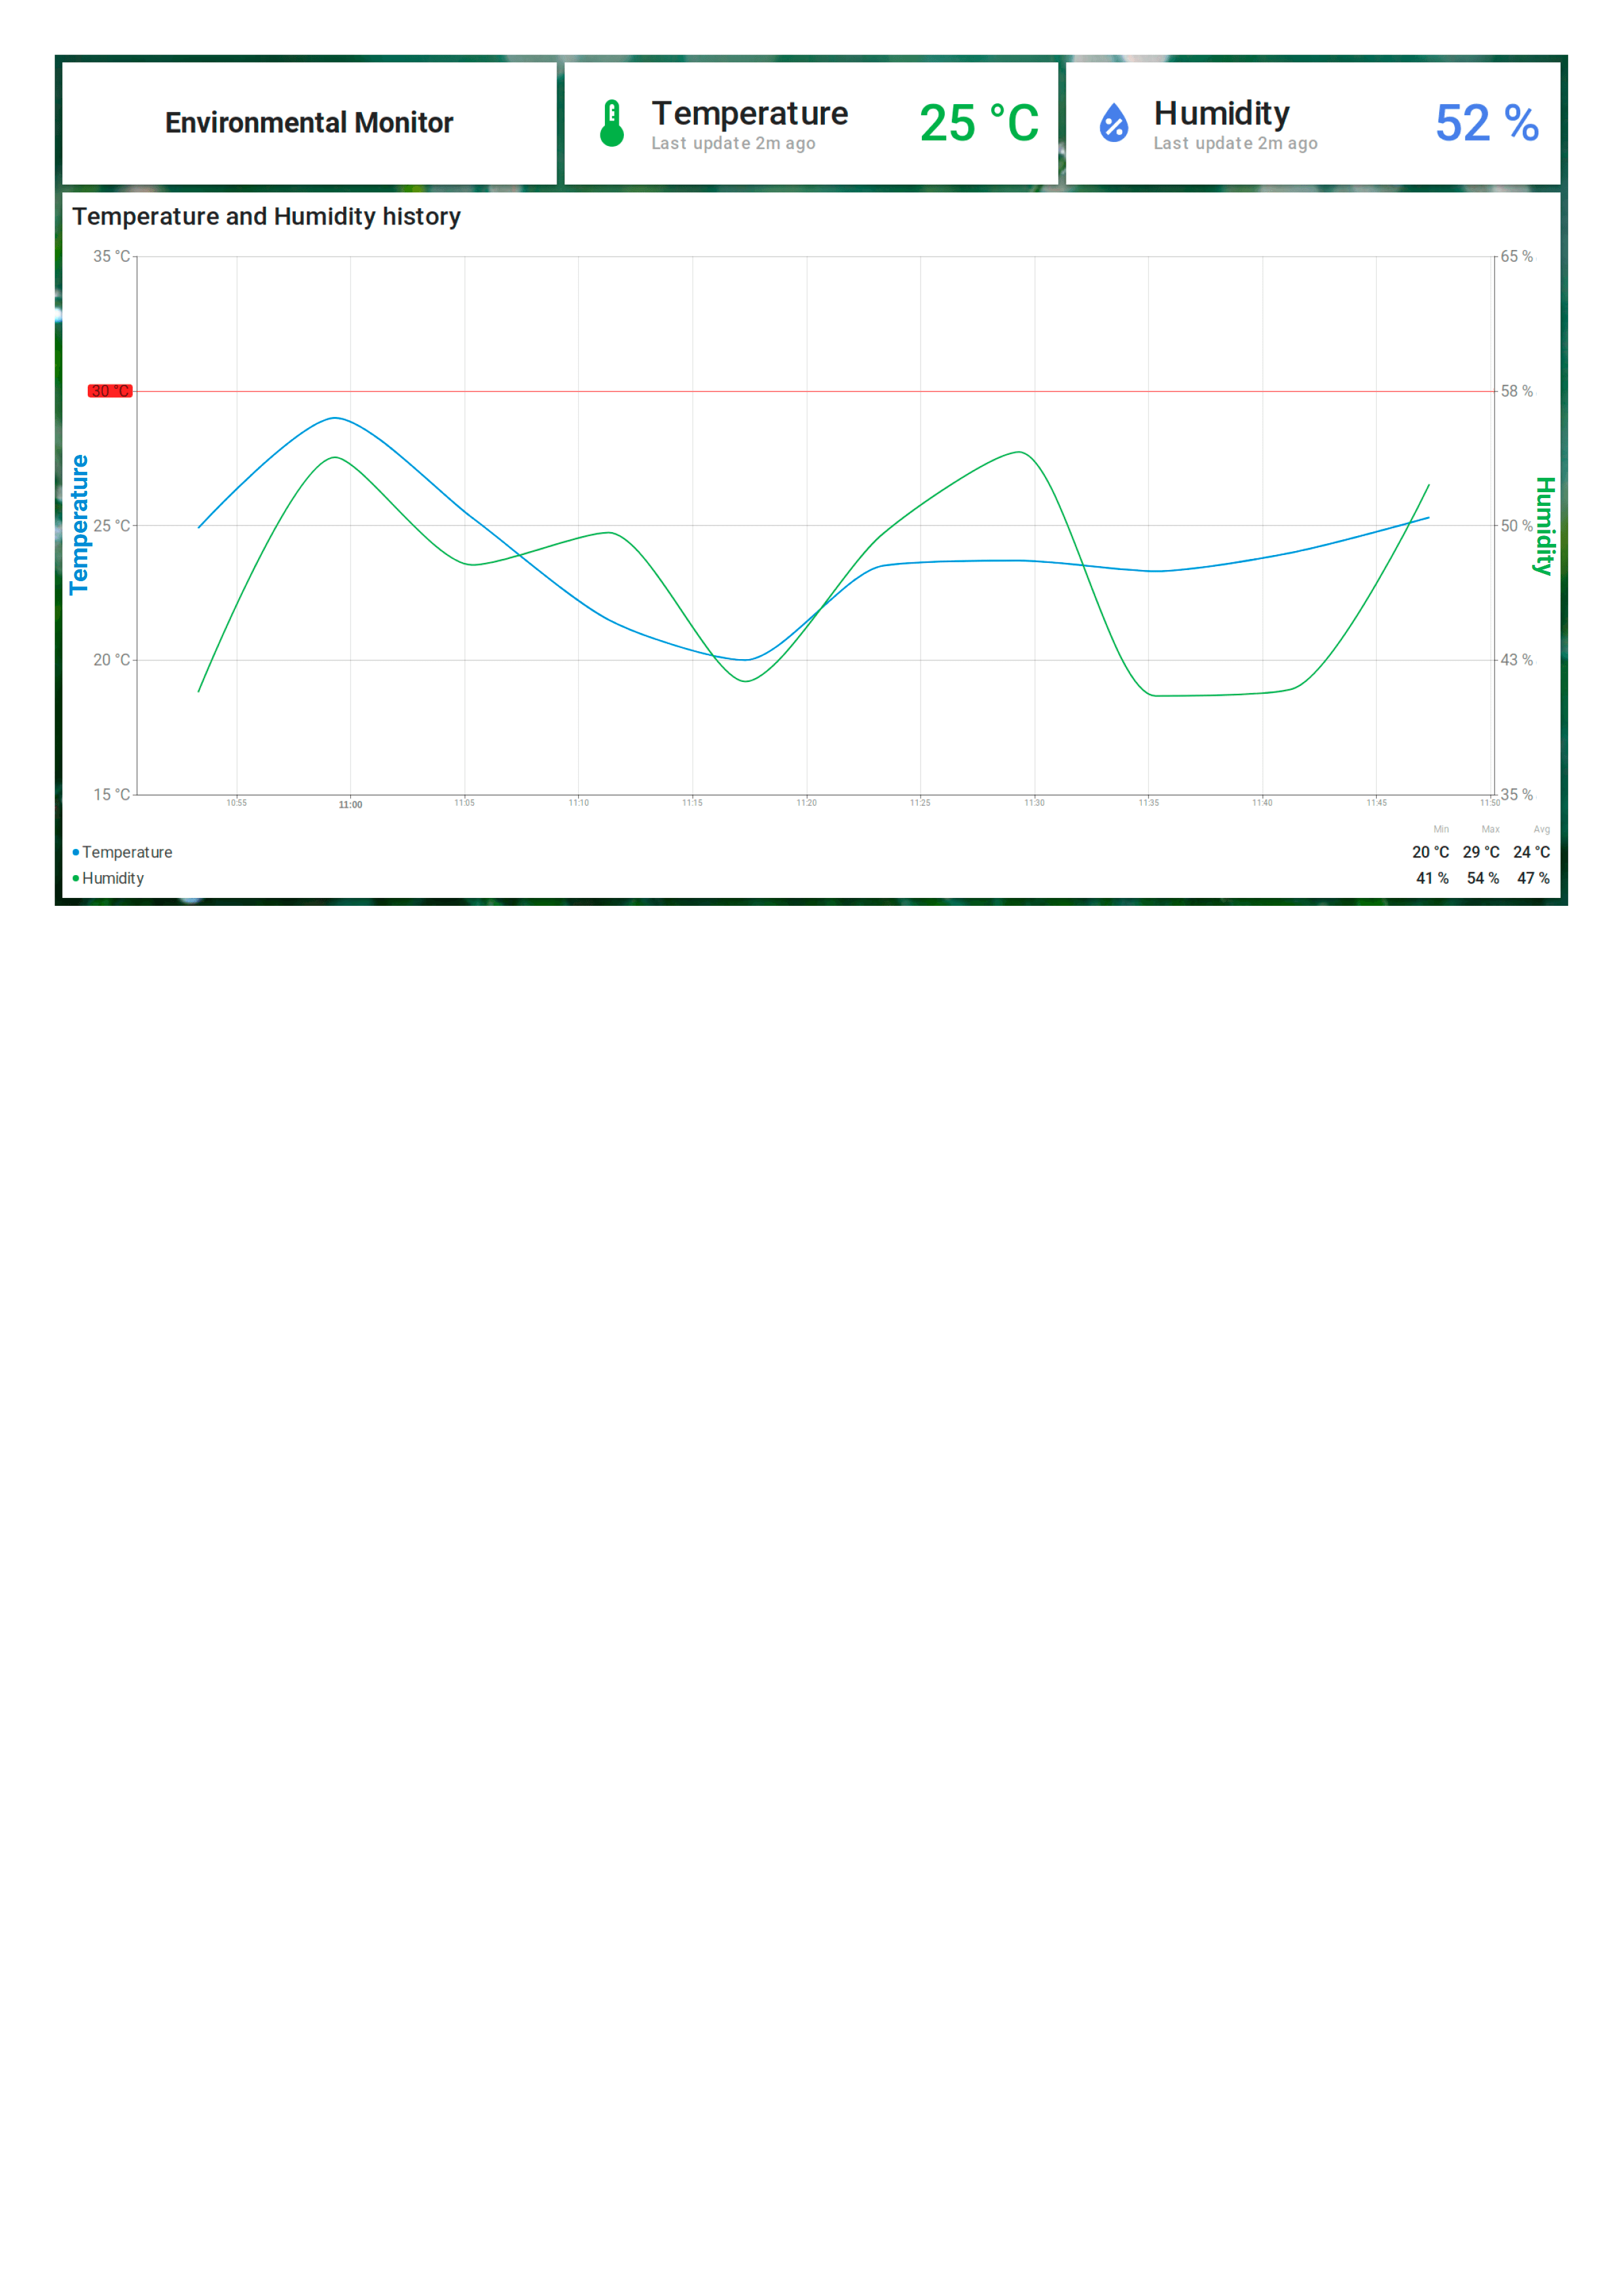
✅ Result
Your report will now include a snapshot of the Environmental Monitor dashboard with data from the selected device.
Next steps
-
Installation guides - Learn how to set up ThingsBoard on various available operating systems.
-
Connect your device - Learn how to connect devices based on your connectivity technology or solution.
-
Data visualization - These guides contain instructions on how to configure complex ThingsBoard dashboards.
-
Data processing & actions - Learn how to use ThingsBoard Rule Engine.
-
IoT Data analytics - Learn how to use rule engine to perform basic analytics tasks.
-
Advanced features - Learn about advanced ThingsBoard features.
Your feedback
Don't hesitate to star ThingsBoard on github to help us spread the word. If you have any questions about this sample, please contact us.