- How to create a report template
- Report builder
- Components & Interaction
- Supported entity aliases
- Variables & dynamic content
- Importing report template
- Scheduler
- Next steps
| Available since TB Version 4.2 |
Only Professional Edition supports Reporting feature.
Use ThingsBoard Cloud or install your own platform instance.
In ThingsBoard, Reporting is a powerful and flexible tool for collecting, structuring, and automatically distributing data in the form of reports.
Reporting in ThingsBoard is built on two key components:
- Configured report template – defines the structure, content, and format of the report. A template can be in PDF or CSV format and may include any supported components, such as tables, charts, text blocks, images, and more.
- Scheduler event – automatically triggers report generation at the specified time and sends it to selected recipients via available delivery channels (such as email, Slack, and other integrations).
Key features:
- Automated scheduling – preconfigured scheduler events can send reports on a set schedule without any user action.
- Reusable templates – a single template can be used for different recipients by applying filters and parameters.
- Event-based delivery – send reports when specific events occur (e.g., an active alarm on a device).
- Rich content support – include text blocks, tables, charts, images, and more.
- Notification integration – attach a generated report to system notifications (Email, Slack).
Where it's useful:
- Regular monitoring of your device's metrics.
- Sharing summary data with partners or management.
- Archiving data in an easy-to-read format.
- Automating communication during incidents.
Key concepts
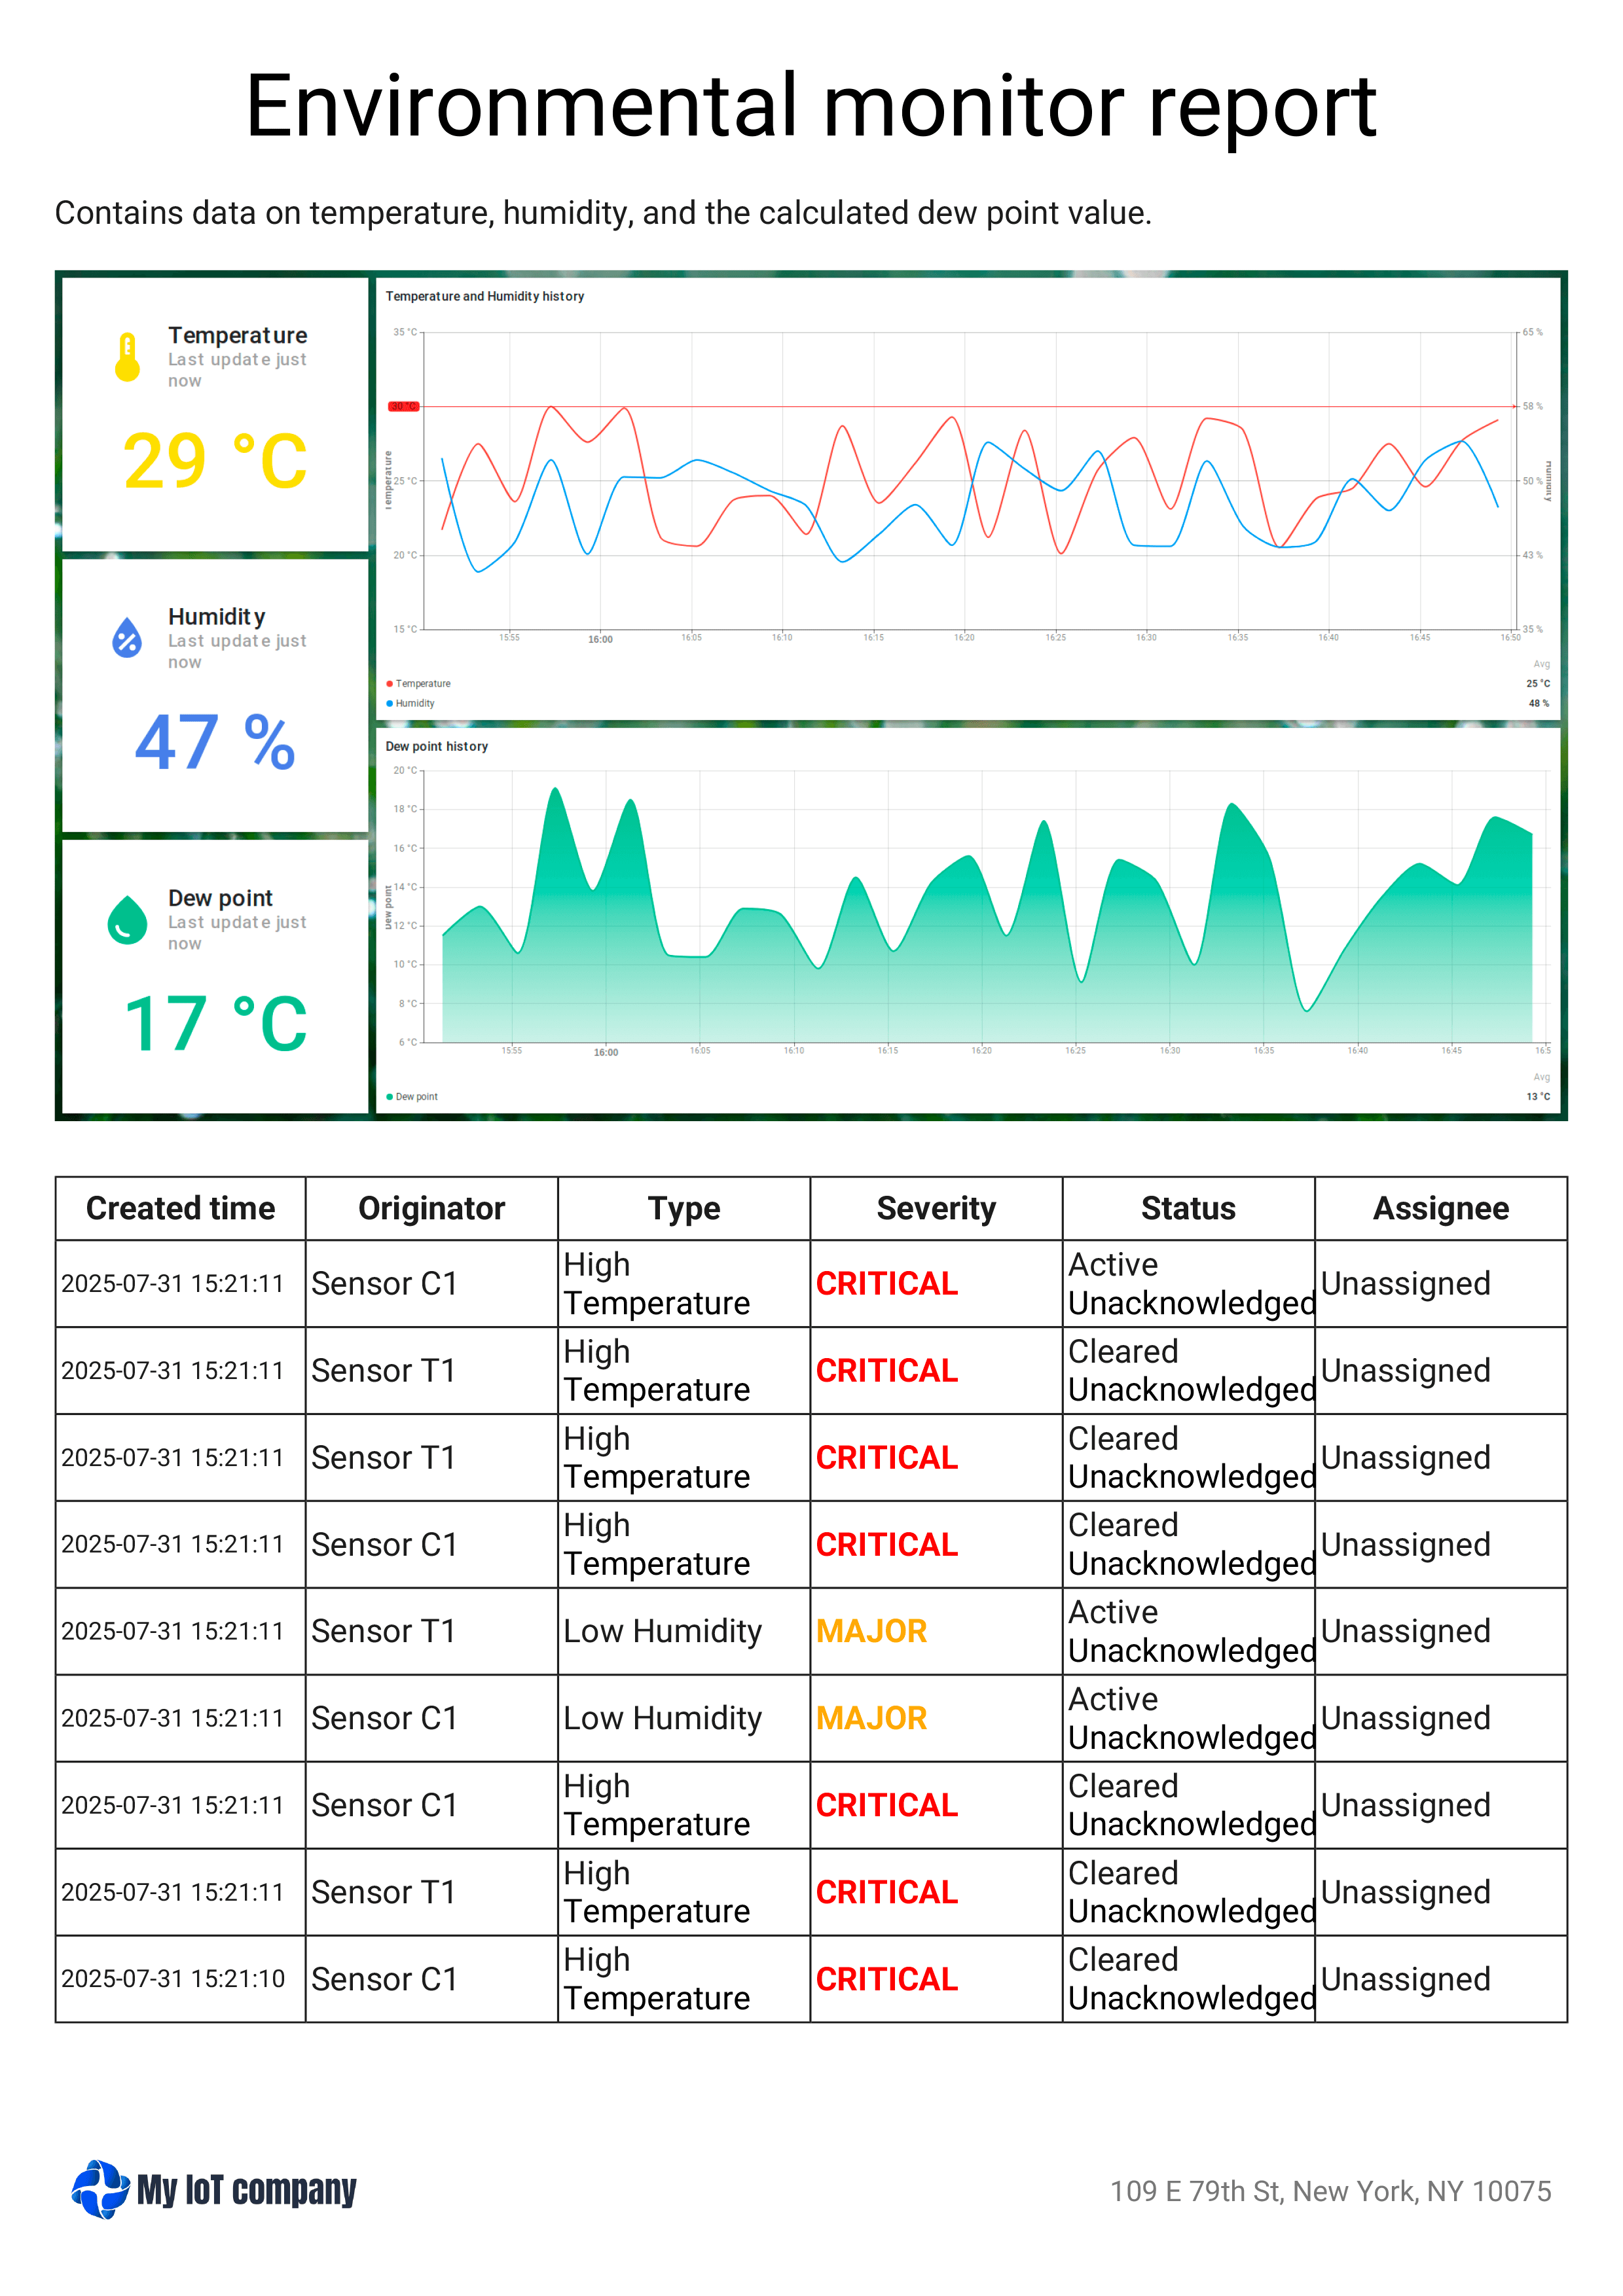
Report template
A report template in ThingsBoard defines the structure, layout, and content of a report that will be generated by the system using the scheduler. It serves as the foundation for creating visually rich and functional reports in one of two formats:
- PDF – visually styled reports that may include charts, tables, images, and company branding.
- CSV – data-oriented tabular reports that are easy to analyze in Excel or BI tools.
Example:
Report template and the report generated from it
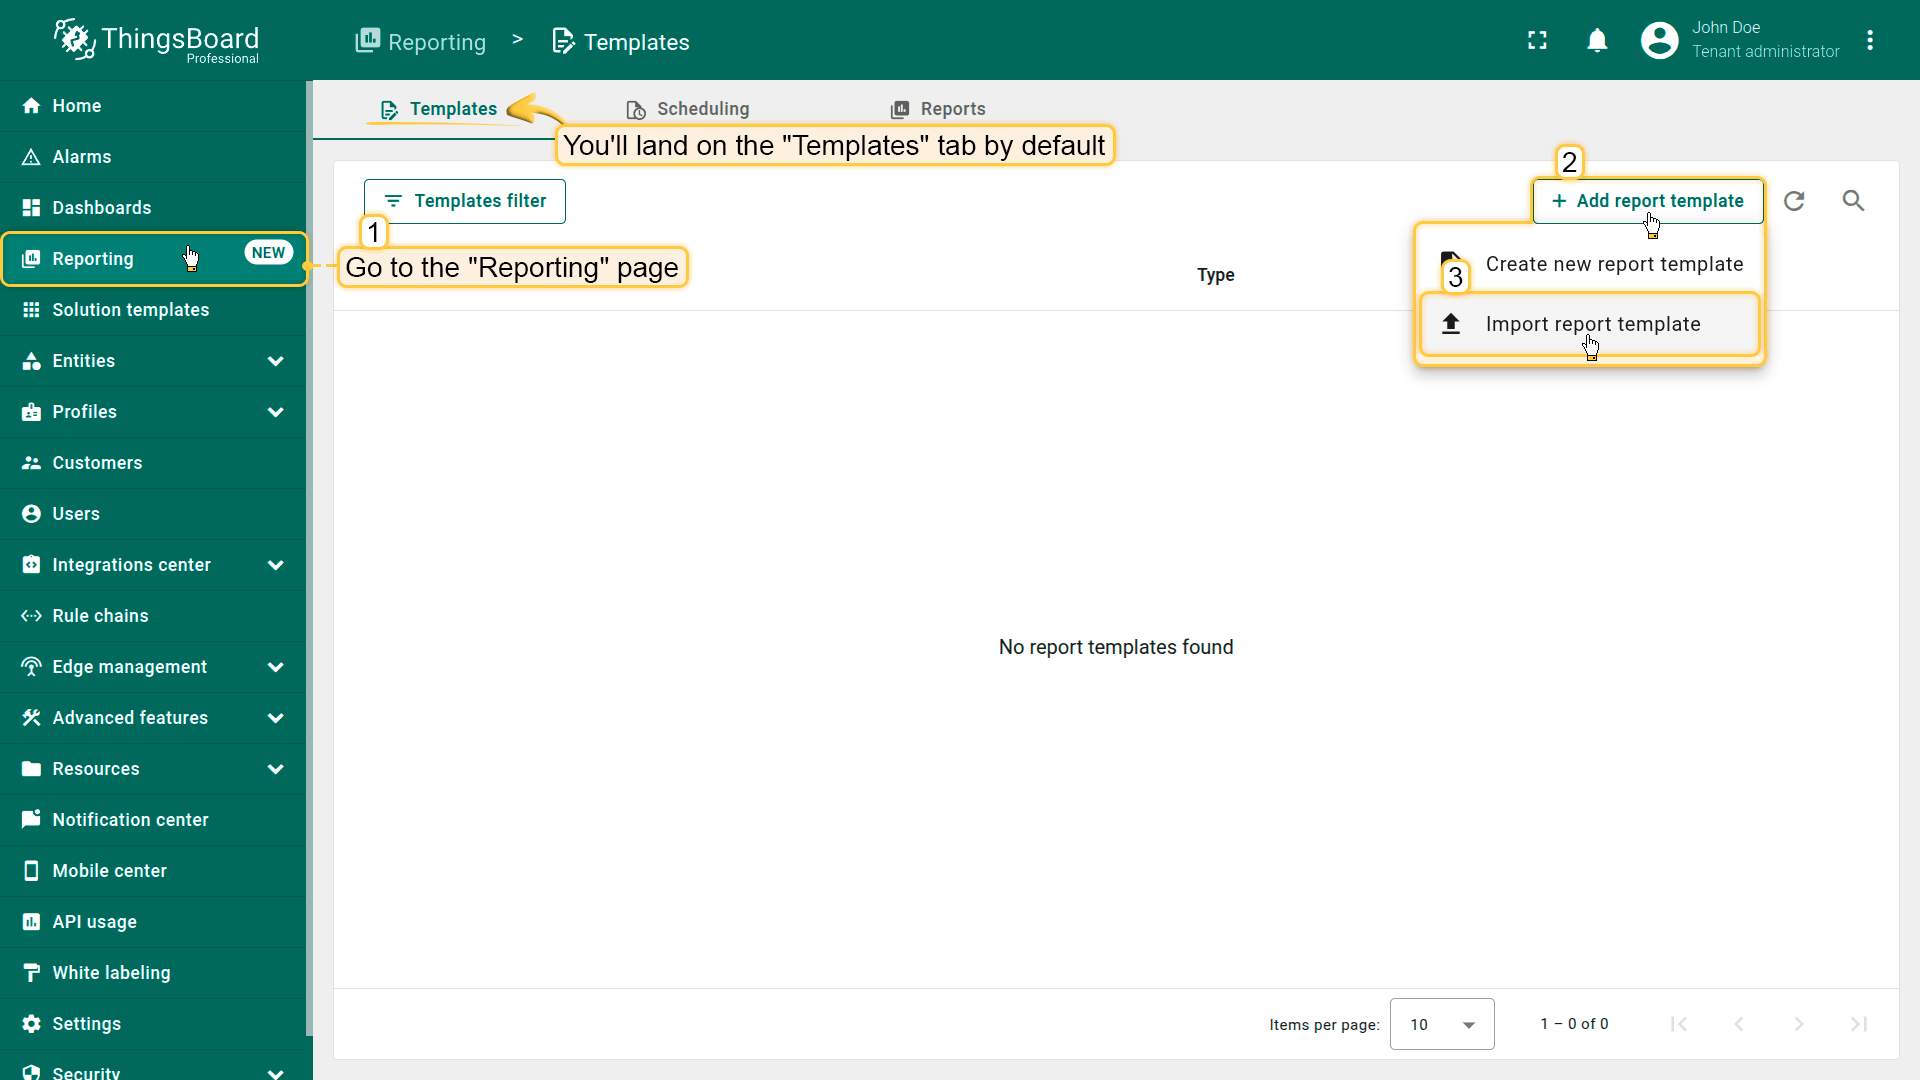
How to create a report template
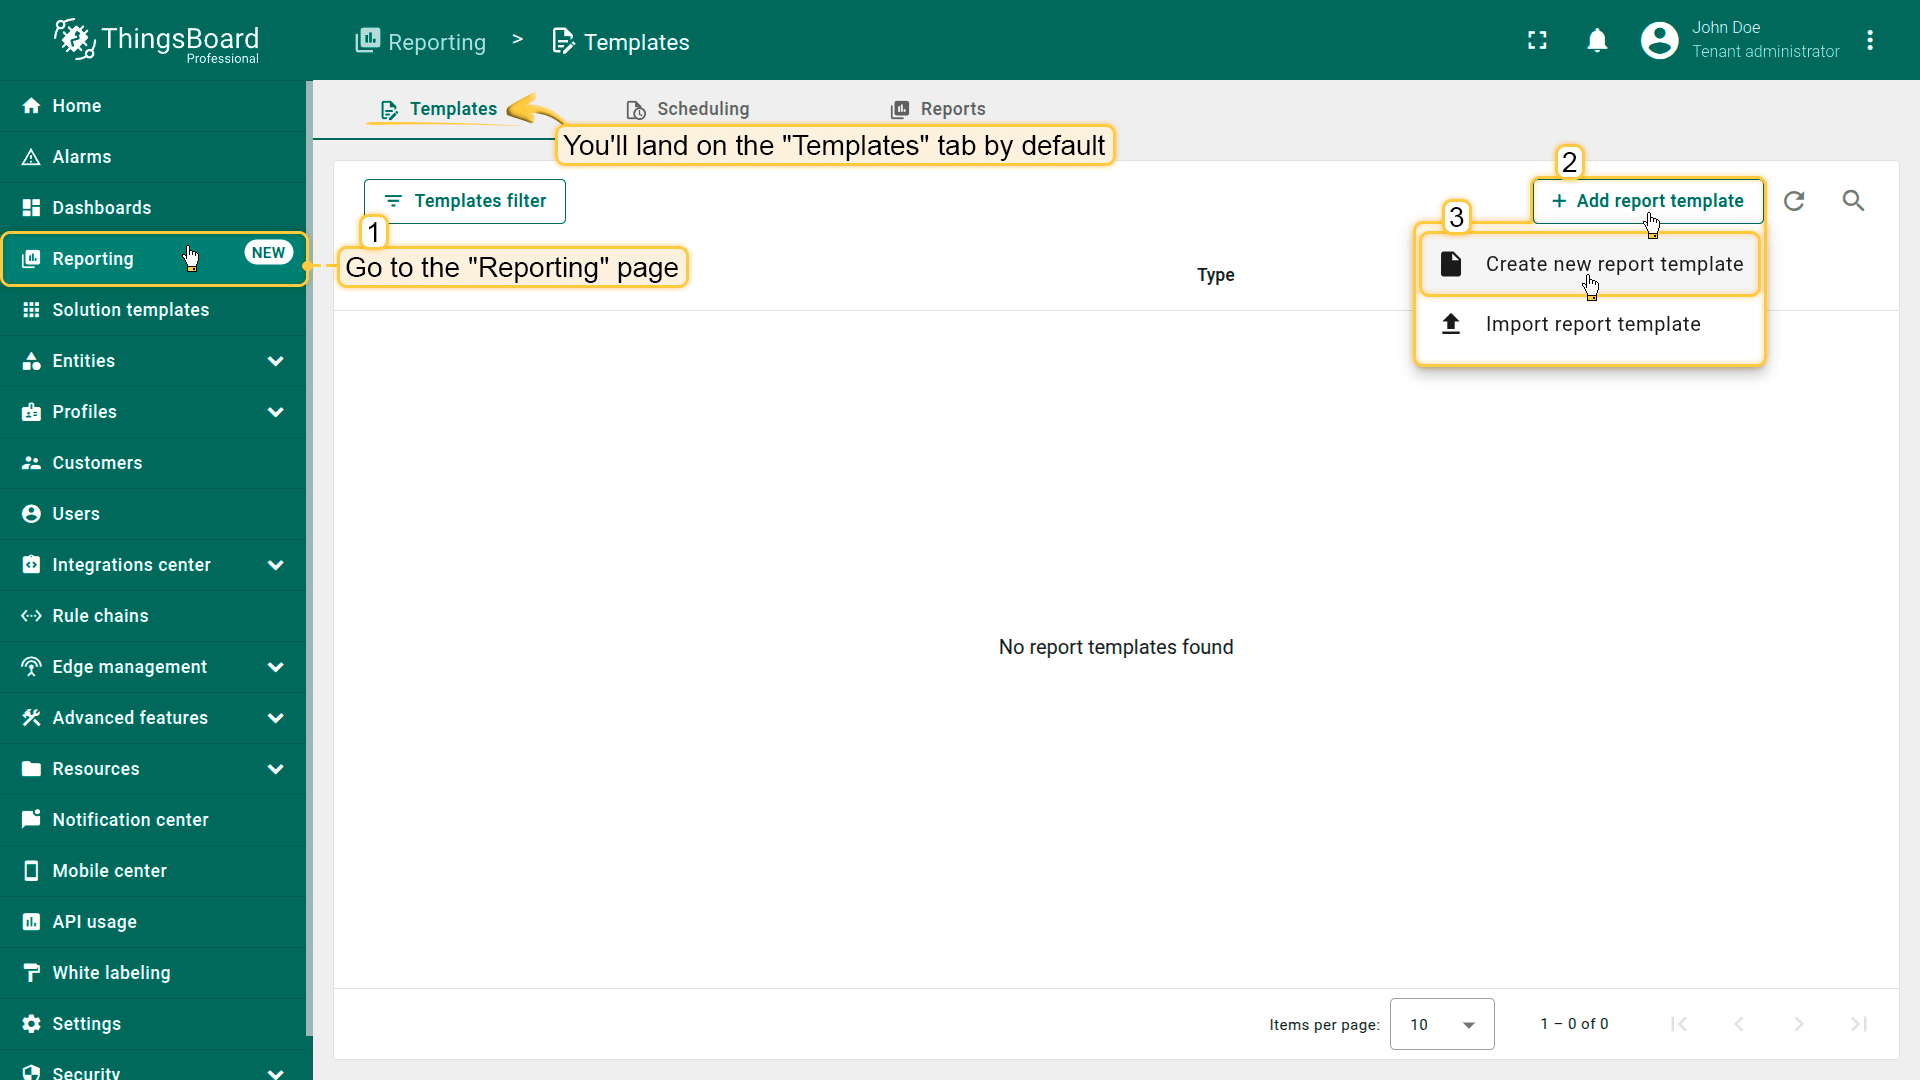
- Open the “Reporting” page from the left-hand sidebar. You'll automatically be taken to the “Templates” tab.
- Click the “+ Add report template” button in the top-right corner.
- Choose “Create new report template”.
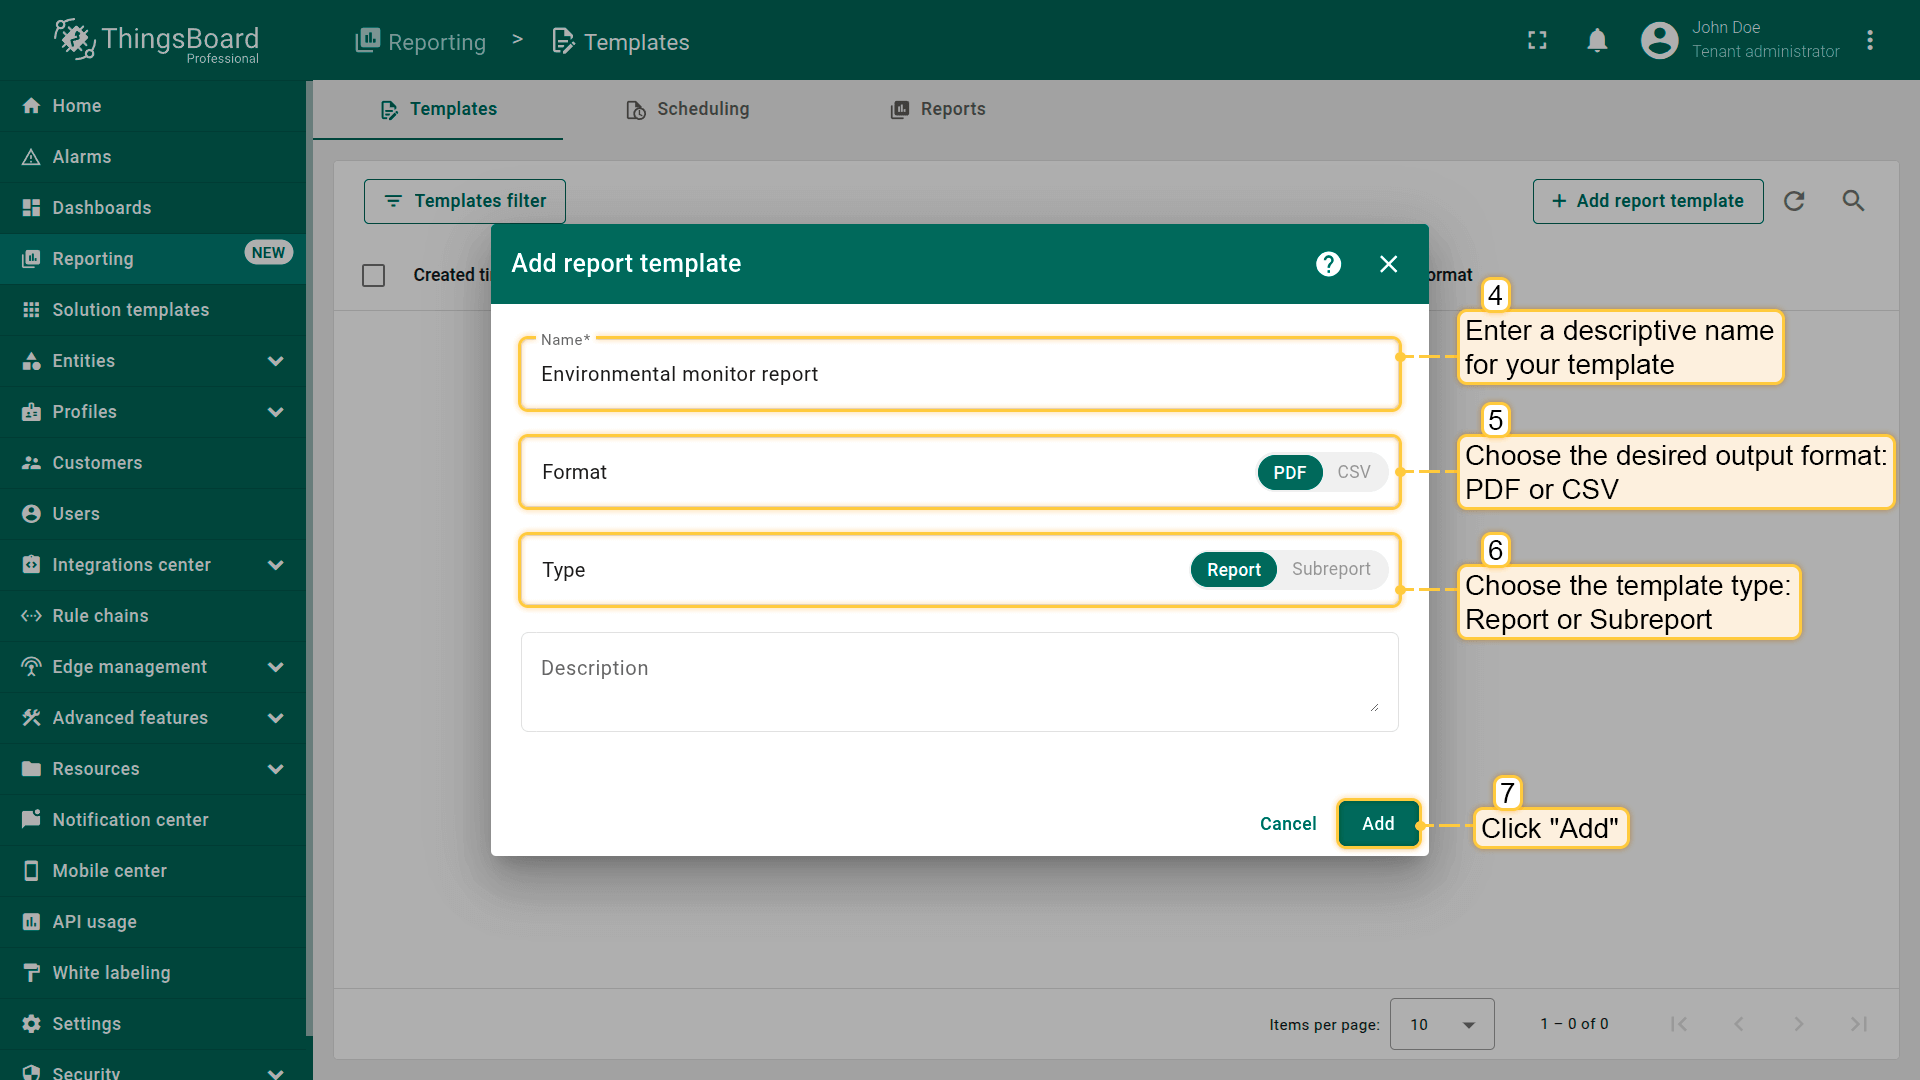
- In the popup, fill out the following:
- Name – a descriptive name for the report template.
- Format: Choose PDF or CSV report format.
- Type:
- Report - a complete standalone report template.
- Subreport - a modular component that can be embedded inside another report.
- Click “Add” to create the report template and open the Report Builder interface, where you can design the structure, layout, and content of your report.
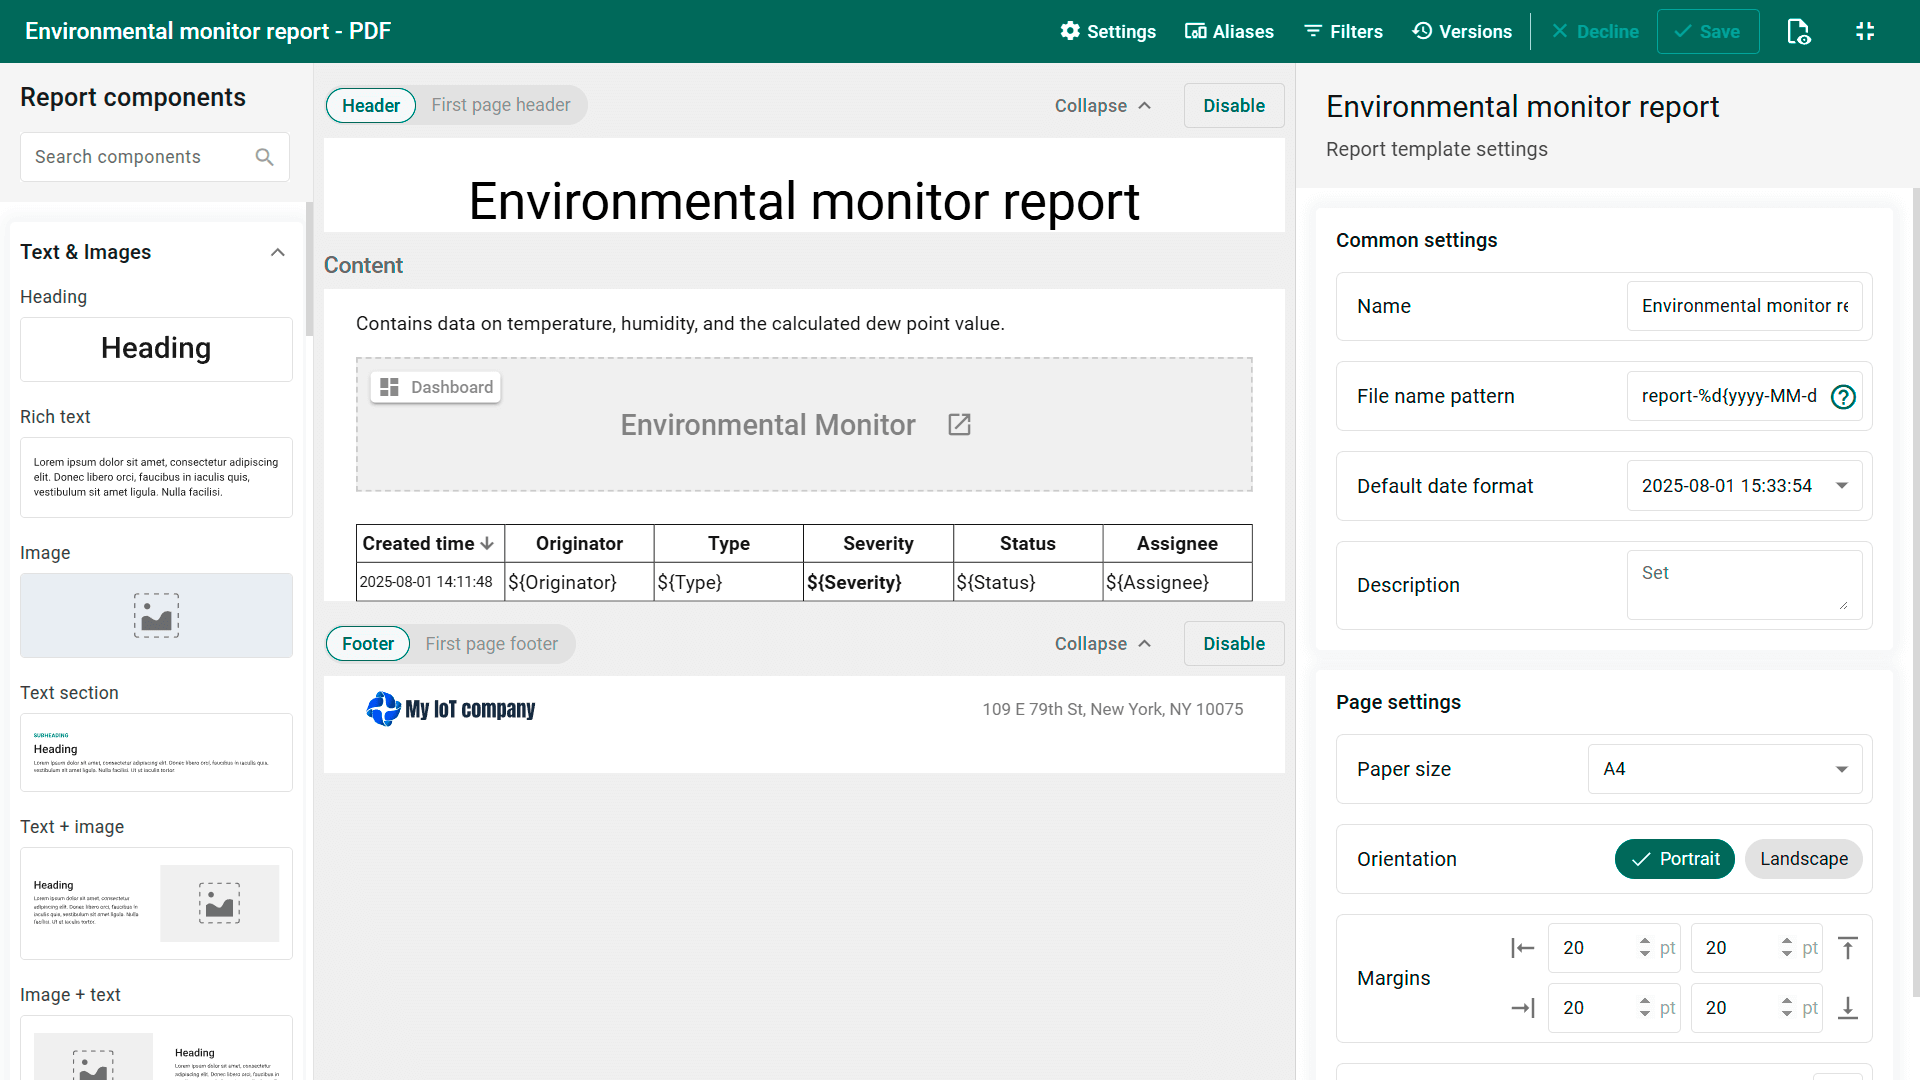
Report builder
The Report Builder is a drag-and-drop editor that lets you design your report template using visual and data components. You have full control over both the appearance and structure of the report.
Here's what the Report Builder looks like:
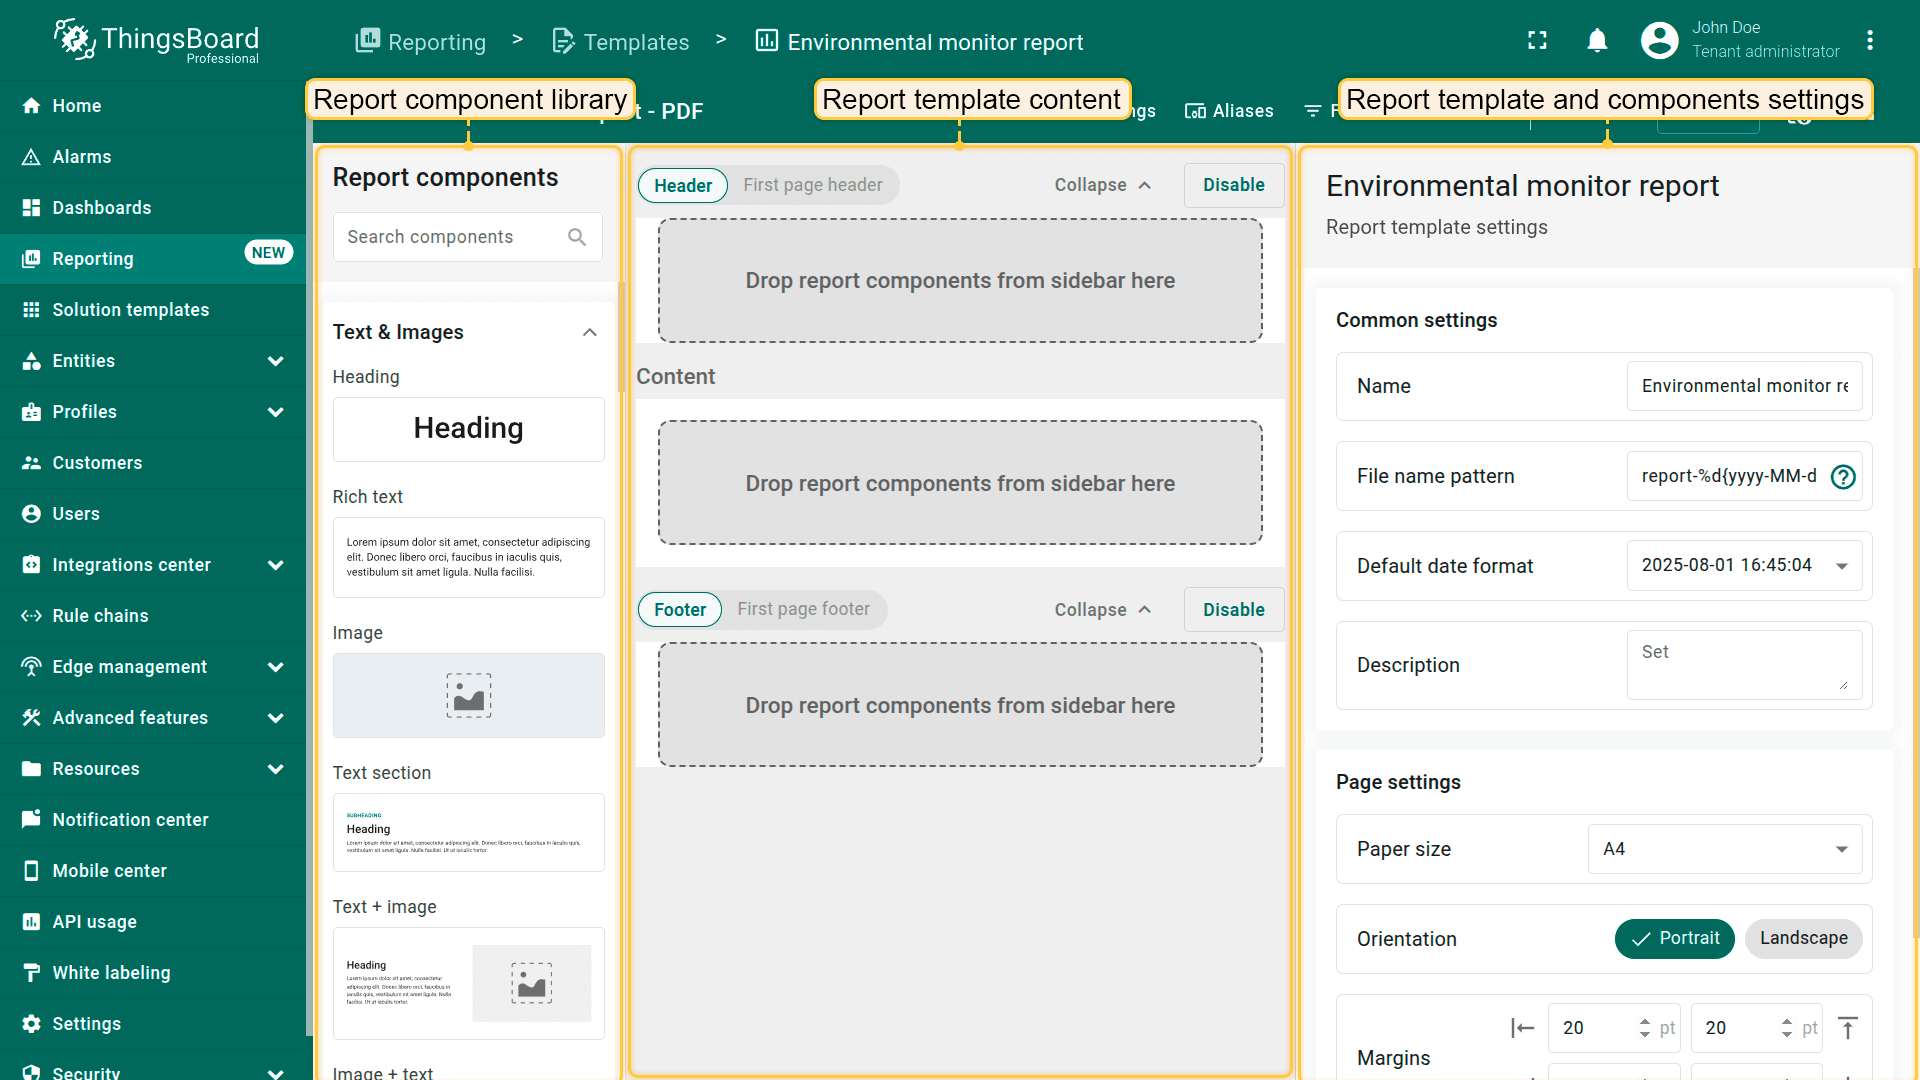
Components & Interaction
Templates are made up of customizable components, each serving as a visual or functional block. These components determine what will appear in your final report and how it will be presented.
Main component types:
- Text & Images. - to add text blocks, headings, and images to your report. Text blocks supports plain or rich text and can include dynamic placeholders for timestamps, entity names, user details, and more.
- Tables - to display structured data (such as alarms, entities, and their telemetry) in table format. Each table's style can be customized via the layout configuration tab — adjust column widths, font sizes, borders, and pagination.
- Subreport is a modular report template that is embedded into a main report, inherits its context, and generates its own content accordingly.
- Dashboard - embeds a screenshot of the specified dashboard into the report as an image.
- Charts - to visualize time series data with configurable line and bar charts, or to present the latest values using different types of pie and doughnut charts.
- Branding - for adding logos, headers, and footers to customize the look and feel of reports.
- Reporting Info & Layout - supporting components (split view, page number, created time, divider, page break) to structure the report and display system metadata.
Component configuration
Each component has two main configuration sections:
- Data configuration — defines which data the component will display and how it will be filtered. Supports entity aliases and filters for dynamic data binding.
- Layout configuration — controls the visual style and formatting in the final document.
Supported entity aliases
Report templates fully support the same entity alias model as dashboards in ThingsBoard. Additionally, several new entity filters have been introduced:
- Originator entity - the entity that either originated the message sent to the “Generate Report” rule node or triggered the creation of a notification.
- Owner of originator entity - the owner of the entity that originated the message sent to the “Generate Report” rule node, or the owner of the entity that triggered the creation of a notification.
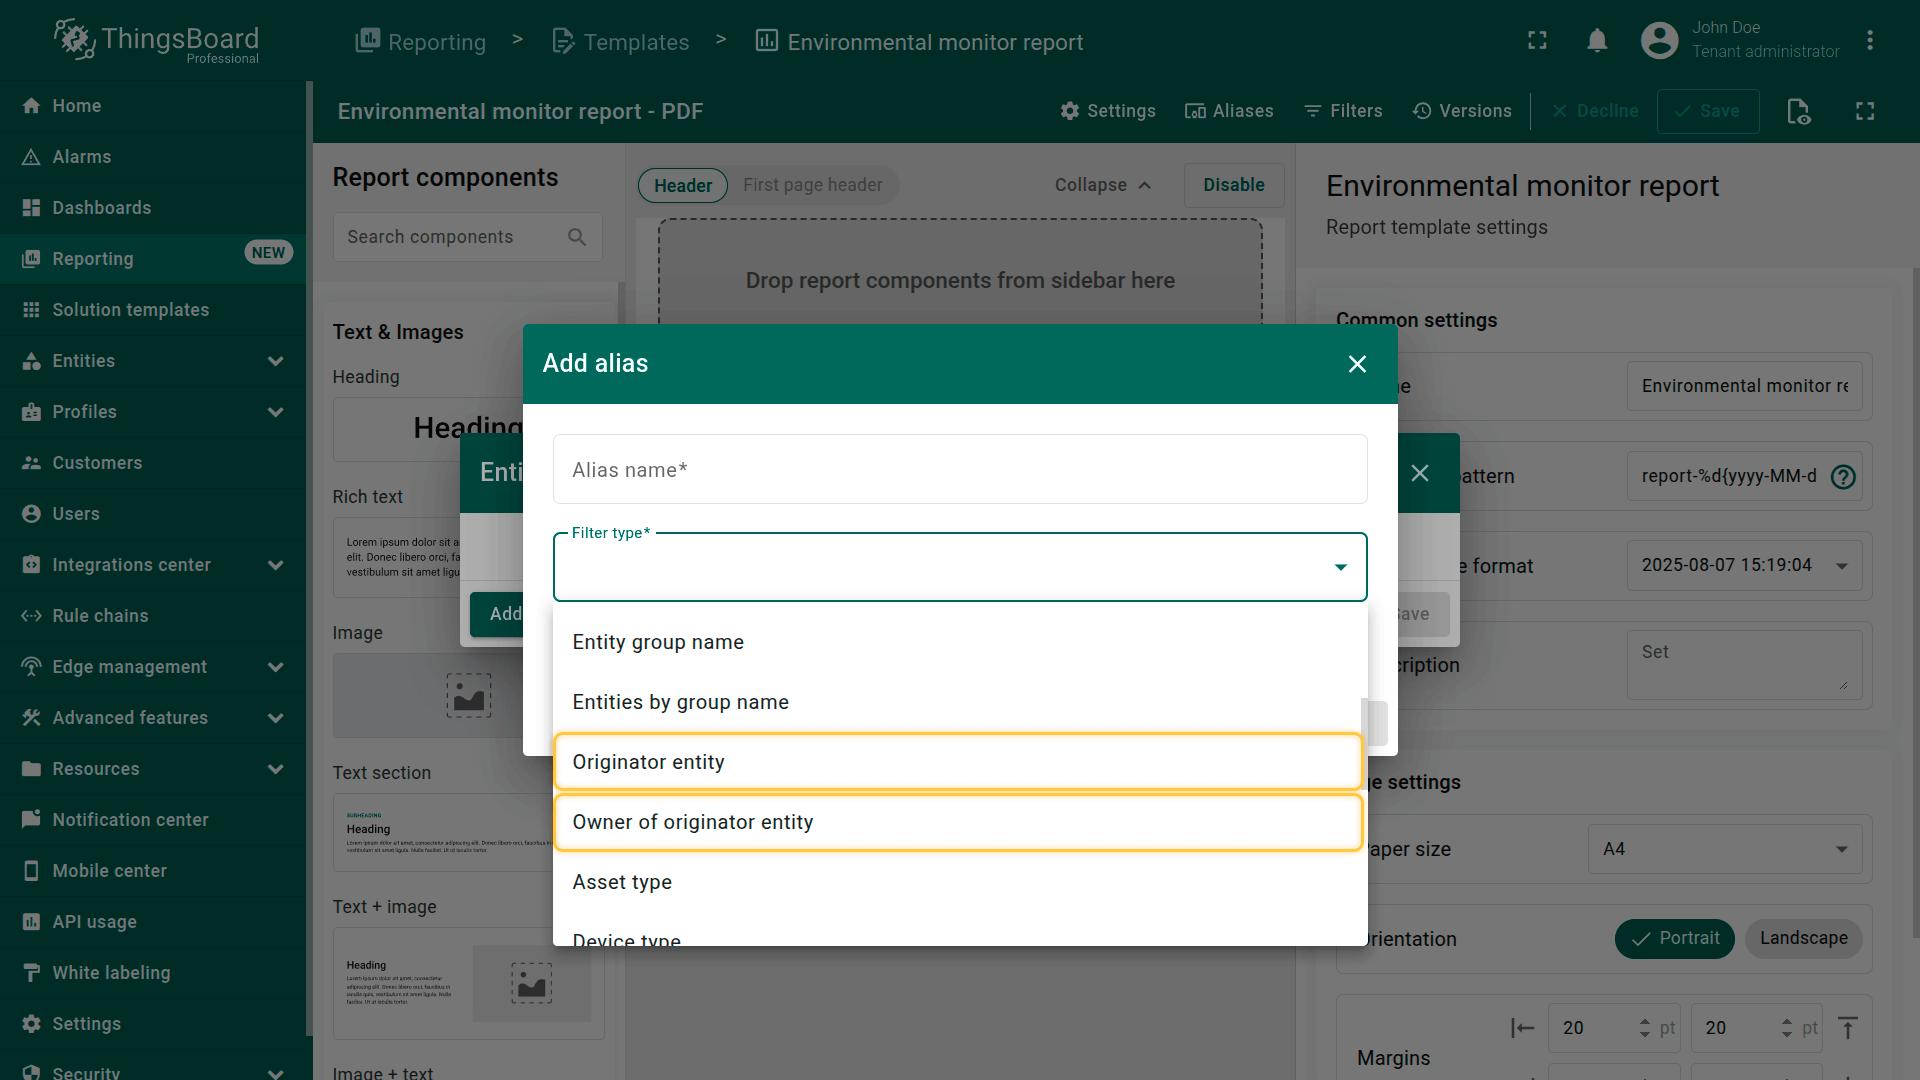
- Owner of originator entity — the owner of the entity that originated the message sent to the "Generate Report" rule node, or the owner of the entity that triggered the creation of a notification.
Variables & dynamic content
In ThingsBoard, report components provide data as variables that can be directly referenced inside component elements. You can insert these variables anywhere text is allowed — for example, in a text block, table header, chart label, or other dynamic fields. This enables you to create highly personalized, context-aware reports.
System variables:
System variables are available in any report or subreport, regardless of the connected data source.
Examples:
- ${pageNumber} — displays the current page number in the report.
- ${totalPages} — shows the total number of pages in the report.
- ${reportCreatedTime} — stores the date and time when the report was created, in the format yyyy-MM-dd HH:mm:ss.
- ${entityName} - the technical or system name of the entity used in the report.
- ${entityLabel} - A human-readable name of the entity.
- ${rowCount} - displays the number of records (rows) contained in the table (applies to table components only).
Data source variables:
Data source variables are generated based on the specified data keys (attributes or telemetry) from the datasource connected to the component (device, asset, etc.).
Each selected key automatically becomes available as a variable that can be inserted into any text field within the report.
Examples:
- ${status} — value of the attribute or telemetry with the key status.
- ${temperature} — value of the telemetry with the key temperature.
- ${voltage} — value of the voltage key.
Note: If the connected datasource does not contain a value for the specified key, the variable in the report will remain empty.
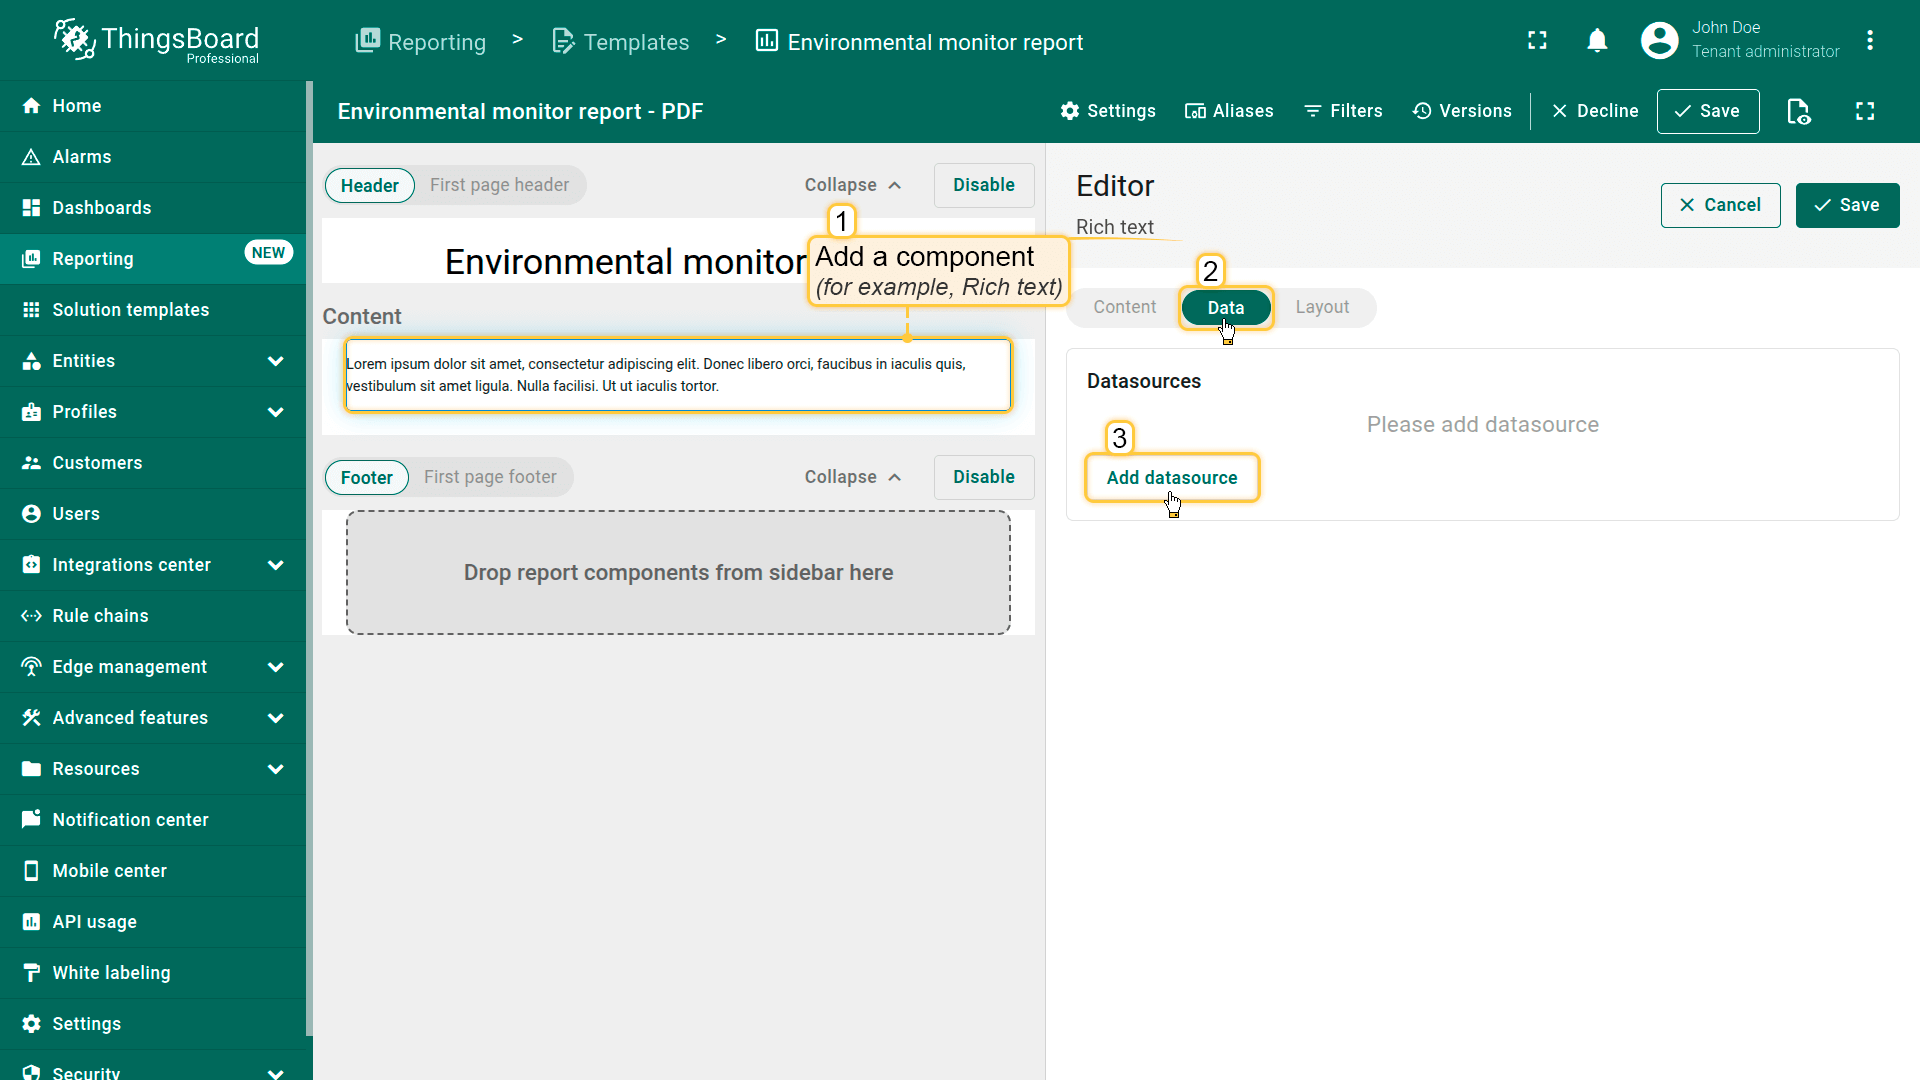
Using variables in the editor:
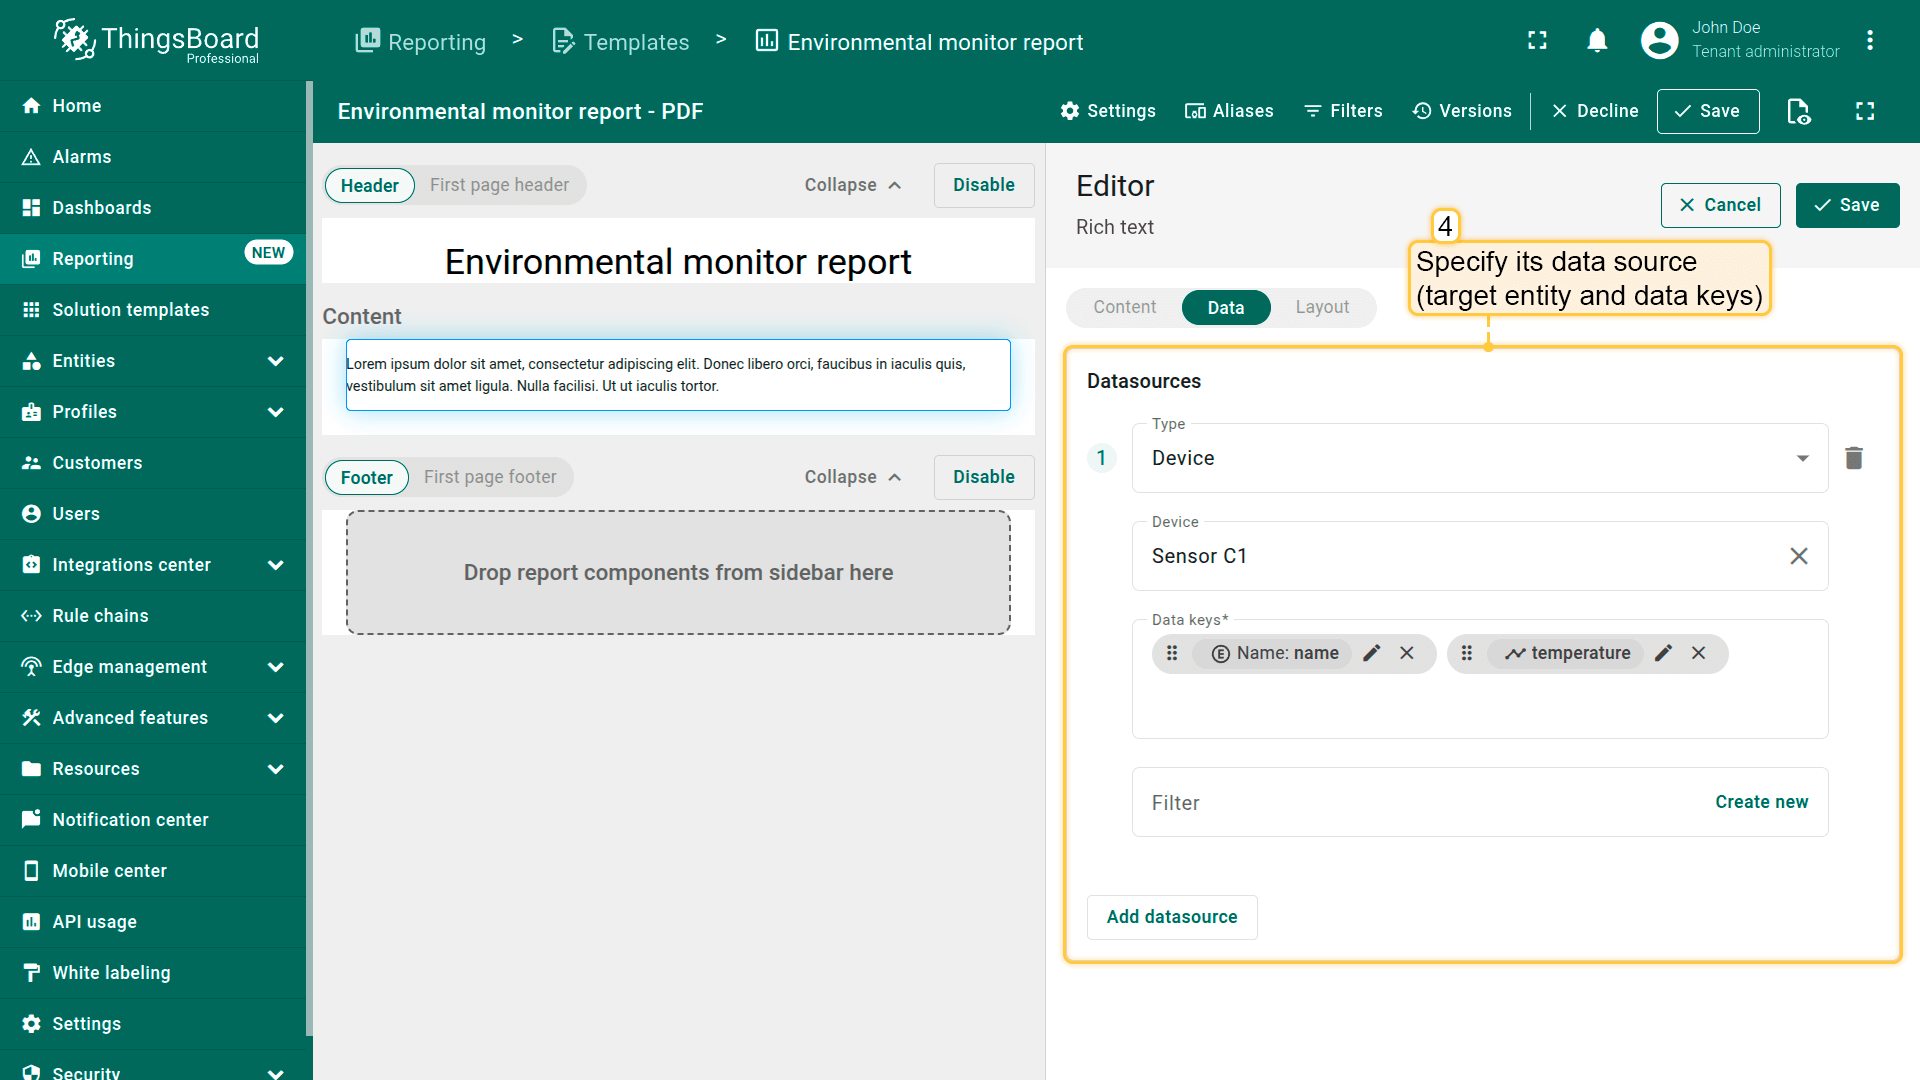
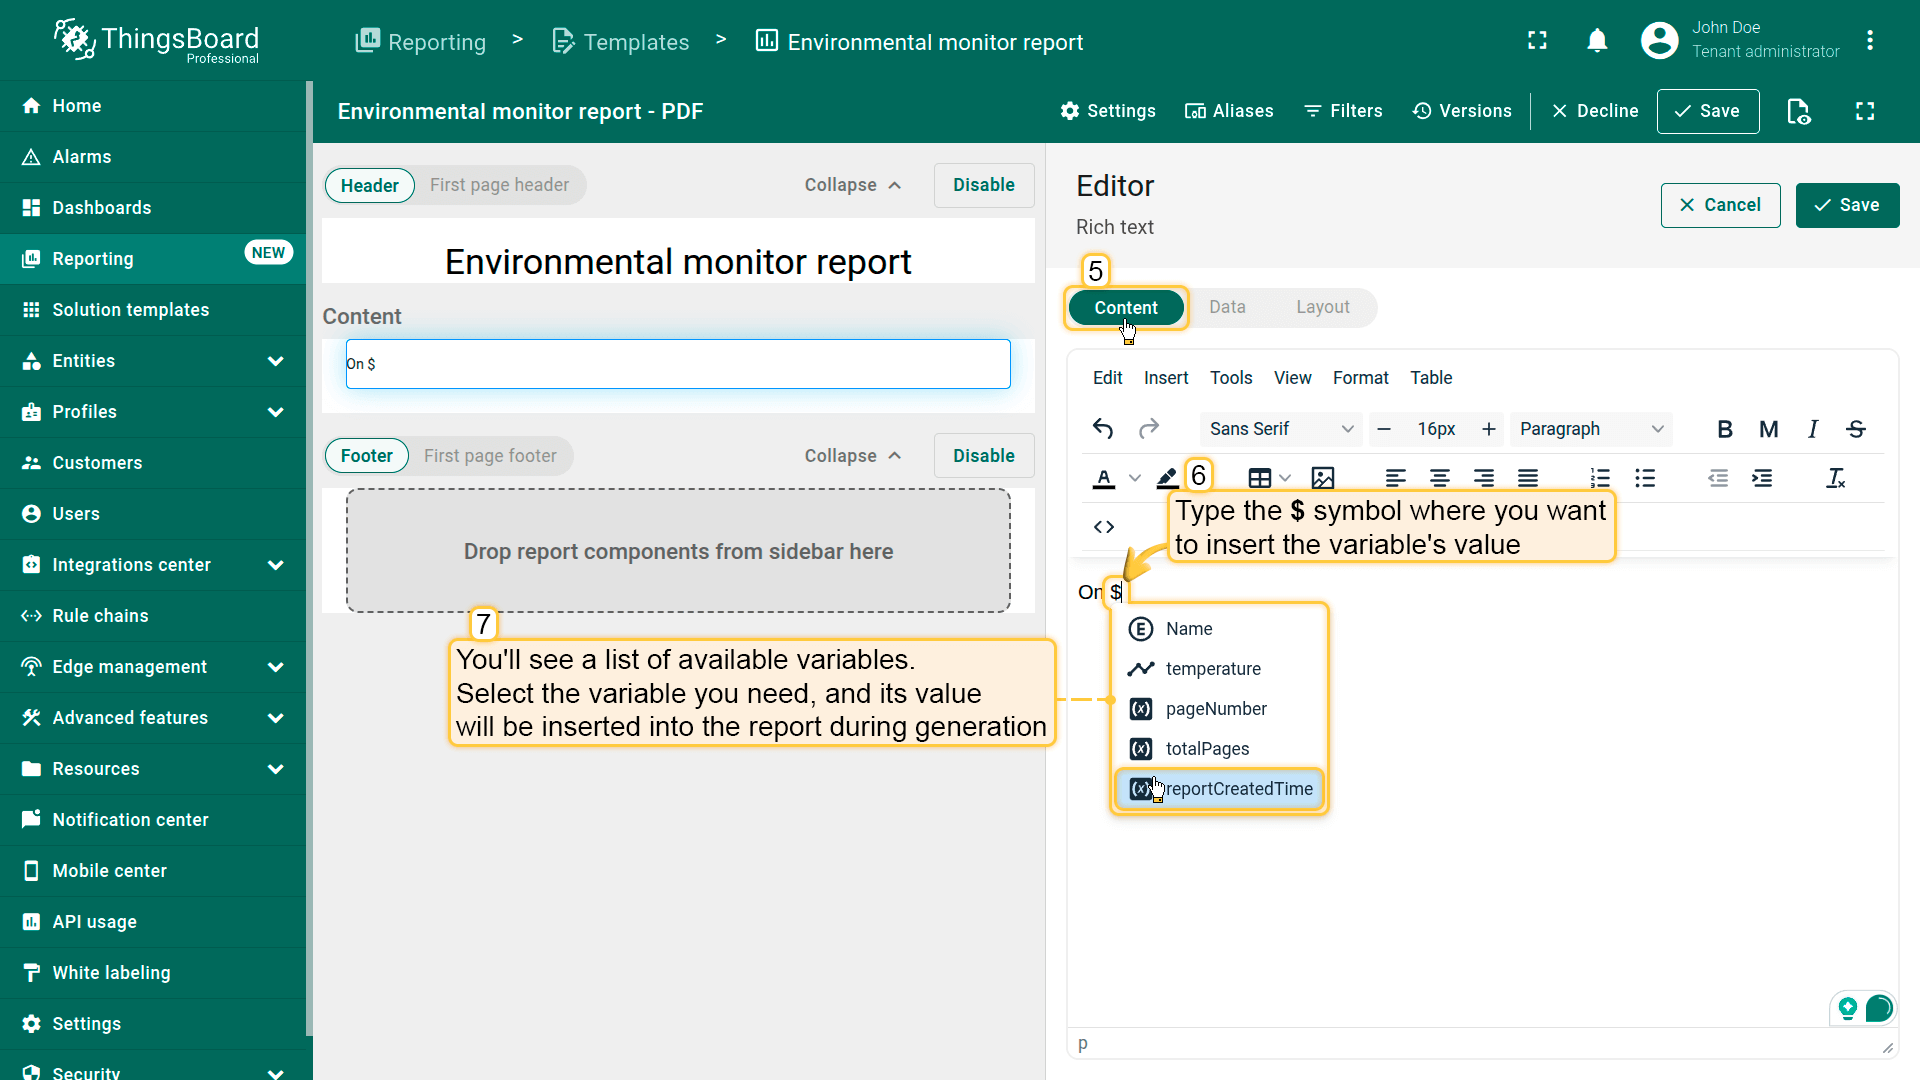
- In the Report Builder, add a component (for example, Rich text) and, in the “Data” tab, specify its data source (target entity and data keys).
- Next, in the component's text field, type the
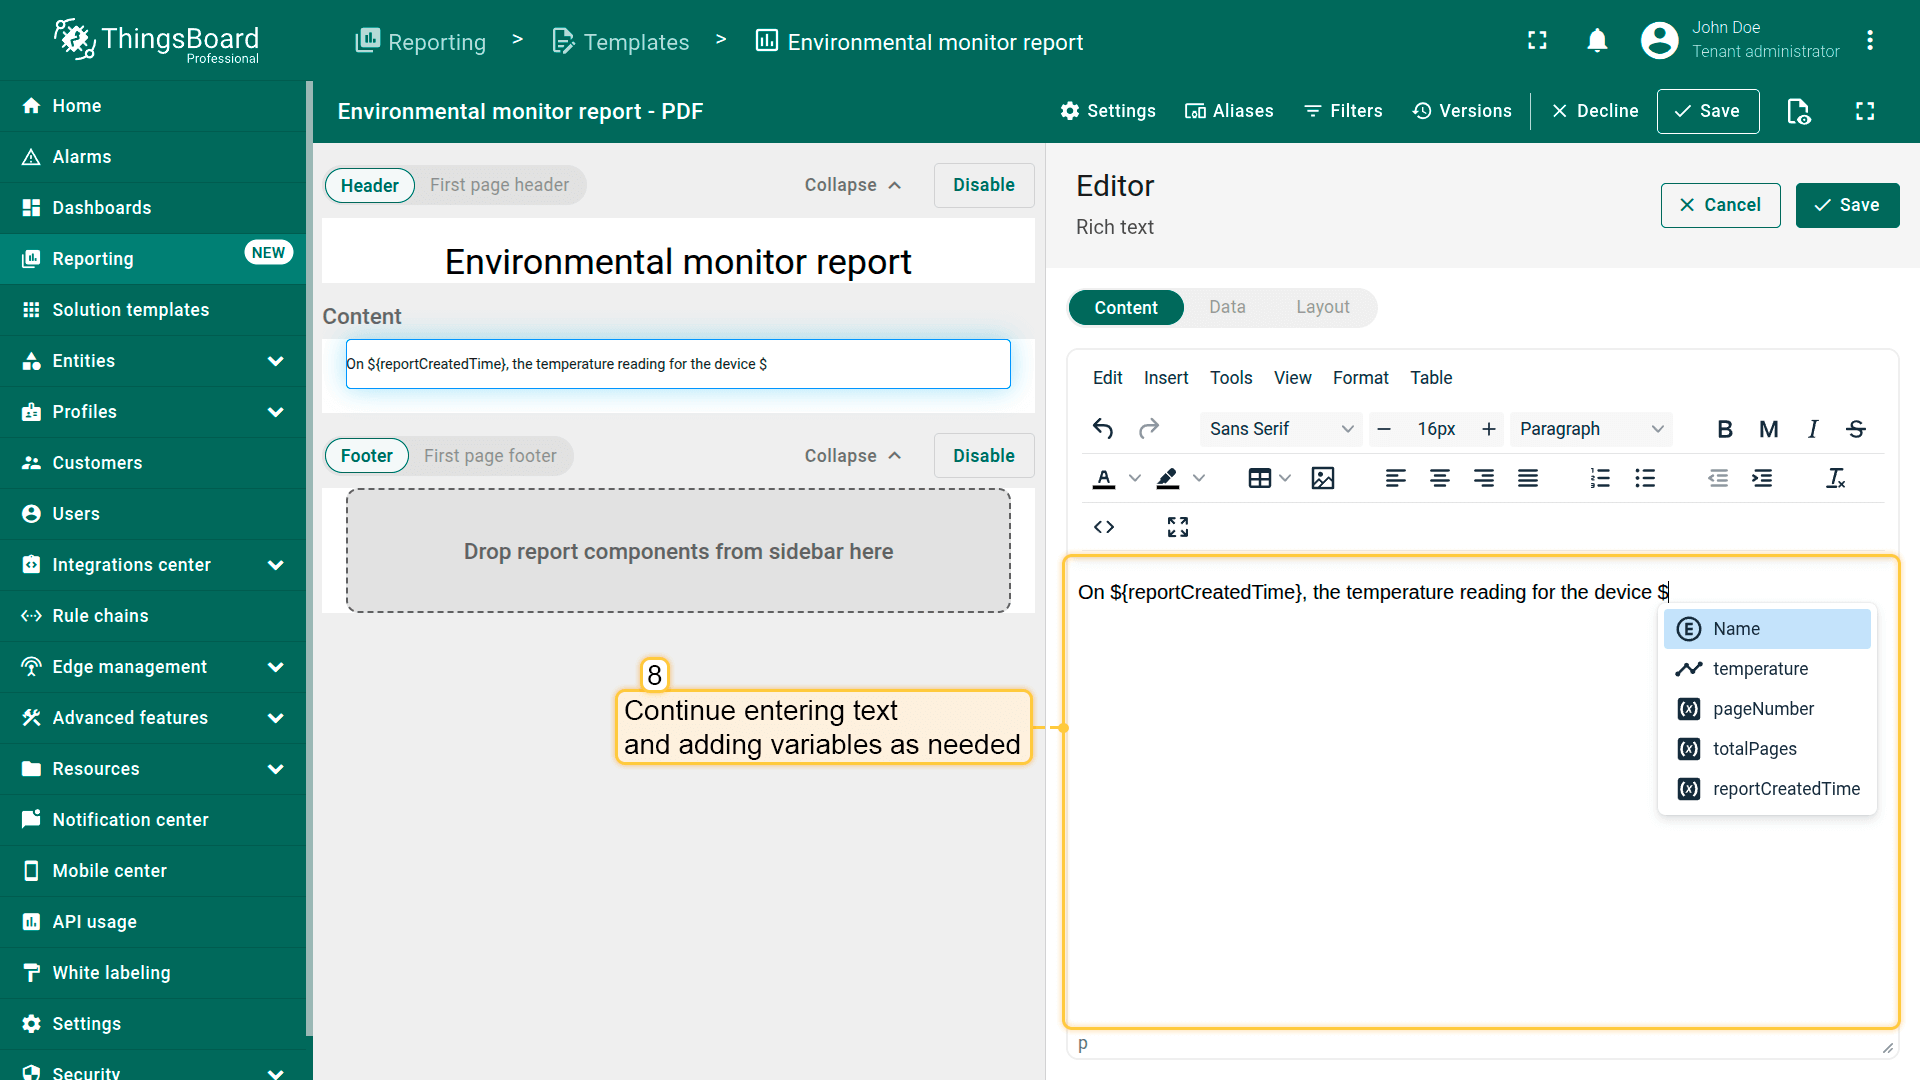
$symbol where you want to insert a variable's value. This will open a list of all available variables in the current context. - Select a variable (for example, ${reportCreatedTime}), and its value will be inserted into the report during generation.
- Continue entering text and adding variables as needed.
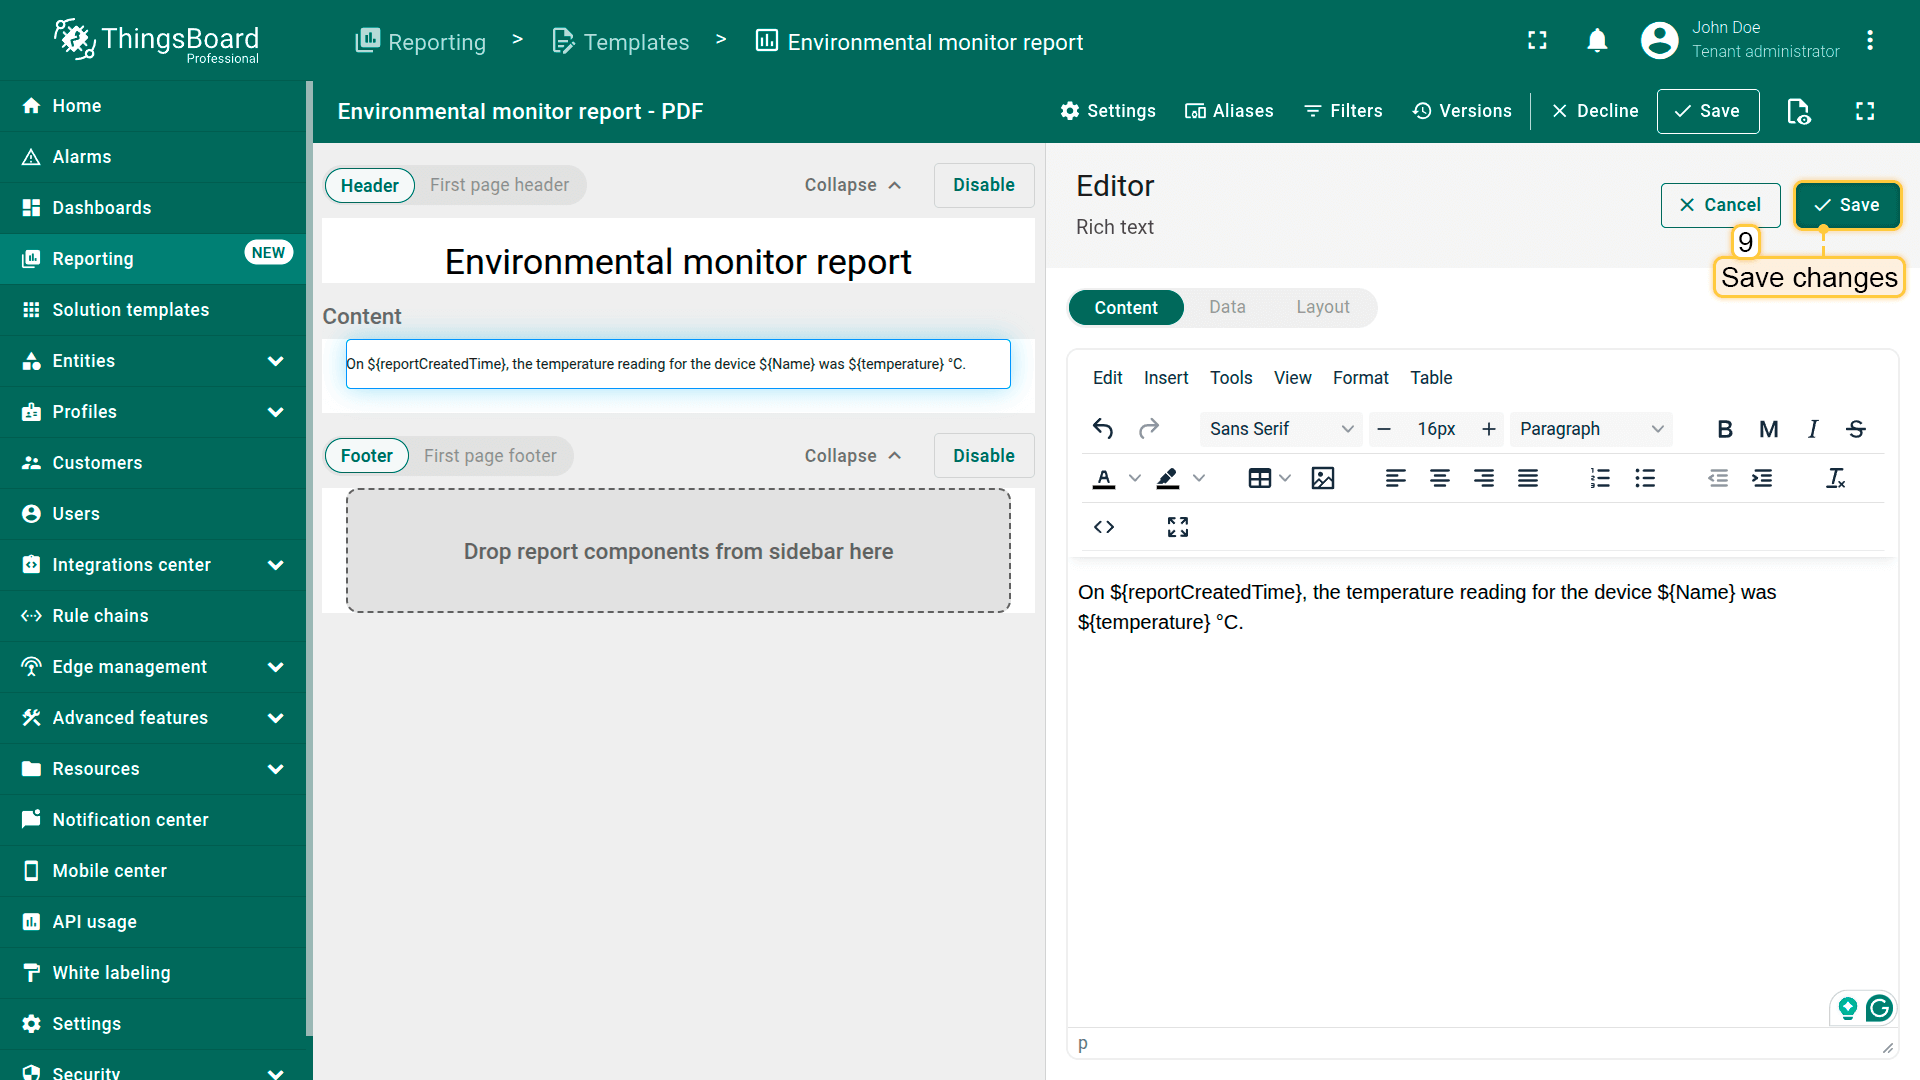
- When finished, click the “Save” button in the top-right corner to apply your changes.
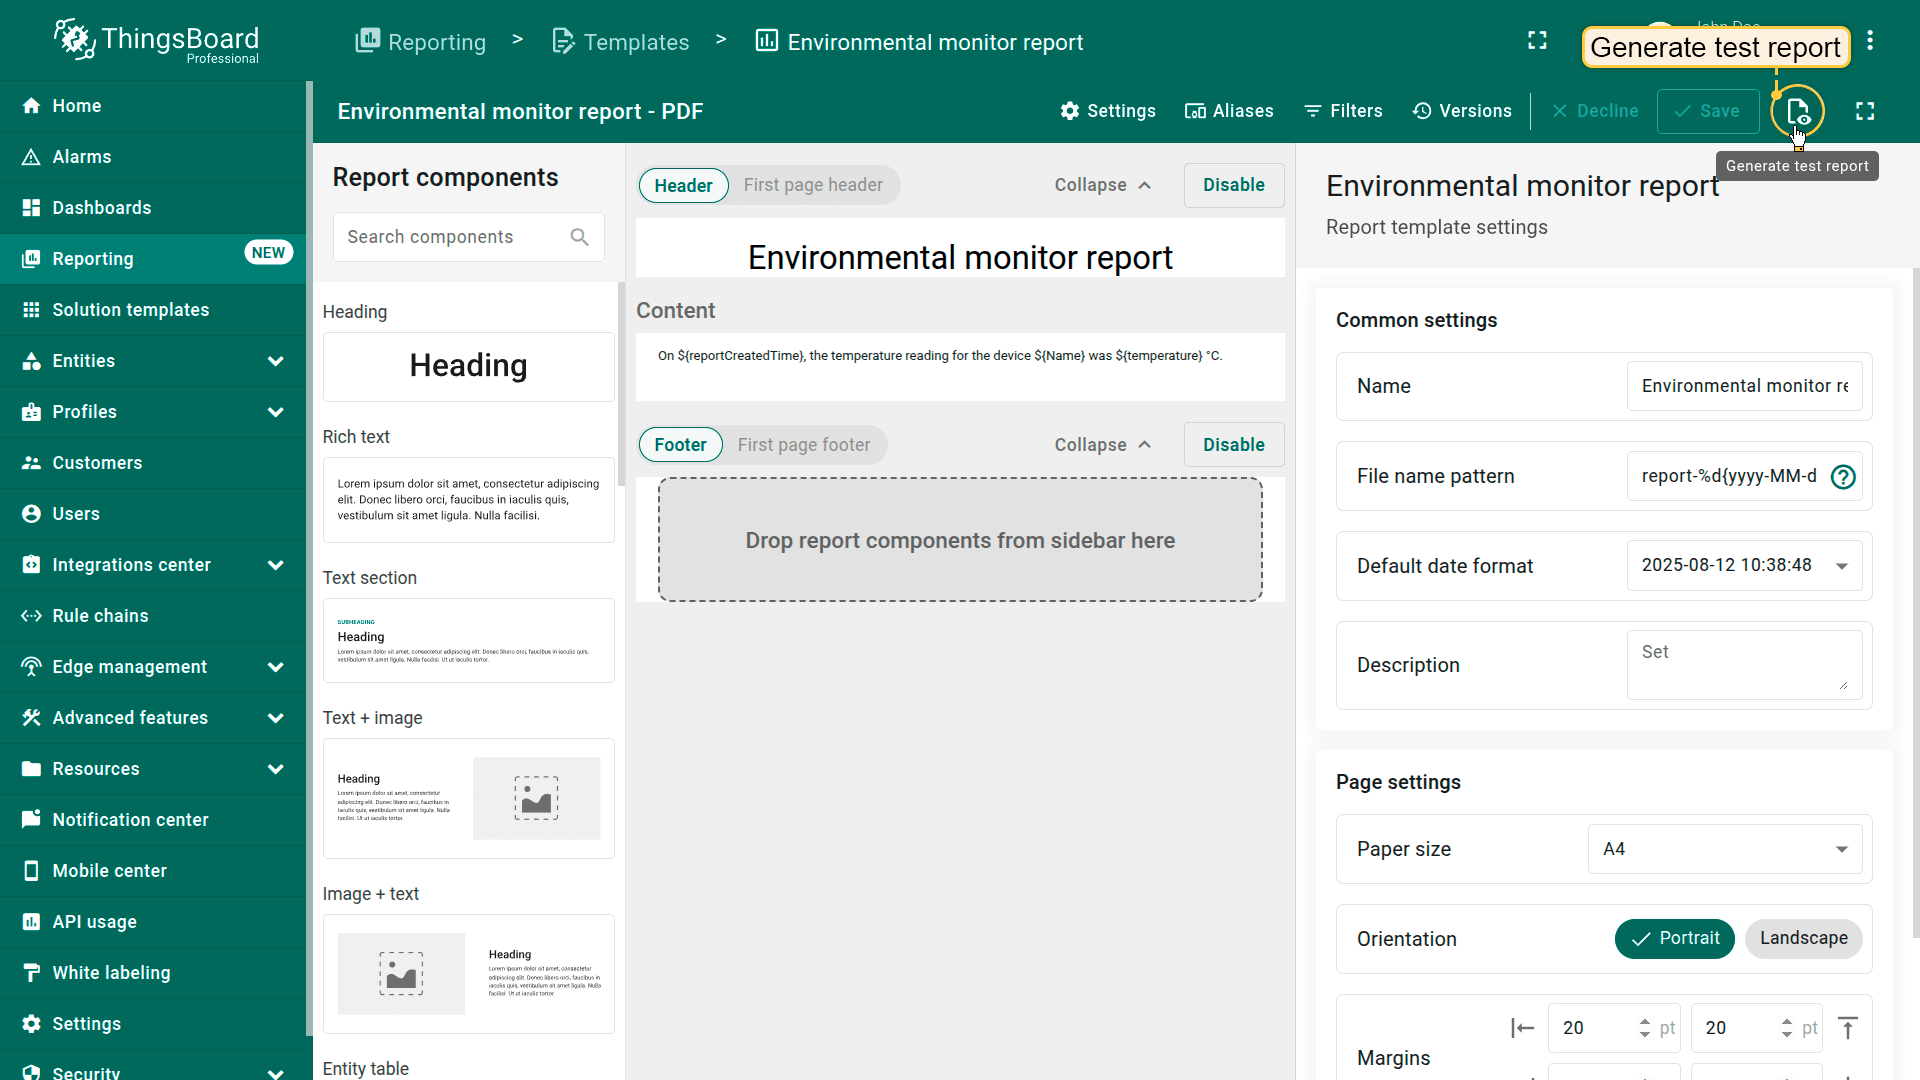
To verify the result, generate a test report sample by clicking the corresponding button in the top-right corner.

Importing report template
Do you have a ready-made report template in .json format? Simply click “Import report template” and upload your file — all configurations and components will be brought in automatically.
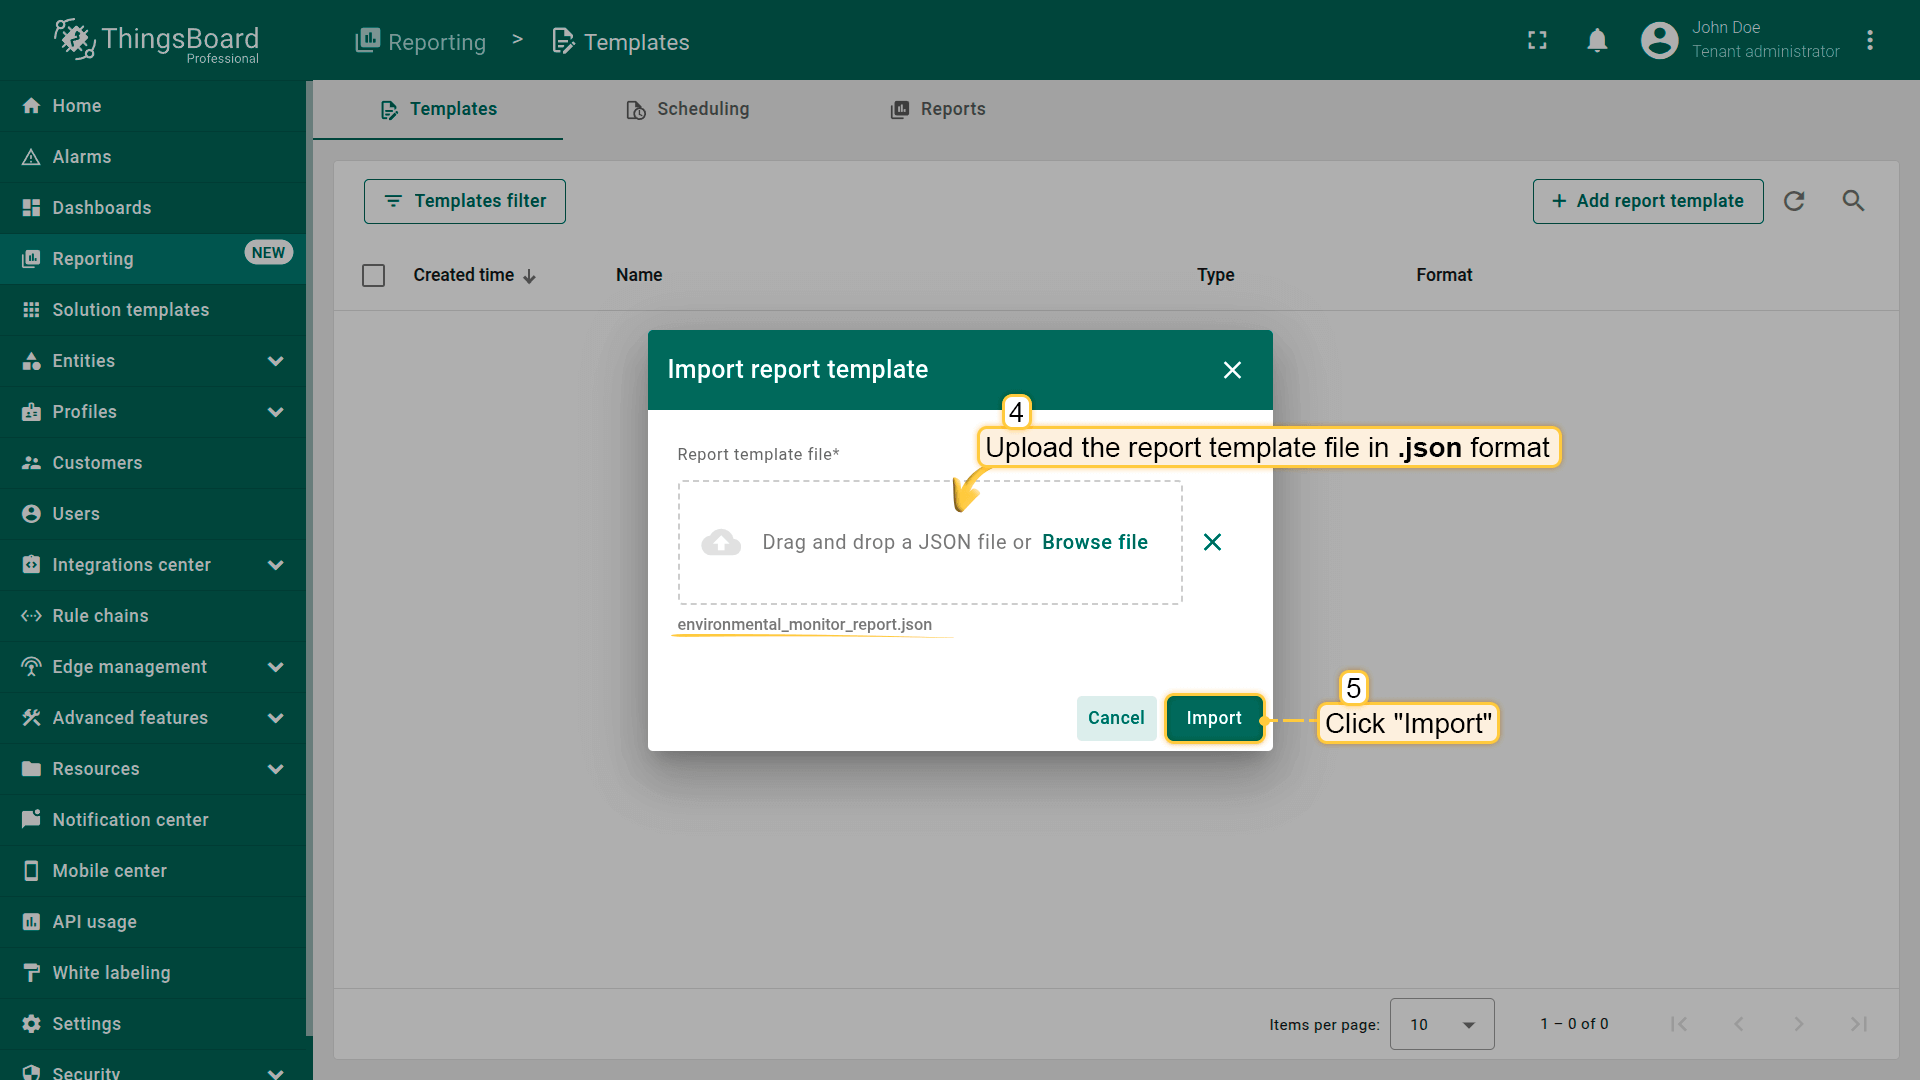
Optionally, try generating a test report to make sure everything looks just right.
Scheduler
The Scheduler in ThingsBoard is an automation mechanism for generating reports. It lets you configure automatic creation and delivery of reports at a specified time, based on a pre-built Report Template.
For step-by-step guidance, see: Scheduling reports.
Next steps
-
Getting started guides - These guides provide quick overview of main ThingsBoard features. Designed to be completed in 15-30 minutes.
-
Installation guides - Learn how to set up ThingsBoard on various available operating systems.
-
Connect your device - Learn how to connect devices based on your connectivity technology or solution.
-
Data visualization - These guides contain instructions on how to configure complex ThingsBoard dashboards.
-
Data processing & actions - Learn how to use ThingsBoard Rule Engine.
-
IoT Data analytics - Learn how to use rule engine to perform basic analytics tasks.