- Possible performance issues
- Troubleshooting instruments and tips
- Logs
- Metrics
- Prometheus metrics
- Grafana Dashboards
- OAuth2
- Getting help
Possible performance issues
Here we will describe different possible scenarios of what may go wrong.
If you are using Here what you can do to find the reason of the issue:
Tip: Separate unstable and test use-cases from other rule-engine by creating a separate queue. In this case failure will only affect the processing of this separate queue, and not the whole system. You can configure this logic to happen automatically for the device by using Device Profile feature. Tip: Handle Failure events for all rule-nodes that connect to some external service (REST API call, Kafka, MQTT etc). This way you guaranty that your rule-engine processing won’t stop in case of some failure on the side of external system. You can store failed message in DB, send some notification or just log message. |
Sometimes you can experience growing latency of message processing inside the rule-engine. Here are the steps you can take to discover the reason for the issue:
|
Troubleshooting instruments and tips
Rule Engine Statistics Dashboard
You can see if there are any Failures, Timeouts or Exceptions during the processing of your rule-chain. More detailed information you can find here.
Consumer group message lag for Kafka Queue
Note: This method can be used only if Kafka is selected as a queue.
With this log you can identify if there’s some issue with processing of your messages (since Queue is used for all messaging inside the system you can analyze not only rule-engine queues but also transport, core etc). For more detailed information about troubleshooting rule-engine processing using consumer-group lag click here.
CPU/Memory Usage
Sometimes the problem is that you don’t have enough resources for some service. You can view CPU and Memory usage by logging into your server/container/pod and executing top linux command.
For the more convenient monitoring it is better to have configured Prometheus and Grafana.
If you see that some services sometimes use 100% of the CPU, you should either scale the service horizontally by creating new nodes in cluster or scale it vertically by increasing the total amount of CPU.
Message Pack Processing Log
You can enable logging of the slowest and most frequently called rule-nodes. To do this you need to update your logging configuration with the following logger:
1
<logger name="org.thingsboard.server.service.queue.TbMsgPackProcessingContext" level="DEBUG" />
After this you can find the following messages in your logs:
1
2
3
4
5
6
7
8
9
2021-03-24 17:01:21,023 [tb-rule-engine-consumer-24-thread-3] DEBUG o.t.s.s.q.TbMsgPackProcessingContext - Top Rule Nodes by max execution time:
2021-03-24 17:01:21,024 [tb-rule-engine-consumer-24-thread-3] DEBUG o.t.s.s.q.TbMsgPackProcessingContext - [Main][3f740670-8cc0-11eb-bcd9-d343878c0c7f] max execution time: 1102. [RuleChain: Thermostat|RuleNode: Device Profile Node(3f740670-8cc0-11eb-bcd9-d343878c0c7f)]
2021-03-24 17:01:21,024 [tb-rule-engine-consumer-24-thread-3] DEBUG o.t.s.s.q.TbMsgPackProcessingContext - [Main][3f6debf0-8cc0-11eb-bcd9-d343878c0c7f] max execution time: 1. [RuleChain: Thermostat|RuleNode: Message Type Switch(3f6debf0-8cc0-11eb-bcd9-d343878c0c7f)]
2021-03-24 17:01:21,024 [tb-rule-engine-consumer-24-thread-3] INFO  o.t.s.s.q.TbMsgPackProcessingContext - Top Rule Nodes by avg execution time:
2021-03-24 17:01:21,024 [tb-rule-engine-consumer-24-thread-3] INFO  o.t.s.s.q.TbMsgPackProcessingContext - [Main][3f740670-8cc0-11eb-bcd9-d343878c0c7f] avg execution time: 604.0. [RuleChain: Thermostat|RuleNode: Device Profile Node(3f740670-8cc0-11eb-bcd9-d343878c0c7f)]
2021-03-24 17:01:21,025 [tb-rule-engine-consumer-24-thread-3] INFO  o.t.s.s.q.TbMsgPackProcessingContext - [Main][3f6debf0-8cc0-11eb-bcd9-d343878c0c7f] avg execution time: 1.0. [RuleChain: Thermostat|RuleNode: Message Type Switch(3f6debf0-8cc0-11eb-bcd9-d343878c0c7f)]
2021-03-24 17:01:21,025 [tb-rule-engine-consumer-24-thread-3] INFO  o.t.s.s.q.TbMsgPackProcessingContext - Top Rule Nodes by execution count:
2021-03-24 17:01:21,025 [tb-rule-engine-consumer-24-thread-3] INFO  o.t.s.s.q.TbMsgPackProcessingContext - [Main][3f740670-8cc0-11eb-bcd9-d343878c0c7f] execution count: 2. [RuleChain: Thermostat|RuleNode: Device Profile Node(3f740670-8cc0-11eb-bcd9-d343878c0c7f)]
2021-03-24 17:01:21,028 [tb-rule-engine-consumer-24-thread-3] INFO  o.t.s.s.q.TbMsgPackProcessingContext - [Main][3f6debf0-8cc0-11eb-bcd9-d343878c0c7f] execution count: 1. [RuleChain: Thermostat|RuleNode: Message Type Switch(3f6debf0-8cc0-11eb-bcd9-d343878c0c7f)]
Clearing Redis/Valkey Cache
Note: This can be used only if Redis or Valkey is selected as a cache.
It is possible that the data inside the cache has become corrupted. Regardless of the reason, it is always safe to clear the cache — ThingsBoard will simply refill it at runtime. To clear the cache, you need to log into the server/container/pod where it is deployed, open the application command-line tool (redis-cli for Redis and valkey-cli for Valkey), and run the FLUSHALLcommand. To clear the cache in Sentinel mode, access the master container and execute the cache-clearing command.
So if you are struggling with identifying the reason of some problem, you can safely clear cache to make sure it isn’t the reason of the issue.
Logs
Read logs
Regardless of the deployment type, ThingsBoard logs are stored on the same server/container as ThingsBoard Server/Node itself in the following directory:
1
/var/log/thingsboard
Different deployment tools provide different ways to view logs:
View last logs in runtime: You can use grep command to show only the output with desired string in it. For example you can use the following command in order to check if there are any errors on the backend side: |
View last logs in runtime: If you suspect the issue is related only to rule-engine, you can filter and view only the rule-engine logs: You can use grep command to show only the output with desired string in it. For example you can use the following command in order to check if there are any errors on the backend side: Tip: you can redirect logs to file and then analyze with any text editor: Note: you can always log into the ThingsBoard container and view logs there: |
View all pods of the cluster: View last logs for the desired pod: To view ThingsBoard node logs use command: You can use grep command to show only the output with desired string in it. For example you can use the following command in order to check if there are any errors on the backend side: If you have multiple nodes you could redirect logs from all nodes to files on you machine and then analyze them: Note: you can always log into the ThingsBoard container and view logs there: |
Enable certain logs
ThingsBoard provides the ability to enable/disable logging for certain parts of the system depending on what information do you need for troubleshooting.
You can do this by modifying logback.xml file. As logs itself, it is stored on the same server/container as ThingsBoard Server/Node in the following directory:
1
/usr/share/thingsboard/conf
Here’s an example of the logback.xml configuration:
1
2
3
4
5
6
7
8
9
10
11
12
13
14
15
16
17
18
19
20
21
22
23
24
25
26
<!DOCTYPE configuration>
<configuration scan="true" scanPeriod="10 seconds">

    <appender name="fileLogAppender"
              class="ch.qos.logback.core.rolling.RollingFileAppender">
        <file>/var/log/thingsboard/thingsboard.log</file>
        <rollingPolicy
                class="ch.qos.logback.core.rolling.SizeAndTimeBasedRollingPolicy">
            <fileNamePattern>/var/log/thingsboard/thingsboard.%d{yyyy-MM-dd}.%i.log</fileNamePattern>
            <maxFileSize>100MB</maxFileSize>
            <maxHistory>30</maxHistory>
            <totalSizeCap>3GB</totalSizeCap>
        </rollingPolicy>
        <encoder>
            <pattern>%d{ISO8601} [%thread] %-5level %logger{36} - %msg%n</pattern>
        </encoder>
    </appender>

    <logger name="org.thingsboard.server" level="INFO" />
    <logger name="org.thingsboard.js.api" level="TRACE" />
    <logger name="com.microsoft.azure.servicebus.primitives.CoreMessageReceiver" level="OFF" />

    <root level="INFO">
        <appender-ref ref="fileLogAppender"/>
    </root>
</configuration>
The most useful for the troubleshooting parts of the config files are loggers.
They allow you to enable/disable logging for the certain class or group of classes.
In the example above the default logging level is INFO (it means that logs will contain only general information, warnings and errors), but for the package org.thingsboard.js.api we enabled the most detailed level of logging.
There’s also a possibility to completely disable logs for some part of the system, in the example above we did it to com.microsoft.azure.servicebus.primitives.CoreMessageReceiver class using OFF log-level.
To enable/disable logging for some part of the system you need to add proper </logger> configuration and wait up to 10 seconds.
Different deployment tools provide different ways to update logs:
For standalone deployment you need to update |
For docker-compose deployment we are mapping |
For kubernetes deployment we are using ConfigMap kubernetes entity to provide tb-nodes with logback configuration. So in order to update logback.xml you need to do the following: After 10 seconds the changes should be applied to logging configuration. |
Metrics
You may enable prometheus metrics by setting environment variables METRICS_ENABLED to value true and METRICS_ENDPOINTS_EXPOSE to value prometheus in the configuration file.
If you are running ThingsBoard as microservices with separate services for MQTT and COAP transport, you also need to set environment variables WEB_APPLICATION_ENABLE to value true,
WEB_APPLICATION_TYPE to value servlet and HTTP_BIND_PORT to value 8081 for MQTT and COAP services in order to enable web-server with Prometheus metrics.
These metrics are exposed at the path: https://<yourhostname>/actuator/prometheus which can be scraped by prometheus (No authentication required).
Prometheus metrics
Some internal state metrics can be exposed by the Spring Actuator using Prometheus.
Here’s the list of metrics ThingsBoard pushes to Prometheus.
tb-node metrics
- attributes_queue_${index_of_queue} (statsNames - totalMsgs, failedMsgs, successfulMsgs): stats about writing attributes to the database. Note that there are several queues (threads) for persisting attributes in order to reach maximum performance.
- ruleEngine_${name_of_queue} (statsNames - totalMsgs, failedMsgs, successfulMsgs, tmpFailed, failedIterations, successfulIterations, timeoutMsgs, tmpTimeout):
stats about processing of the messages inside of the Rule Engine. They are persisted for each queue (e.g. Main, HighPriority, SequentialByOriginator etc).
Some stats descriptions:
- tmpFailed: number of messages that failed and got reprocessed later
- tmpTimeout: number of messages that timed out and got reprocessed later
- timeoutMsgs: number of messages that timed out and were discarded afterwards
- failedIterations: iterations of processing messages pack where at least one message wasn’t processed successfully
- ruleEngine_${name_of_queue}_seconds (for each present tenantId): stats about the time message processing took for different queues.
- core (statsNames - totalMsgs, toDevRpc, coreNfs, sessionEvents, subInfo, subToAttr, subToRpc, deviceState, getAttr, claimDevice, subMsgs):
stats about processing of the internal system messages.
Some stats descriptions:
- toDevRpc: number of processed RPC responses from Transport services
- sessionEvents: number of session events from Transport services
- subInfo: number of subscription infos from Transport services
- subToAttr: number of subscribes to attribute updates from Transport services
- subToRpc: number of subscribes to RPC from Transport services
- getAttr: number of ‘get attributes’ requests from Transport services
- claimDevice: number of Device claims from Transport services
- deviceState: number of processed changes to Device State
- subMsgs: number of processed subscriptions
- coreNfs: number of processed specific ‘system’ messages
- jsInvoke (statsNames - requests, responses, failures): stats about total, successful and failed requests to the JS executors
- attributes_cache (results - hit, miss): stats about how much attribute requests went to the cache
transport metrics
- transport (statsNames - totalMsgs, failedMsgs, successfulMsgs): stats about requests received by Transport from TB nodes
- ruleEngine_producer (statsNames - totalMsgs, failedMsgs, successfulMsgs): stats about pushing messages from Transport to the Rule Engine.
- core_producer (statsNames - totalMsgs, failedMsgs, successfulMsgs): stats about pushing messages from Transport to the TB node Device actor.
- transport_producer (statsNames - totalMsgs, failedMsgs, successfulMsgs): stats about requests from Transport to the TB.
Some metrics depends on the type of the database you are using to persist timeseries data.
PostgreSQL-specific metrics
- ts_latest_queue_${index_of_queue} (statsNames - totalMsgs, failedMsgs, successfulMsgs): stats about writing latest telemetry to the database. Note that there are several queues (threads) in order to reach maximum performance.
- ts_queue_${index_of_queue} (statsNames - totalMsgs, failedMsgs, successfulMsgs): stats about writing telemetry to the database. Note that there are several queues (threads) in order to reach maximum performance.
Cassandra-specific metrics
- rateExecutor_currBuffer: number of messages that are currently being persisted inside the Cassandra.
- rateExecutor_tenant (for each present tenantId): number of requests that got rate-limited
- rateExecutor (statsNames - totalAdded, totalRejected, totalLaunched, totalReleased, totalFailed, totalExpired, totalRateLimited)
Stats descriptions:
- totalAdded: number messages that were submitted for persisting
- totalRejected: number messages that were rejected while trying to submit for persisting
- totalLaunched: number messages sent to the Cassandra
- totalReleased: number successfully persisted messages
- totalFailed: number of messages that were not persisted
- totalExpired: number of expired messages that were not sent to the Cassandra
- totalRateLimited: number of messages that were not processed because of the Tenant’s rate-limits
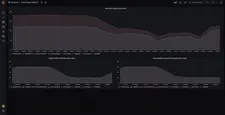
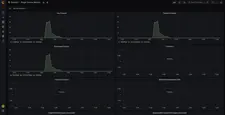
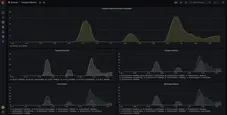
Grafana Dashboards
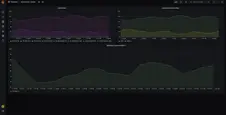
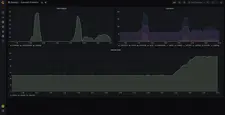
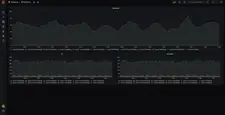
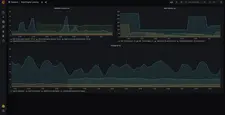
You can import preconfigured Grafana dashboards from here.
Note: Depending on the cluster configuration, you may need to make changes to the dashboards.
You can also view Grafana dashboards after deploying the ThingsBoards docker-compose cluster configuration (for more information, please follow this guide).
Make sure that MONITORING_ENABLED environment variable is set to true. Once deployed, you can access Prometheus at http://localhost:9090 and Grafana at http://localhost:3000 (by default, the username is admin and the password is foobar).
Here are the screenshots of the default preconfigured Grafana dashboards:
OAuth2
Sometimes after configuring OAuth you can not see the button for logging in with OAuth provider. This happens when “Domain name” and “Redirect URI Template” contain faulty values, they need to be the same you use for accessing your ThingsBoard web page.
Example:
| Base URL | Domain name | Redirect URI Template |
|---|---|---|
| http://mycompany.com:8080 | mycompany.com:8080 | http://mycompany.com:8080/login/oauth2/code |
| https://mycompany.com | mycompany.com | https://mycompany.com/login/oauth2/code |
Base URL in “HOME” section should not contain “/” or other characters.
Go to your ThingsBoard as a System Administrator. Check the General Settings -> Base URL should not contain “/” at the end (e.g. “https:// mycompany.com ” instead of “https://mycompany.com/”).
For OAuth2 configuration click here.
Getting help
If your problem isn’t answered by any of the guides above, feel free to contact ThingsBoard team.