Visualize Anomaly Data
Trendz provides three approaches for visualizing anomaly data, suited to different use cases:
| Approach | When to use |
|---|---|
| Anomaly View | Plug-and-play visualization — no configuration required. |
| Anomaly Fields | Flexible custom views; anomaly data queried directly from the model. |
| Business Entity Fields | Fine-grained control when anomaly scores are saved to ThingsBoard. |
Anomaly View
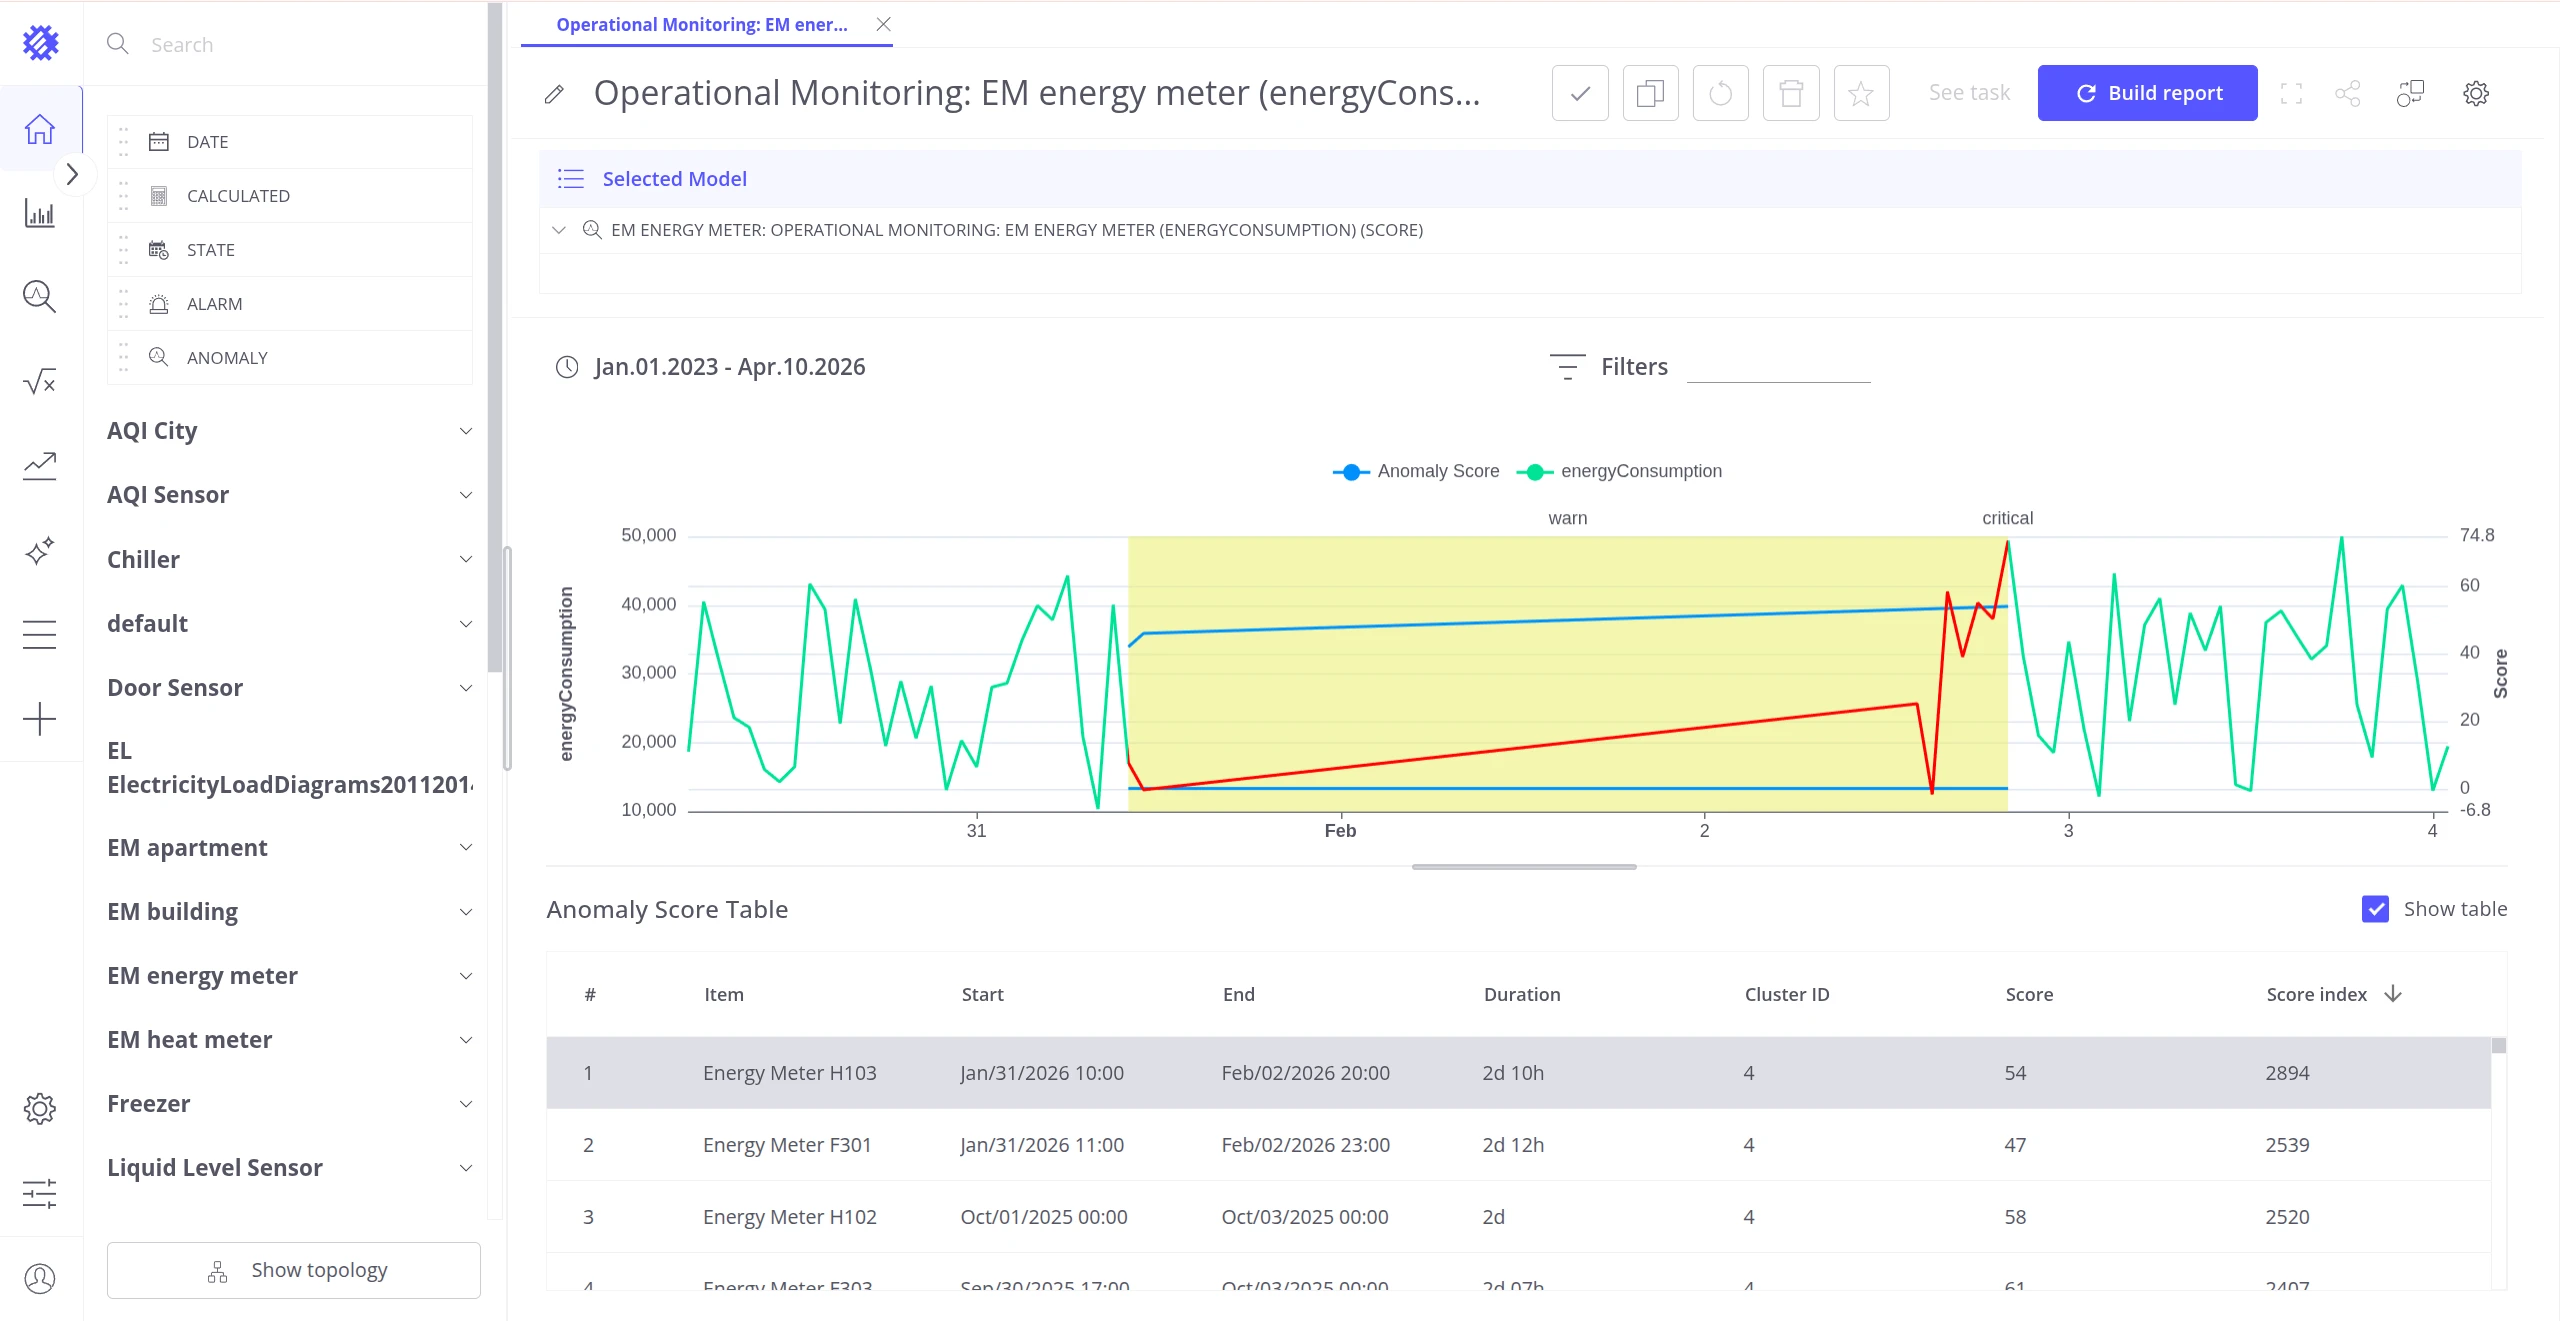
Section titled “Anomaly View”The Anomaly View is a pre-built view type dedicated to anomaly visualization. It provides the same functionality as the Result tab in the anomaly model, but as a standalone view that can be embedded in a ThingsBoard dashboard widget like any other Trendz view.
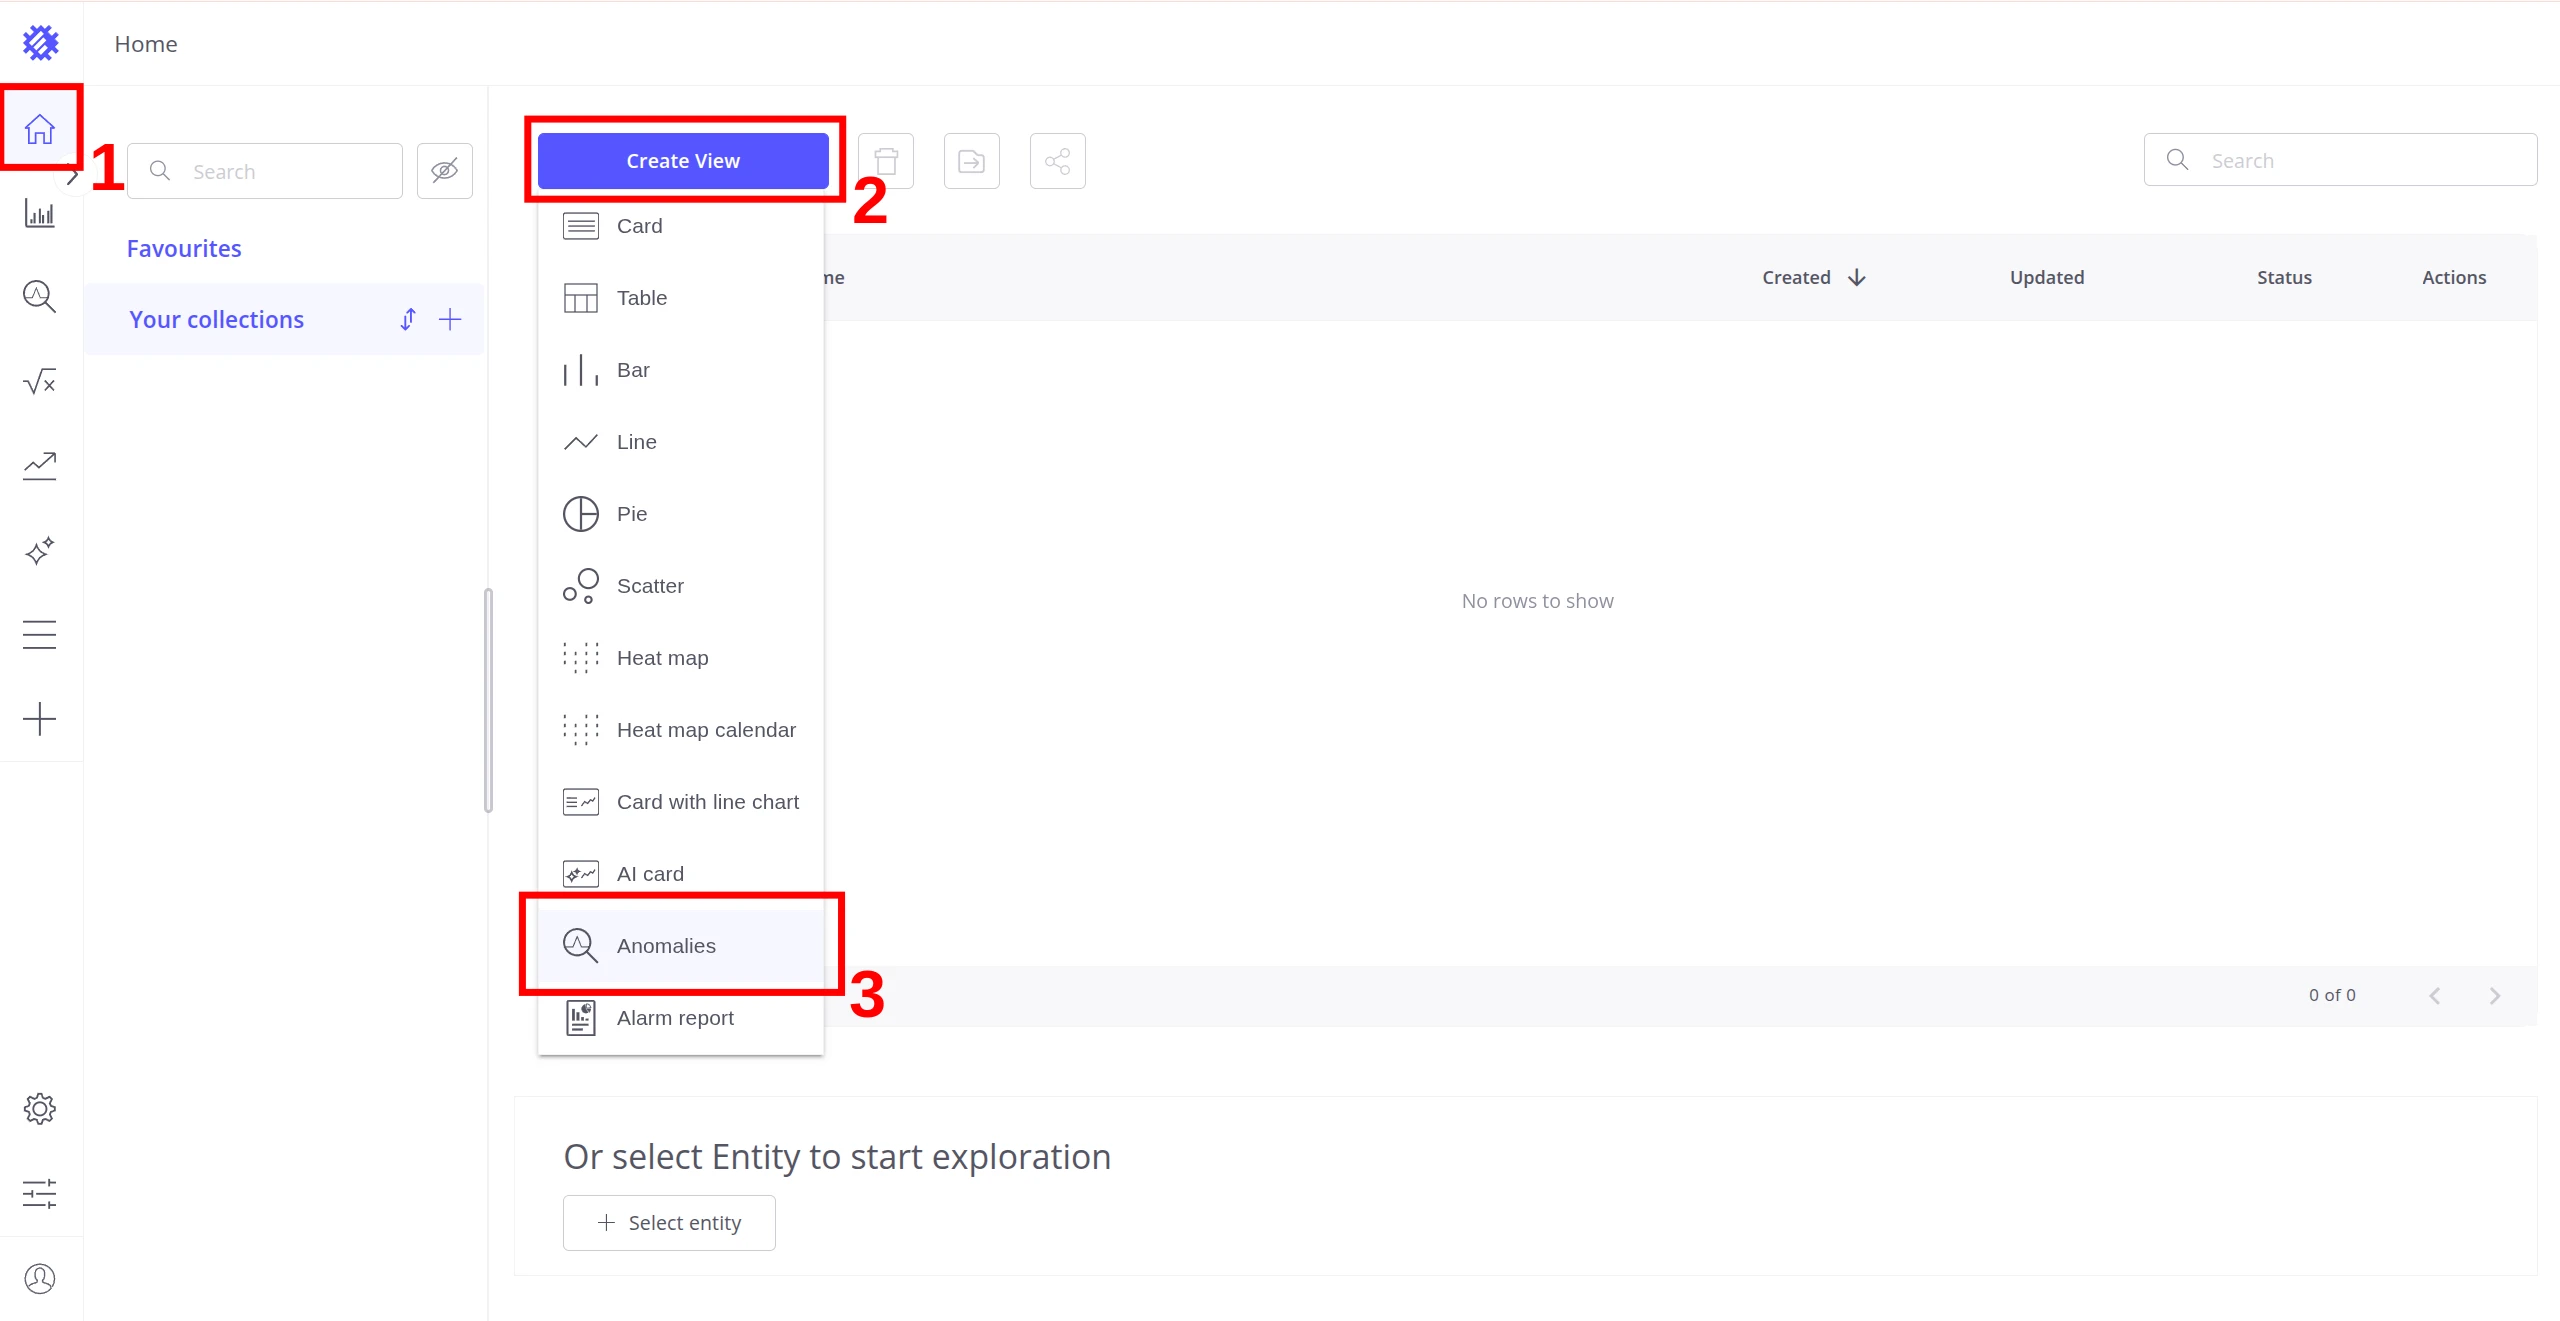
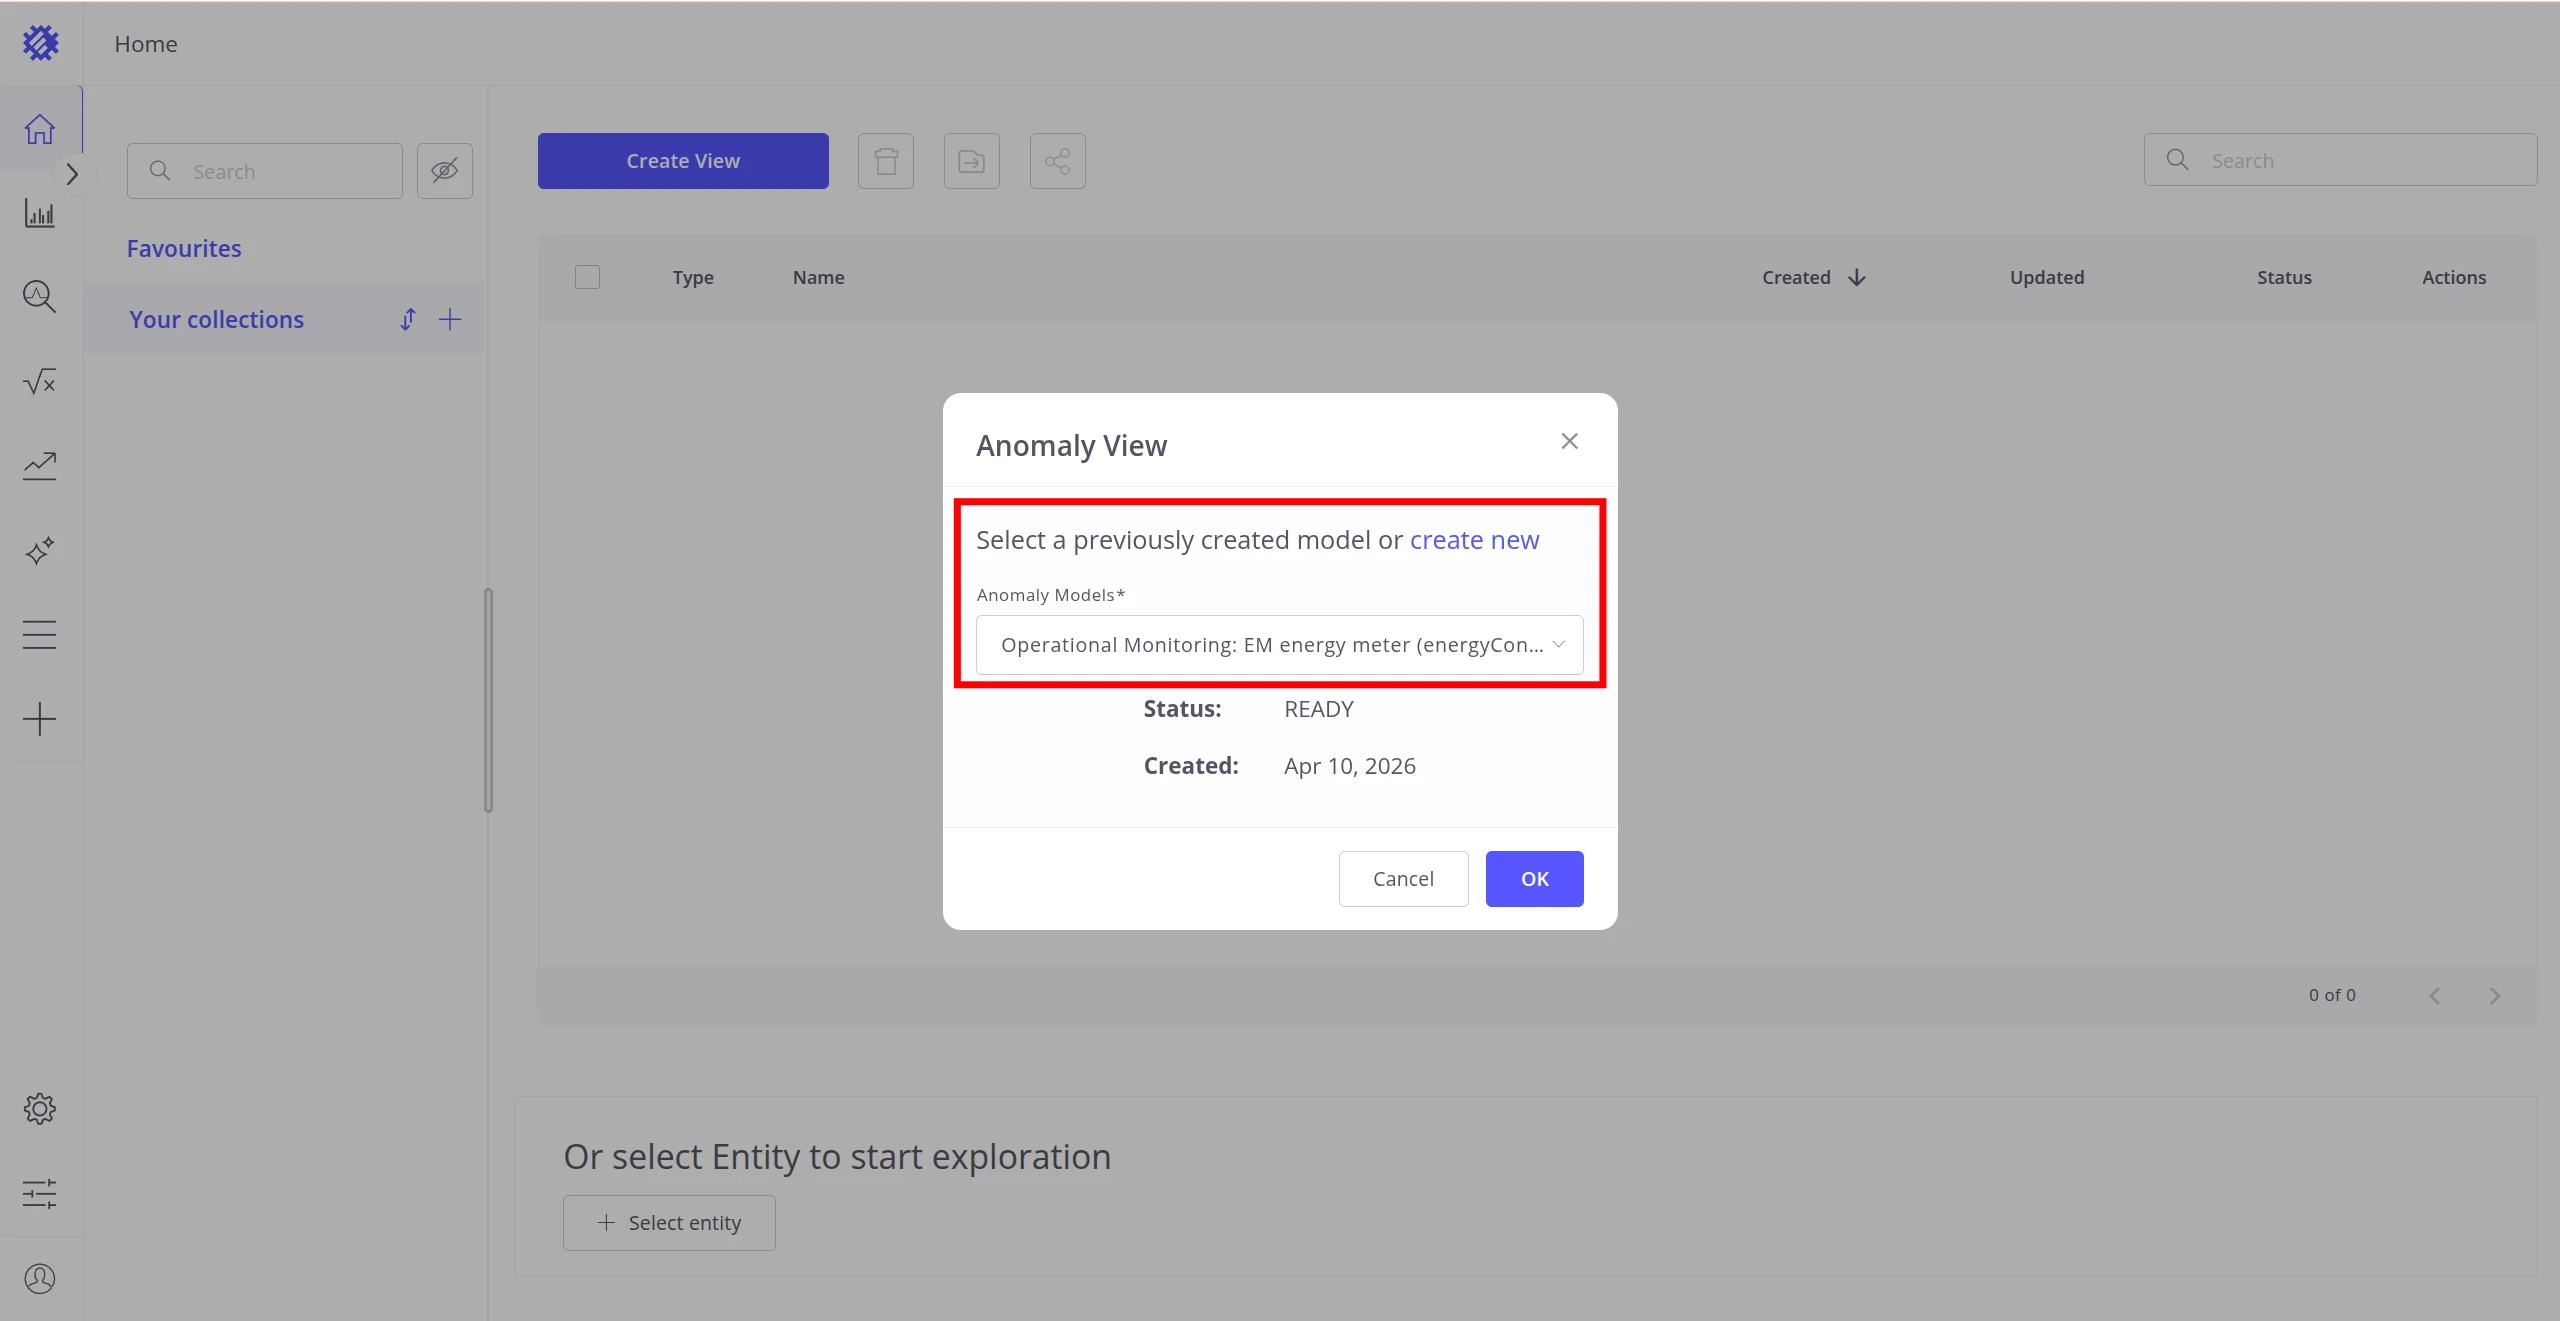
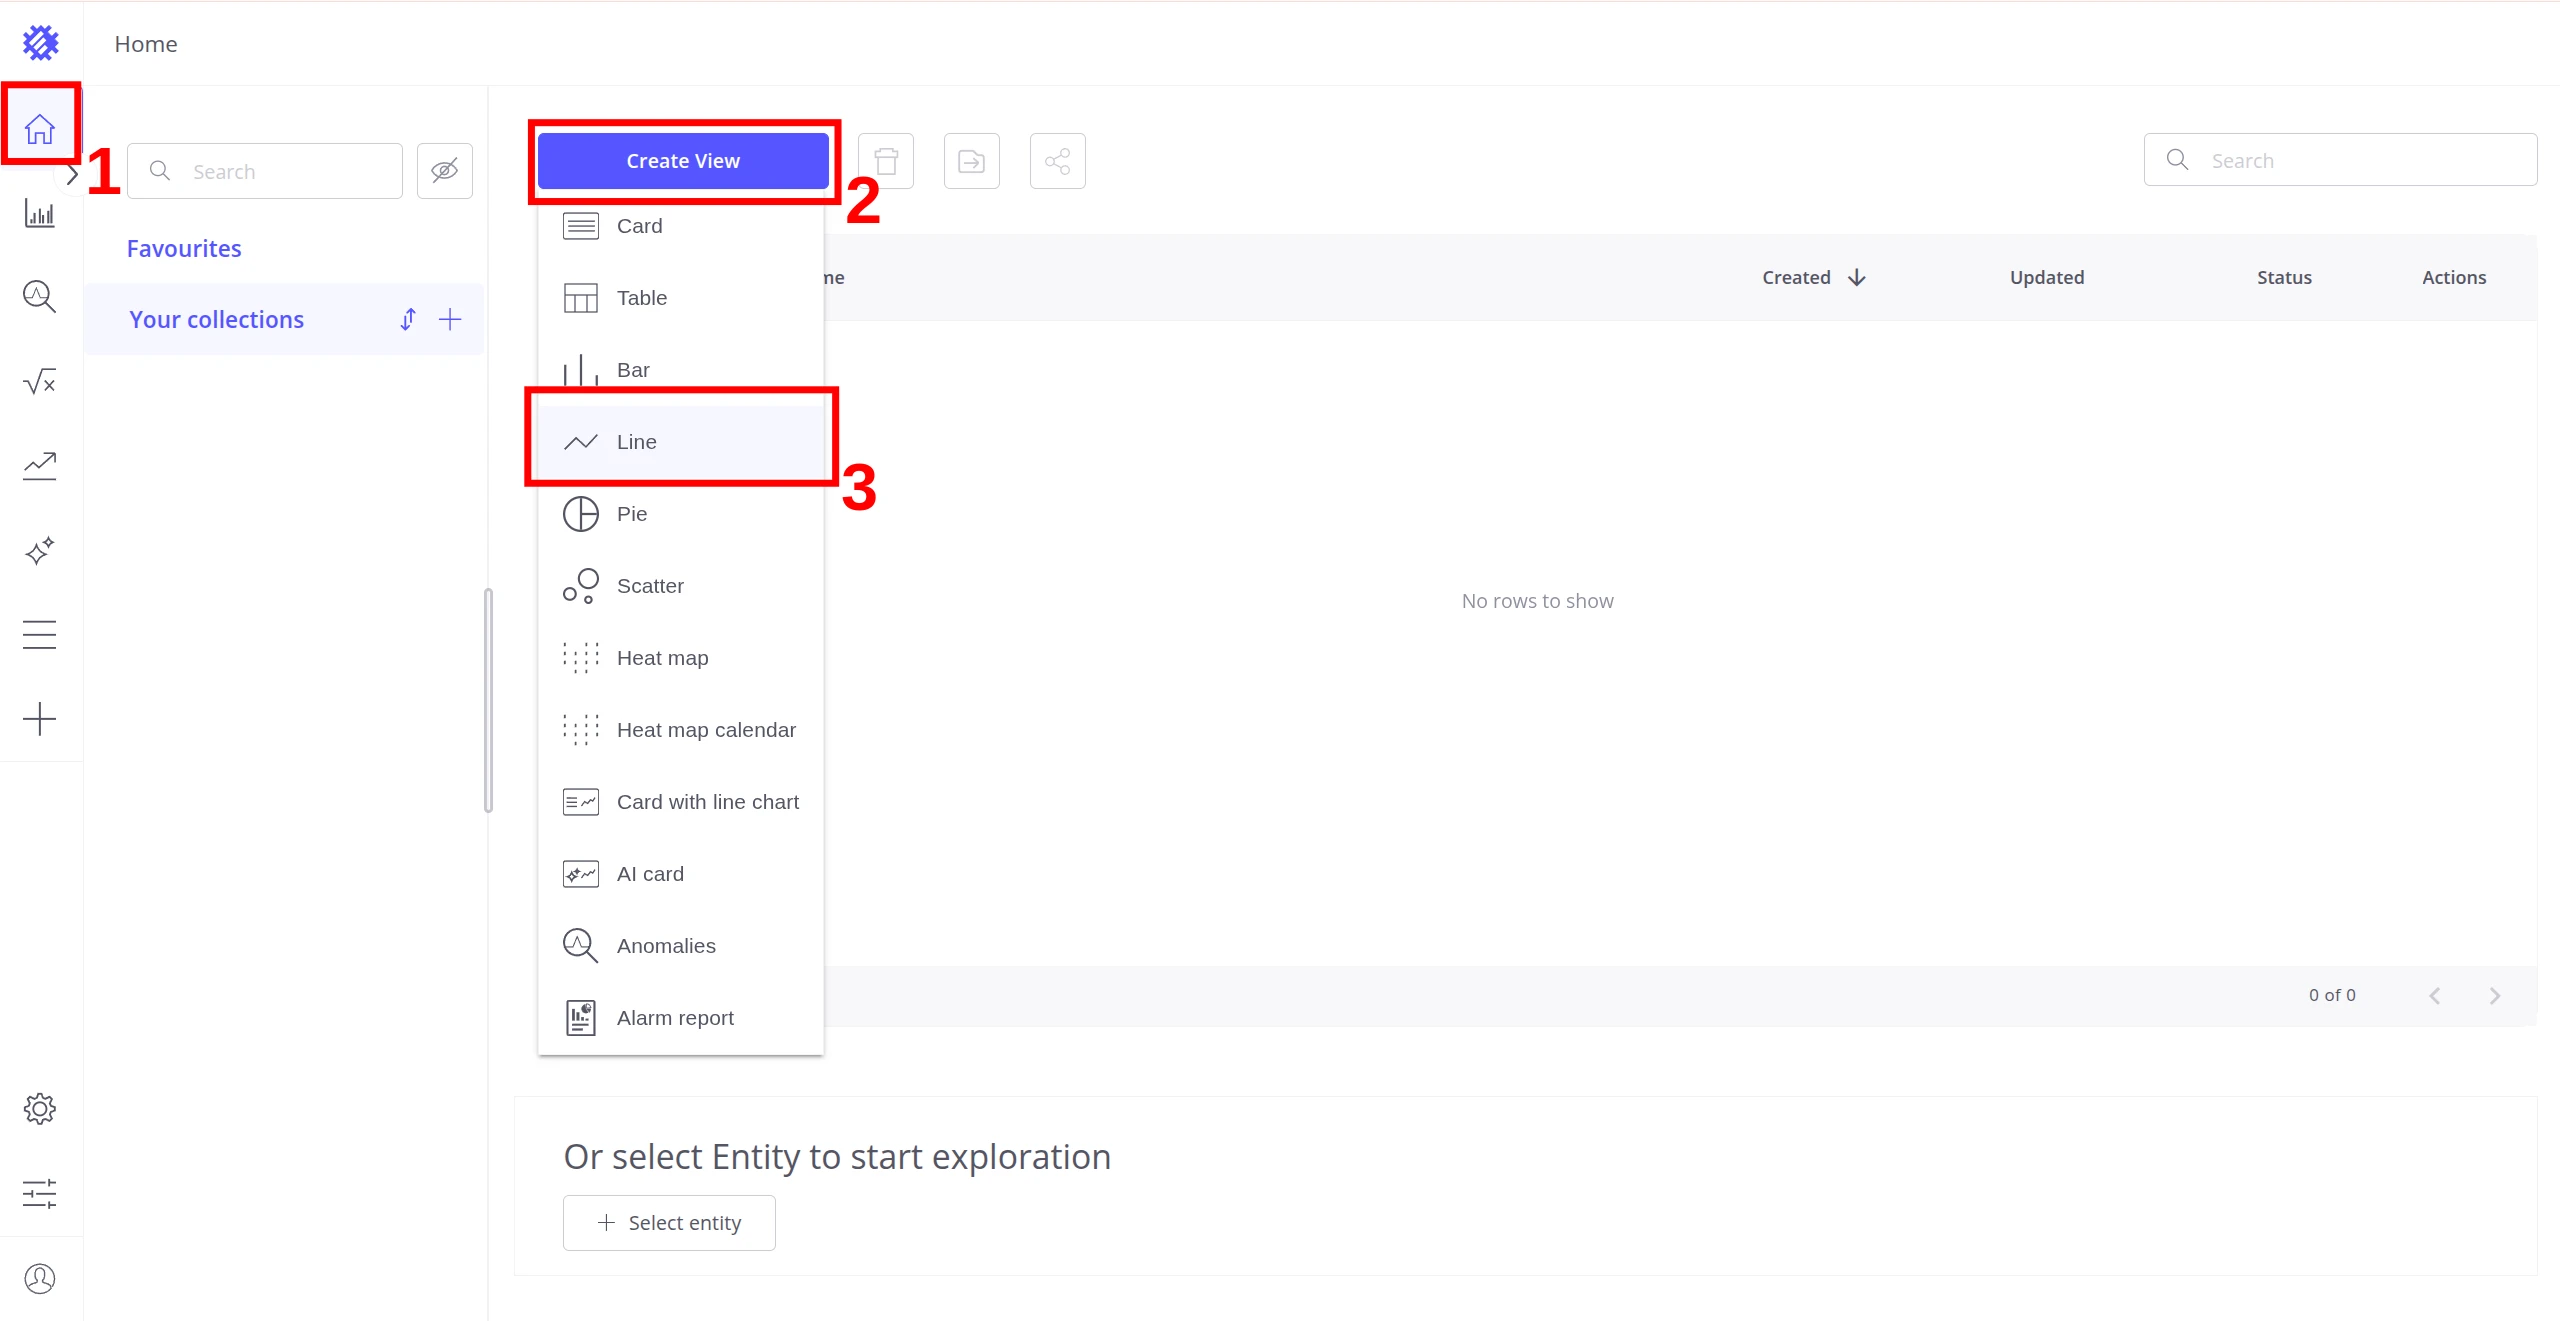
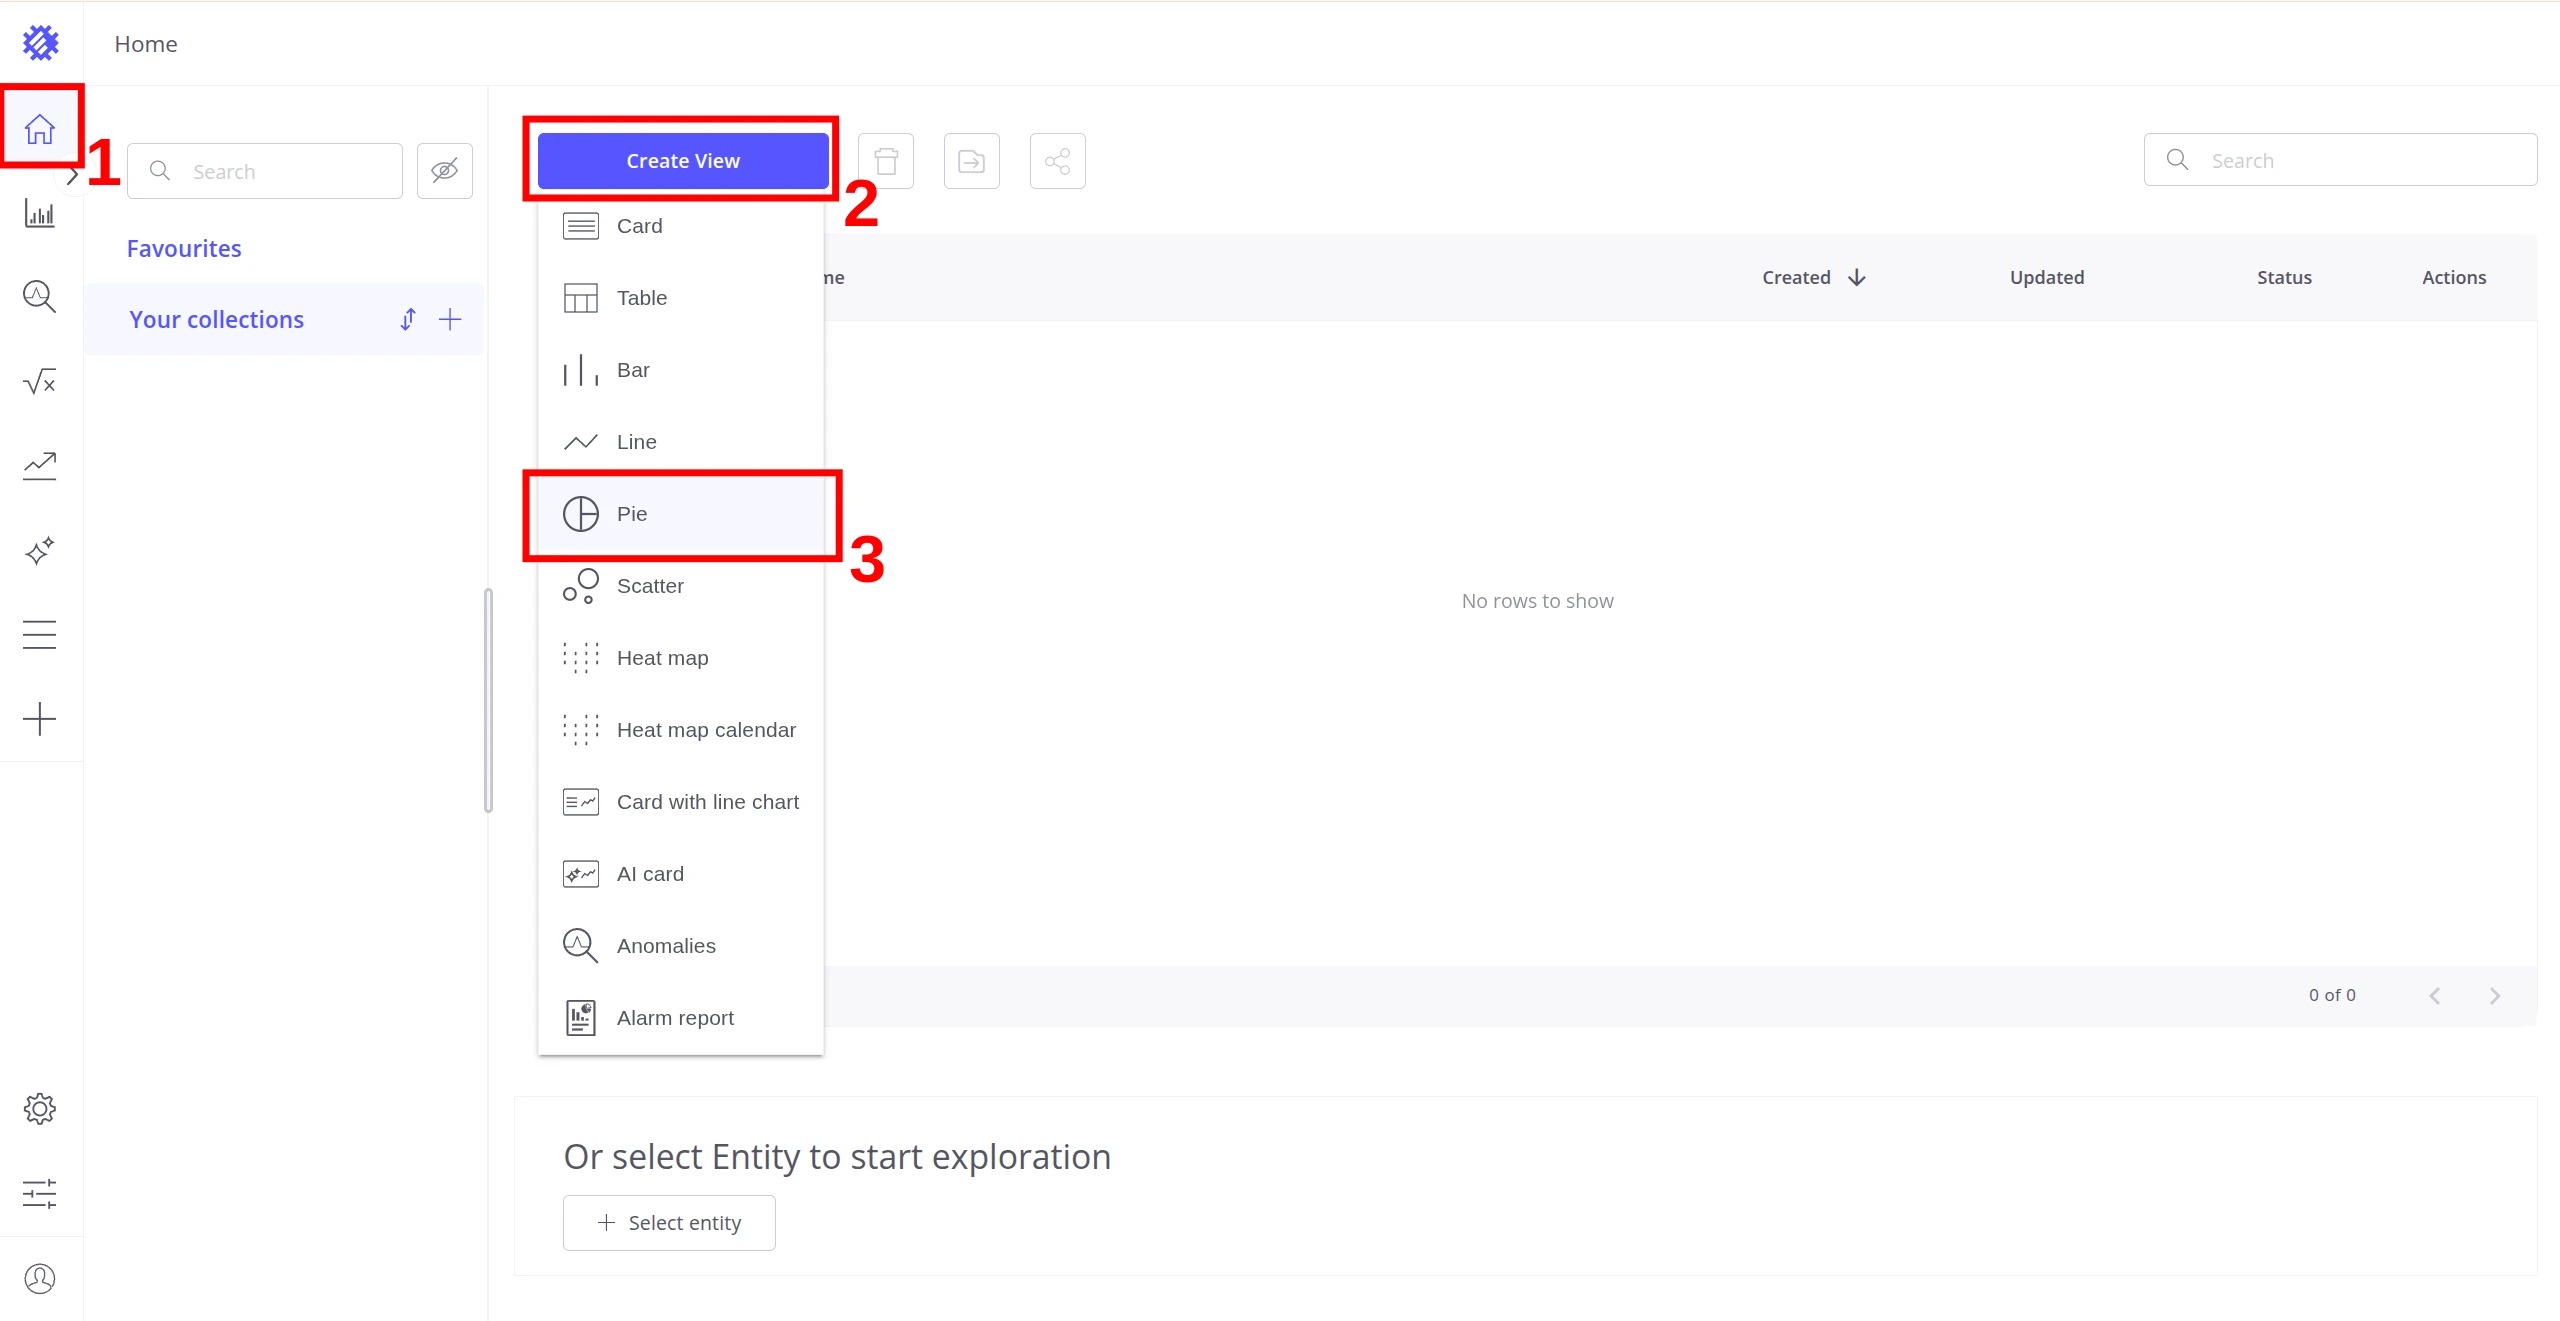
To create an Anomaly View, click Create View and select Anomalies from the dropdown. The Anomaly View dialog opens — select an existing anomaly model from the list.
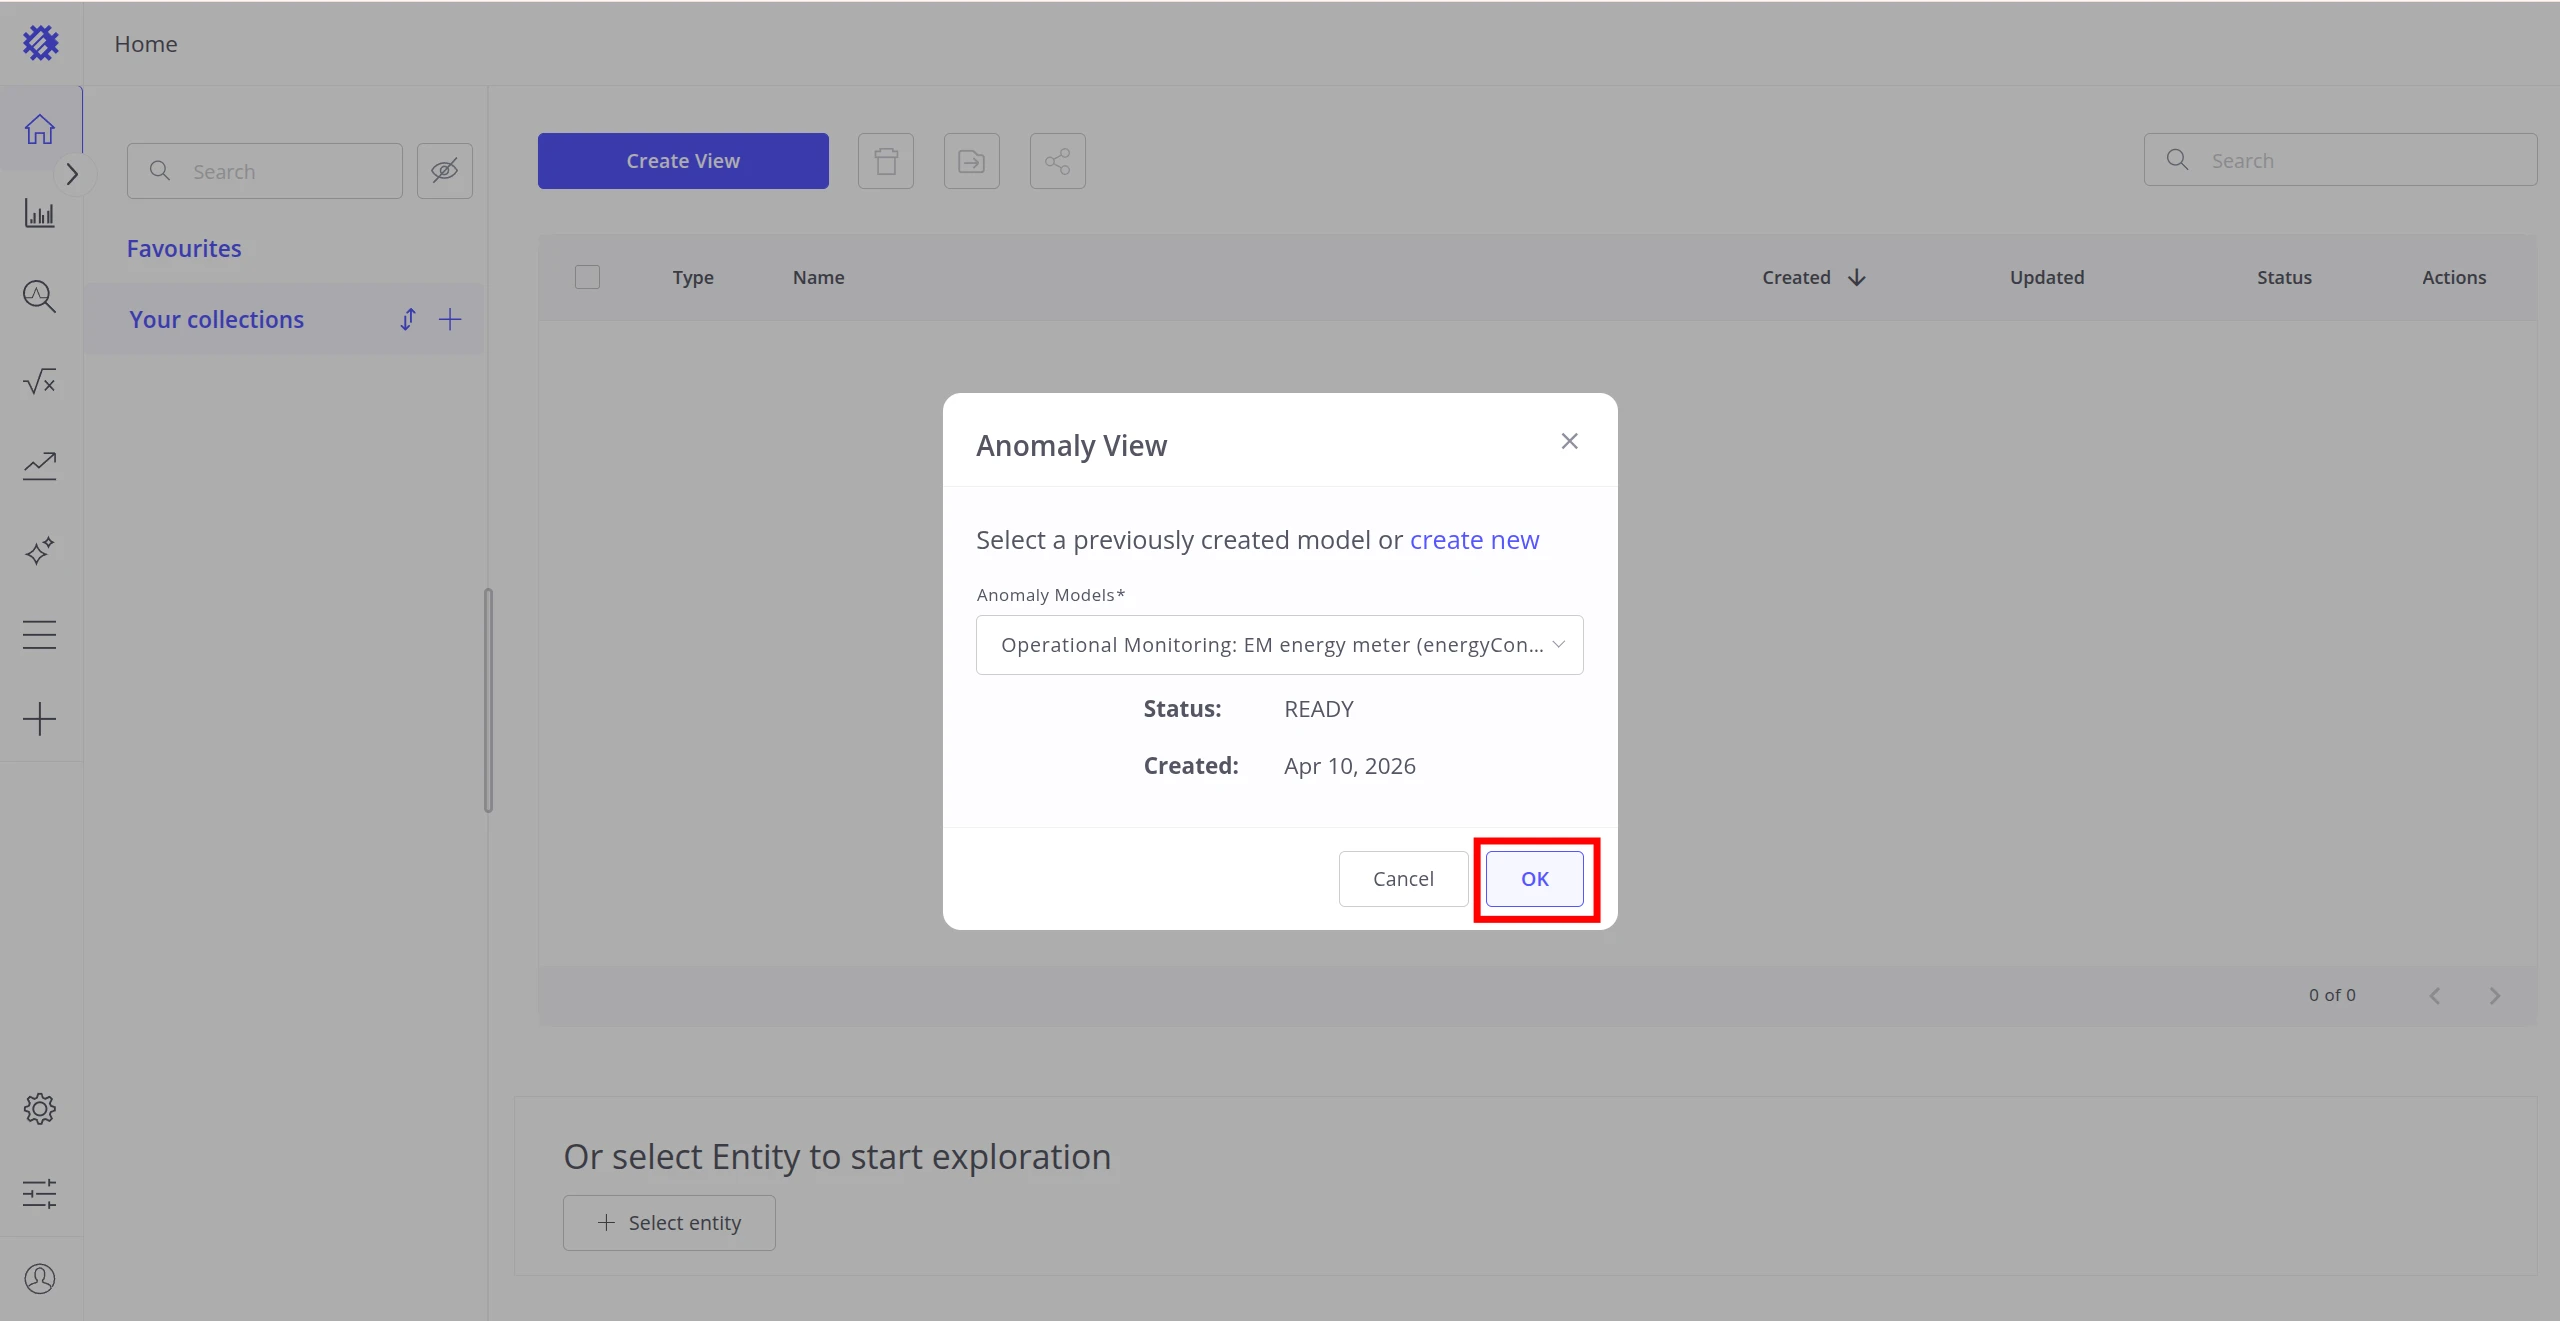
Click OK to confirm.
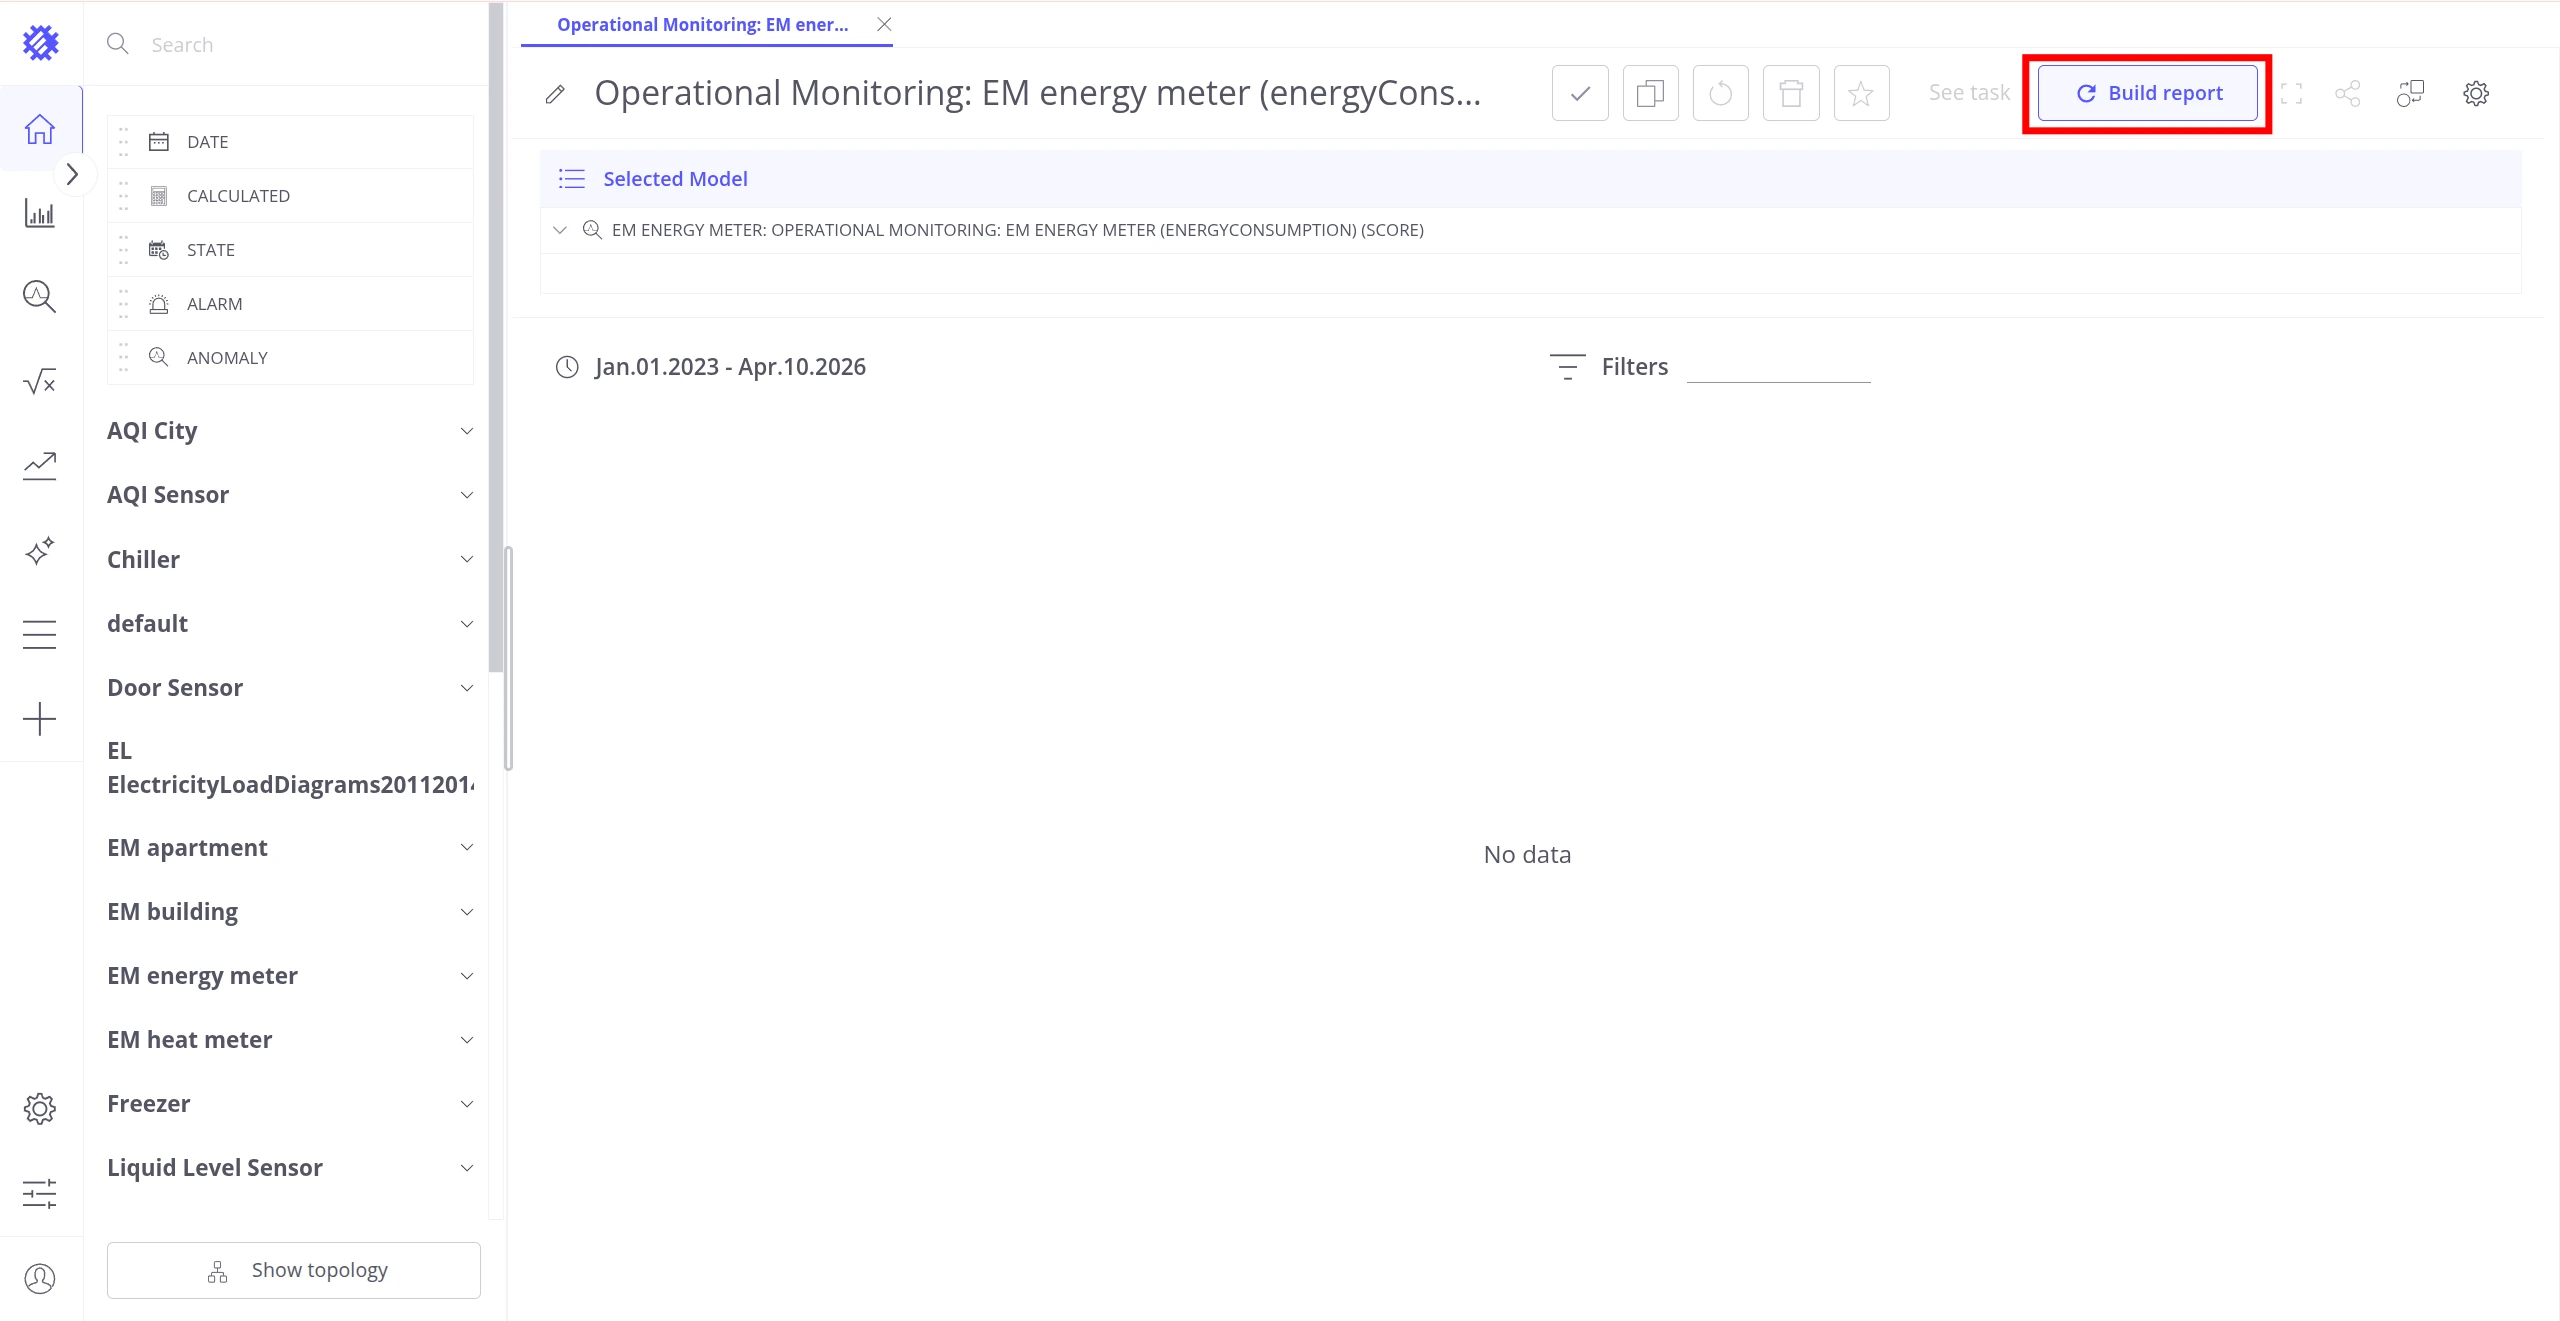
The view opens with the selected model pre-loaded. Click Build report in the top-right corner to load anomaly data for the configured time range.
Available settings:
| Setting | Description |
|---|---|
| Default Anomaly Selection | Which anomaly is highlighted when the view opens: last or max score index. |
| Hide Anomalies List | Removes the anomaly list table from the view. |
| Hide Anomalies Chart | Removes the anomaly chart from the view. |
| Time Range | Time range used for the view. |
| Filters | Which items are shown in the view. |
To add the Anomaly View to a ThingsBoard dashboard, use the Share button in the top-right corner of the view. See Add View on Dashboard for step-by-step instructions.
Anomaly Fields
Section titled “Anomaly Fields”Anomaly Fields are building blocks for constructing custom anomaly visualizations inside any Trendz view — line chart, bar chart, card, and others. They query anomaly data directly from the model without requiring scores to be saved to ThingsBoard. Multiple Anomaly Fields from different models can be added to the same view.
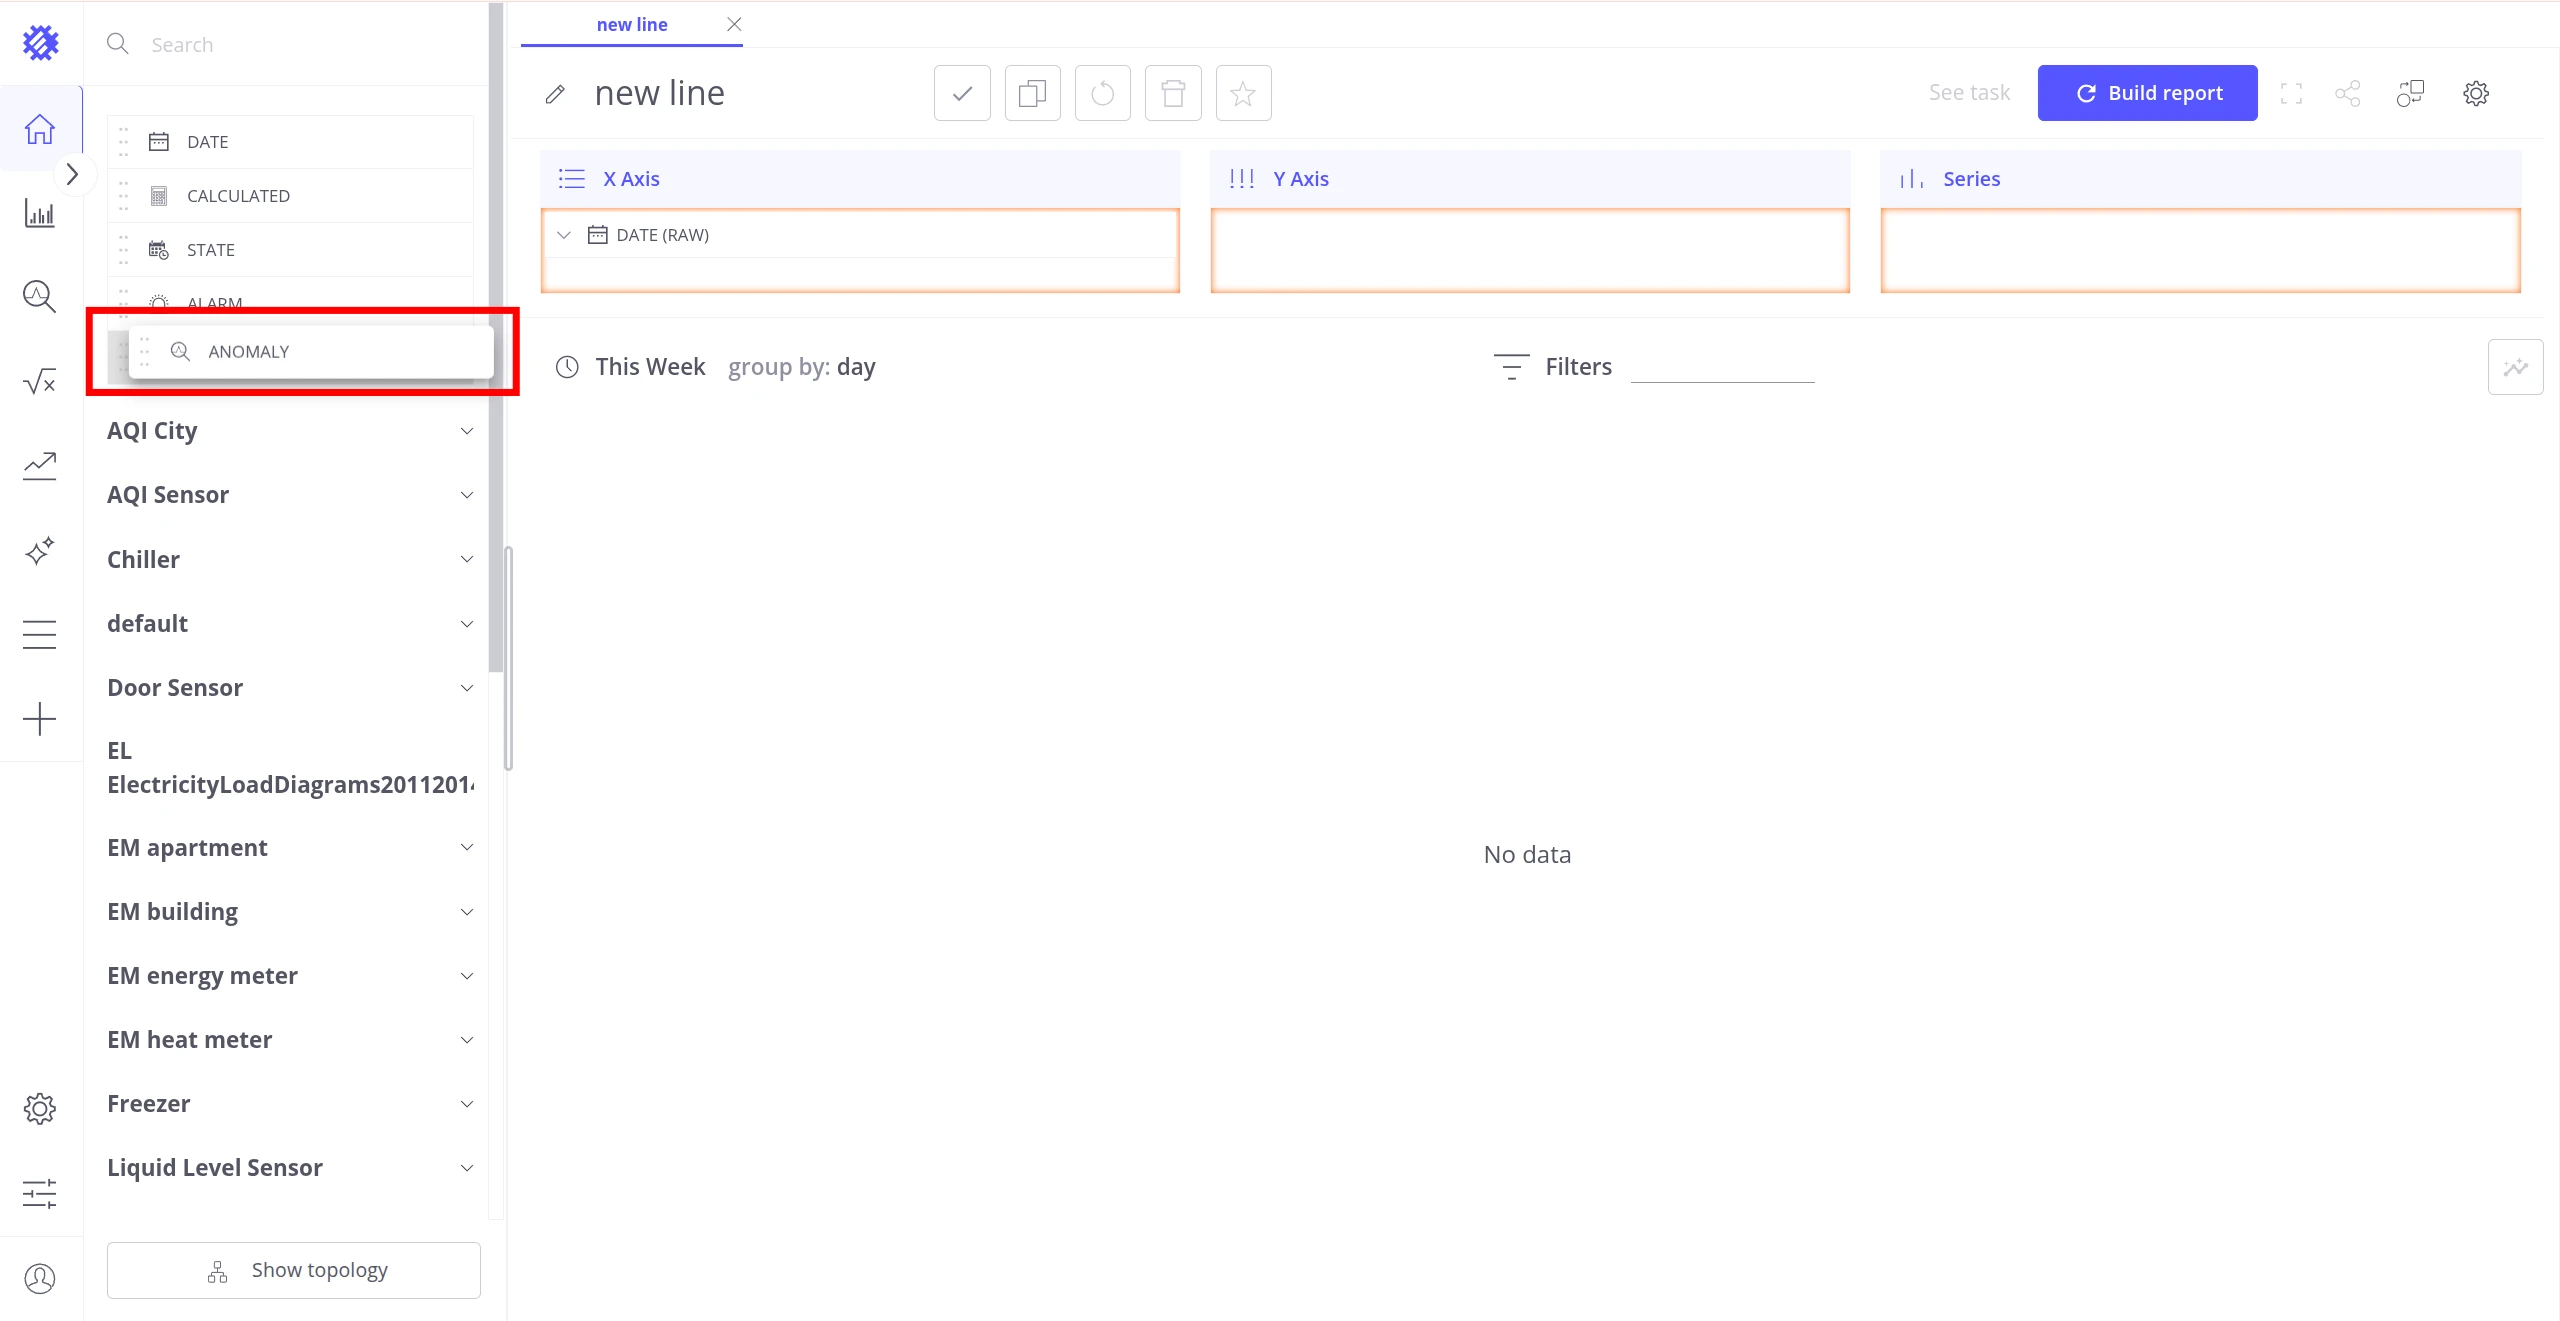
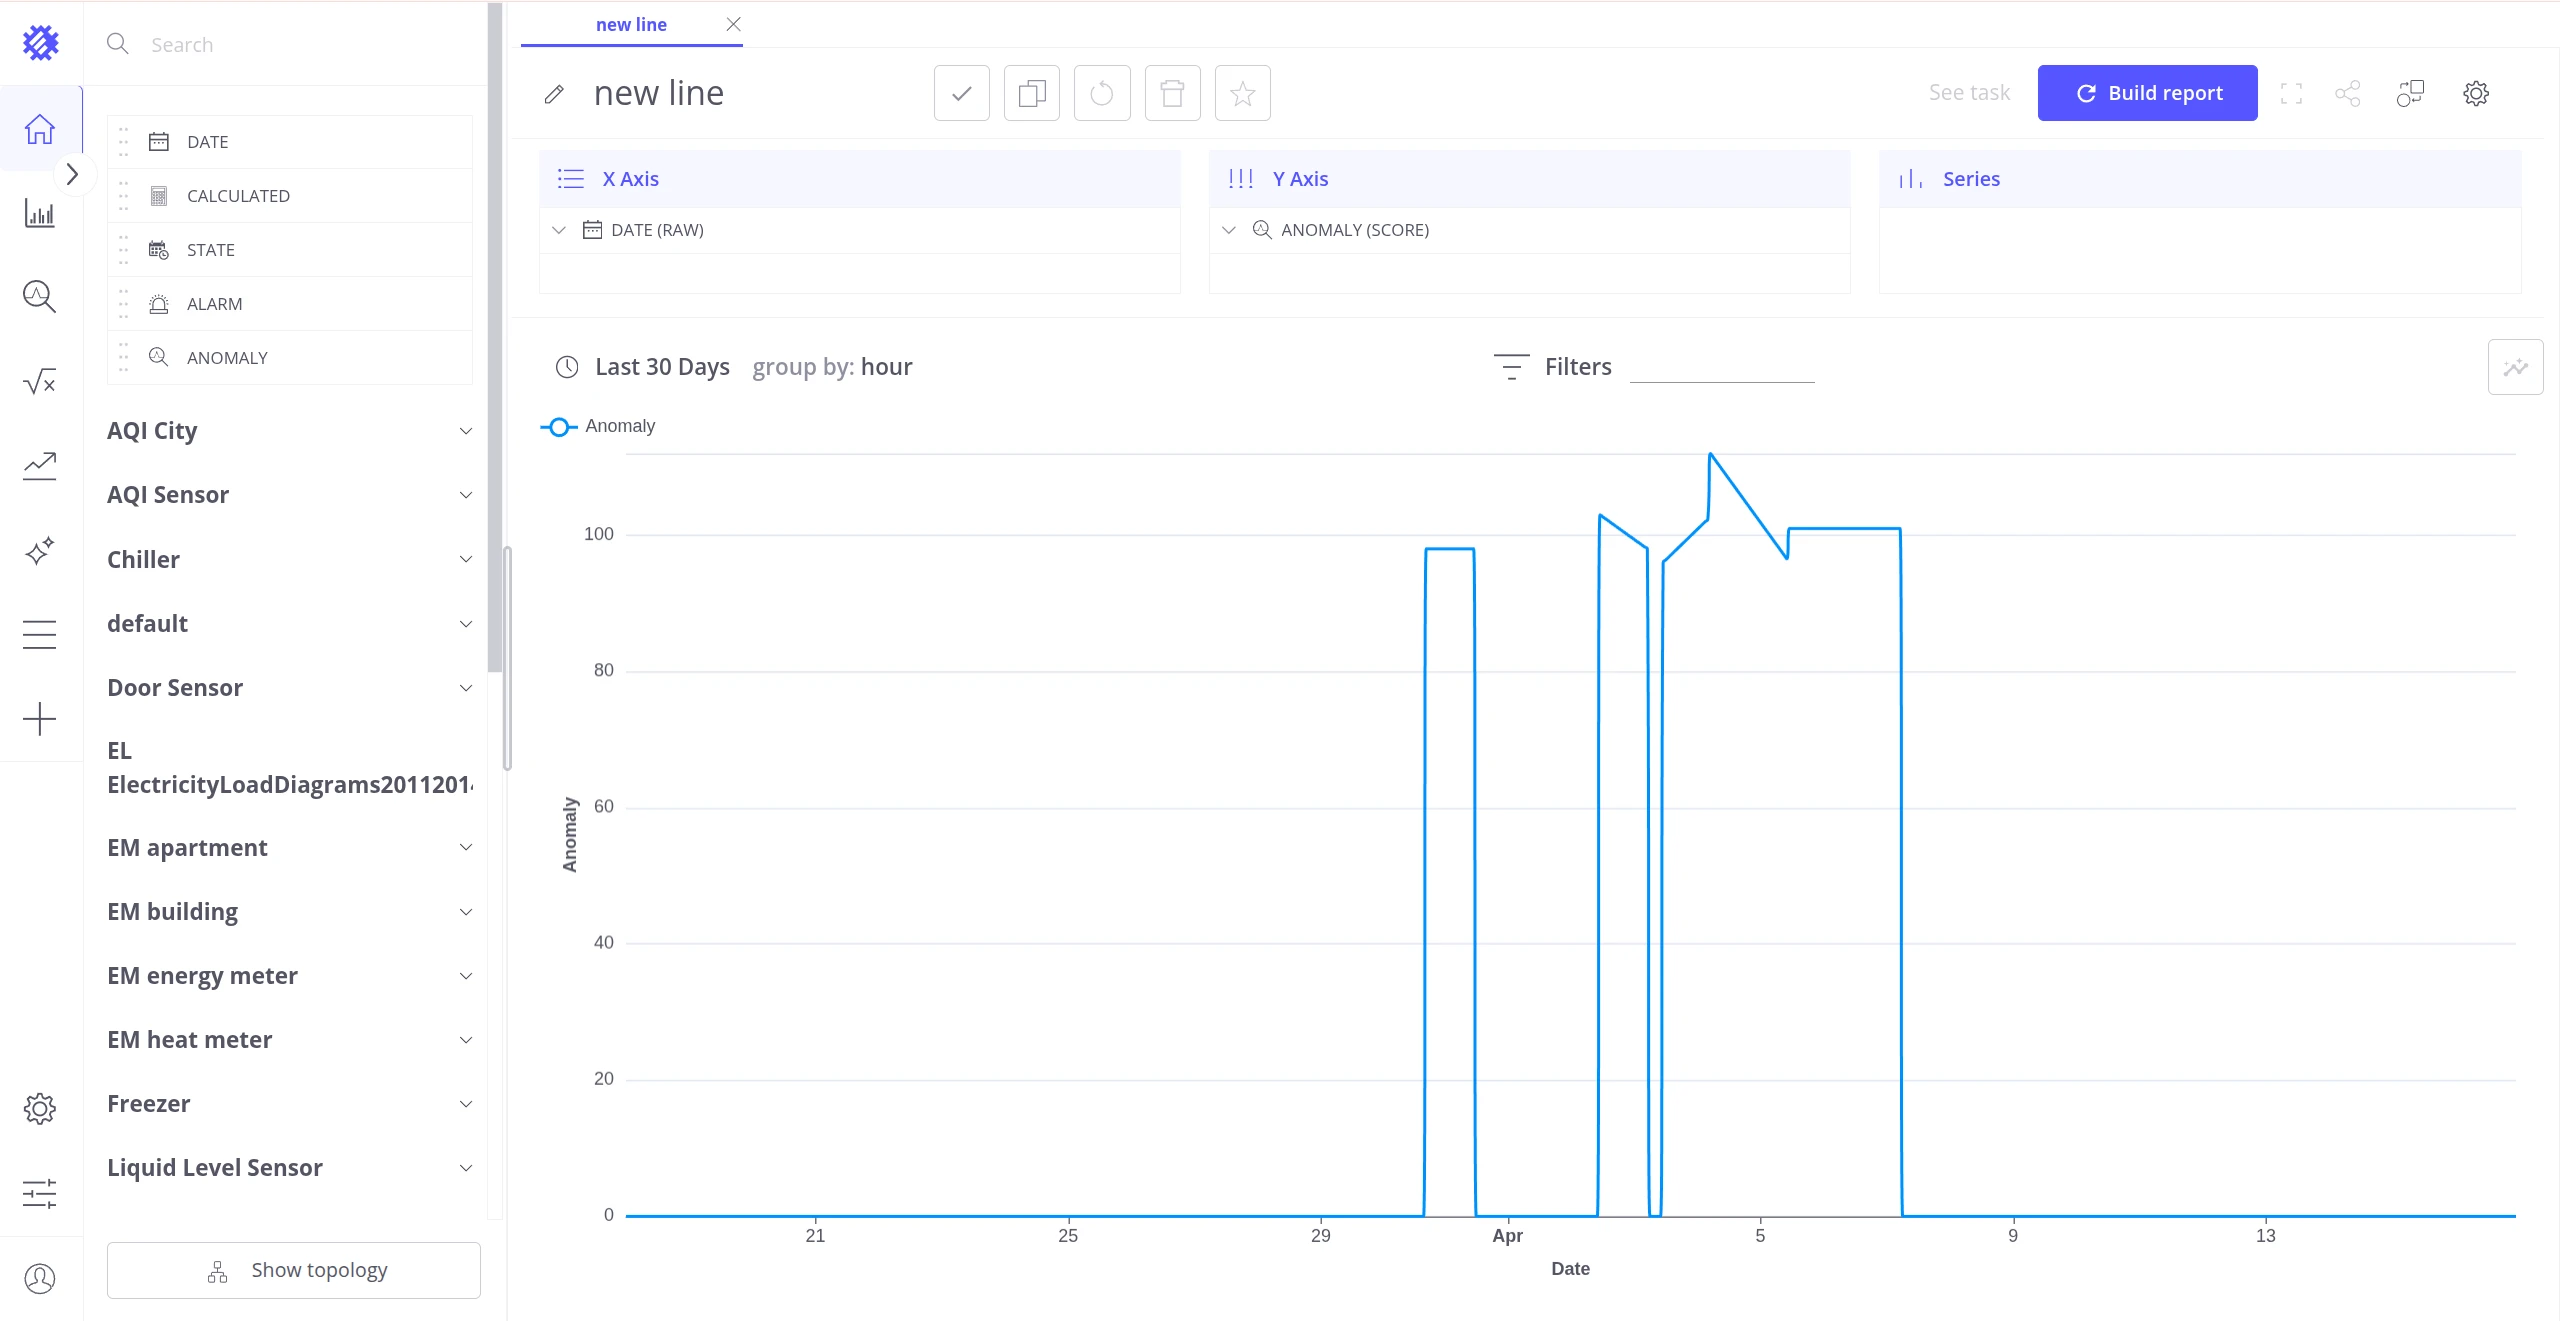
In any Trendz view, locate the ANOMALY field category in the left panel and drag a field onto the target axis. The following examples use a Line chart, but the same steps apply to any view type.
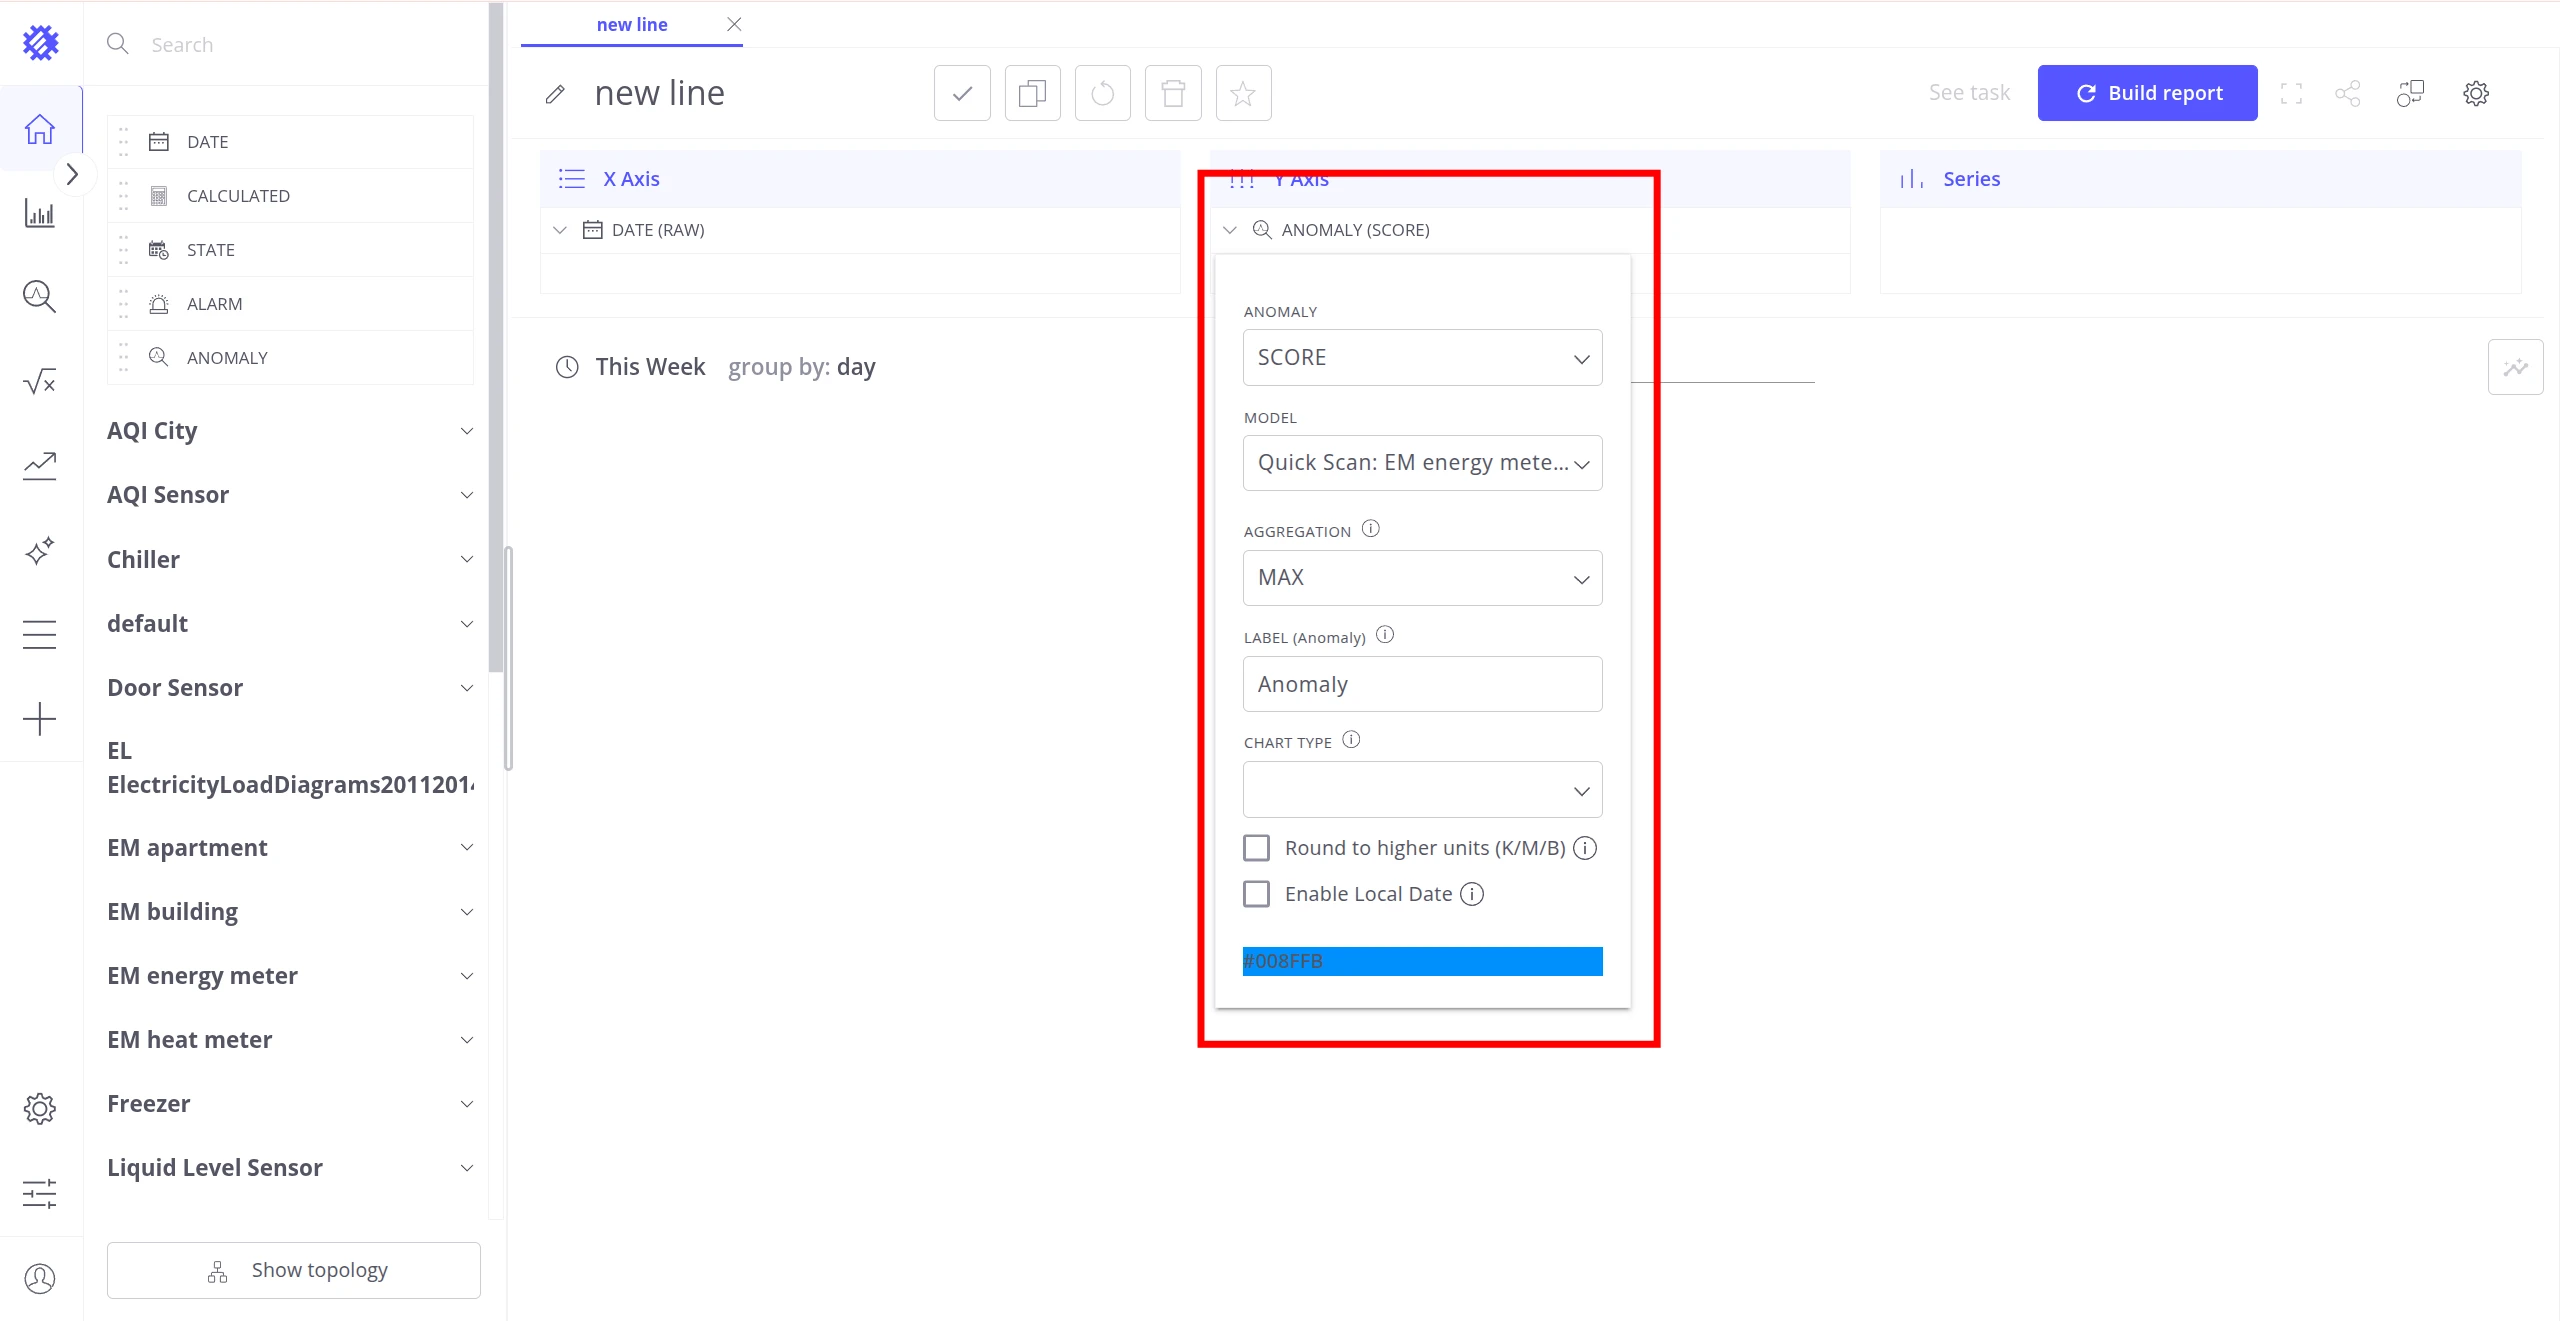
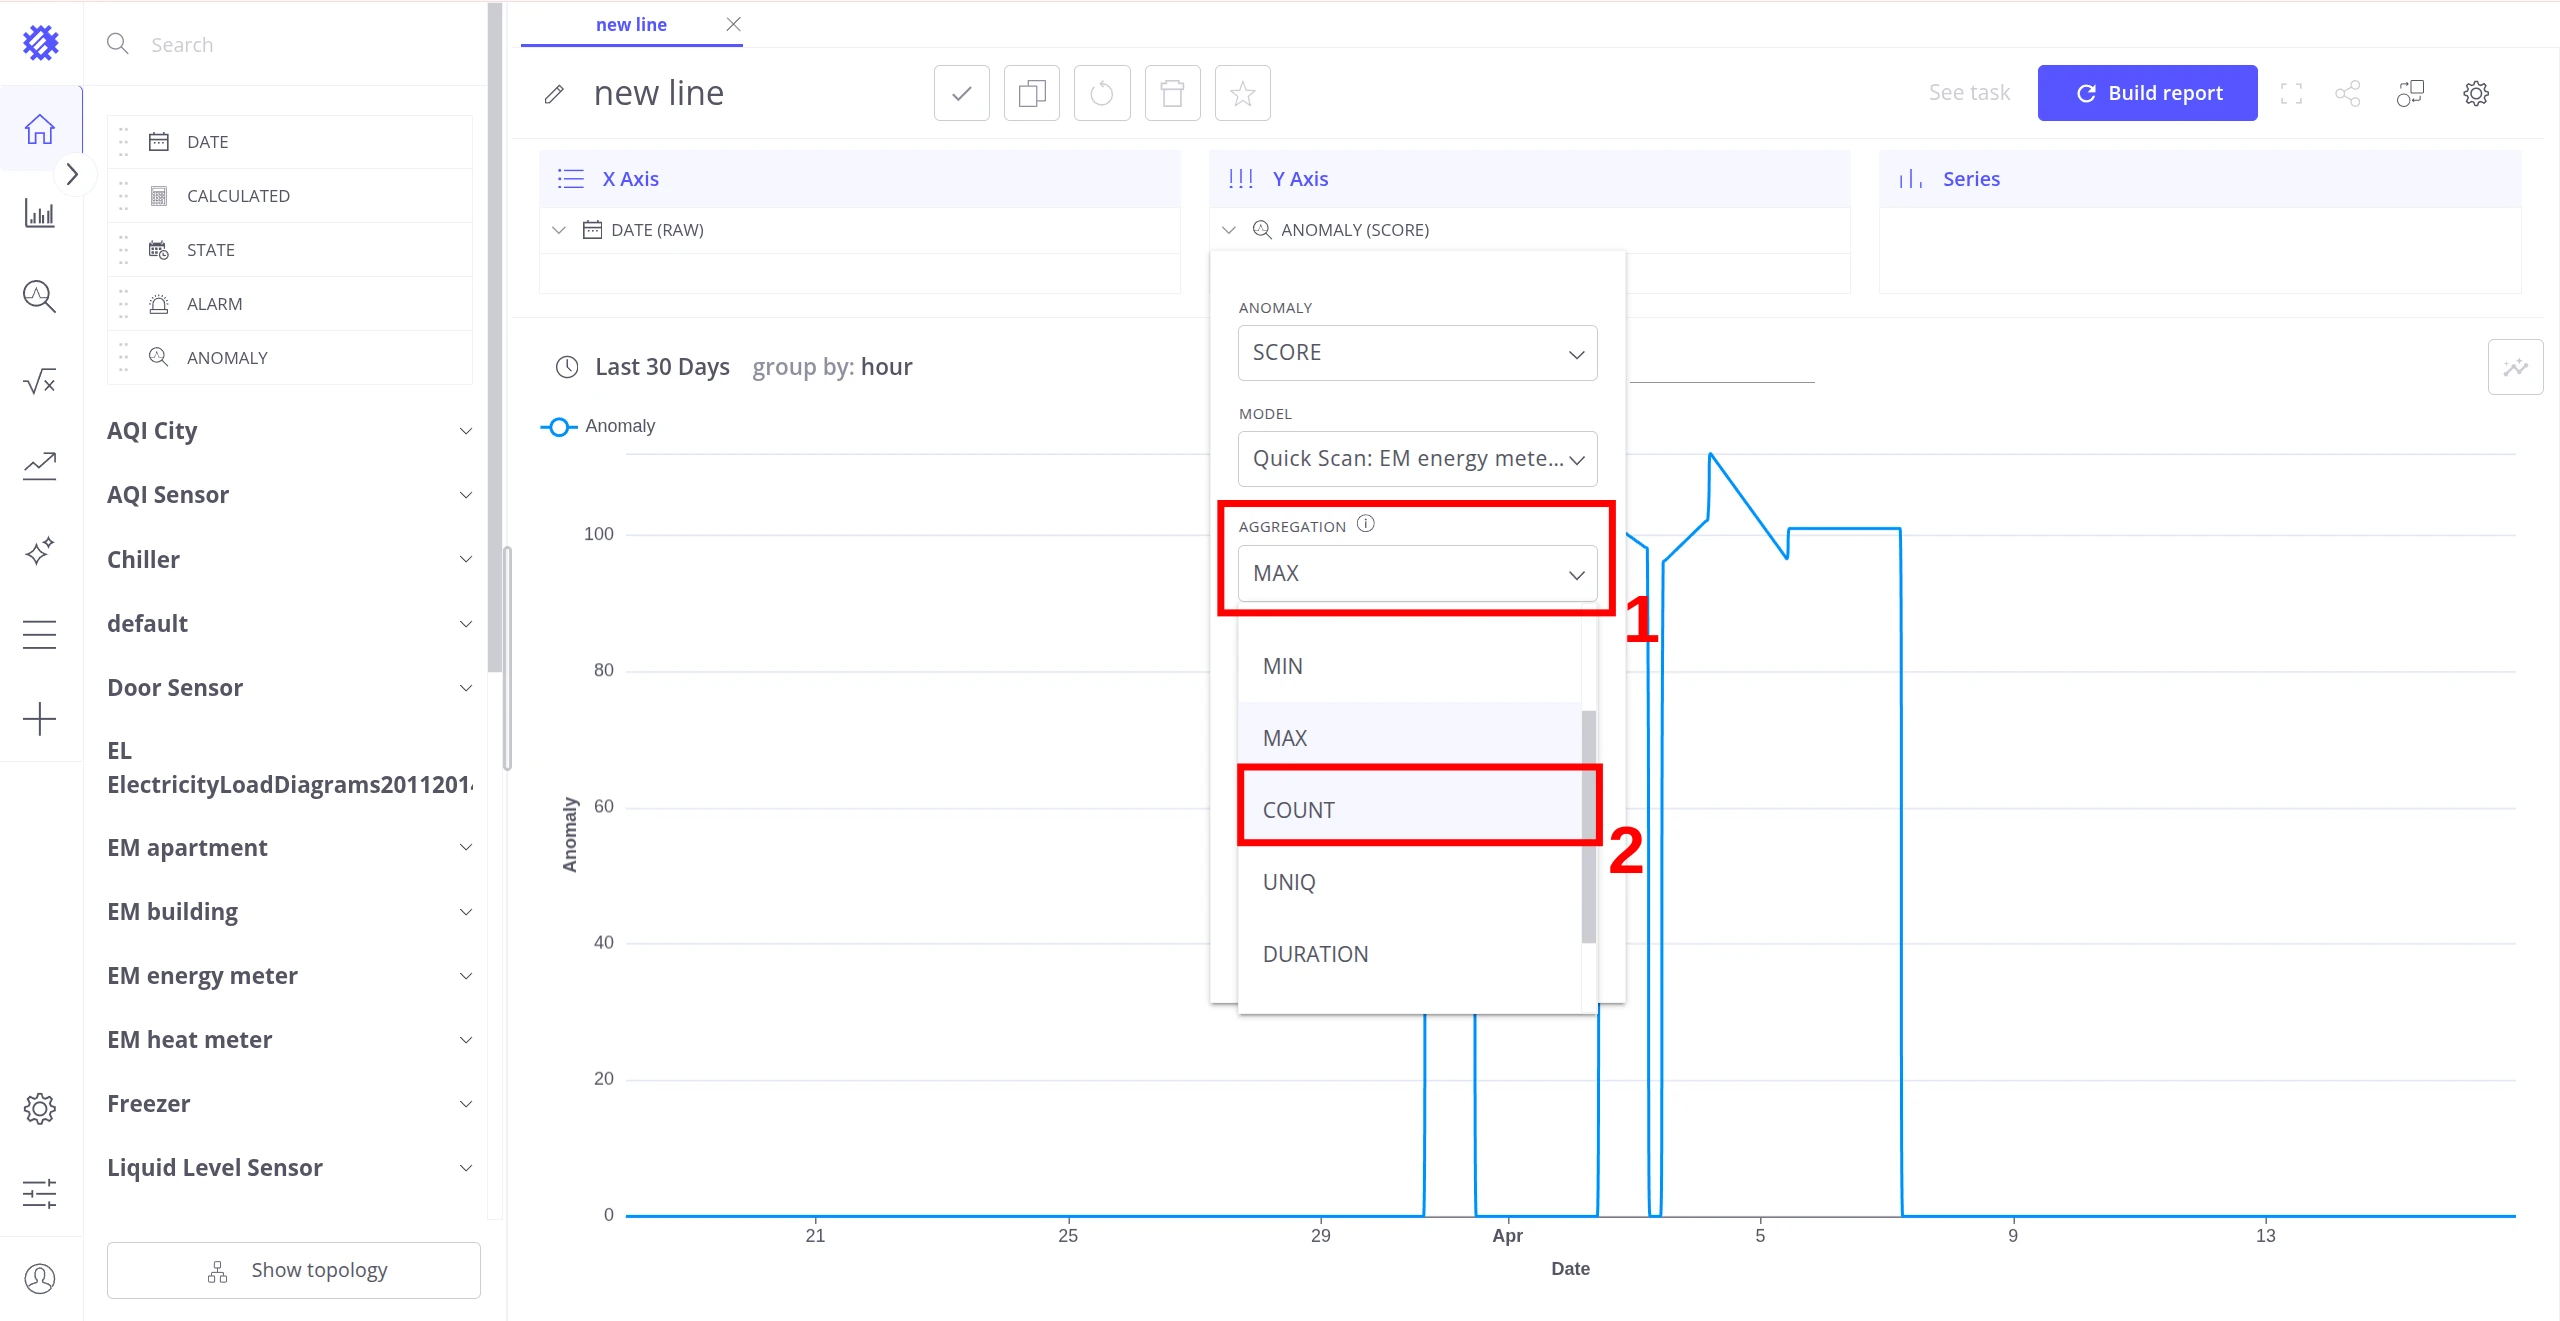
After dropping the field, a configuration popup opens. Set the Anomaly type, select the Model, choose an Aggregation, and enter a Label. Use MAX to capture peak anomaly intensity at each time point.
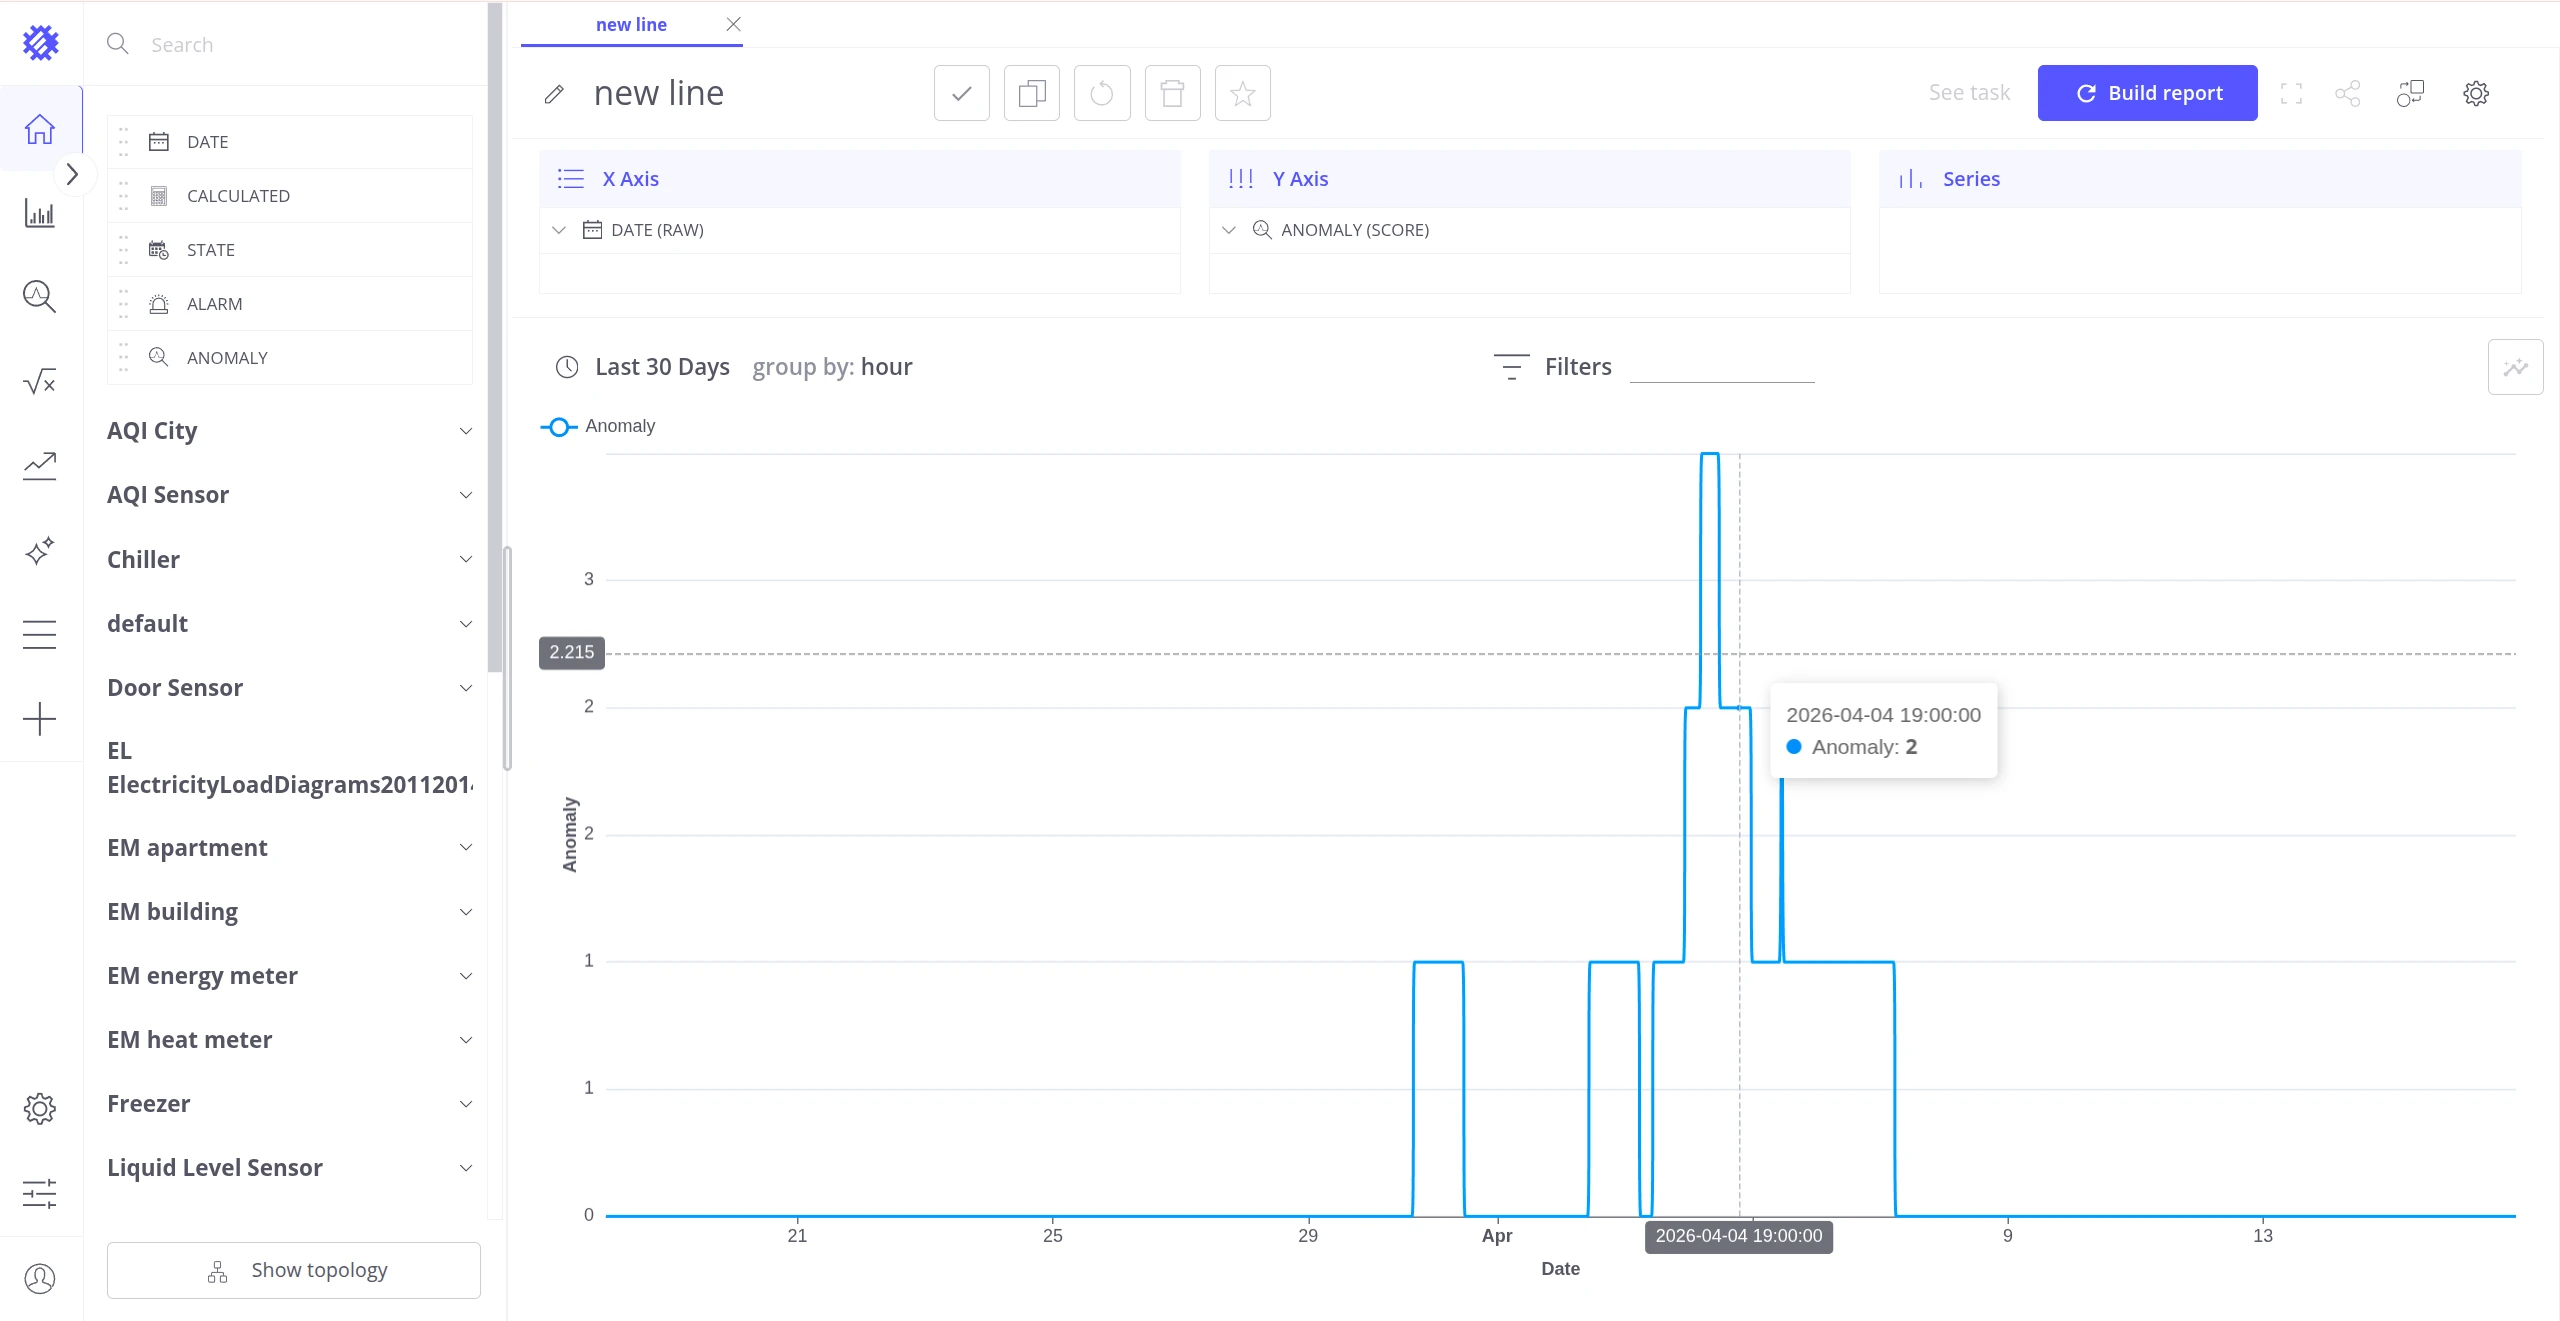
To count anomaly occurrences within each time bucket, change Aggregation to COUNT.
Field properties:
| Property | Options | Description |
|---|---|---|
| Anomaly | SCORE, SCORE_INDEX | Which metric to visualize. |
| Model | (list of READY models) | The anomaly model to source data from. |
| Aggregation | AVG, MIN, MAX, SUM, COUNT, LATEST, UNIQ | How values are combined across time or entities. |
| Label | text | Field name shown in the chart legend. |
| Chart Type | bar, line, area | Visual representation style. |
Aggregation guidance:
SCORE measures anomaly intensity at a point in time:
| Aggregation | Suitability |
|---|---|
MAX | Recommended — captures peak intensity |
LATEST | Recommended — shows the most recent value |
COUNT | Recommended — counts anomaly occurrences |
SUM, AVG, MIN, UNIQ | Not recommended — lose meaningful signal |
SCORE_INDEX measures cumulative anomaly impact over time:
| Aggregation | Suitability |
|---|---|
SUM | Recommended — shows total anomaly footprint |
COUNT | Recommended — counts anomaly occurrences |
UNIQ | Recommended |
LATEST | Recommended |
AVG, MIN | Acceptable but less sensitive |
Business Entity Fields
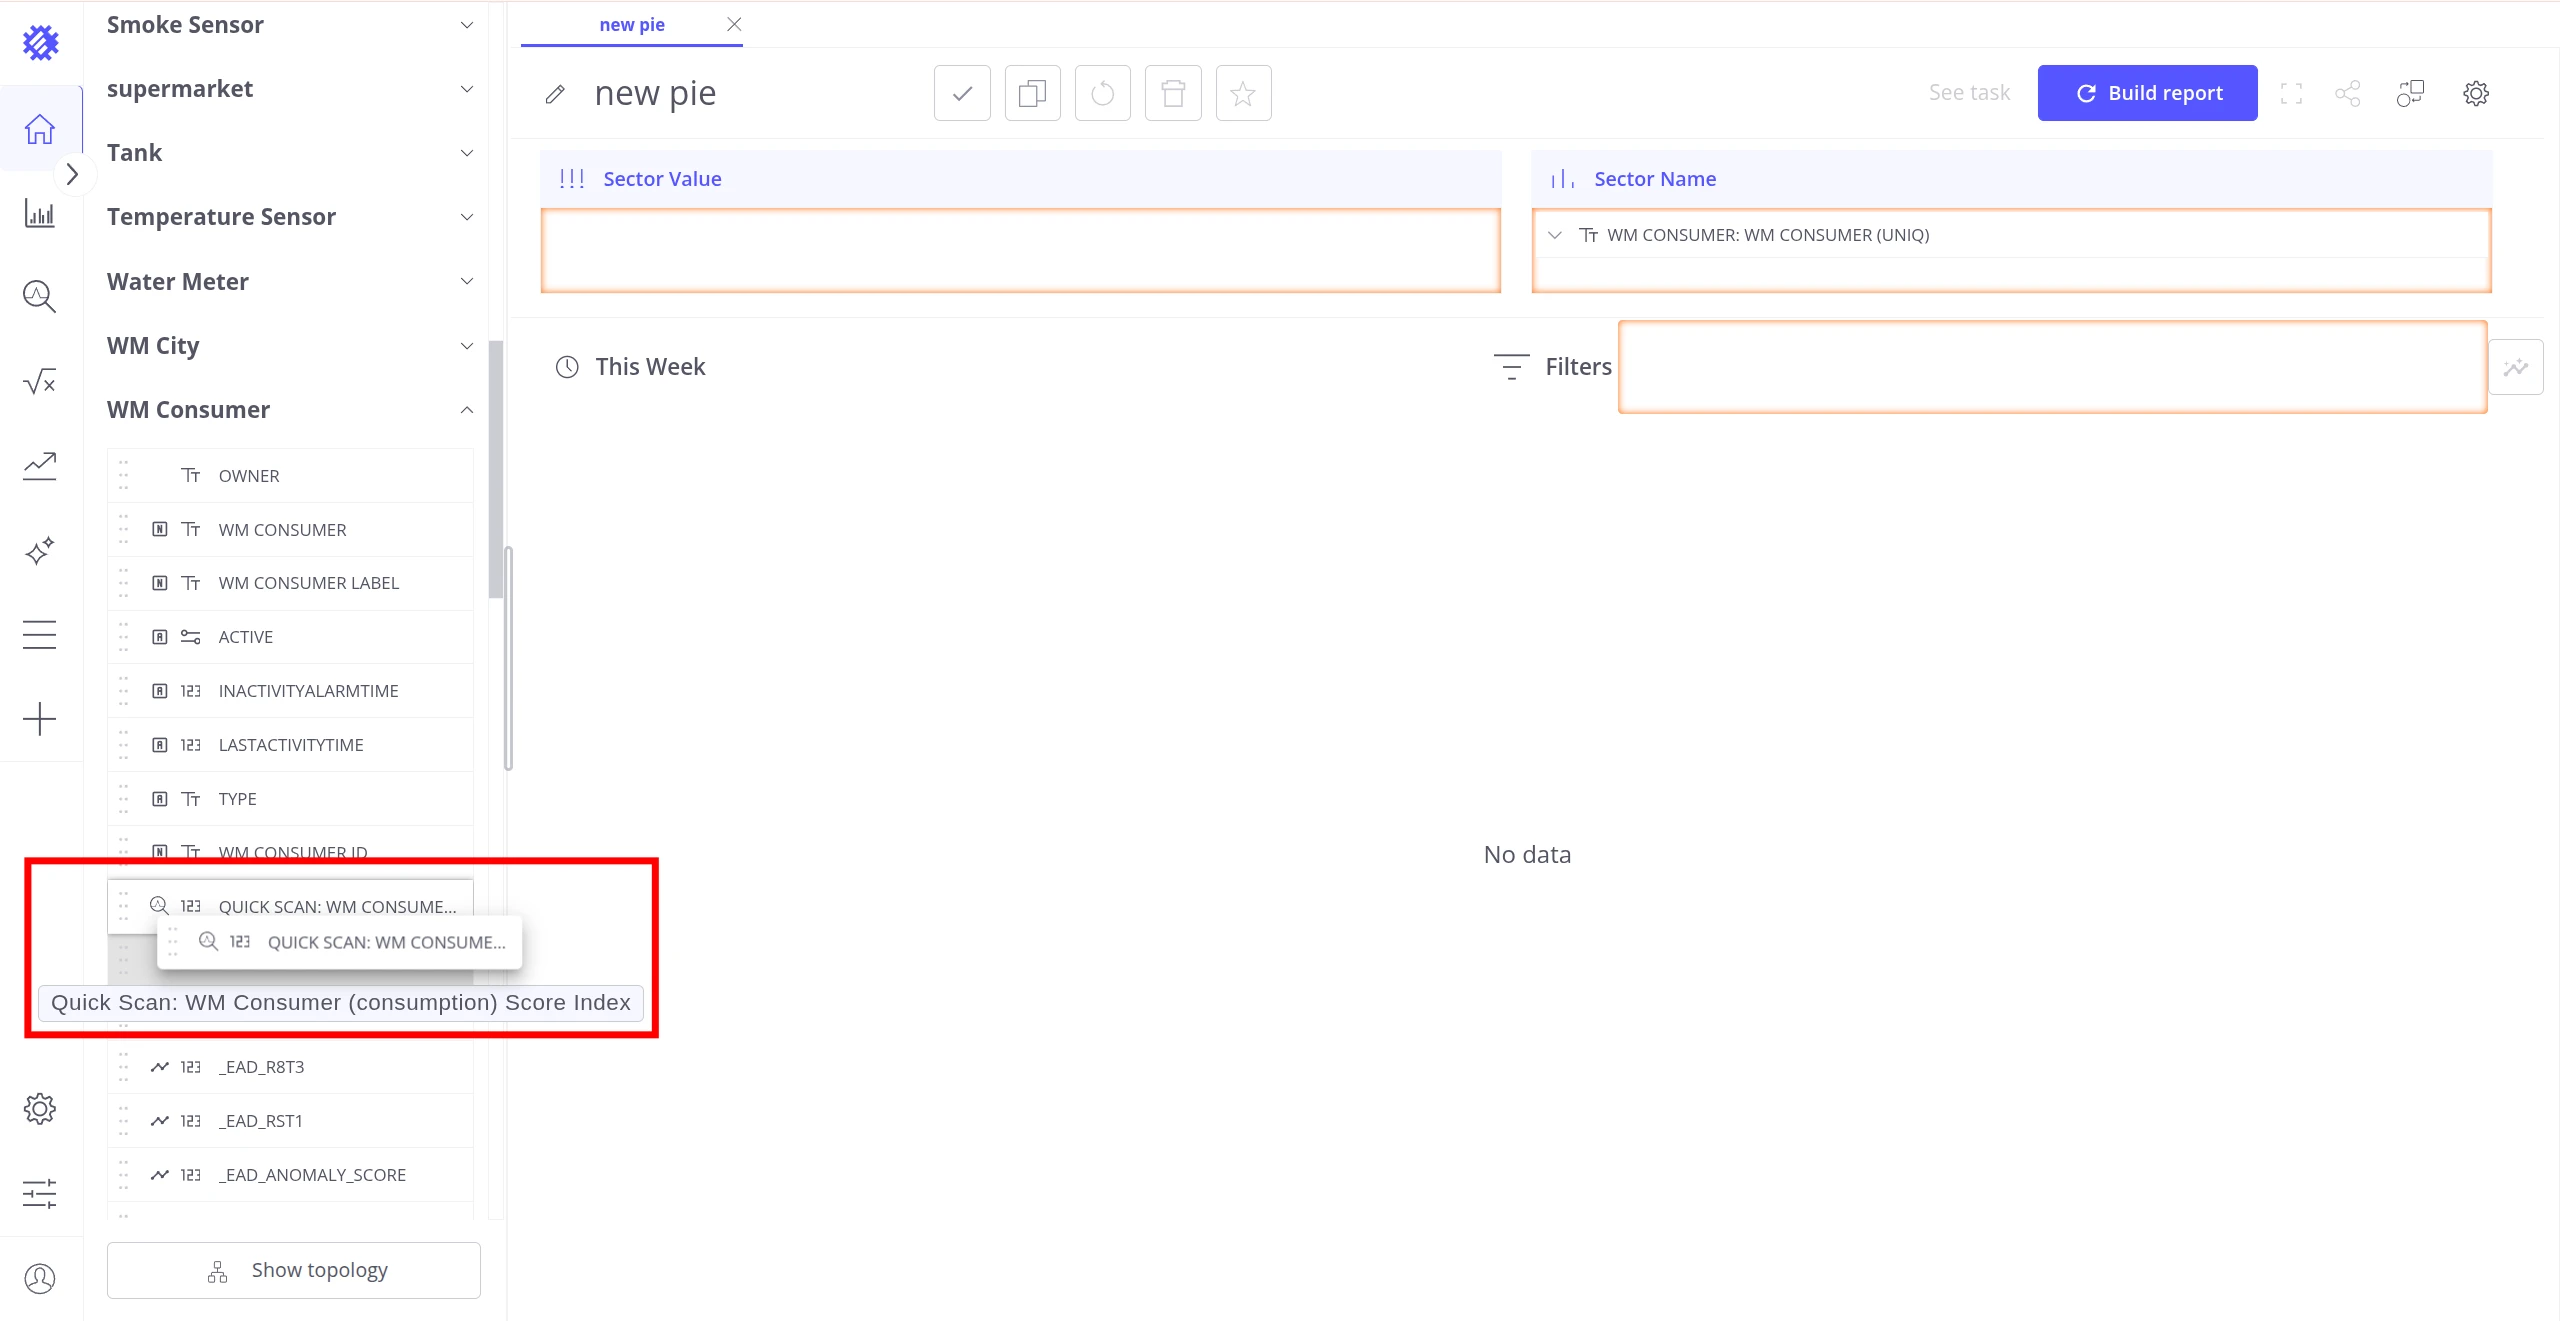
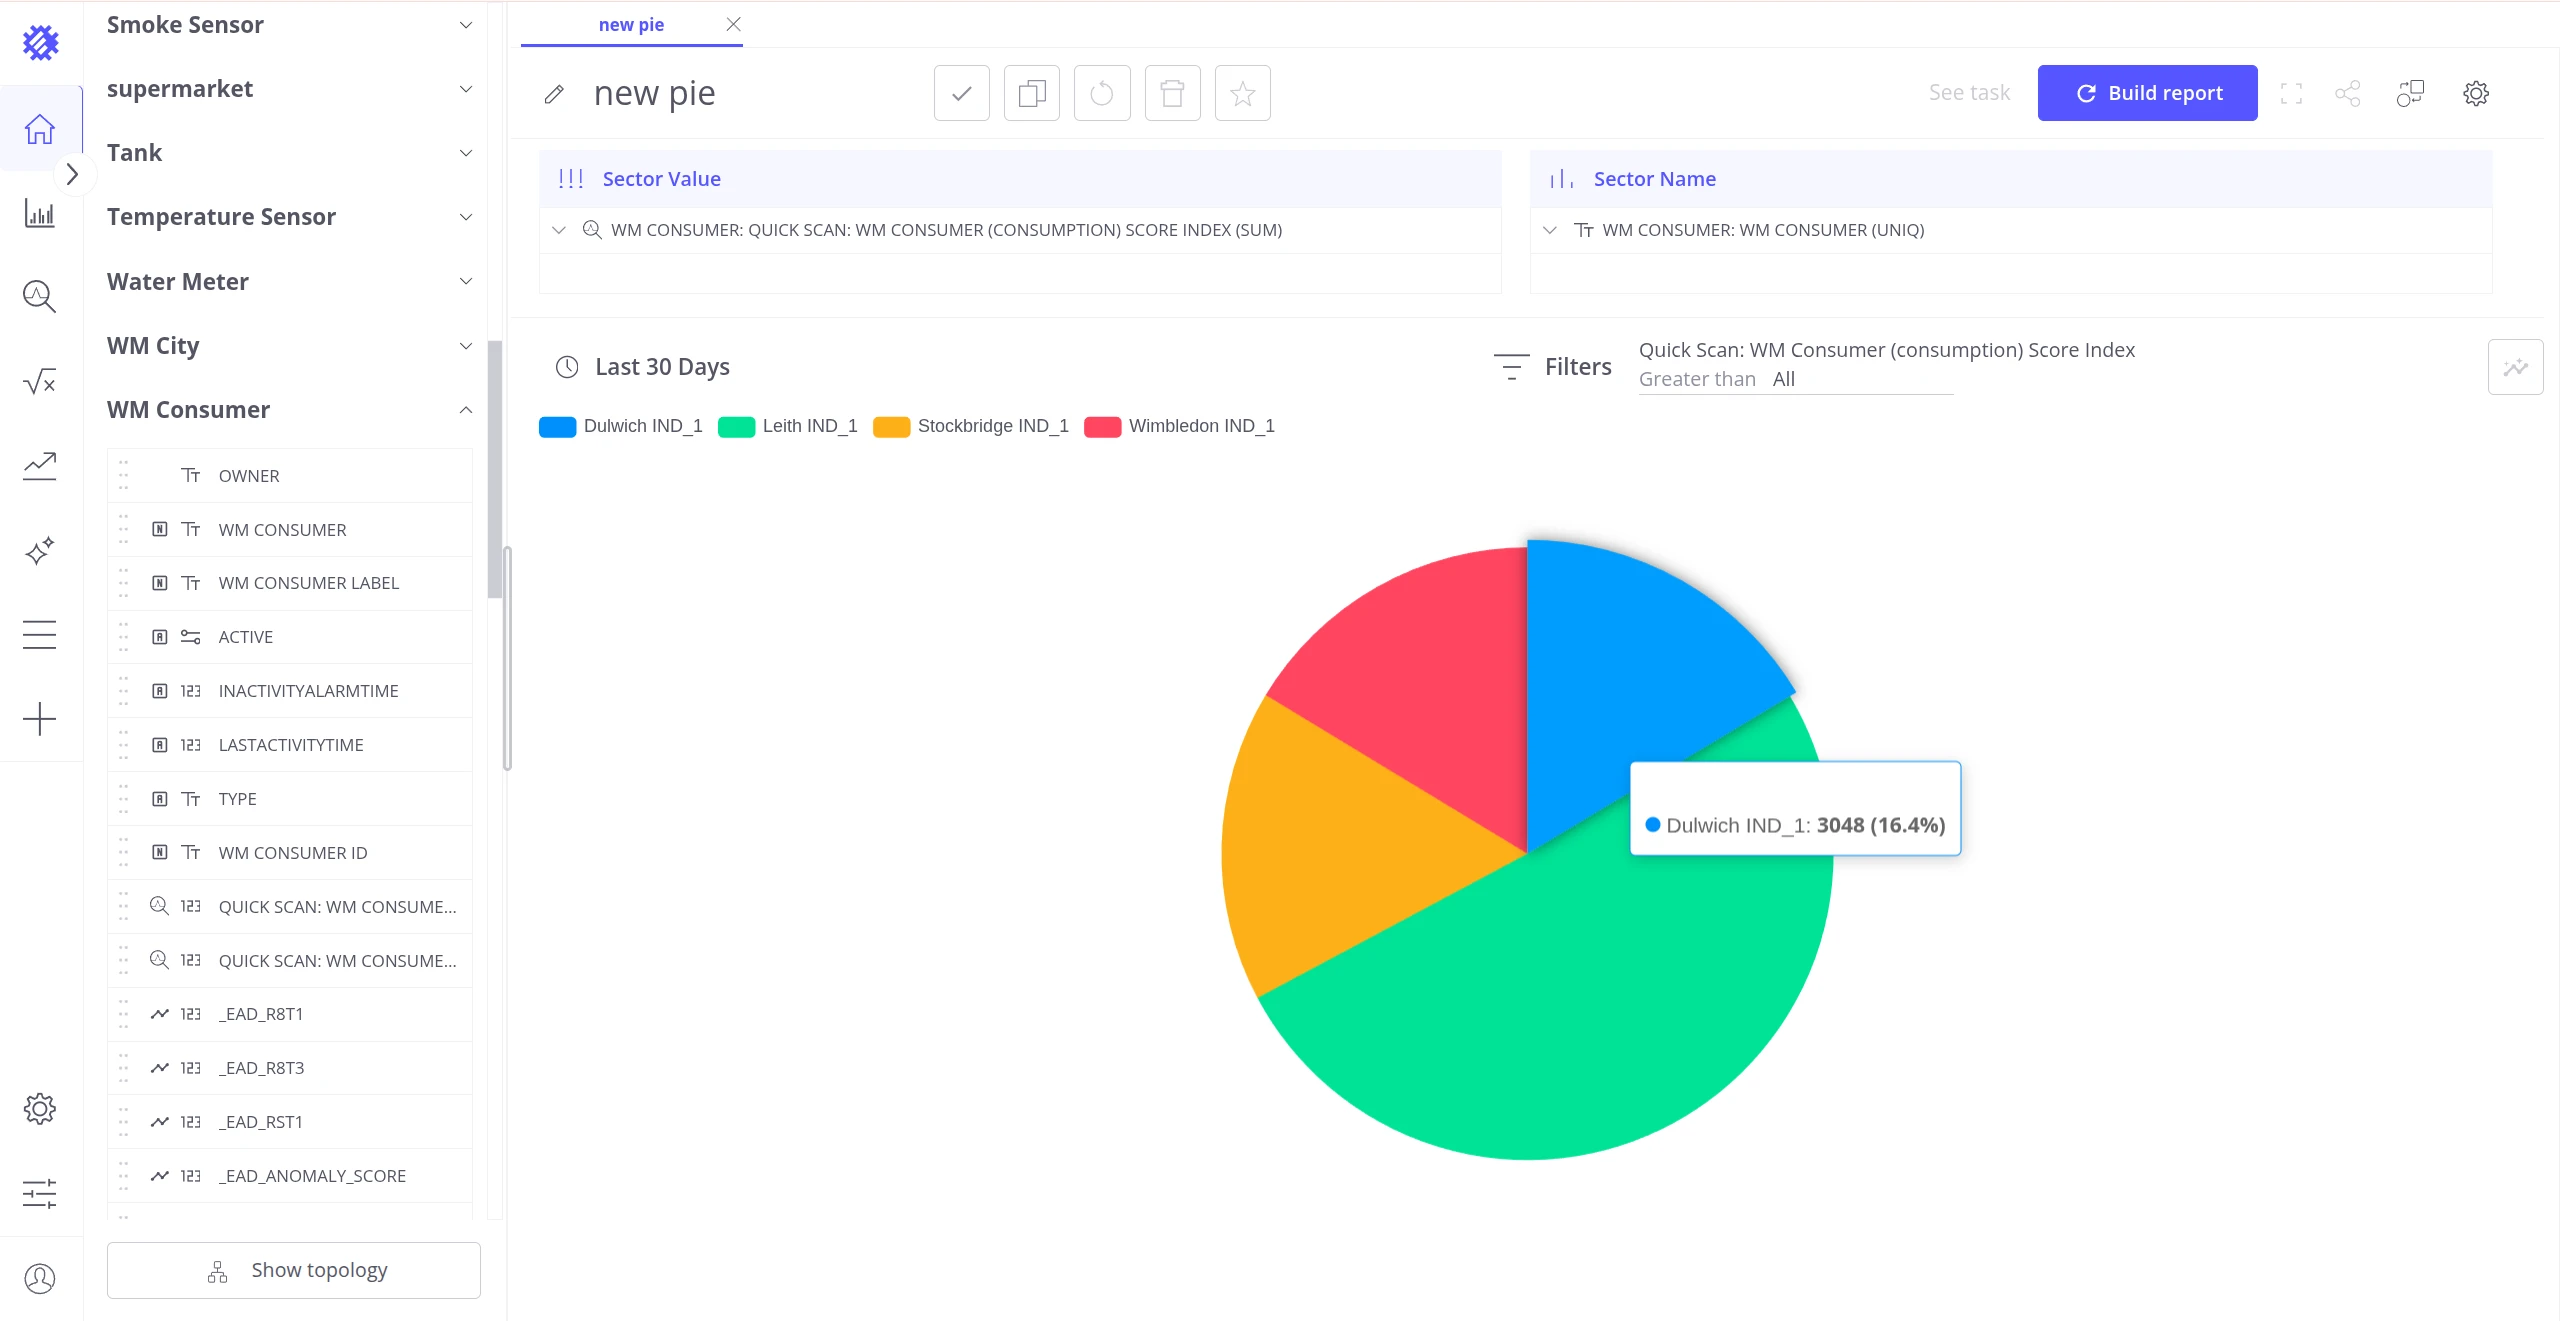
Section titled “Business Entity Fields”When anomaly score saving is enabled for the model, ThingsBoard stores anomaly scores as regular device telemetry. These can then be added to any Trendz view as Business Entity Fields — the same as any other telemetry key.
The saved anomaly fields appear in the left panel under their business entity, named after the model. They can be added to any view type the same way as any other telemetry field. The example below uses a Pie chart to compare score index totals across devices.
Choosing the right approach
Section titled “Choosing the right approach”| Goal | Use |
|---|---|
| Quick visualization with no configuration | Anomaly View |
| Build a flexible custom view across devices | Anomaly Fields |
| Count anomaly occurrences per time period | Anomaly Fields with COUNT aggregation |
| Visualize saved scores with precise control | Business Entity Fields |
Was this helpful?