Monitor message statistics
The message statistics dashboard lets you monitor the state of uplink (Edge → server) and downlink (server → Edge) message flows in real time. Use it to identify message backlogs, delivery failures, and queue lag before they affect data visibility on the server.
Import the dashboard
Section titled “Import the dashboard”-
Download the preconfigured dashboard file: uplink_downlink_edge_stats.json
-
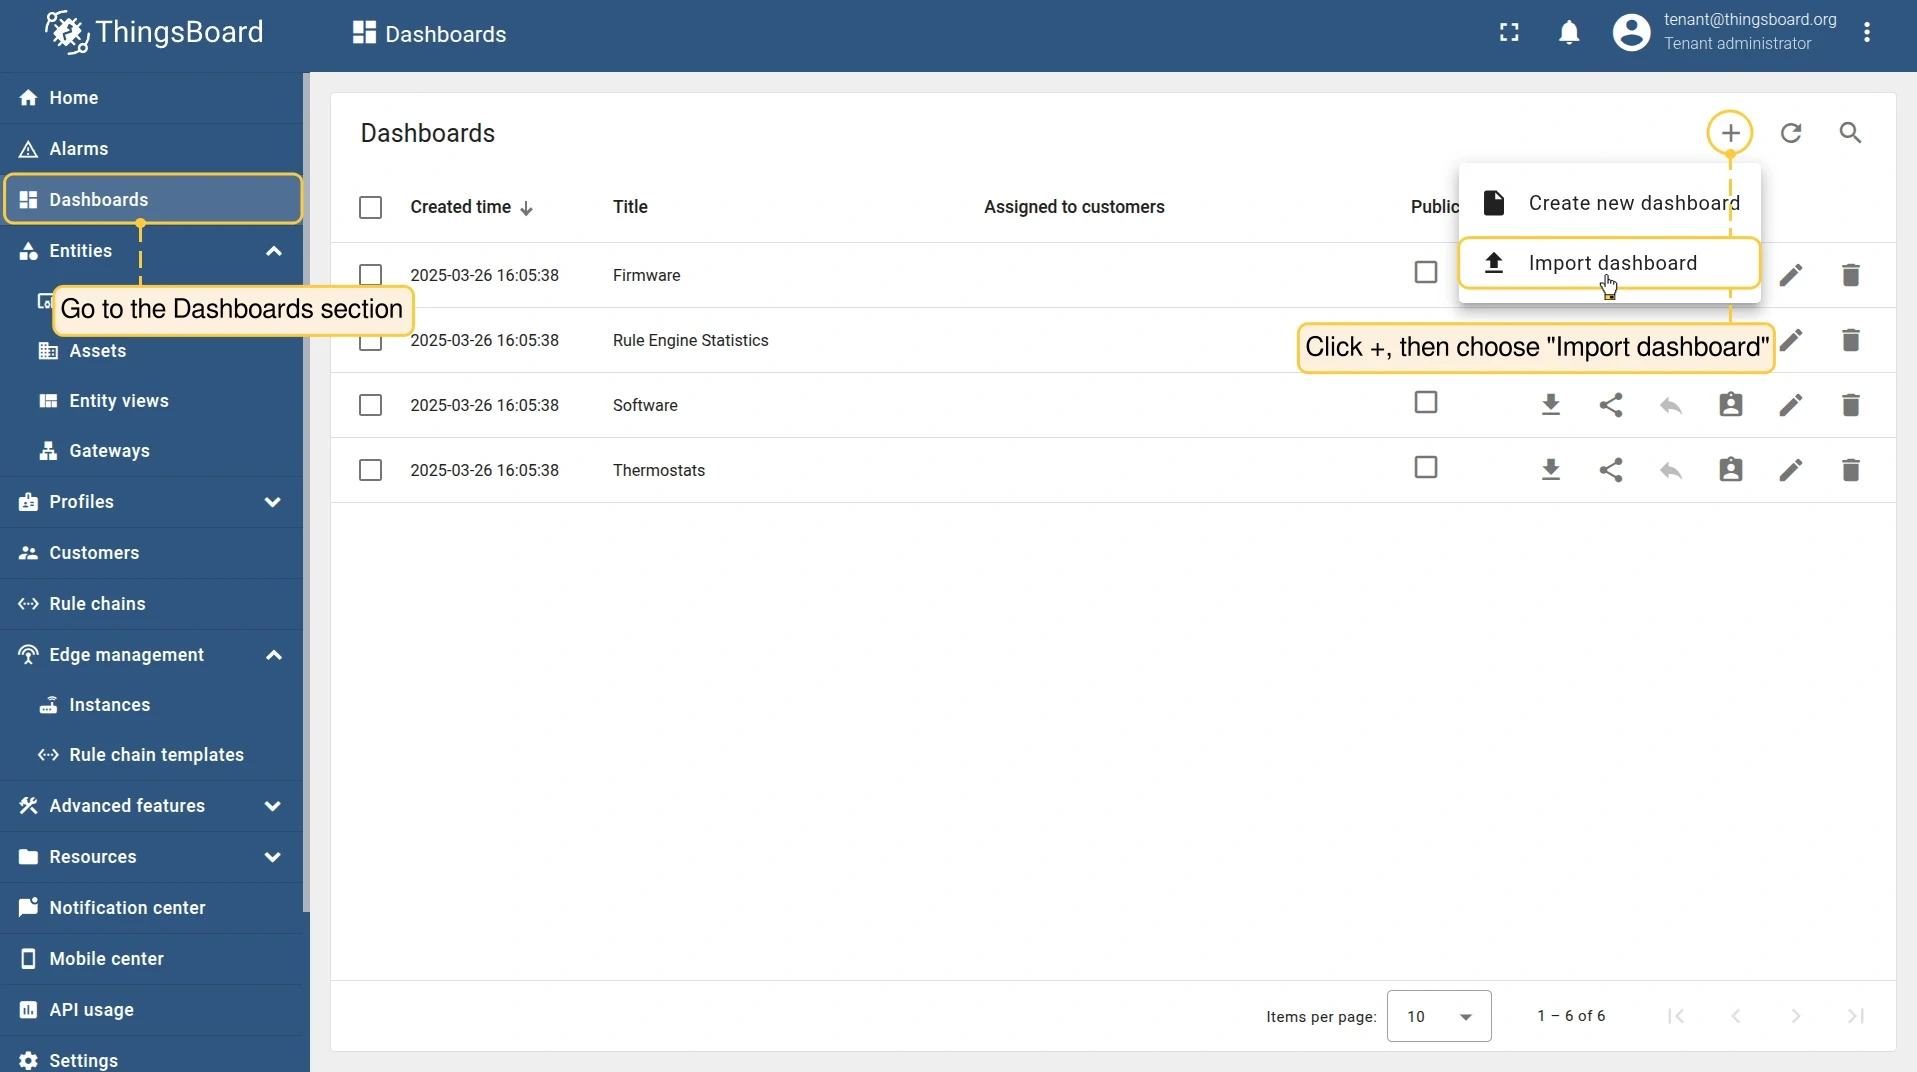
Log in to your ThingsBoard server and go to Dashboards.
-
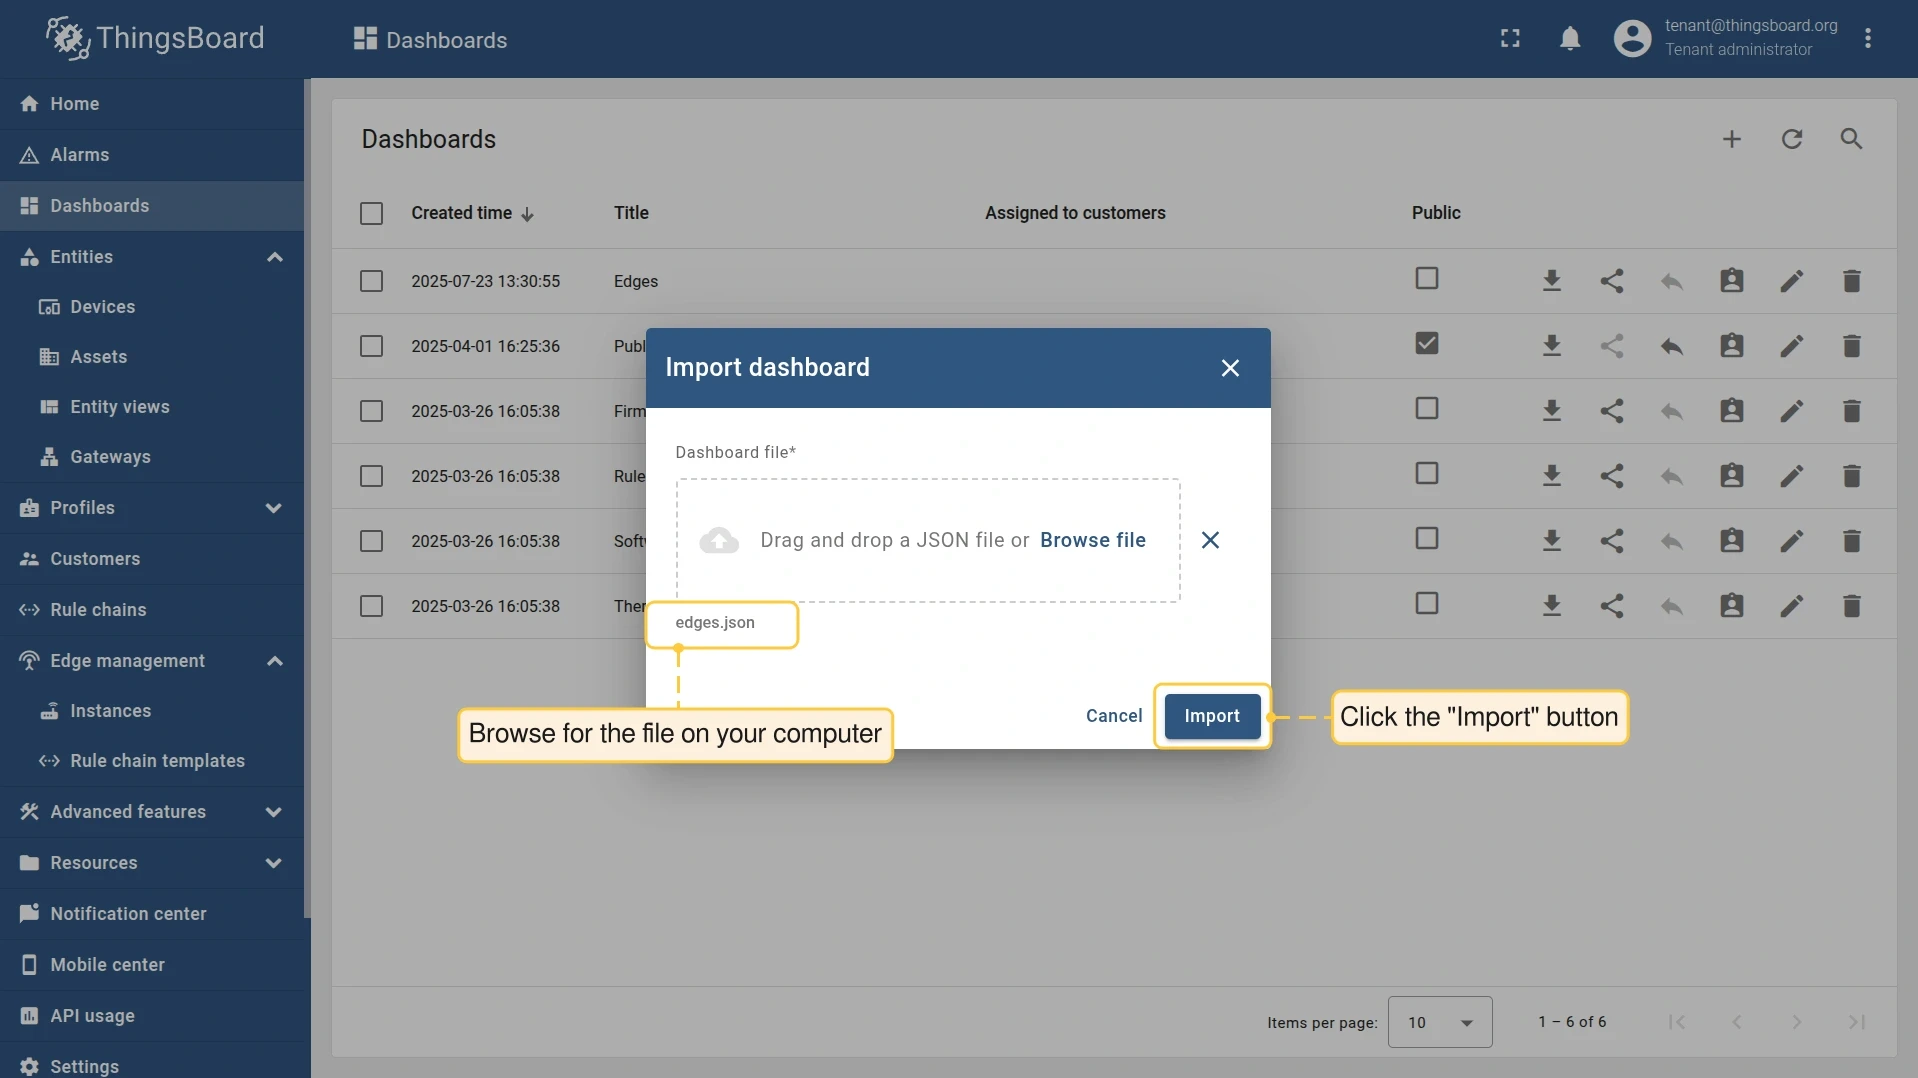
Click Add (+) and select Import dashboard. Browse for the downloaded
.jsonfile and click Import.
Telemetry keys
Section titled “Telemetry keys”ThingsBoard Edge exposes the following telemetry keys on the Edge entity. These keys power the dashboard widgets and can also be queried directly or used in rule chains.
Uplink (Edge → server)
Section titled “Uplink (Edge → server)”| Key | Description |
|---|---|
uplinkMsgsAdded | Messages added to the uplink queue |
uplinkMsgsPushed | Messages successfully delivered to the server |
uplinkMsgsPermanentlyFailed | Messages that failed and will not be retried |
uplinkMsgsTmpFailed | Messages that failed temporarily (e.g., network issue) and will be retried |
uplinkMsgsLag | Messages remaining in the queue — a sustained non-zero value indicates a backlog |
Downlink (server → Edge)
Section titled “Downlink (server → Edge)”| Key | Description |
|---|---|
downlinkMsgsAdded | Messages added to the downlink queue |
downlinkMsgsPushed | Messages successfully delivered to Edge |
downlinkMsgsPermanentlyFailed | Messages that failed and will not be retried |
downlinkMsgsTmpFailed | Messages that failed temporarily and will be retried |
downlinkMsgsLag | Messages remaining in the queue — a sustained non-zero value indicates a backlog |
A rising *MsgsLag value means messages are accumulating faster than they are delivered. Check network connectivity and Edge resource usage if this occurs.
Was this helpful?