Create a dashboard and send telemetry
A dashboard in ThingsBoard is a configurable interface for monitoring and managing devices in real time. In this step, you will create a dashboard directly in the Edge UI, add a widget to visualize telemetry, and send data to confirm it works.
Create a dashboard and add a widget
Section titled “Create a dashboard and add a widget”-
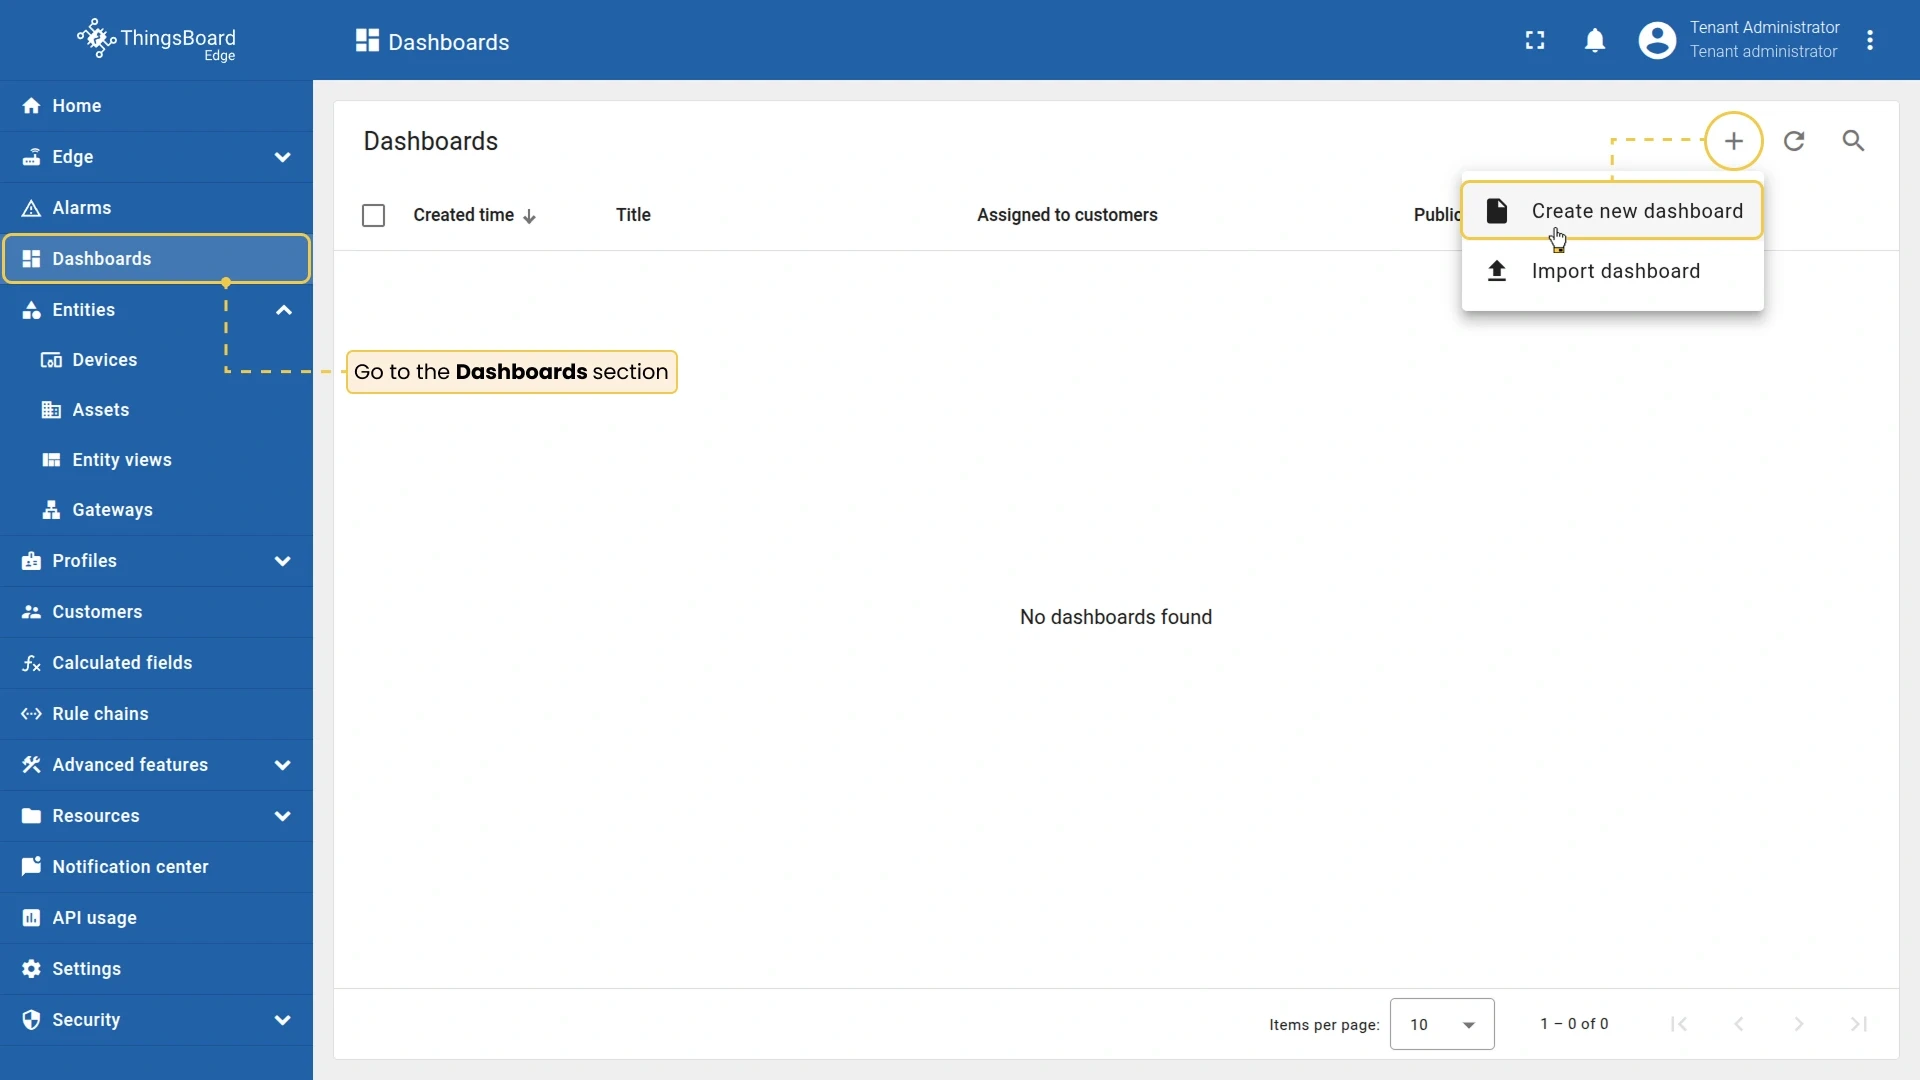
In the Edge UI (http://localhost:8080), go to Dashboards and click Add dashboard (+) ⇾ Create new dashboard.
-
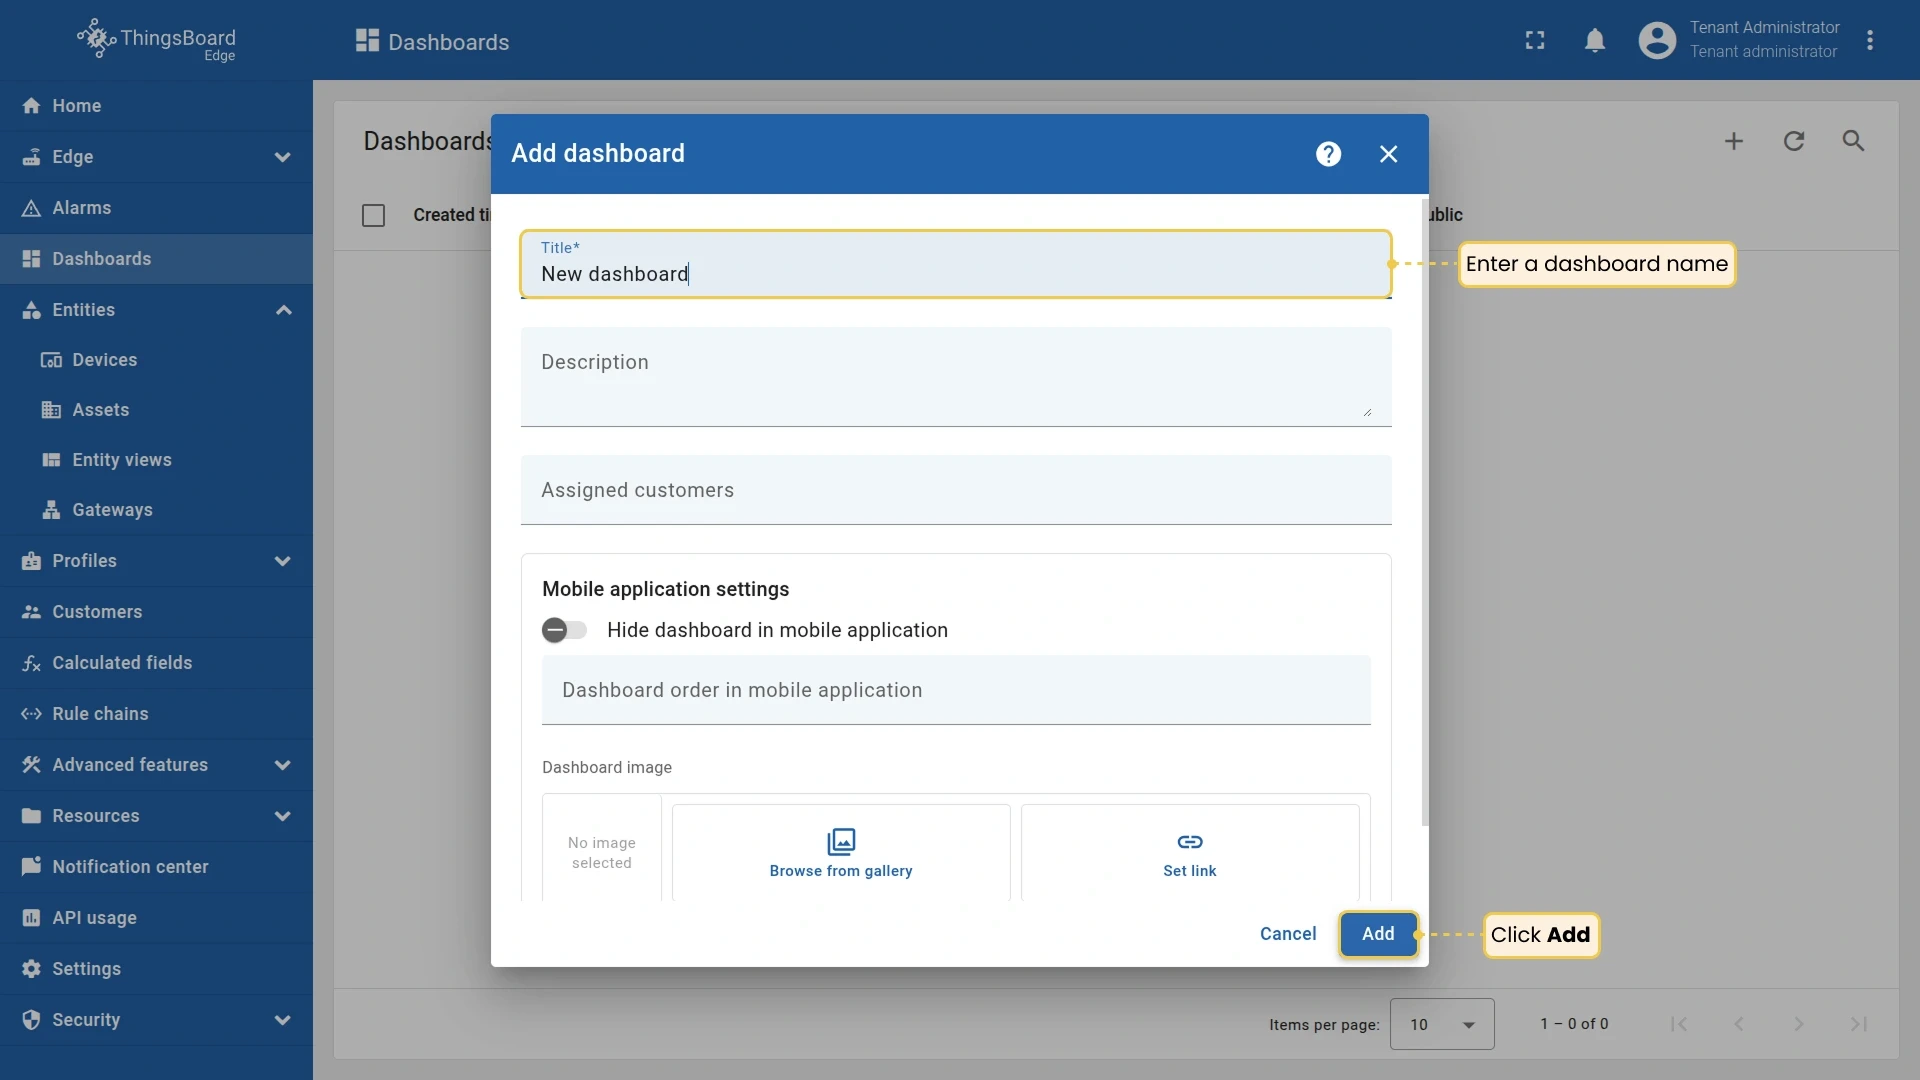
Enter a name and click Add. The dashboard opens in edit mode.
-
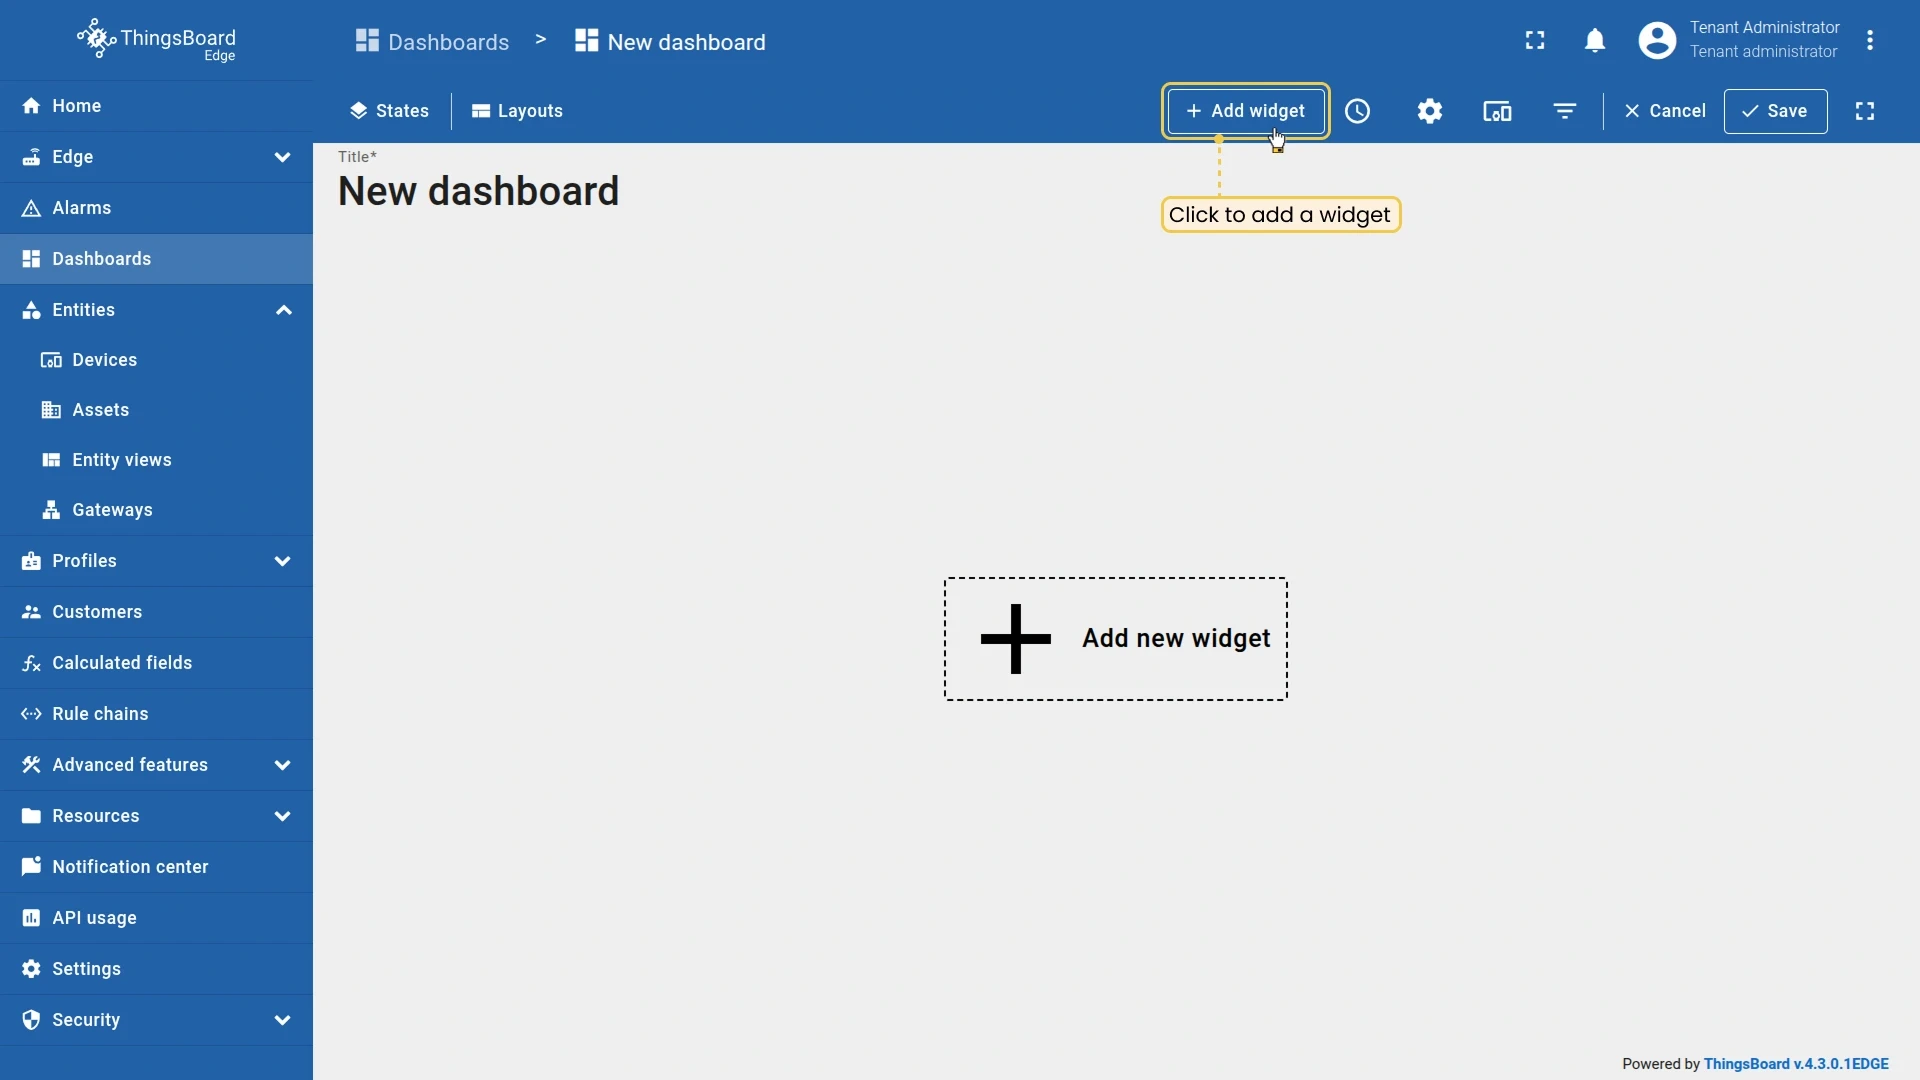
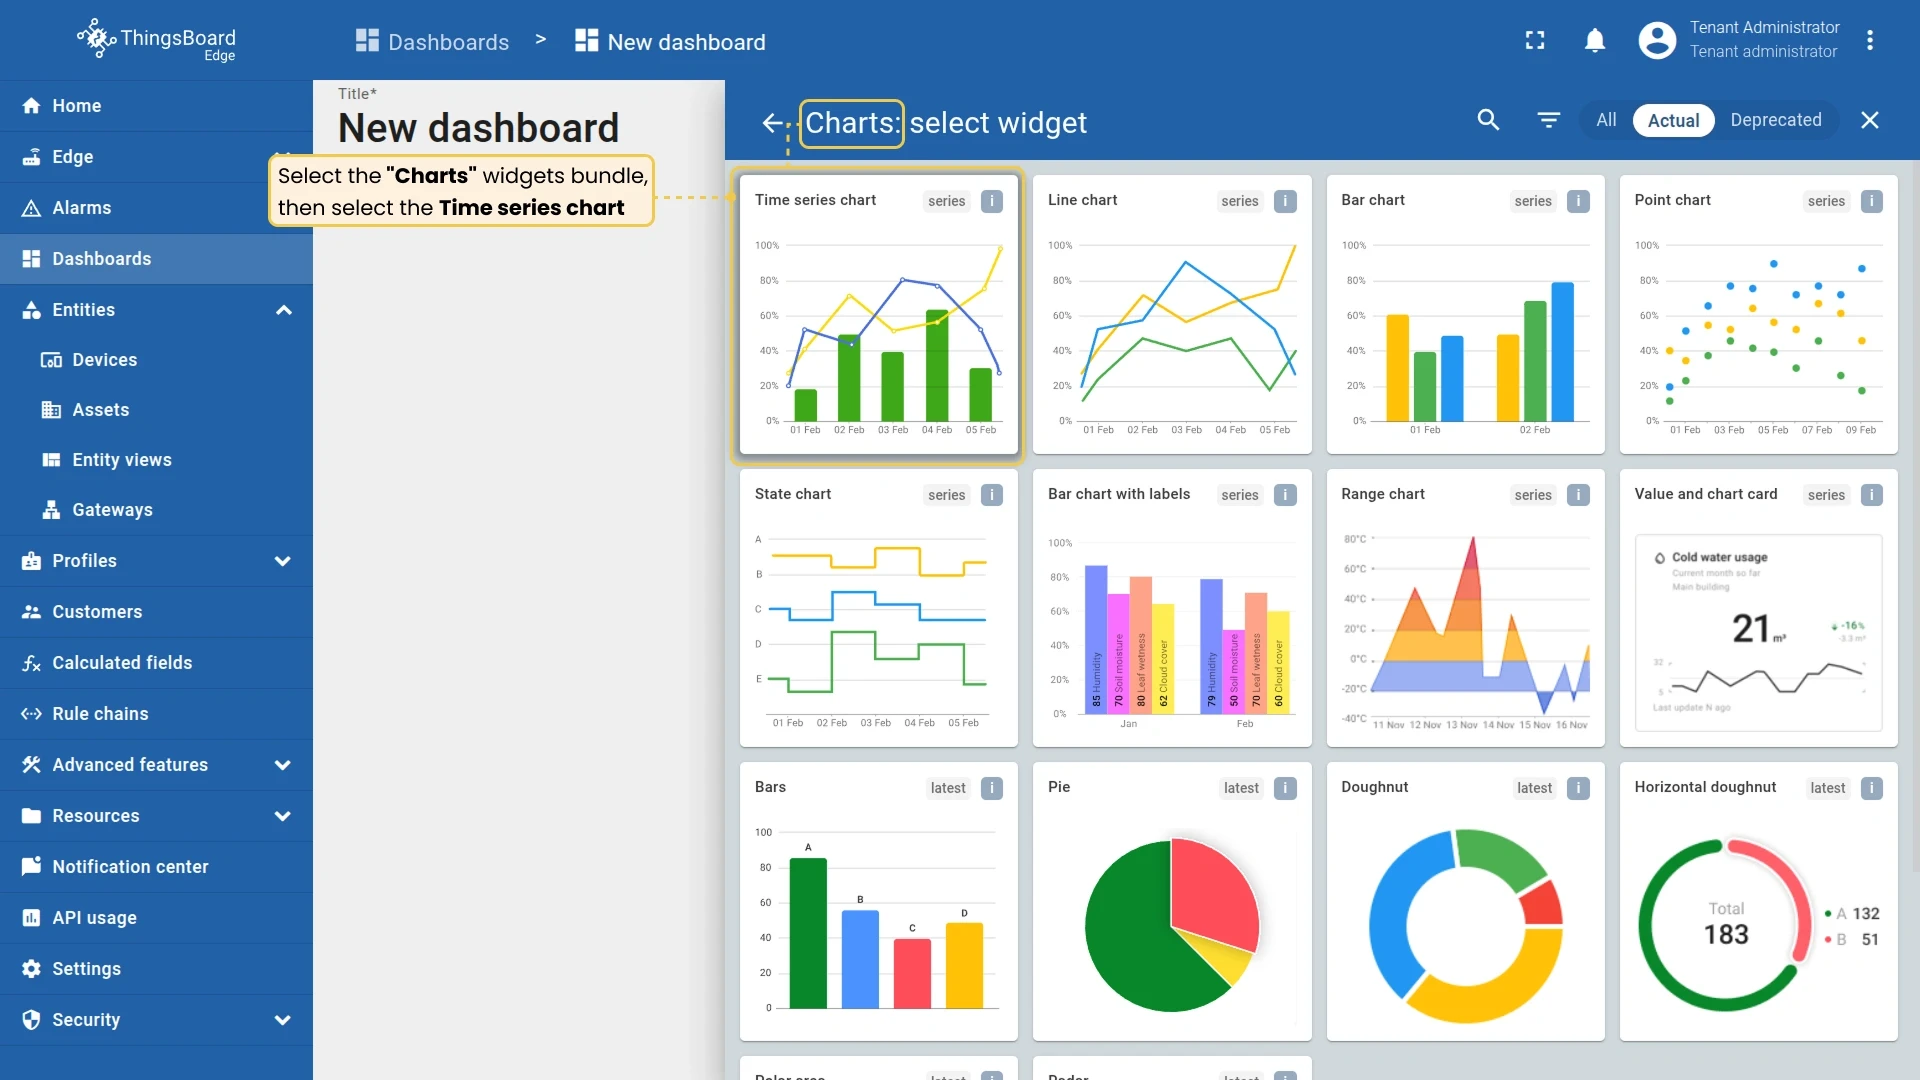
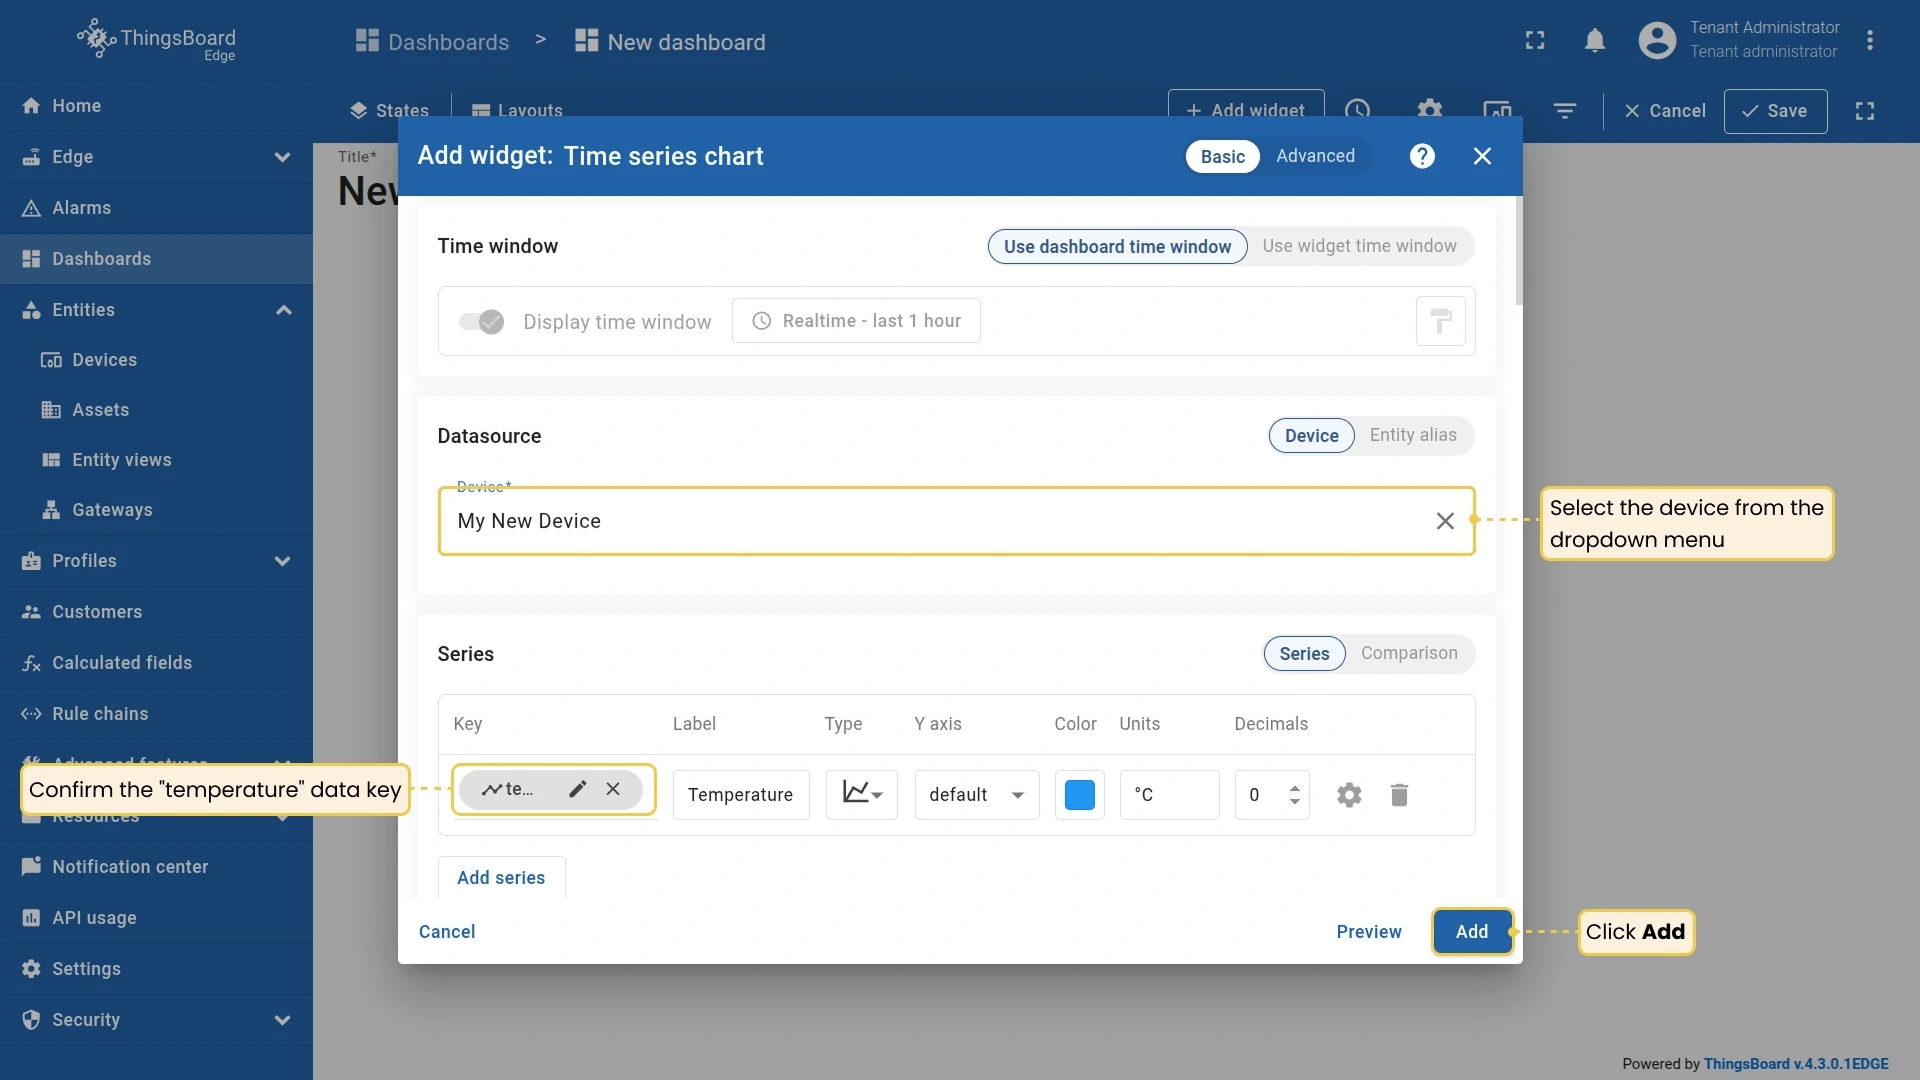
Click Add widget, select Charts ⇾ Time series chart, set your device as the entity and
temperatureas the series key, then click Add. -
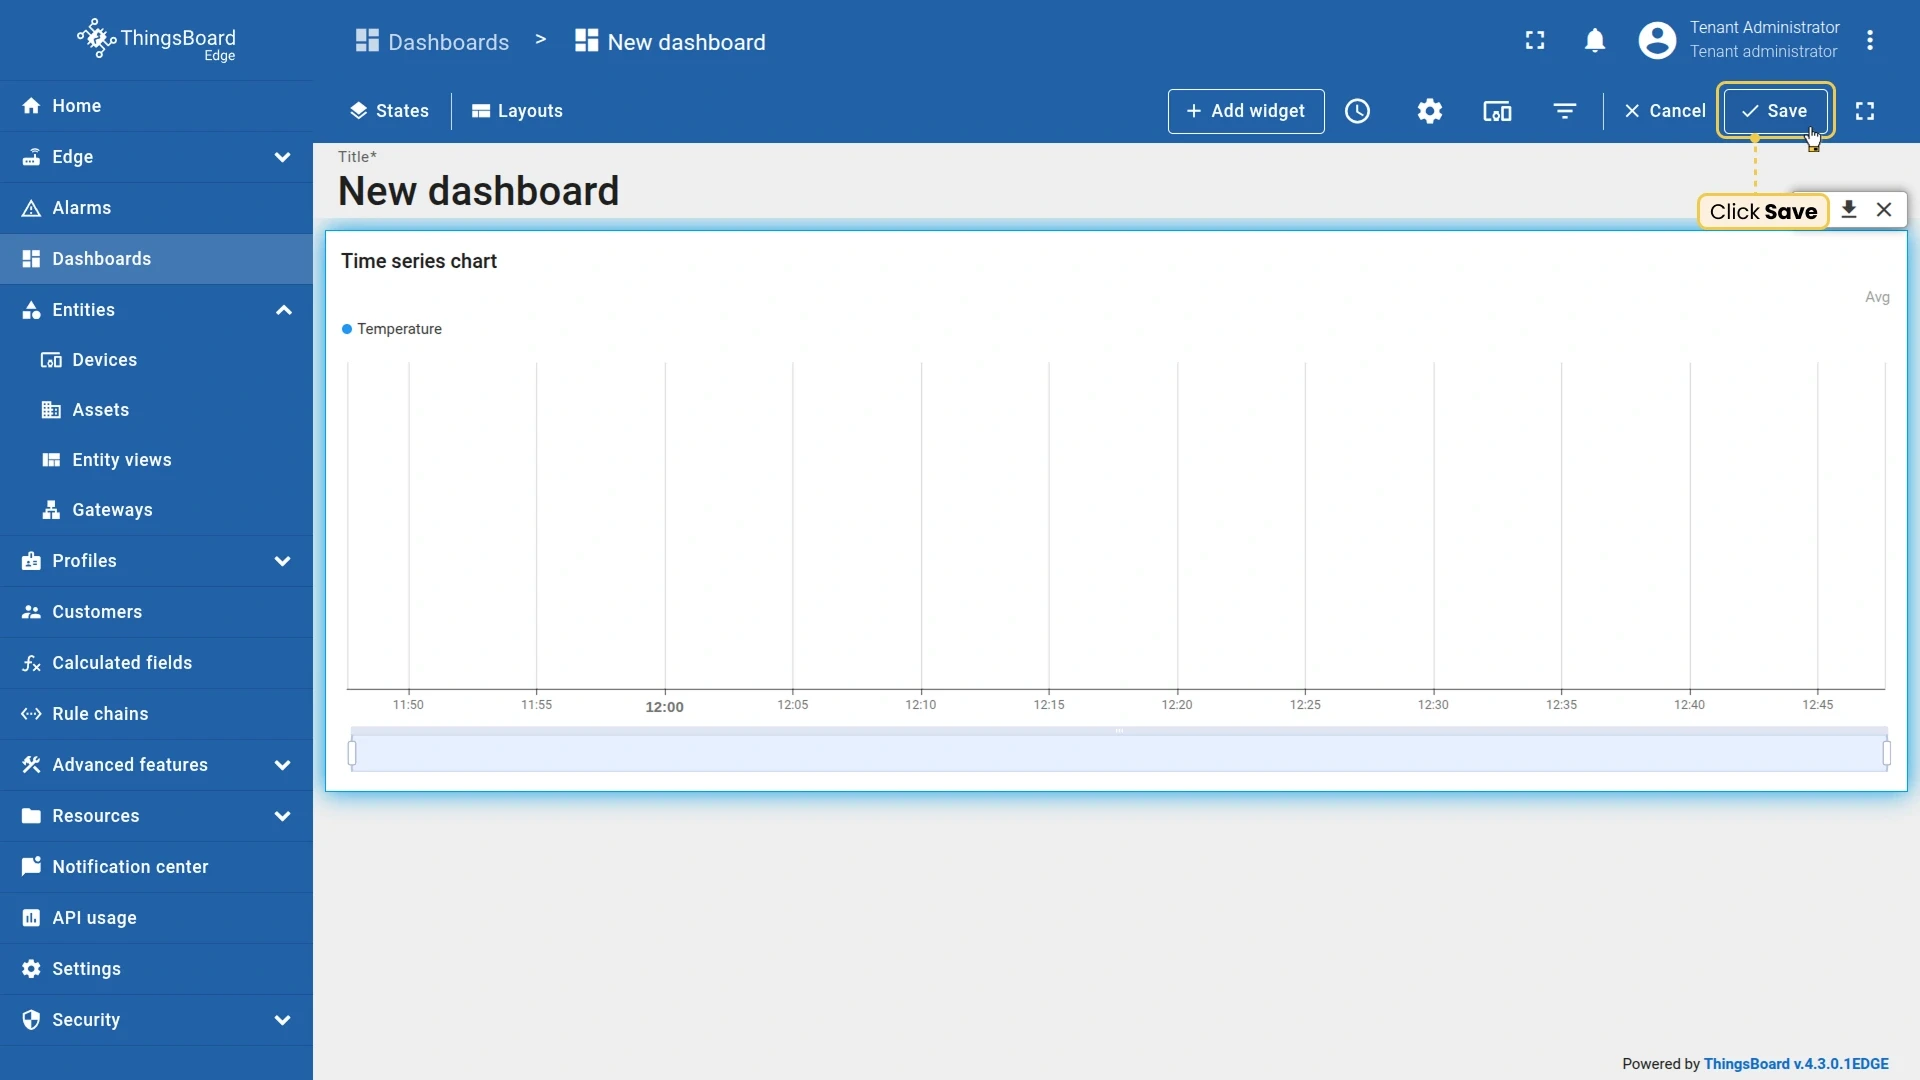
Click Save in the top-right corner to exit edit mode.
Send telemetry and verify
Section titled “Send telemetry and verify”-
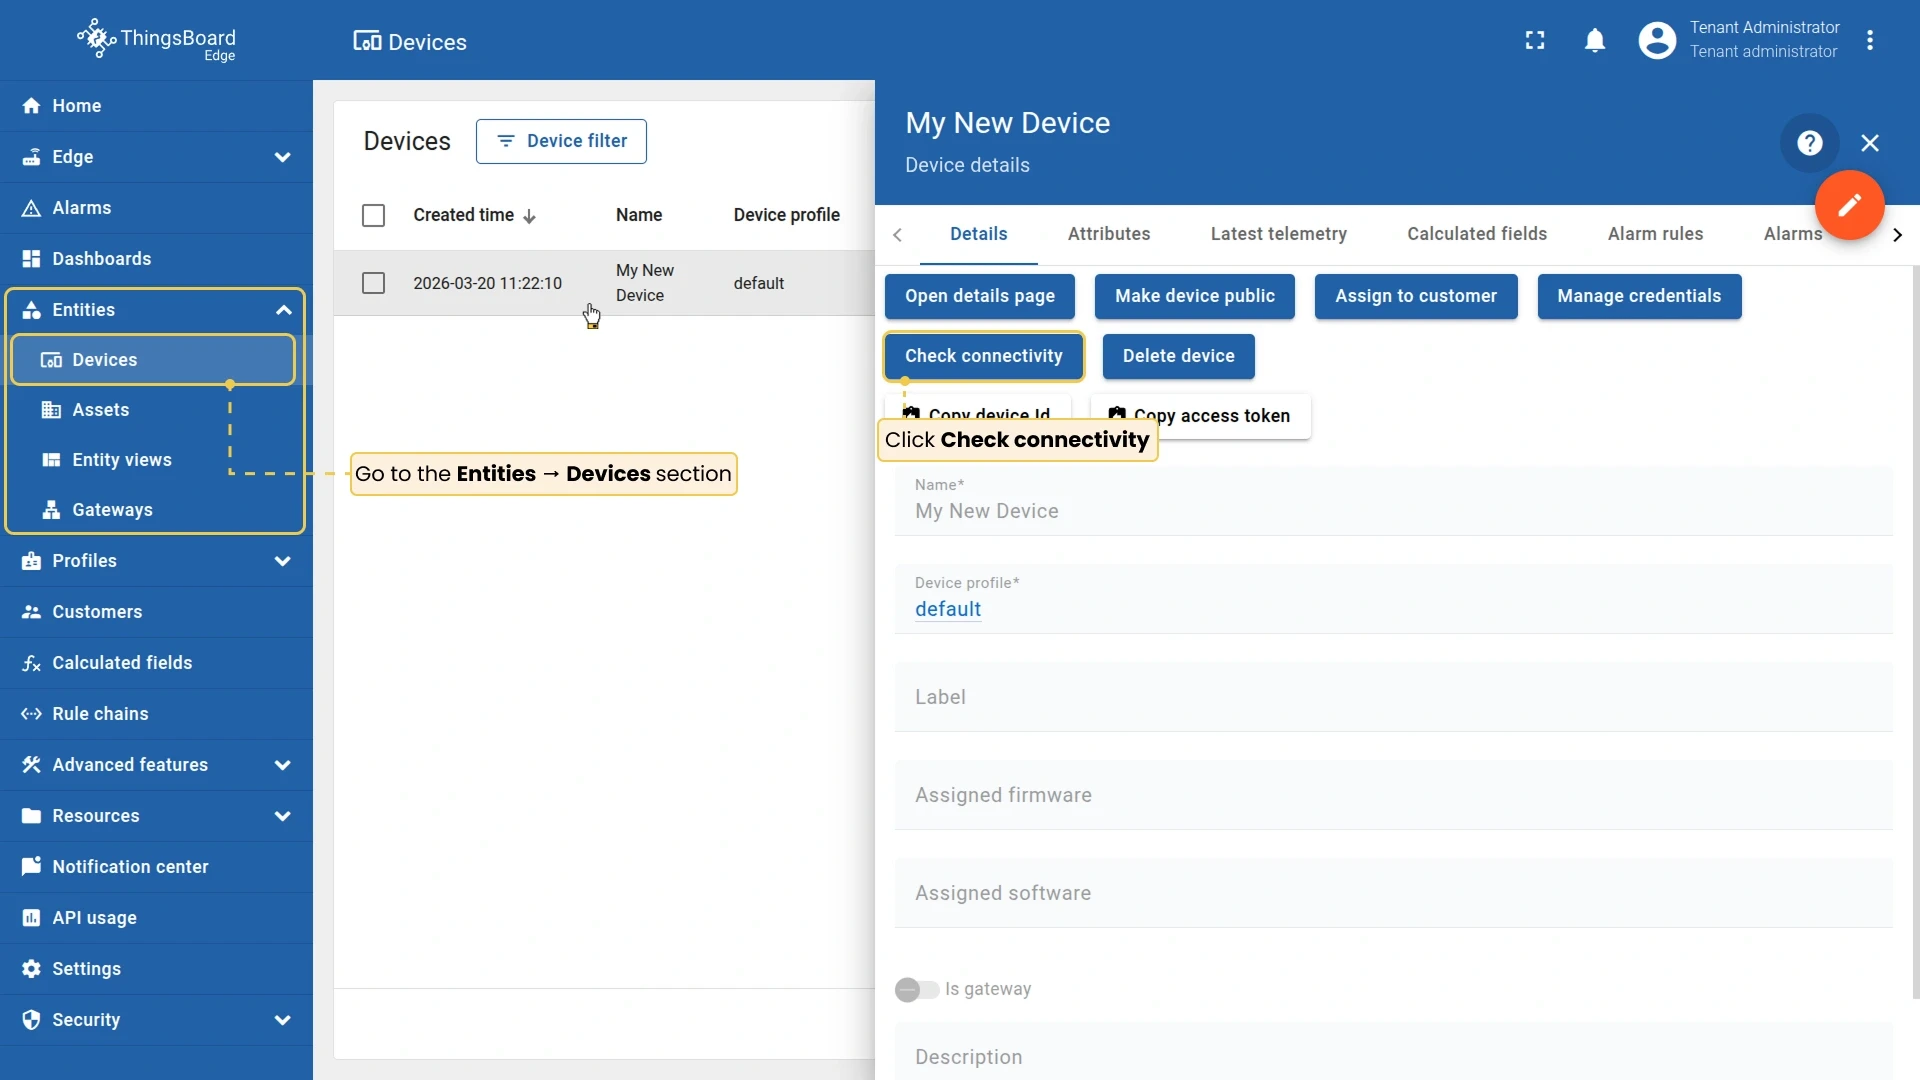
Go to Entities → Devices and click on your device to open its details. Click Check connectivity.
-
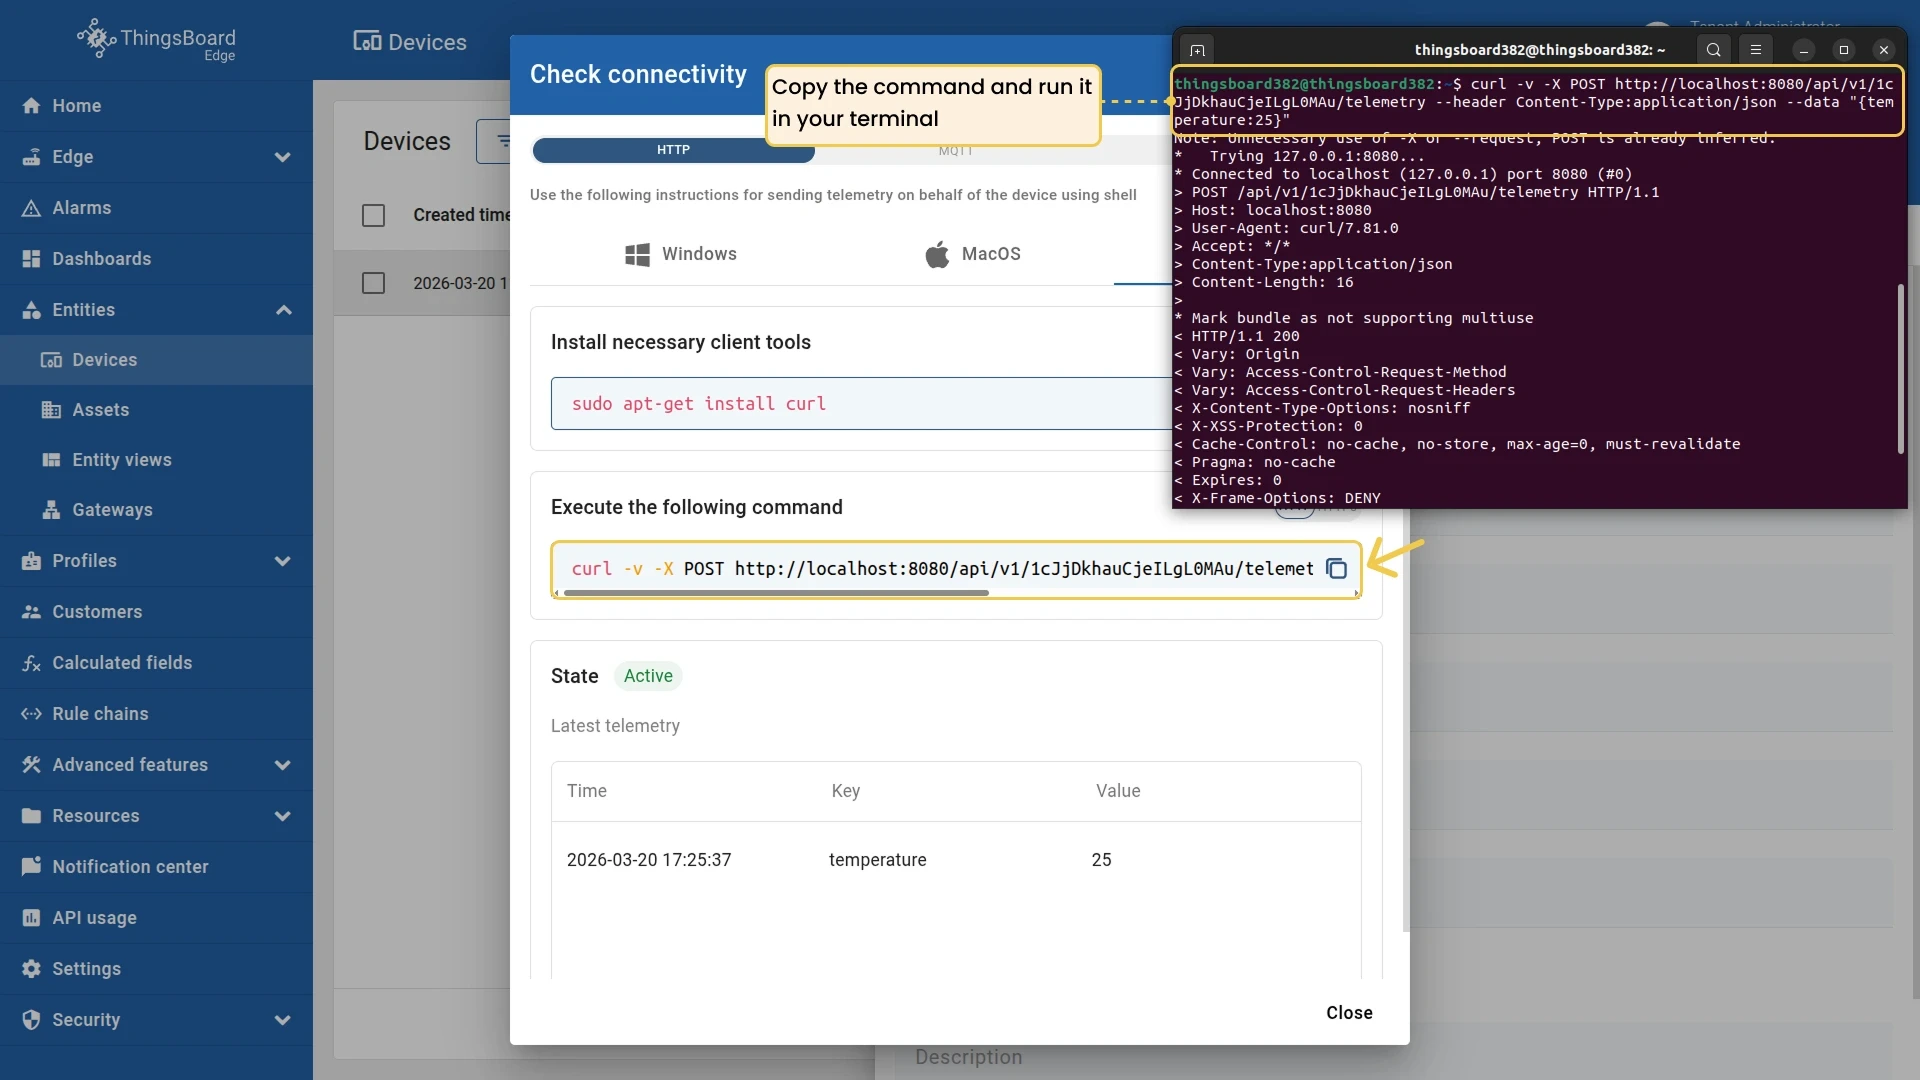
A dialog appears with a pre-configured command for your selected protocol and operating system. Copy the command and run it in your terminal. A
200 OKresponse confirms Edge received the data. -
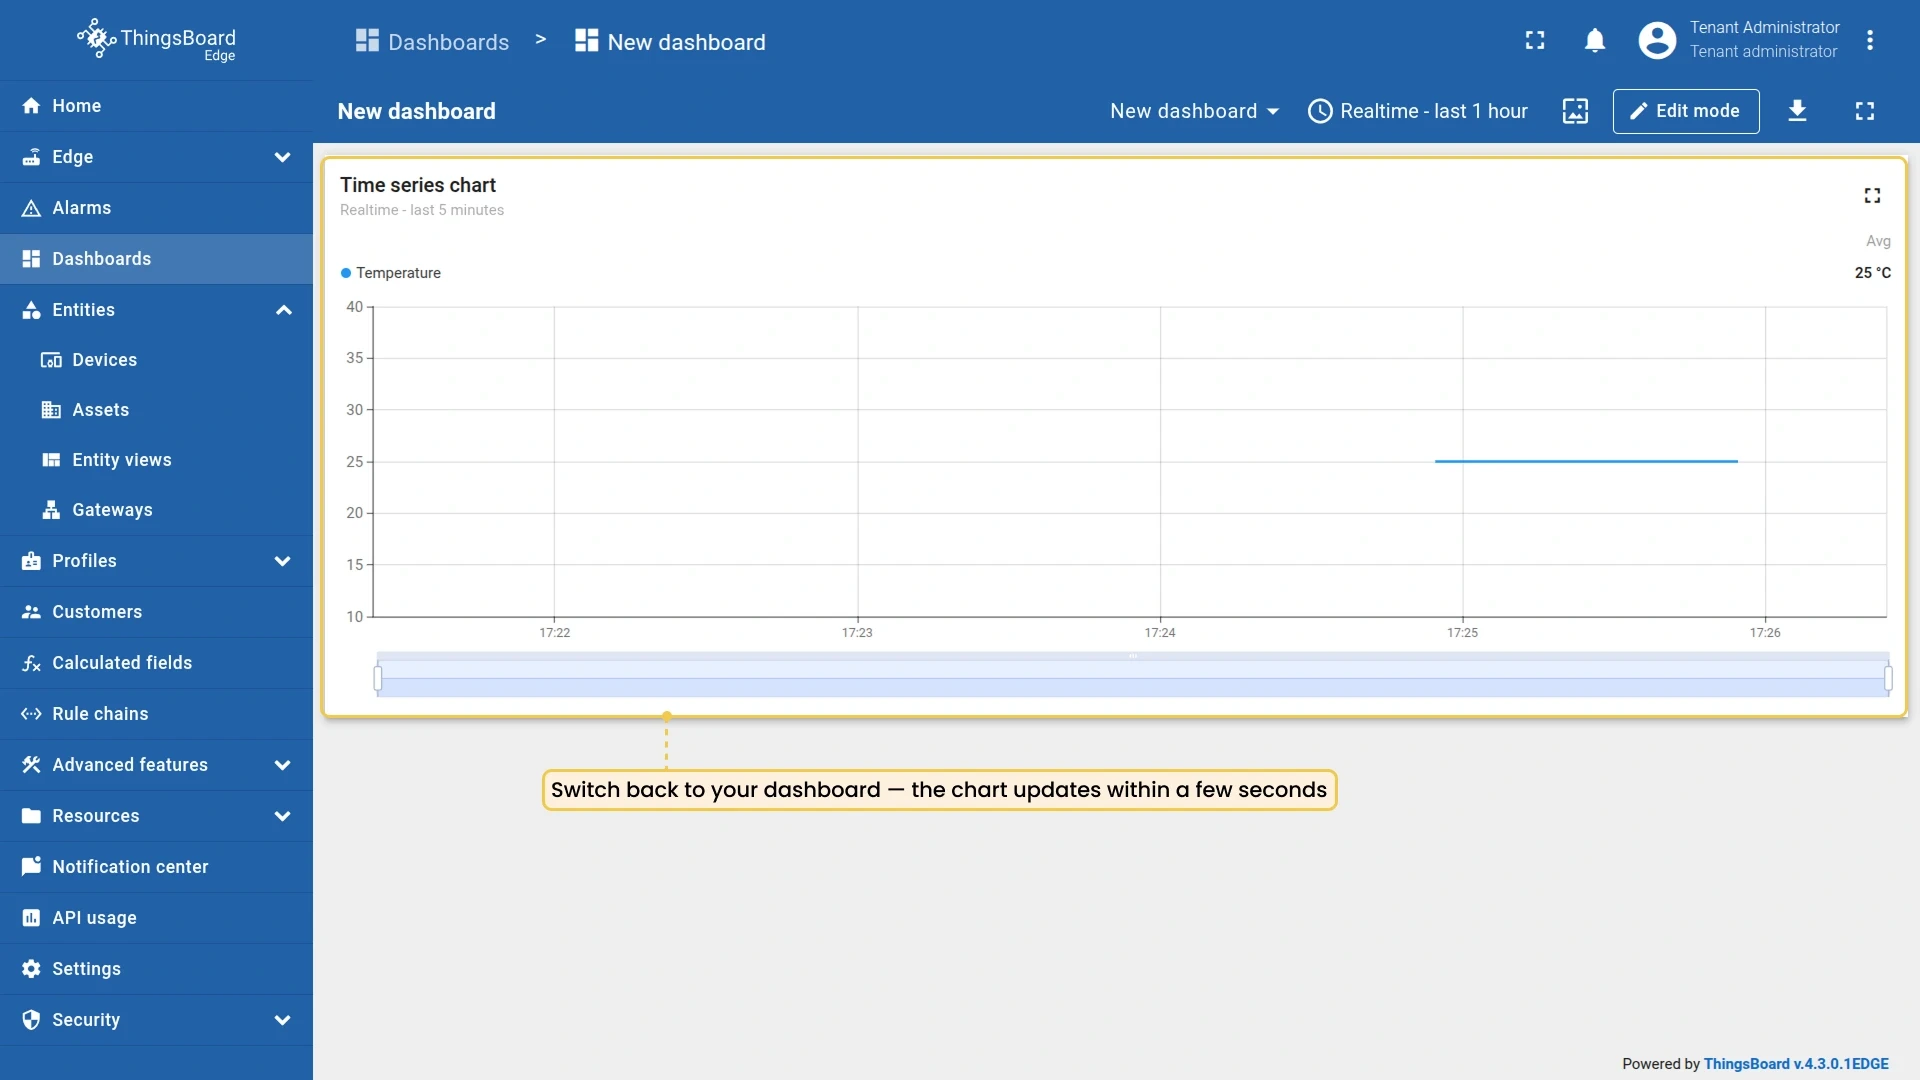
Switch back to your dashboard — the chart updates within a few seconds.
Checklist
Section titled “Checklist”Was this helpful?