Create Anomaly Model
Trendz provides a guided three-step wizard to build an anomaly model — no manual algorithm configuration required. Pick a detection intent, scope your data, and fine-tune sensitivity. The wizard configures everything else automatically.
Steps to Create
Section titled “Steps to Create”Step 1: Open the Wizard
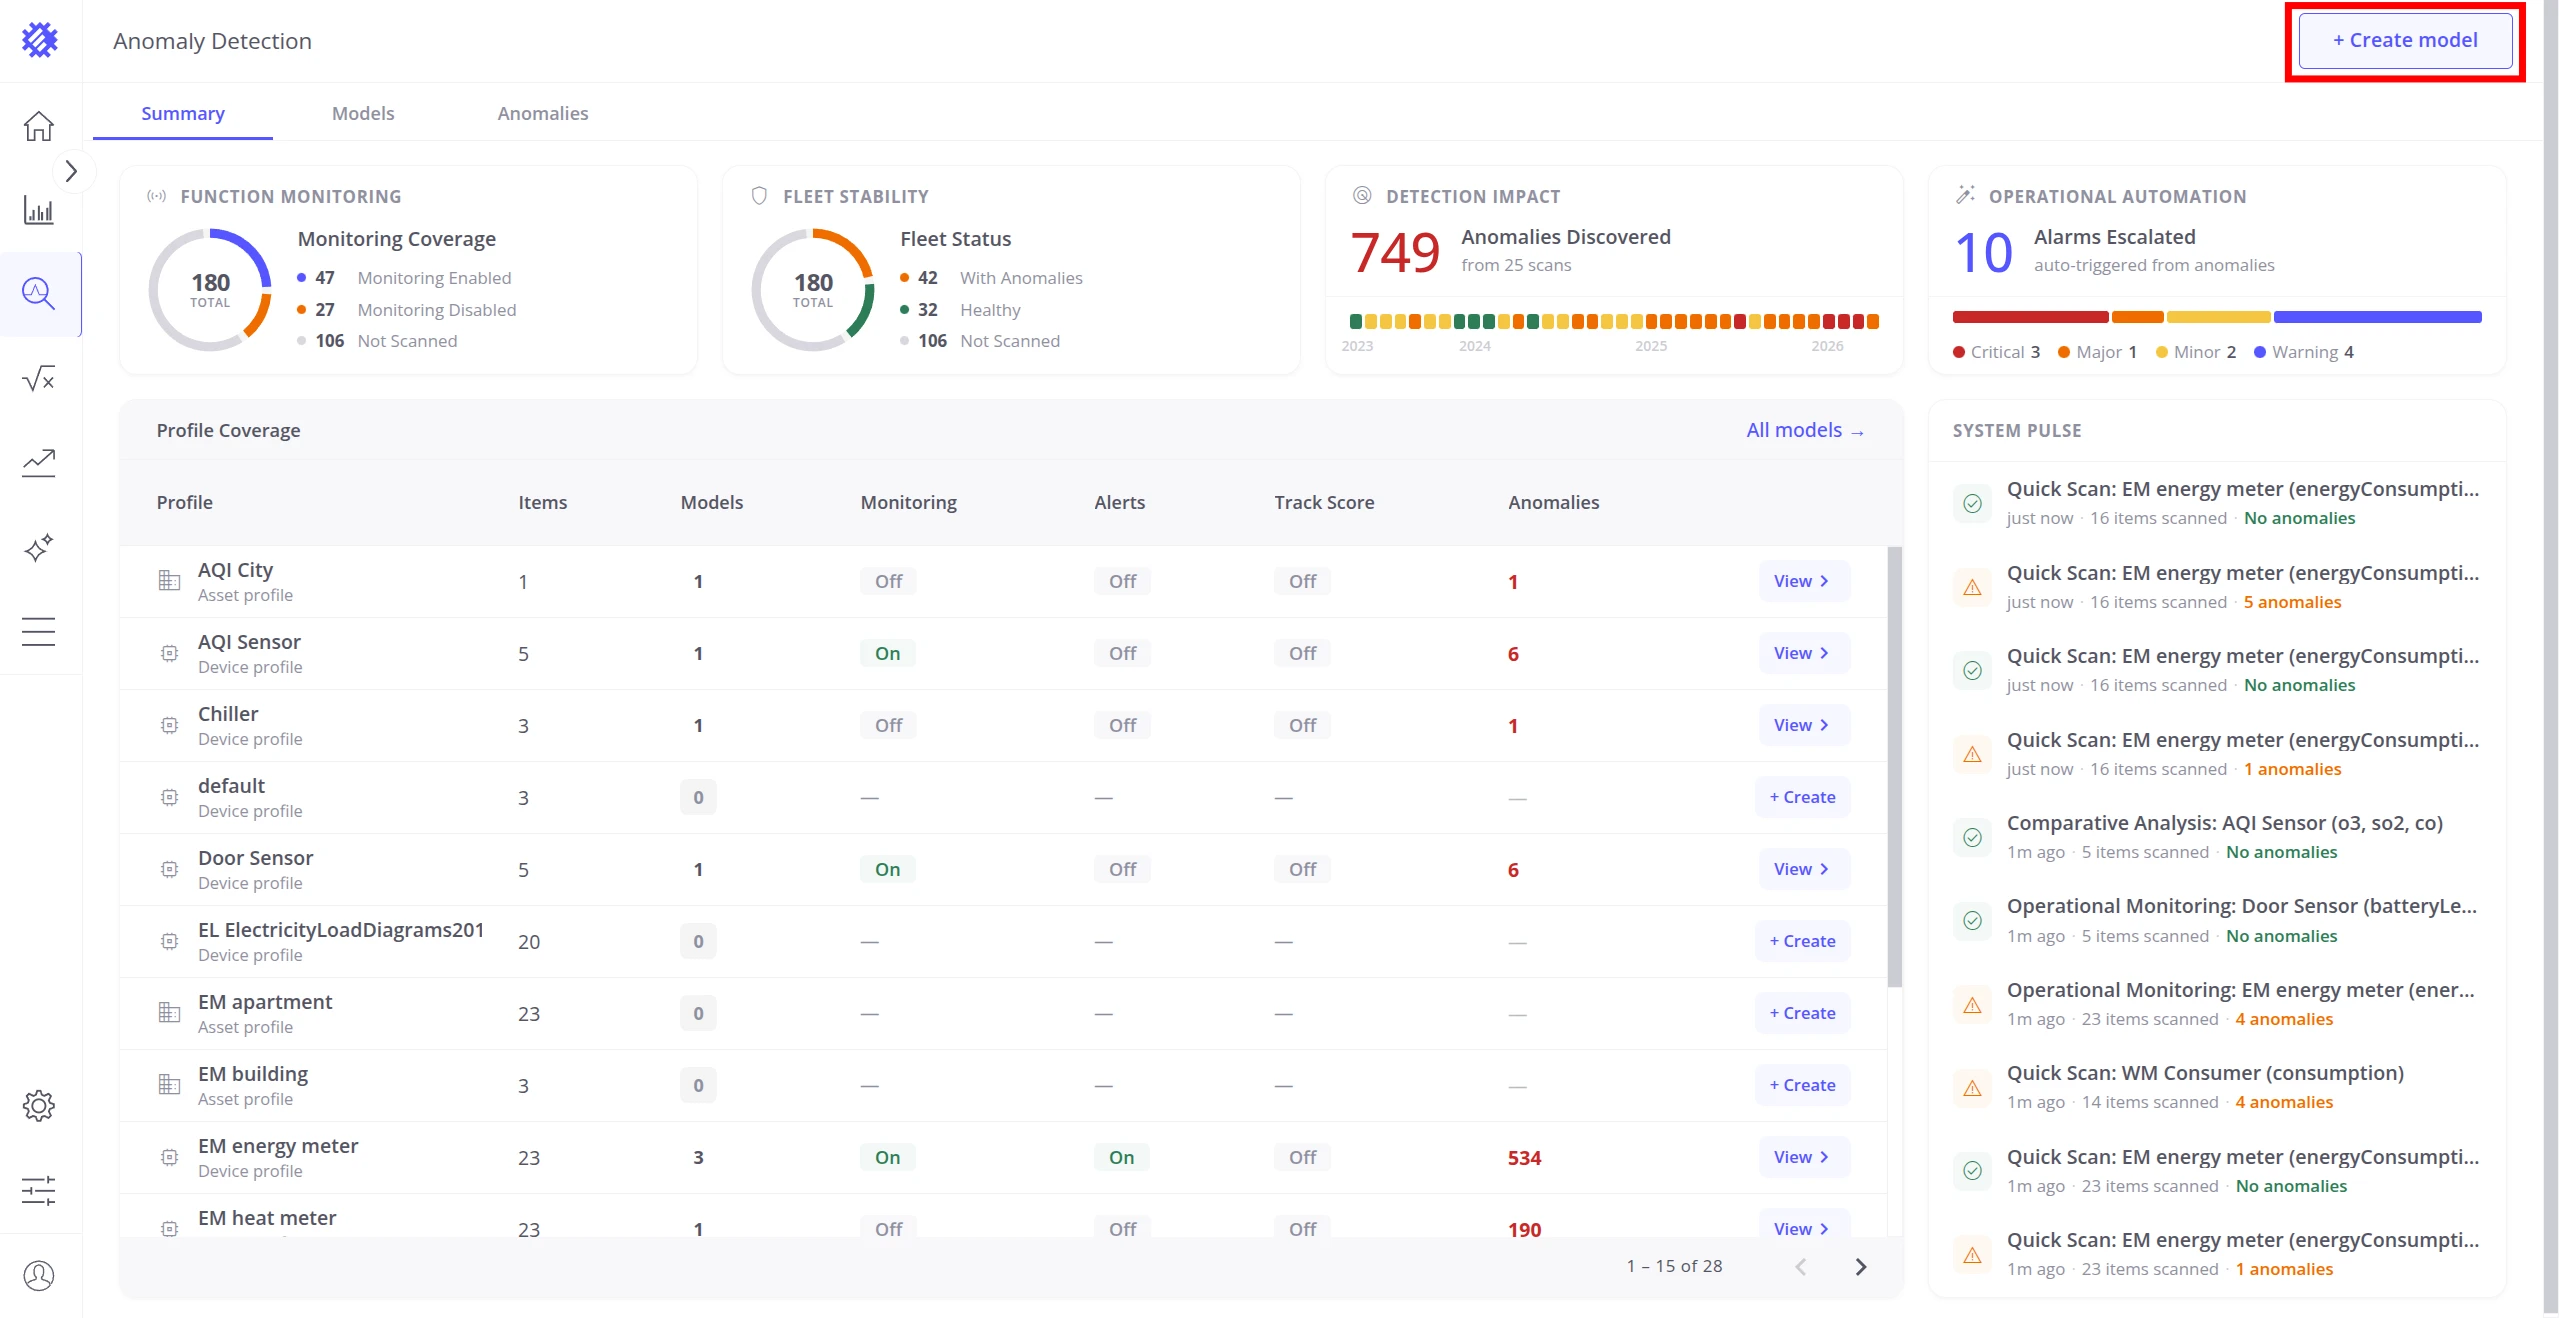
Section titled “Step 1: Open the Wizard”Two entry points are available on the Anomaly Detection page:
- Create model — button in the top-right corner, always visible on all tabs.
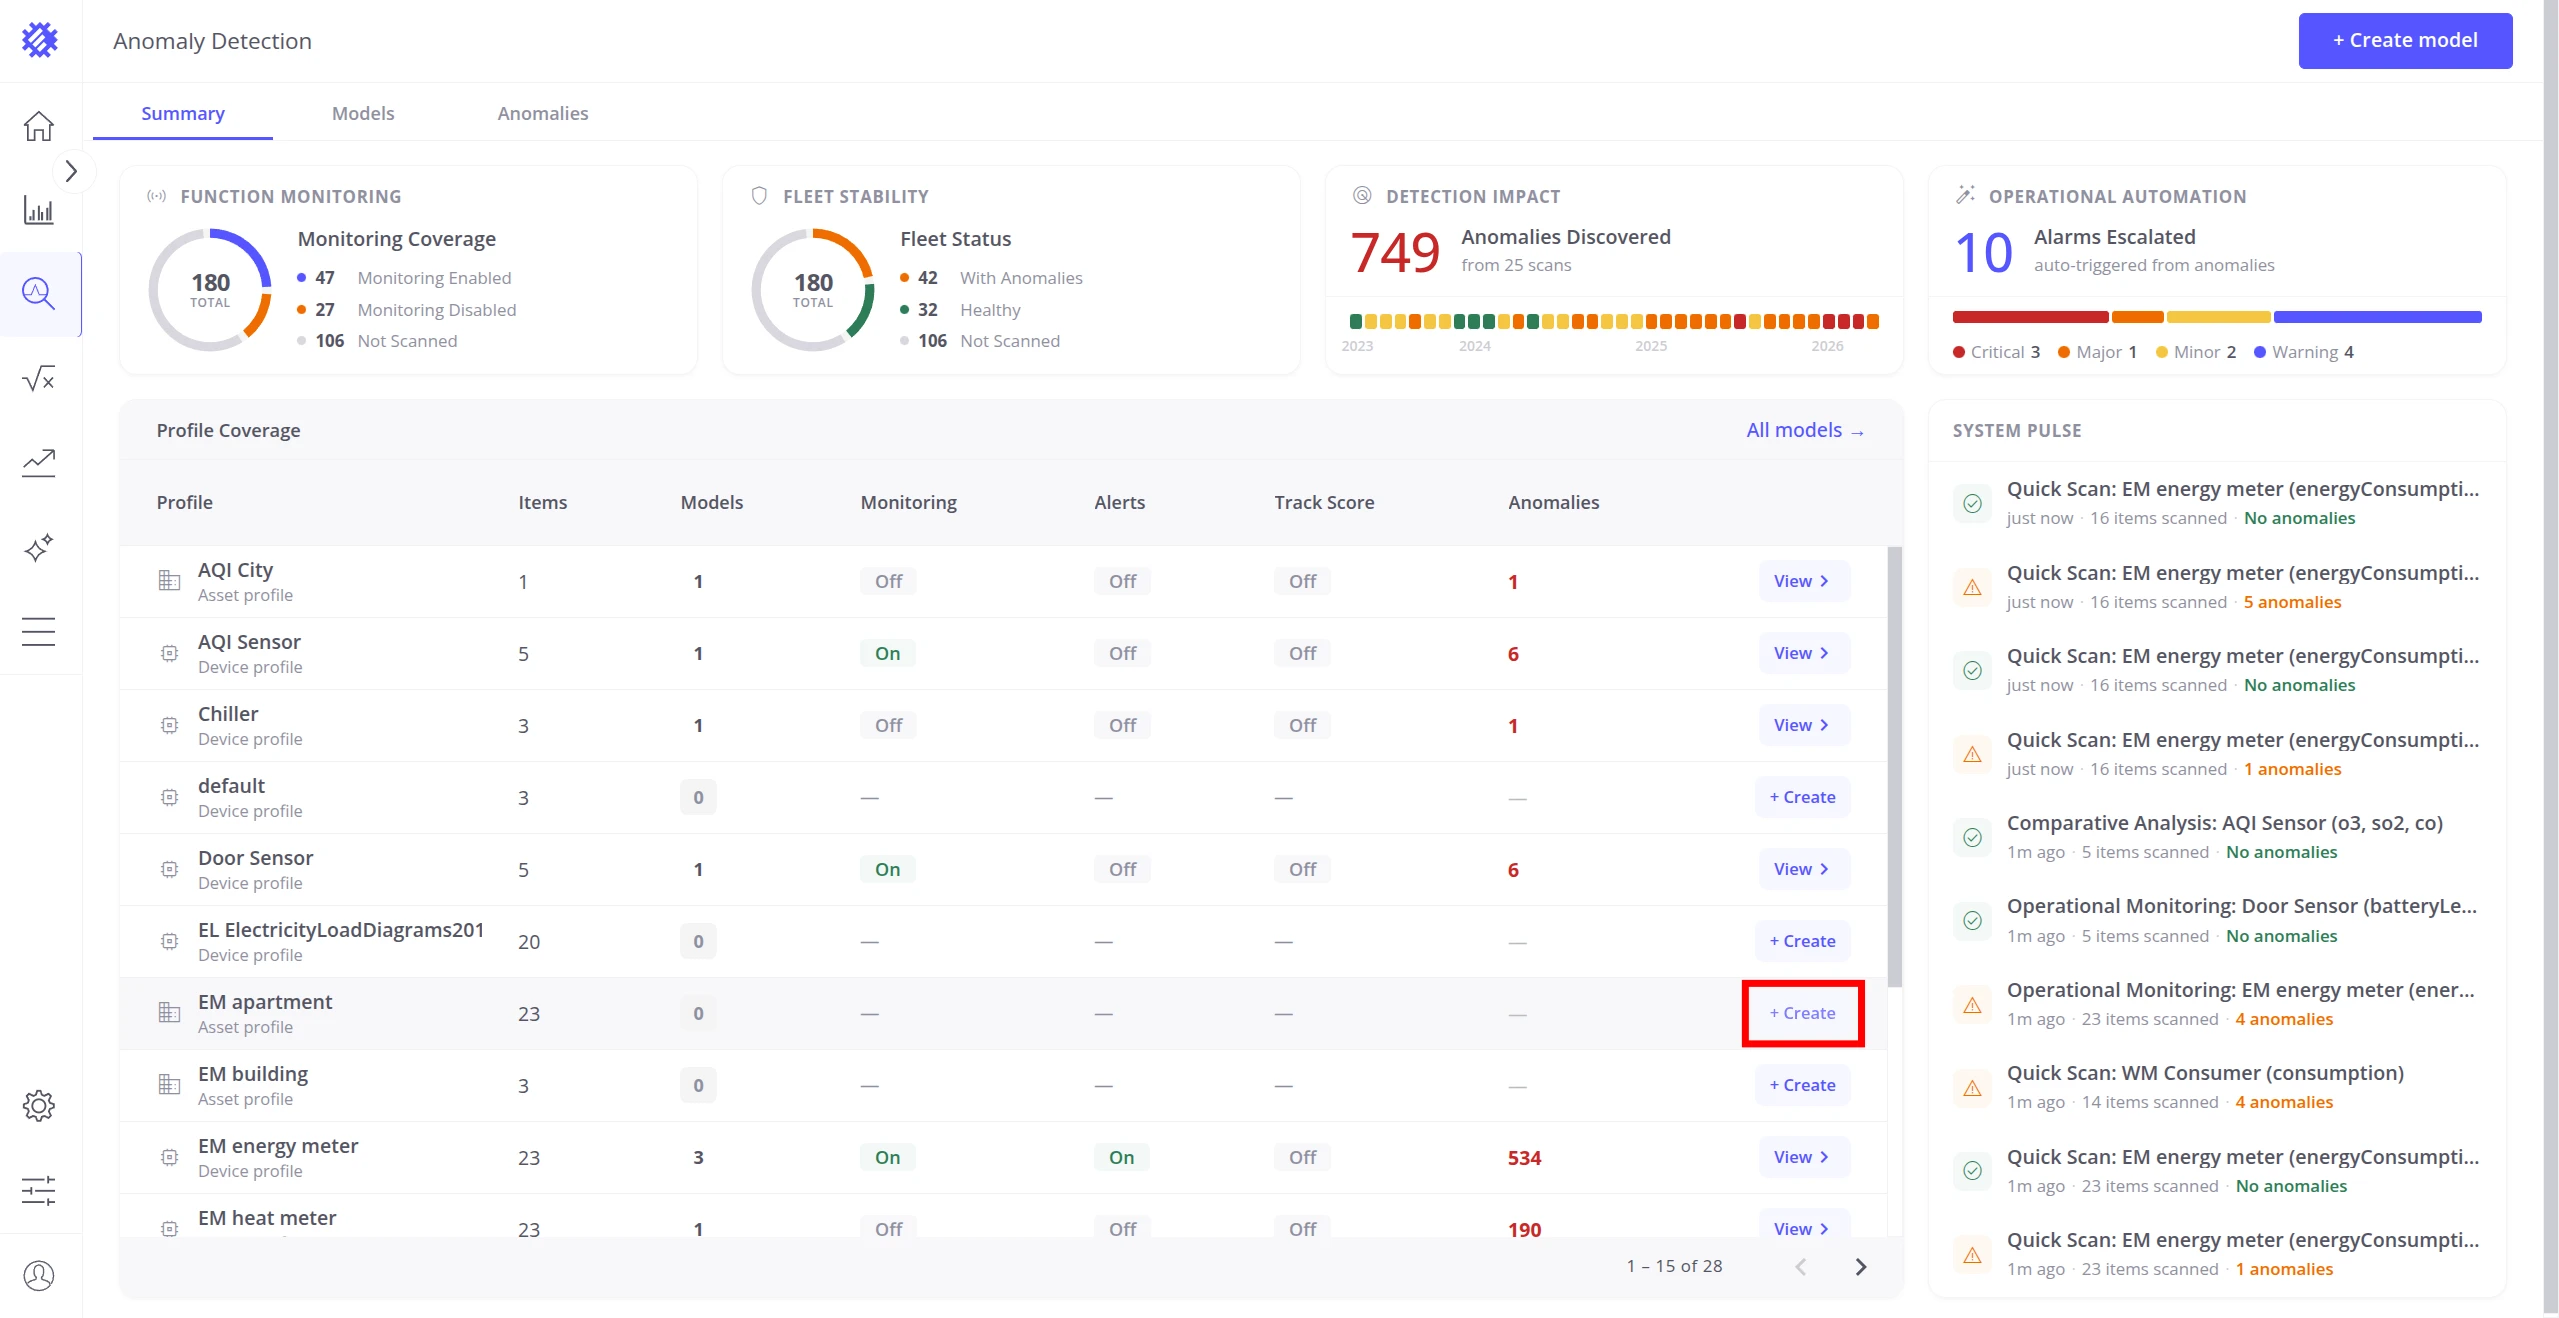
- + Create — inline button on any profile row in the Profile Coverage table. Opens the wizard with that profile pre-selected.
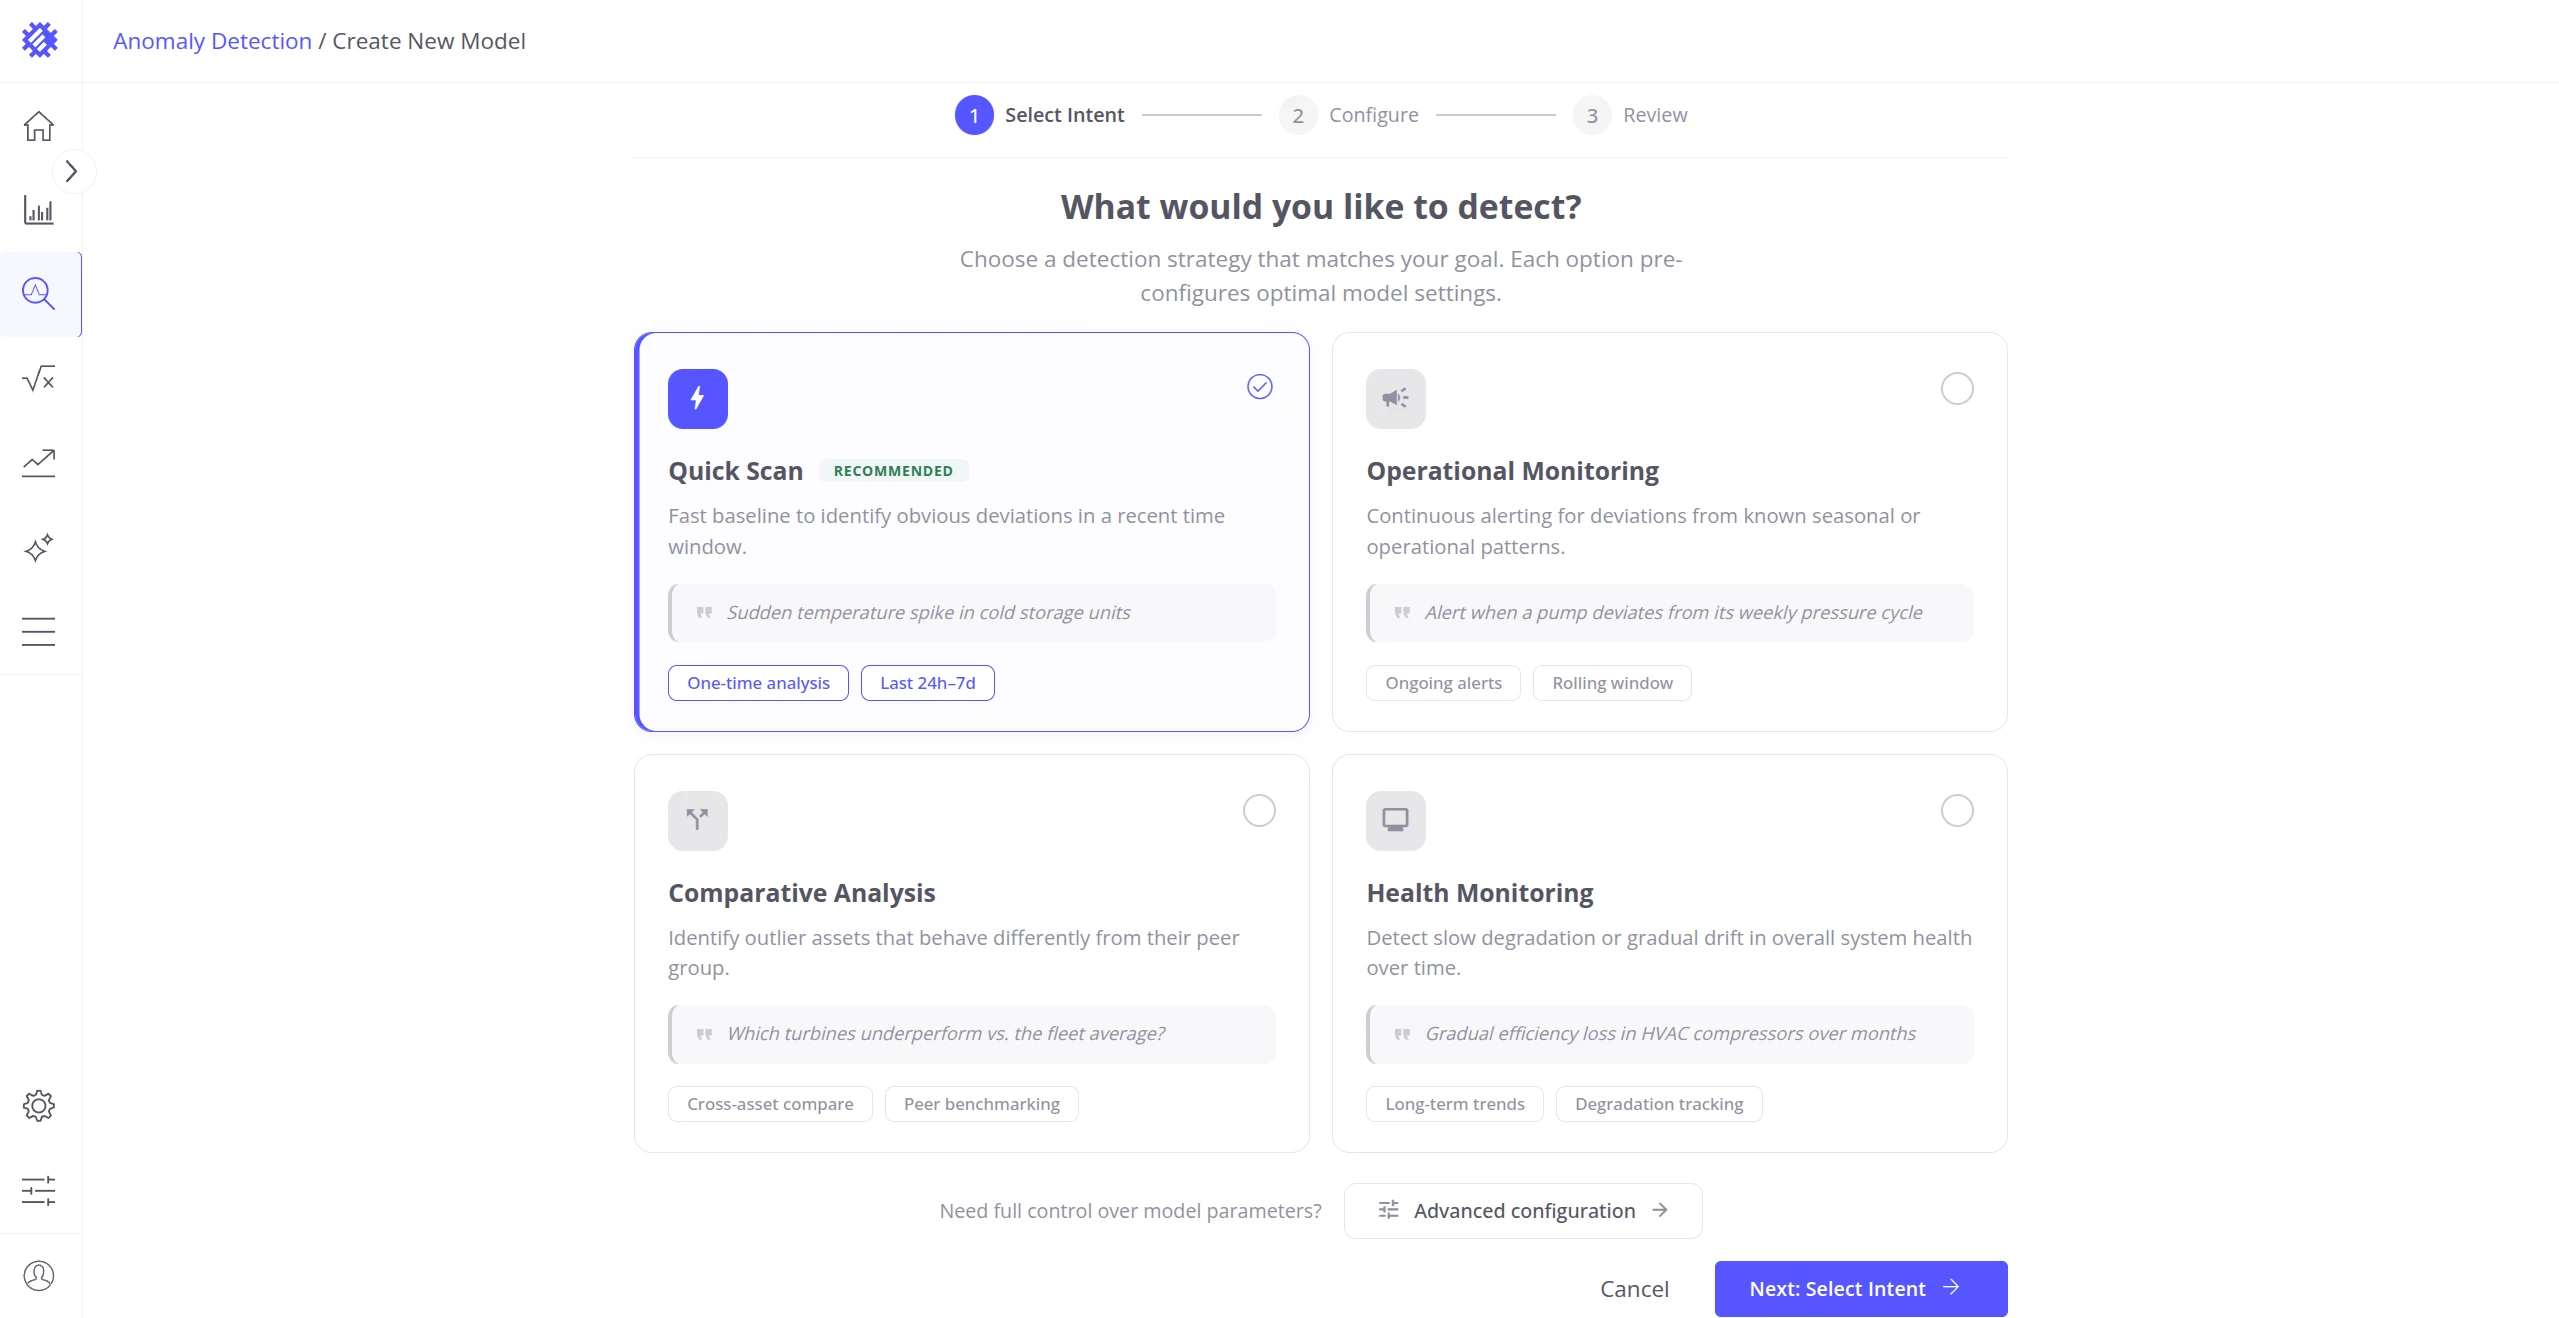
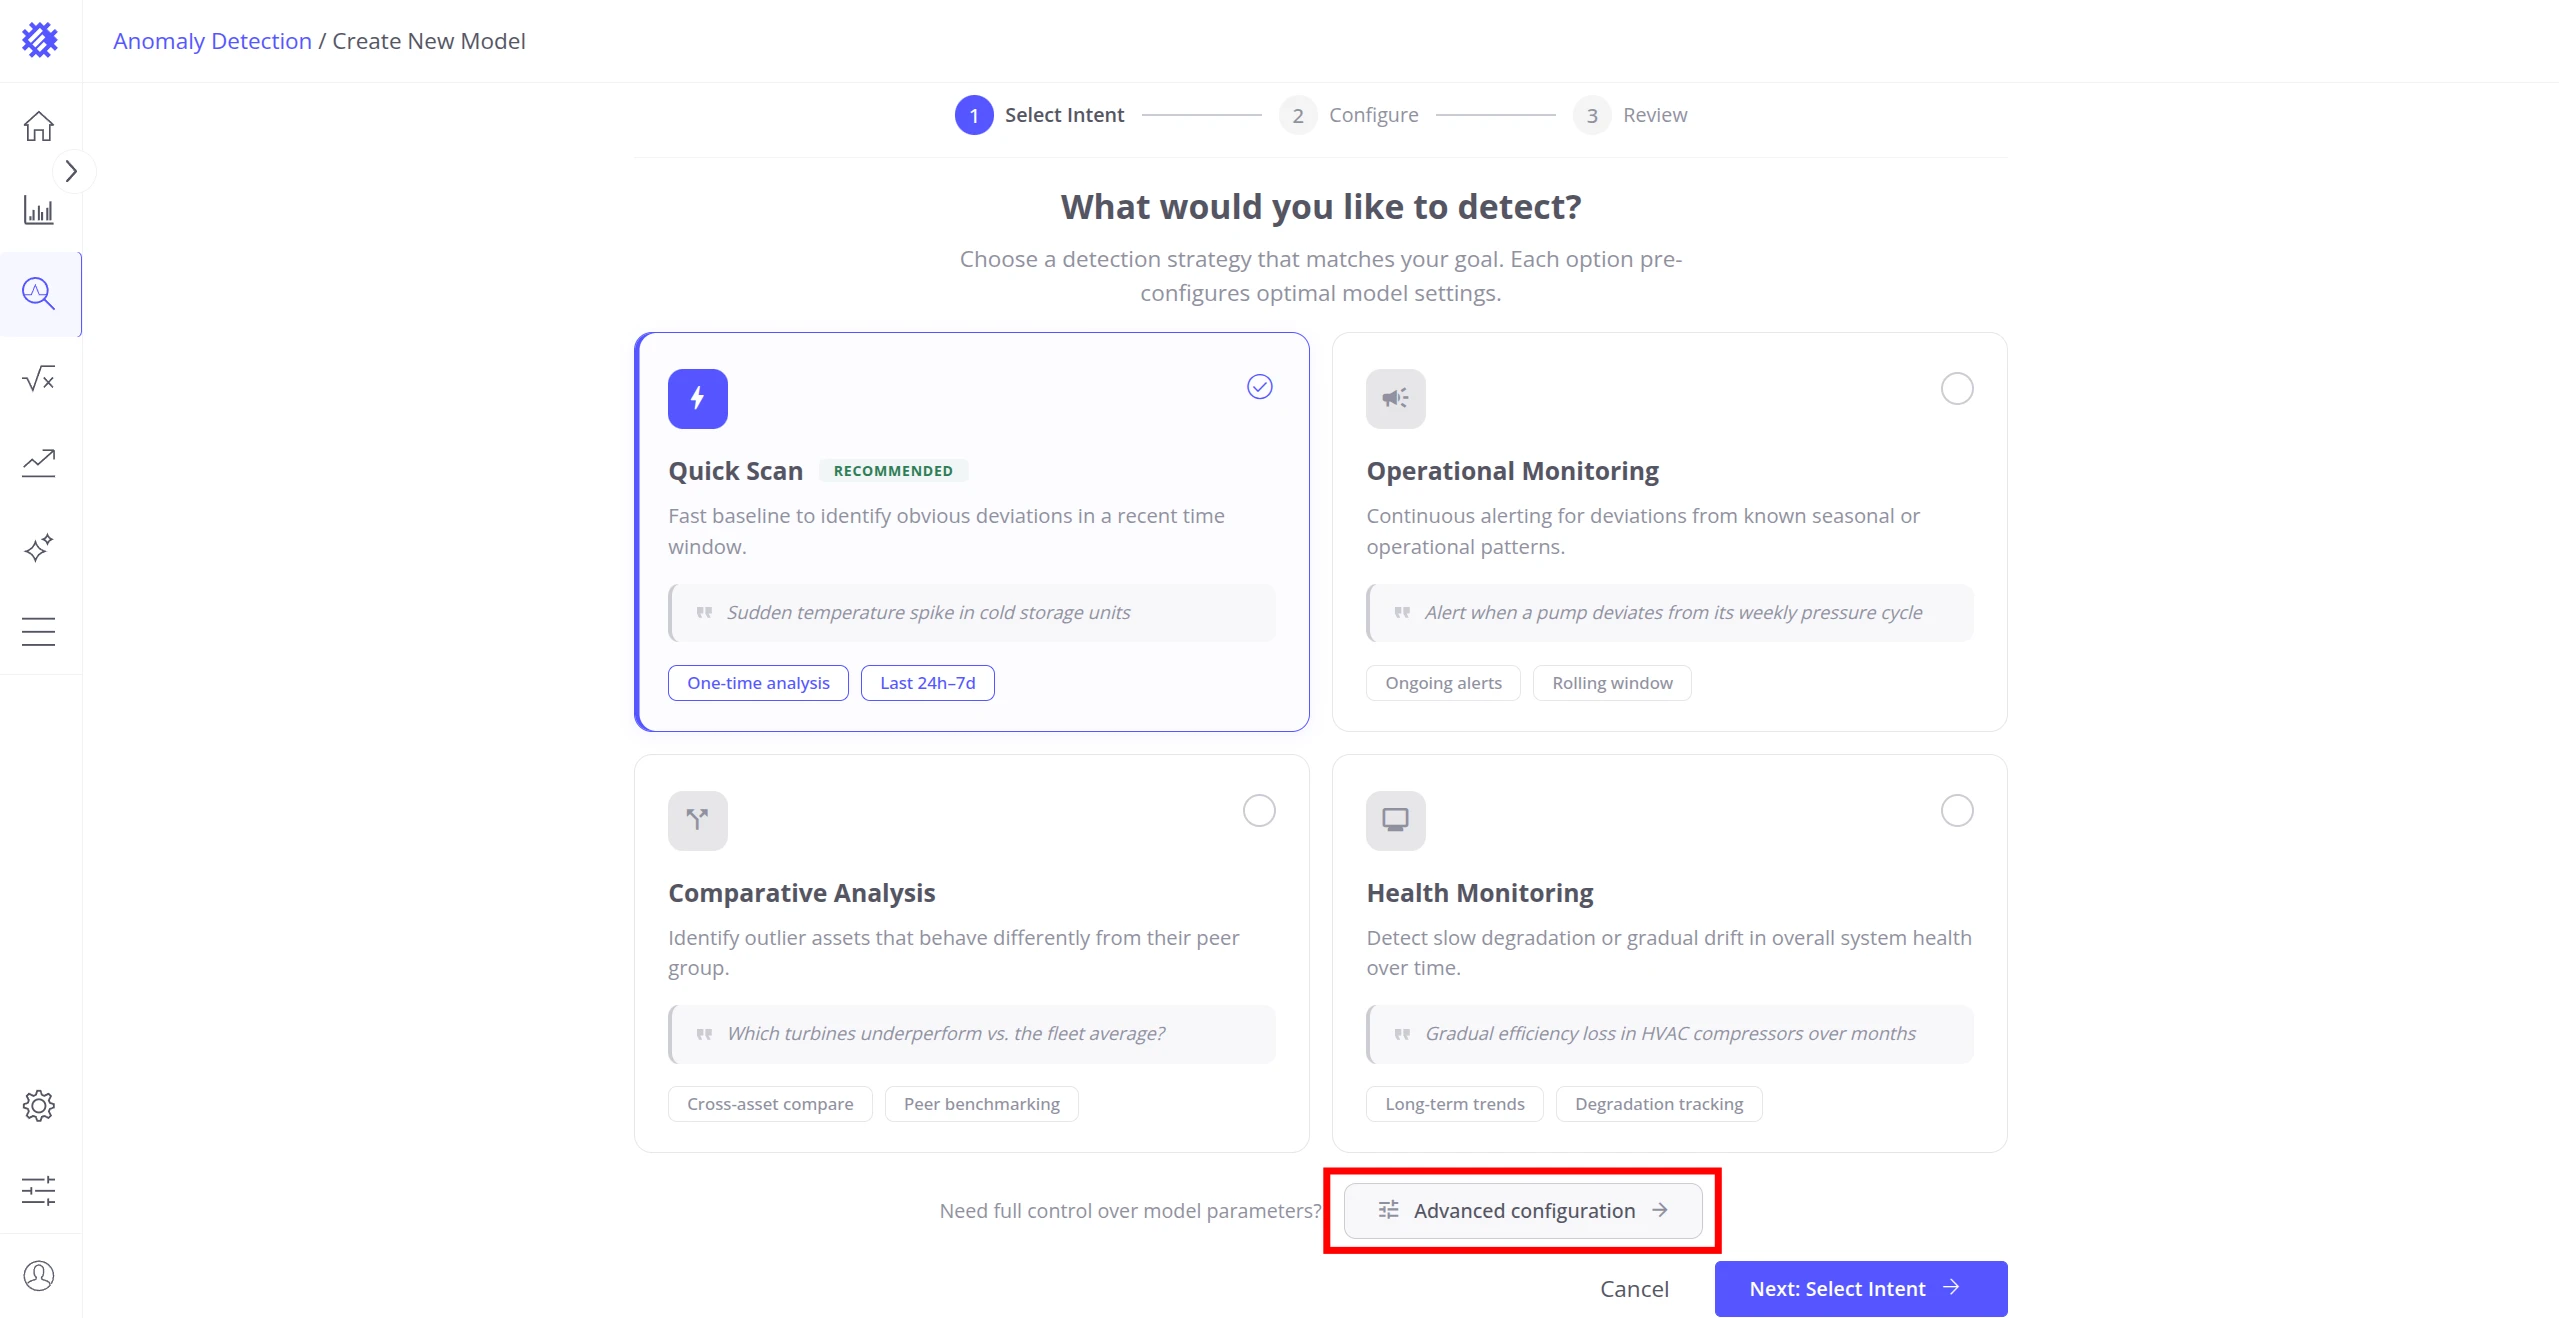
Step 2: Choose Detection Intent
Section titled “Step 2: Choose Detection Intent”The Select Intent step asks what you want to detect. Choose the strategy that matches your goal — each option automatically pre-configures the optimal clustering, segmentation, and scoring settings:
| Intent | Best for |
|---|---|
| Quick Scan (recommended) | Rapid baseline scan for obvious deviations in recent data. Best starting point for most use cases. |
| Operational Monitoring | Continuous alerting for deviations from known seasonal or operational patterns. Uses a rolling window for ongoing detection. |
| Comparative Analysis | Identifies units that behave differently from the peer group. Useful for fleet-wide benchmarking. |
| Health Monitoring | Detects long-term gradual drift in overall system health. Uses progressive tracking across extended time ranges. |
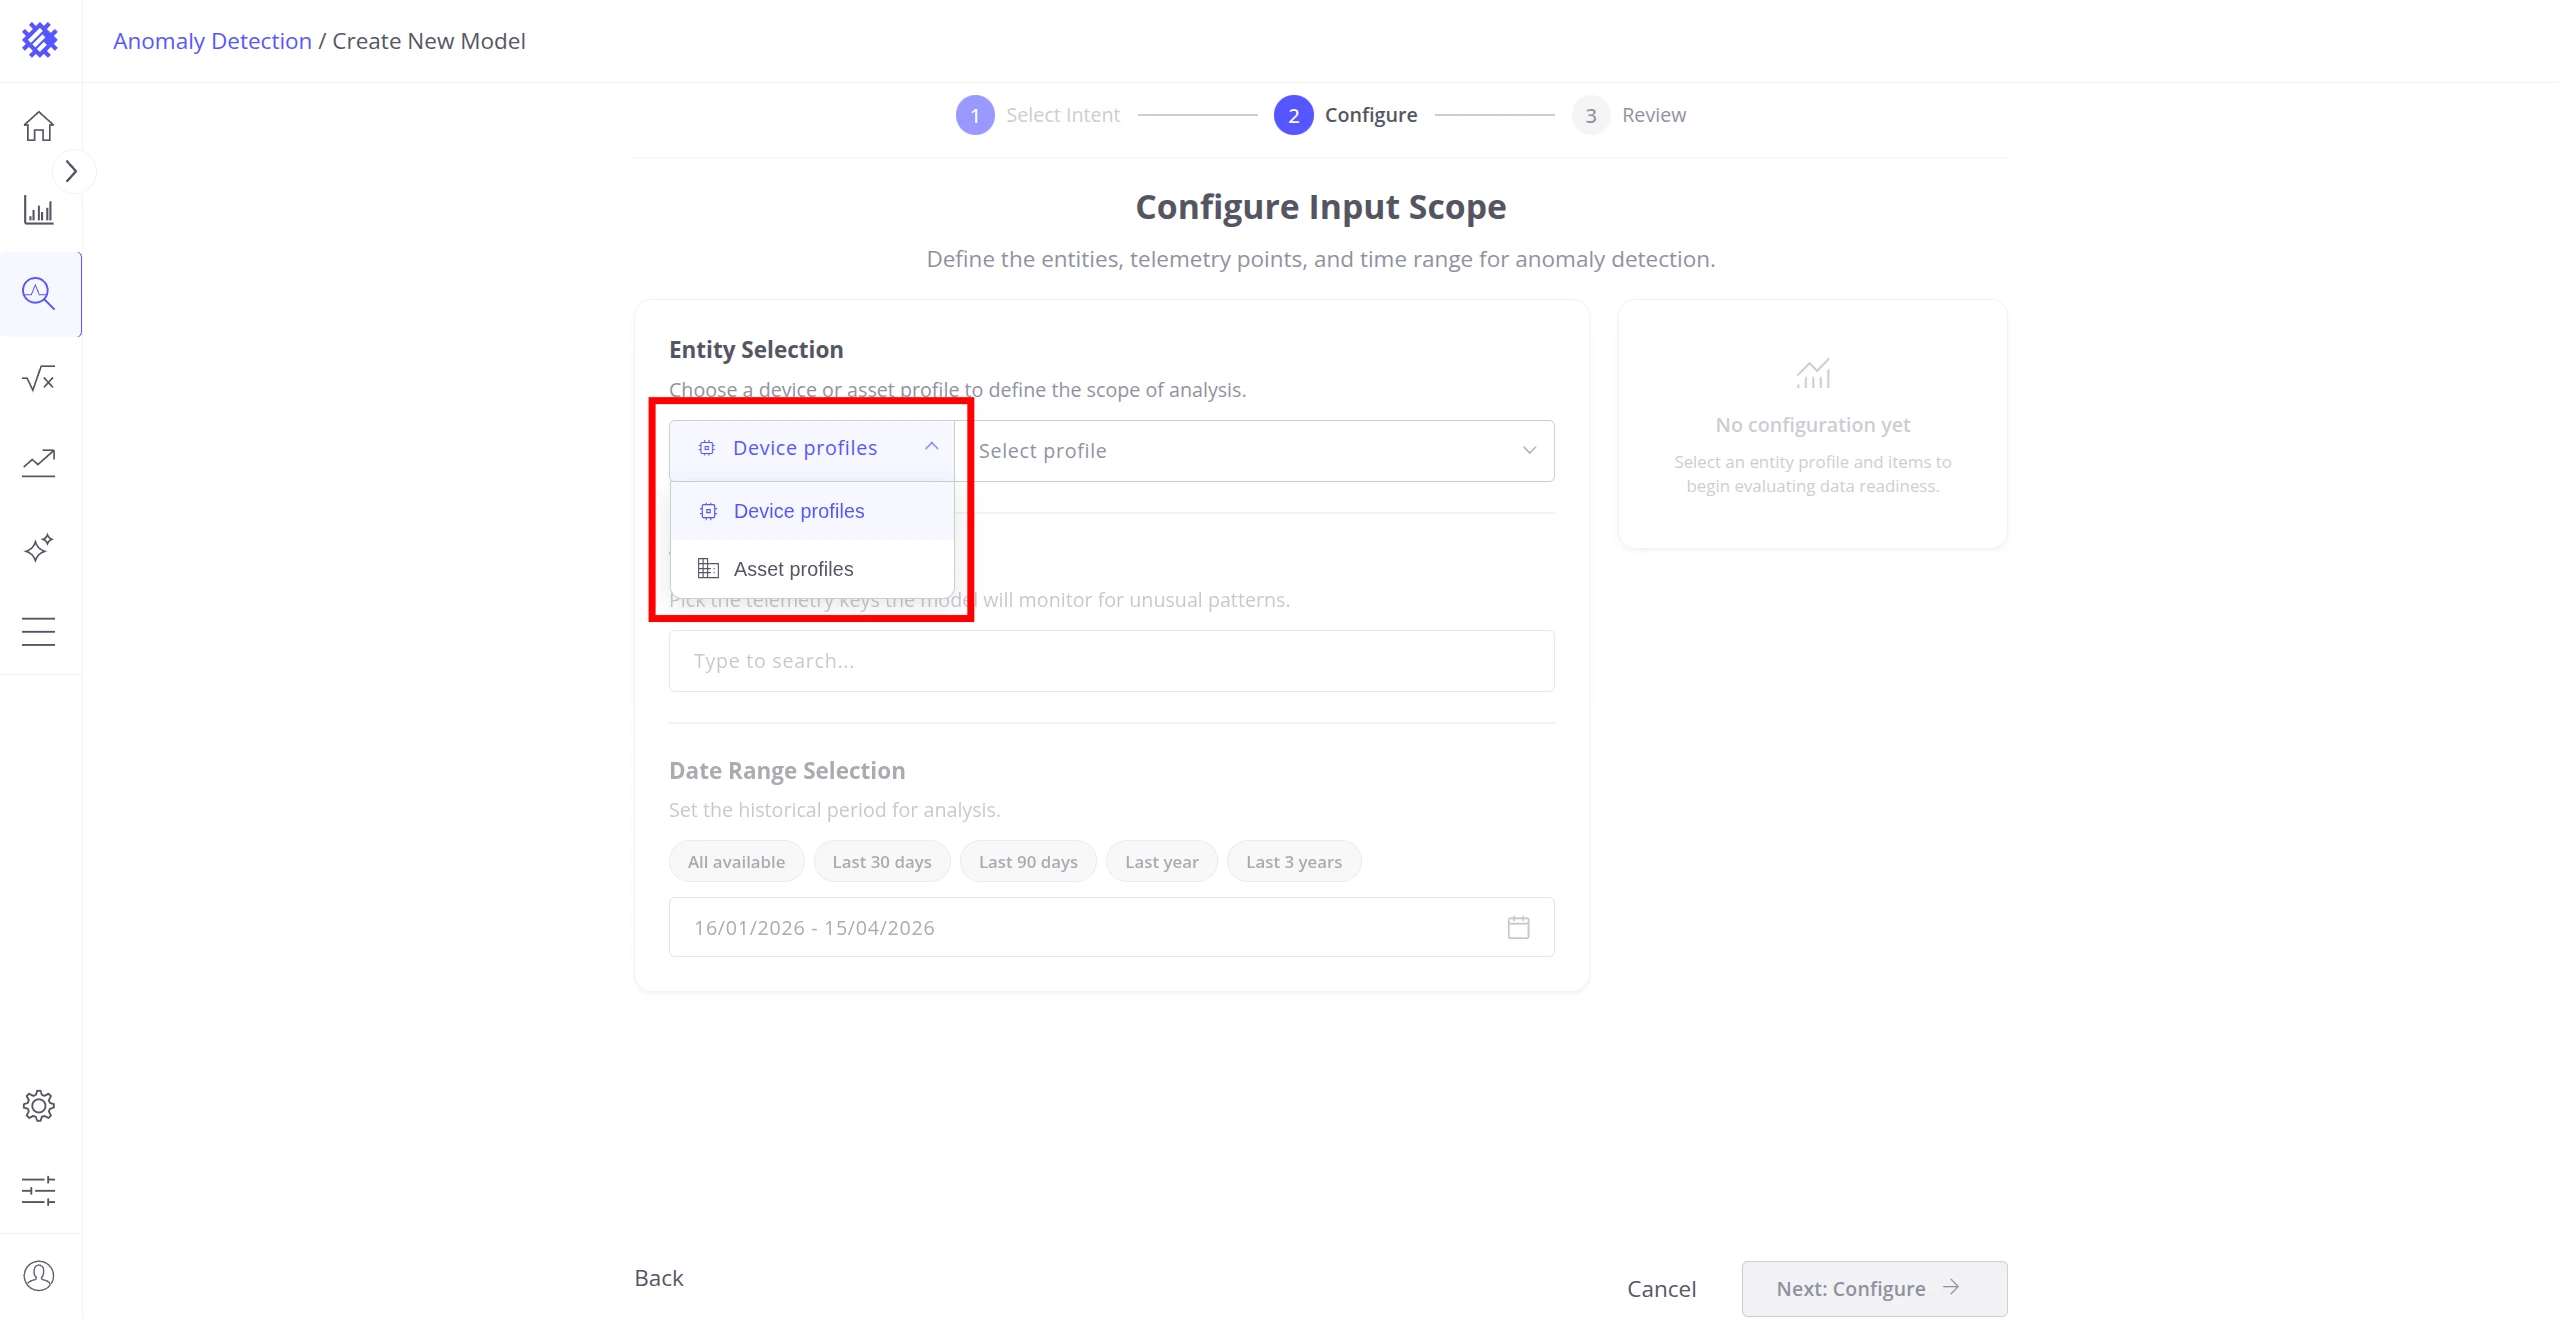
Step 3: Configure Input Scope
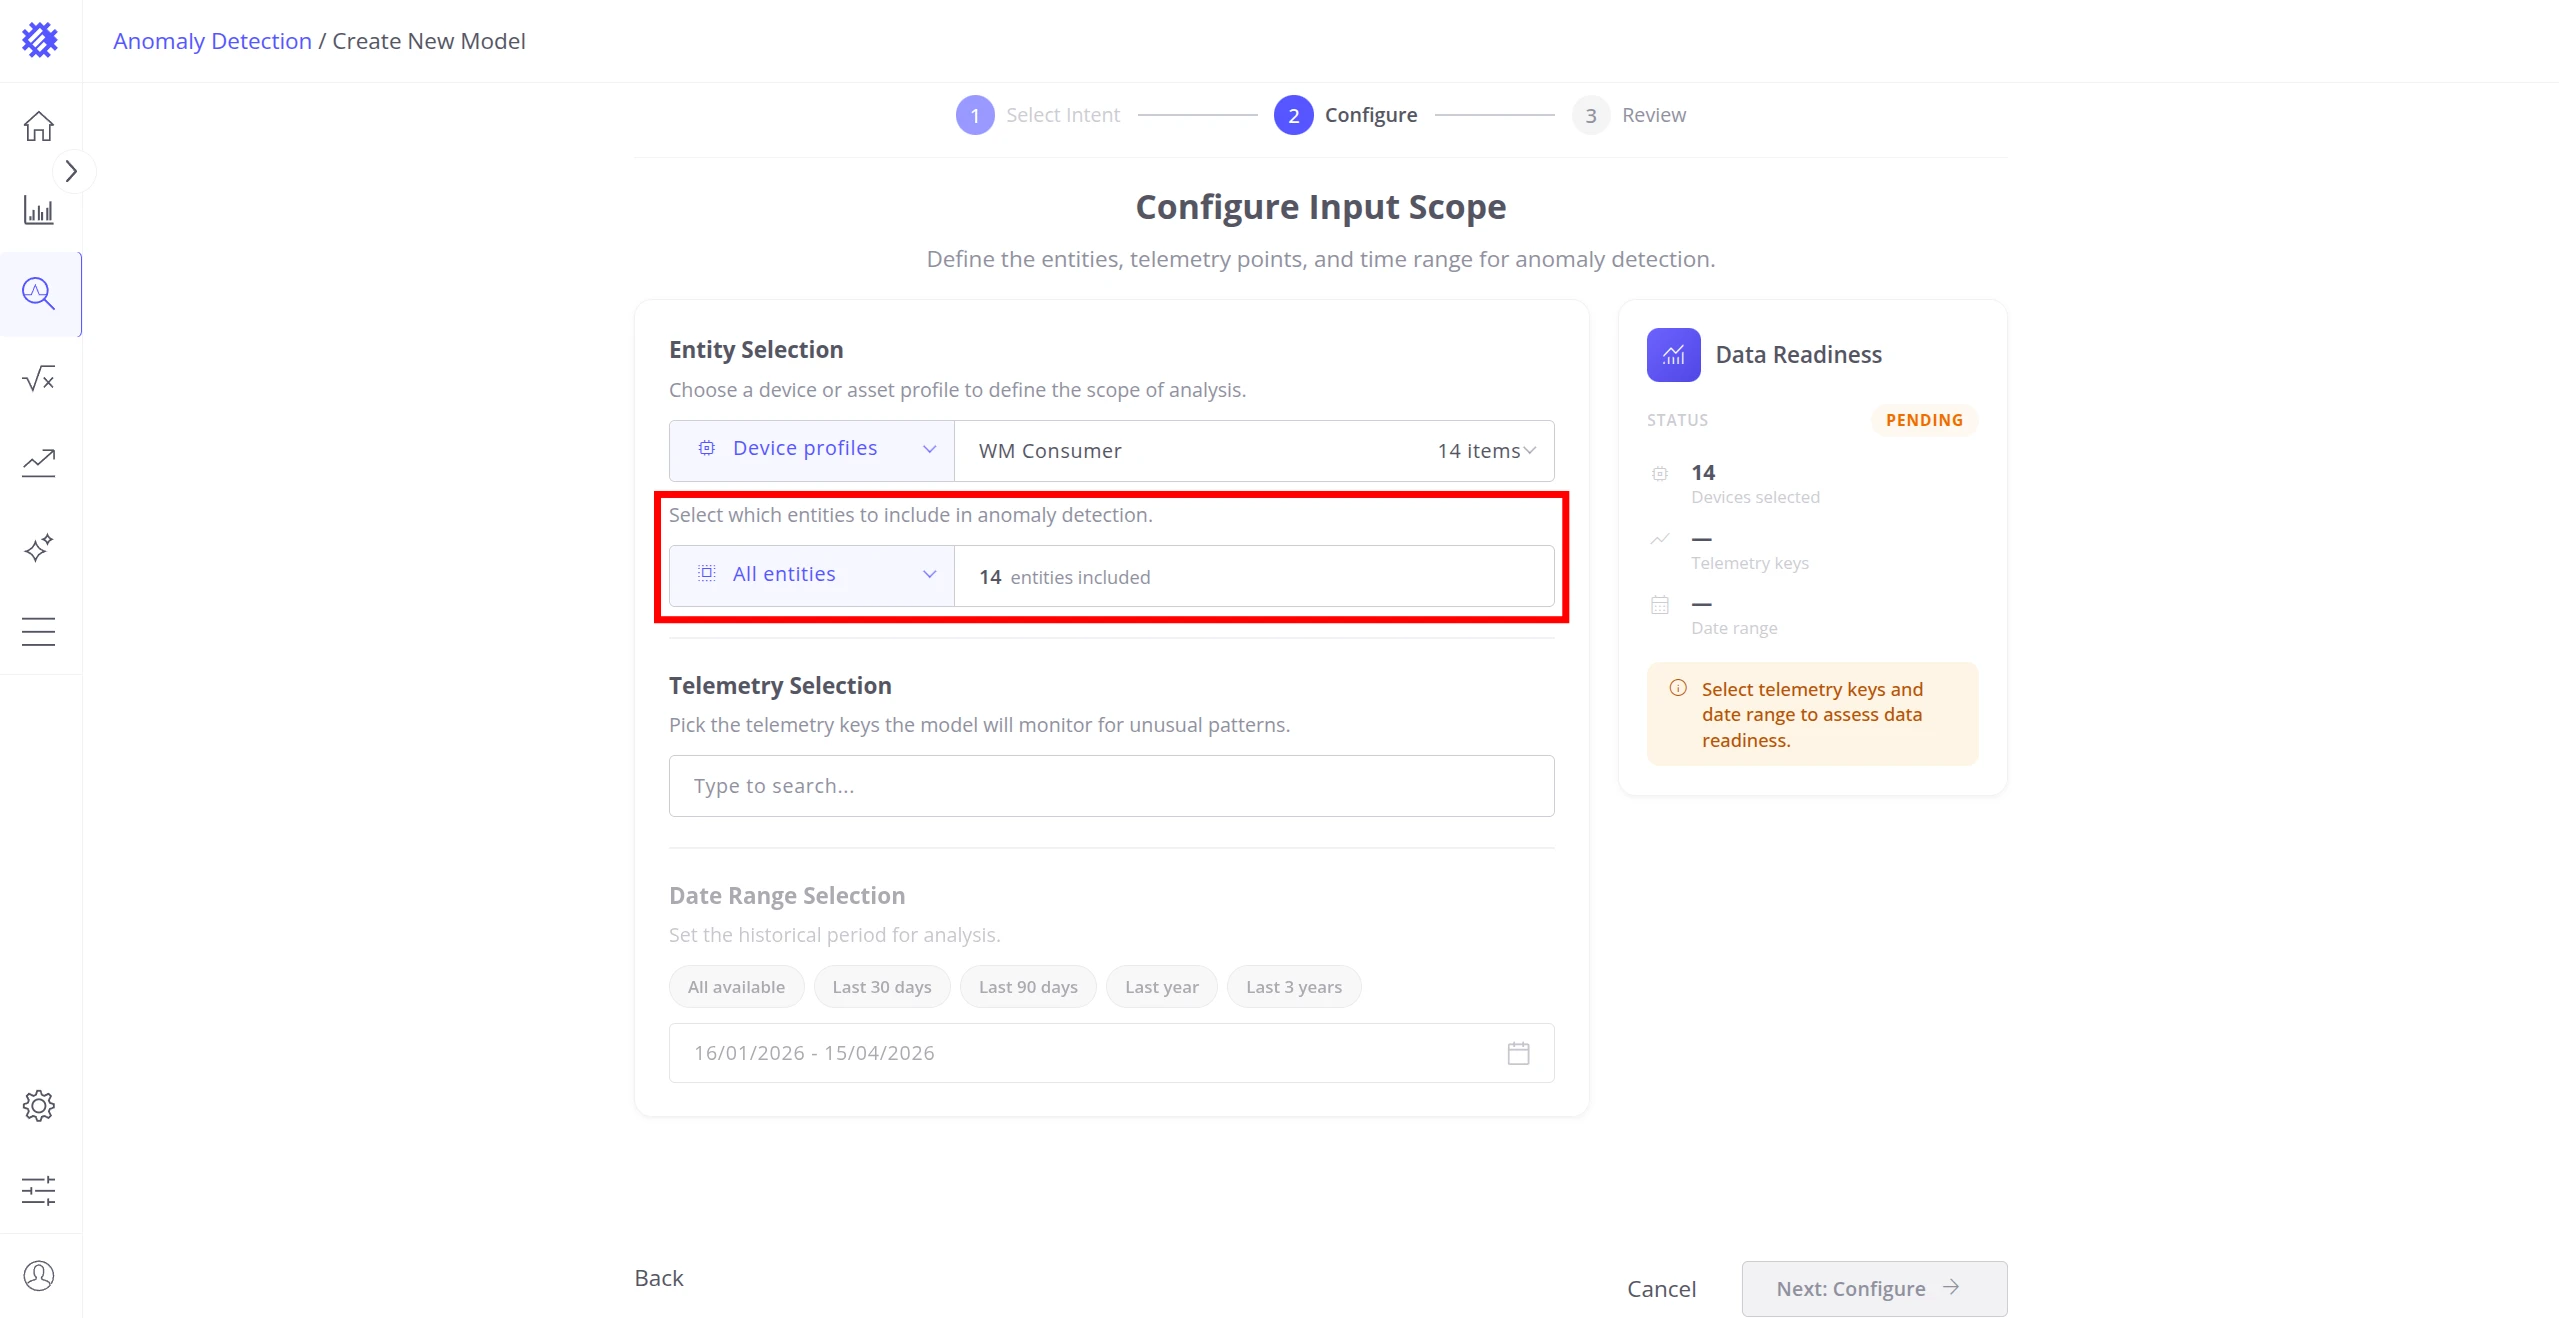
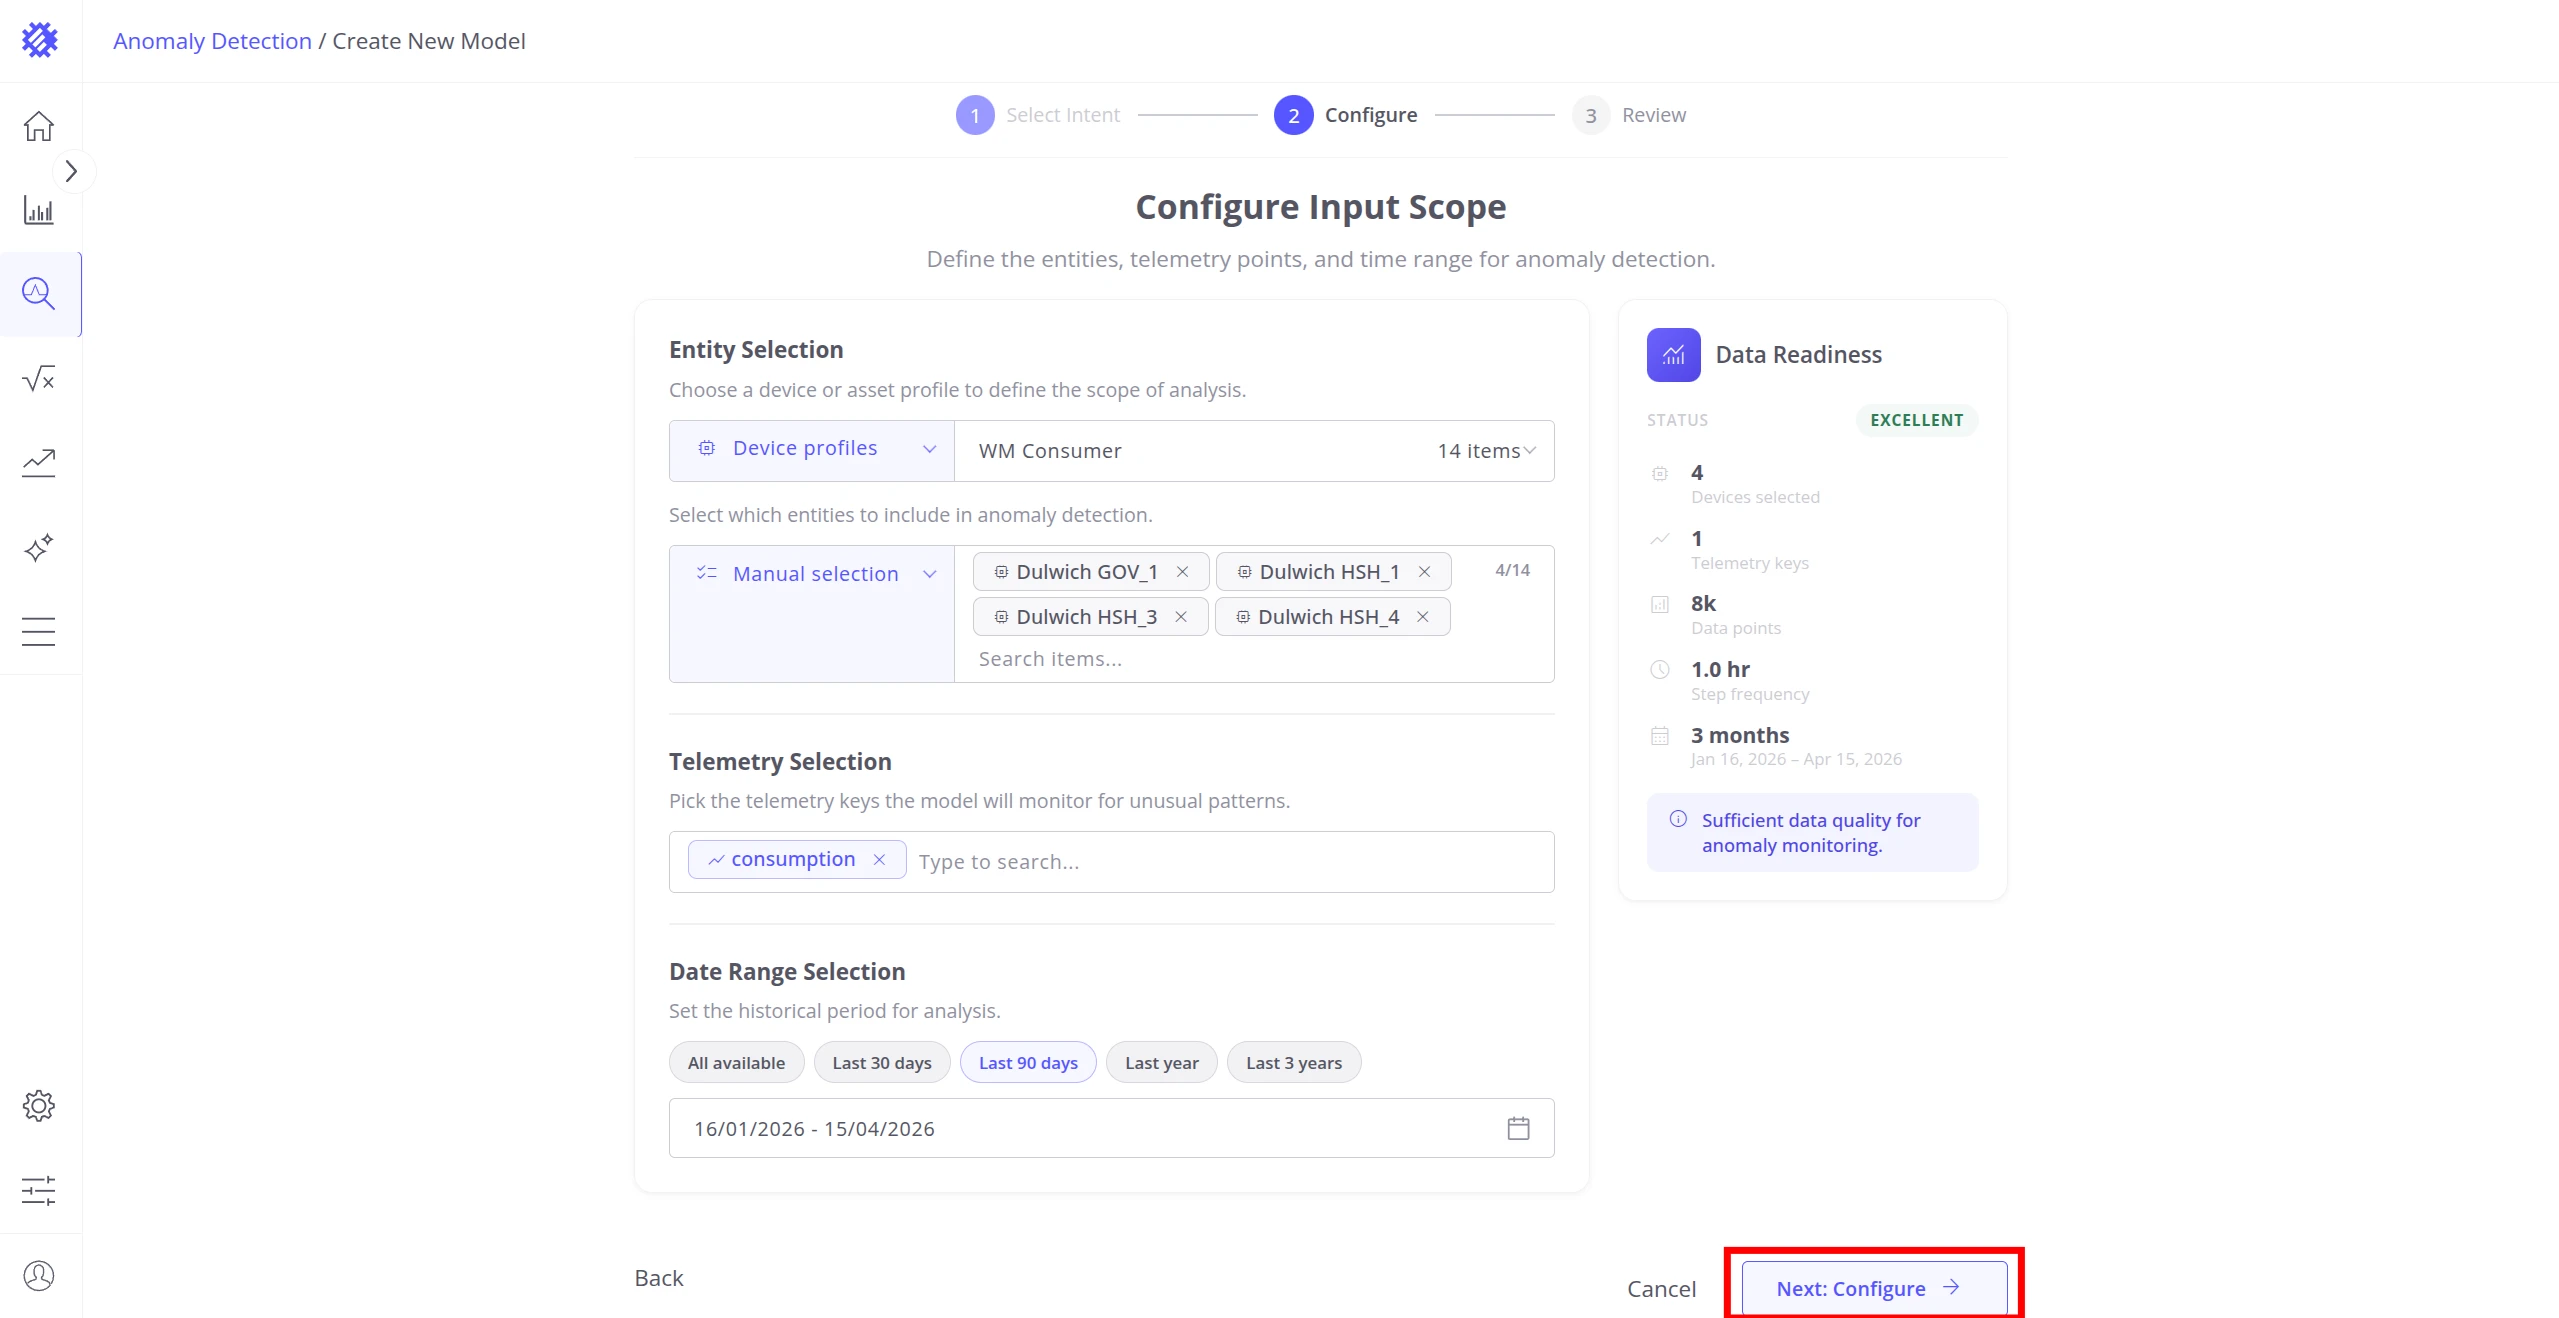
Section titled “Step 3: Configure Input Scope”The Configure step defines the entities, telemetry keys, and time range the model will train on.
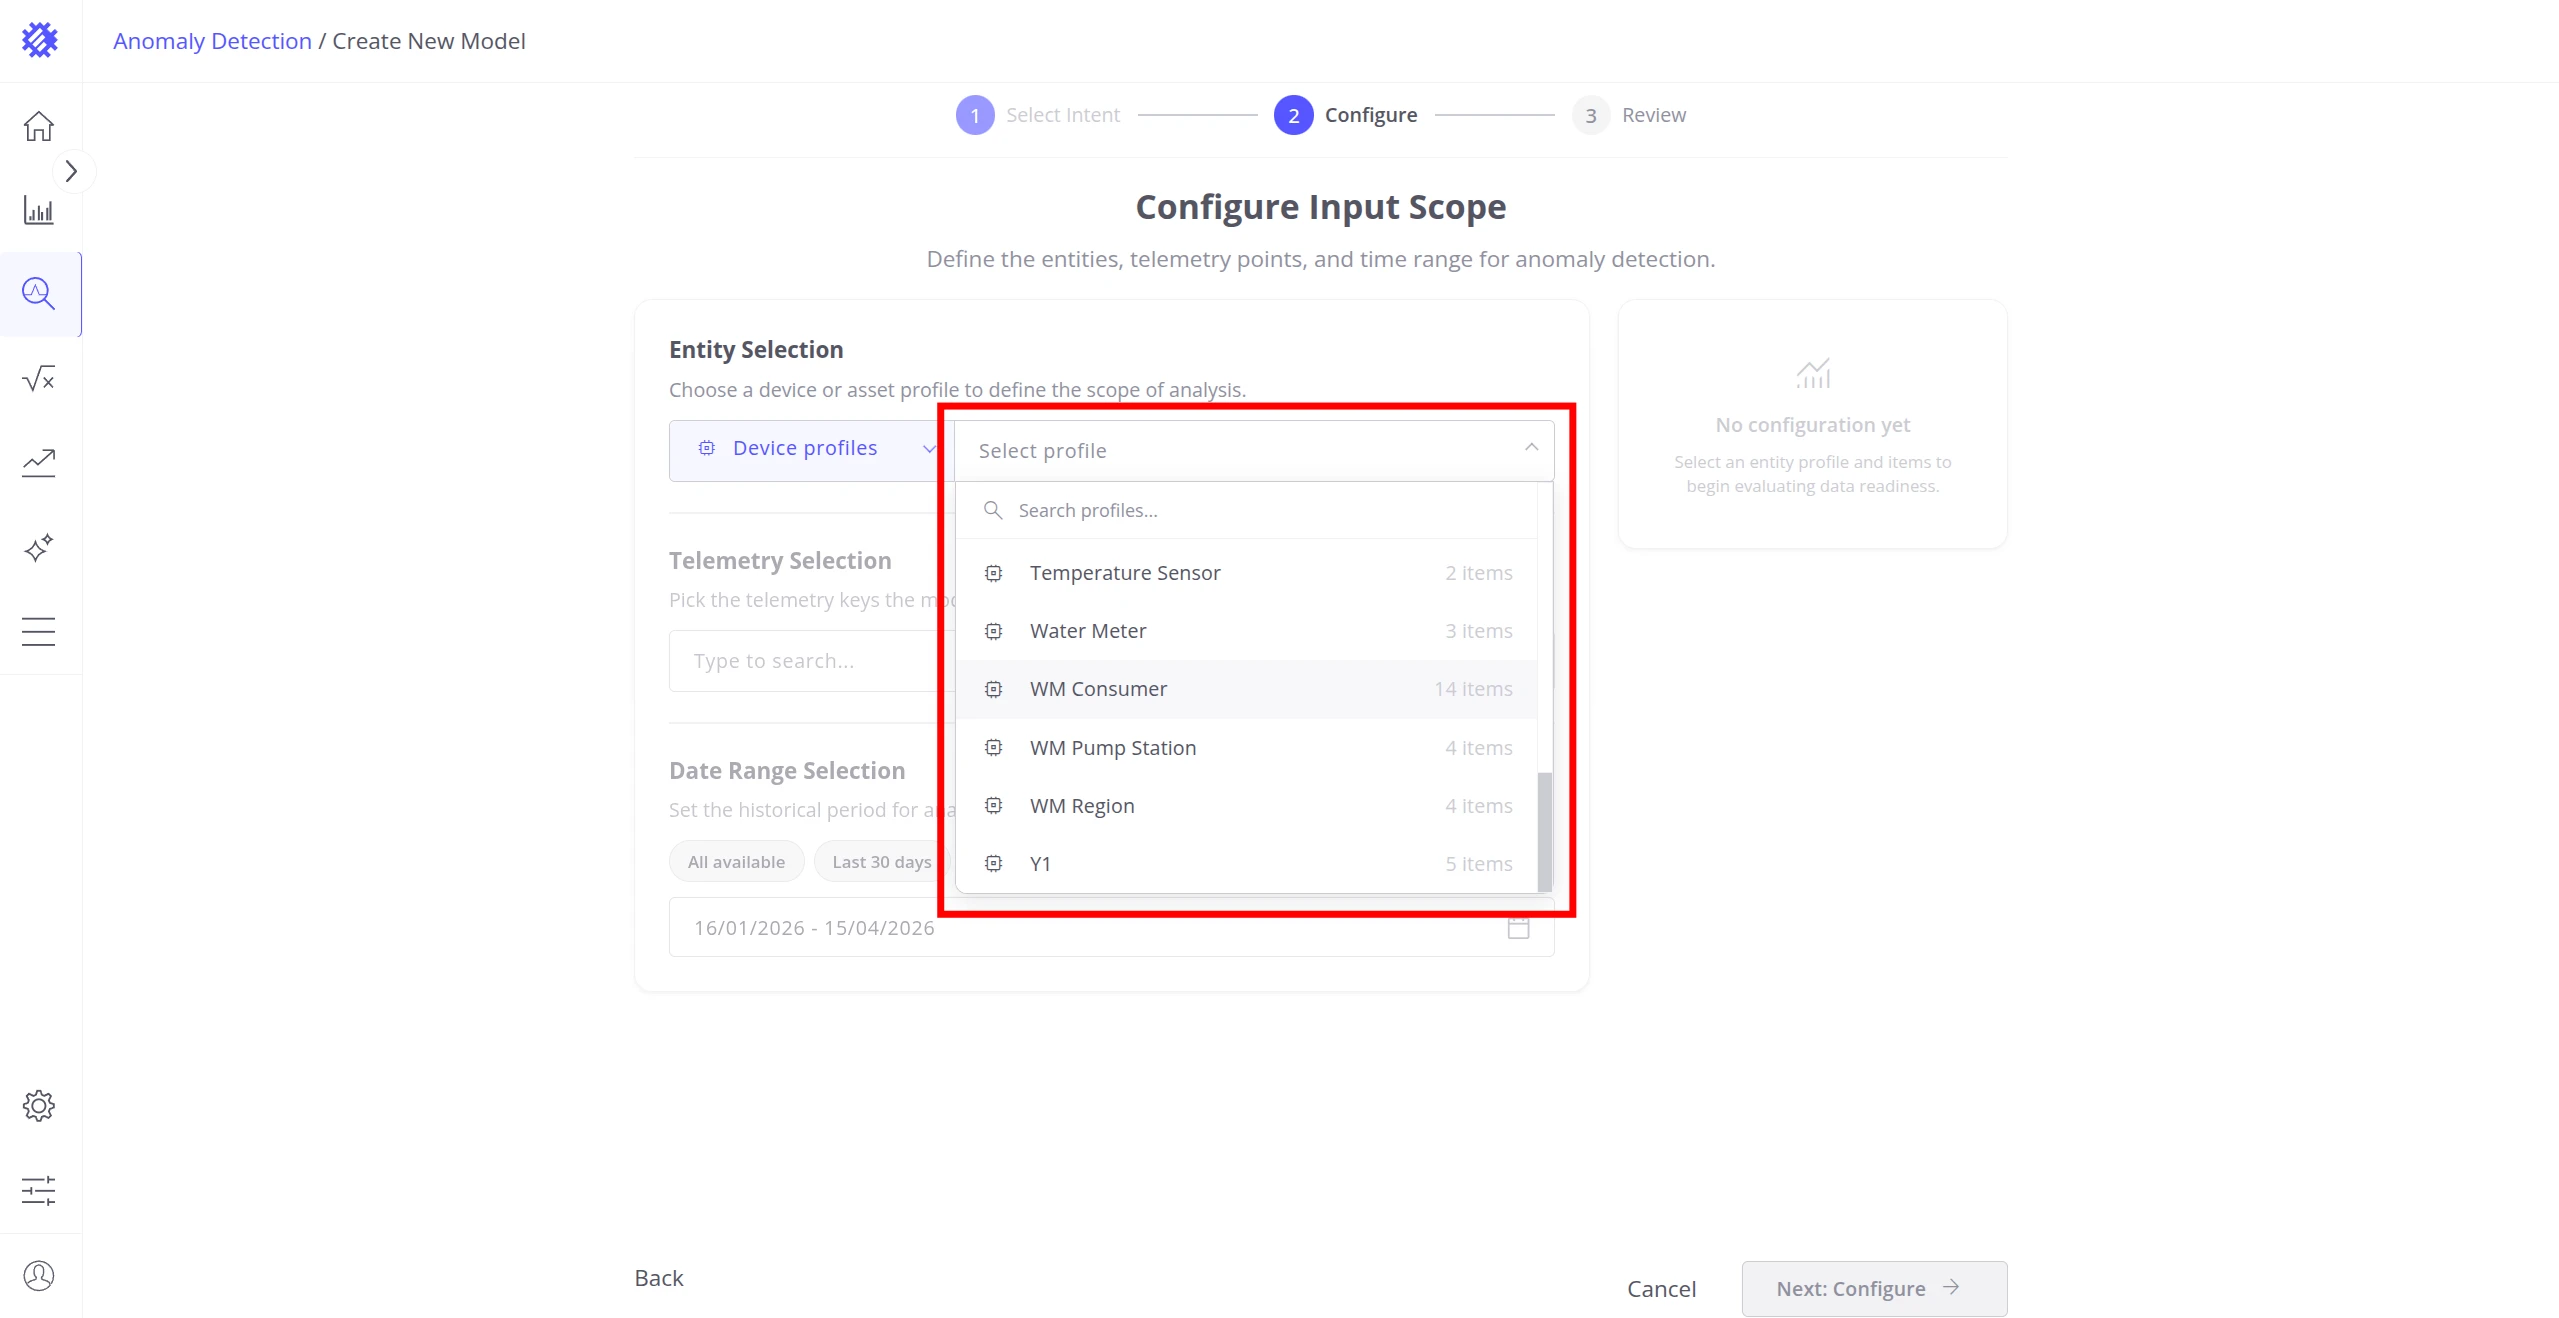
Entity Selection — select the entity type and profile to analyze:
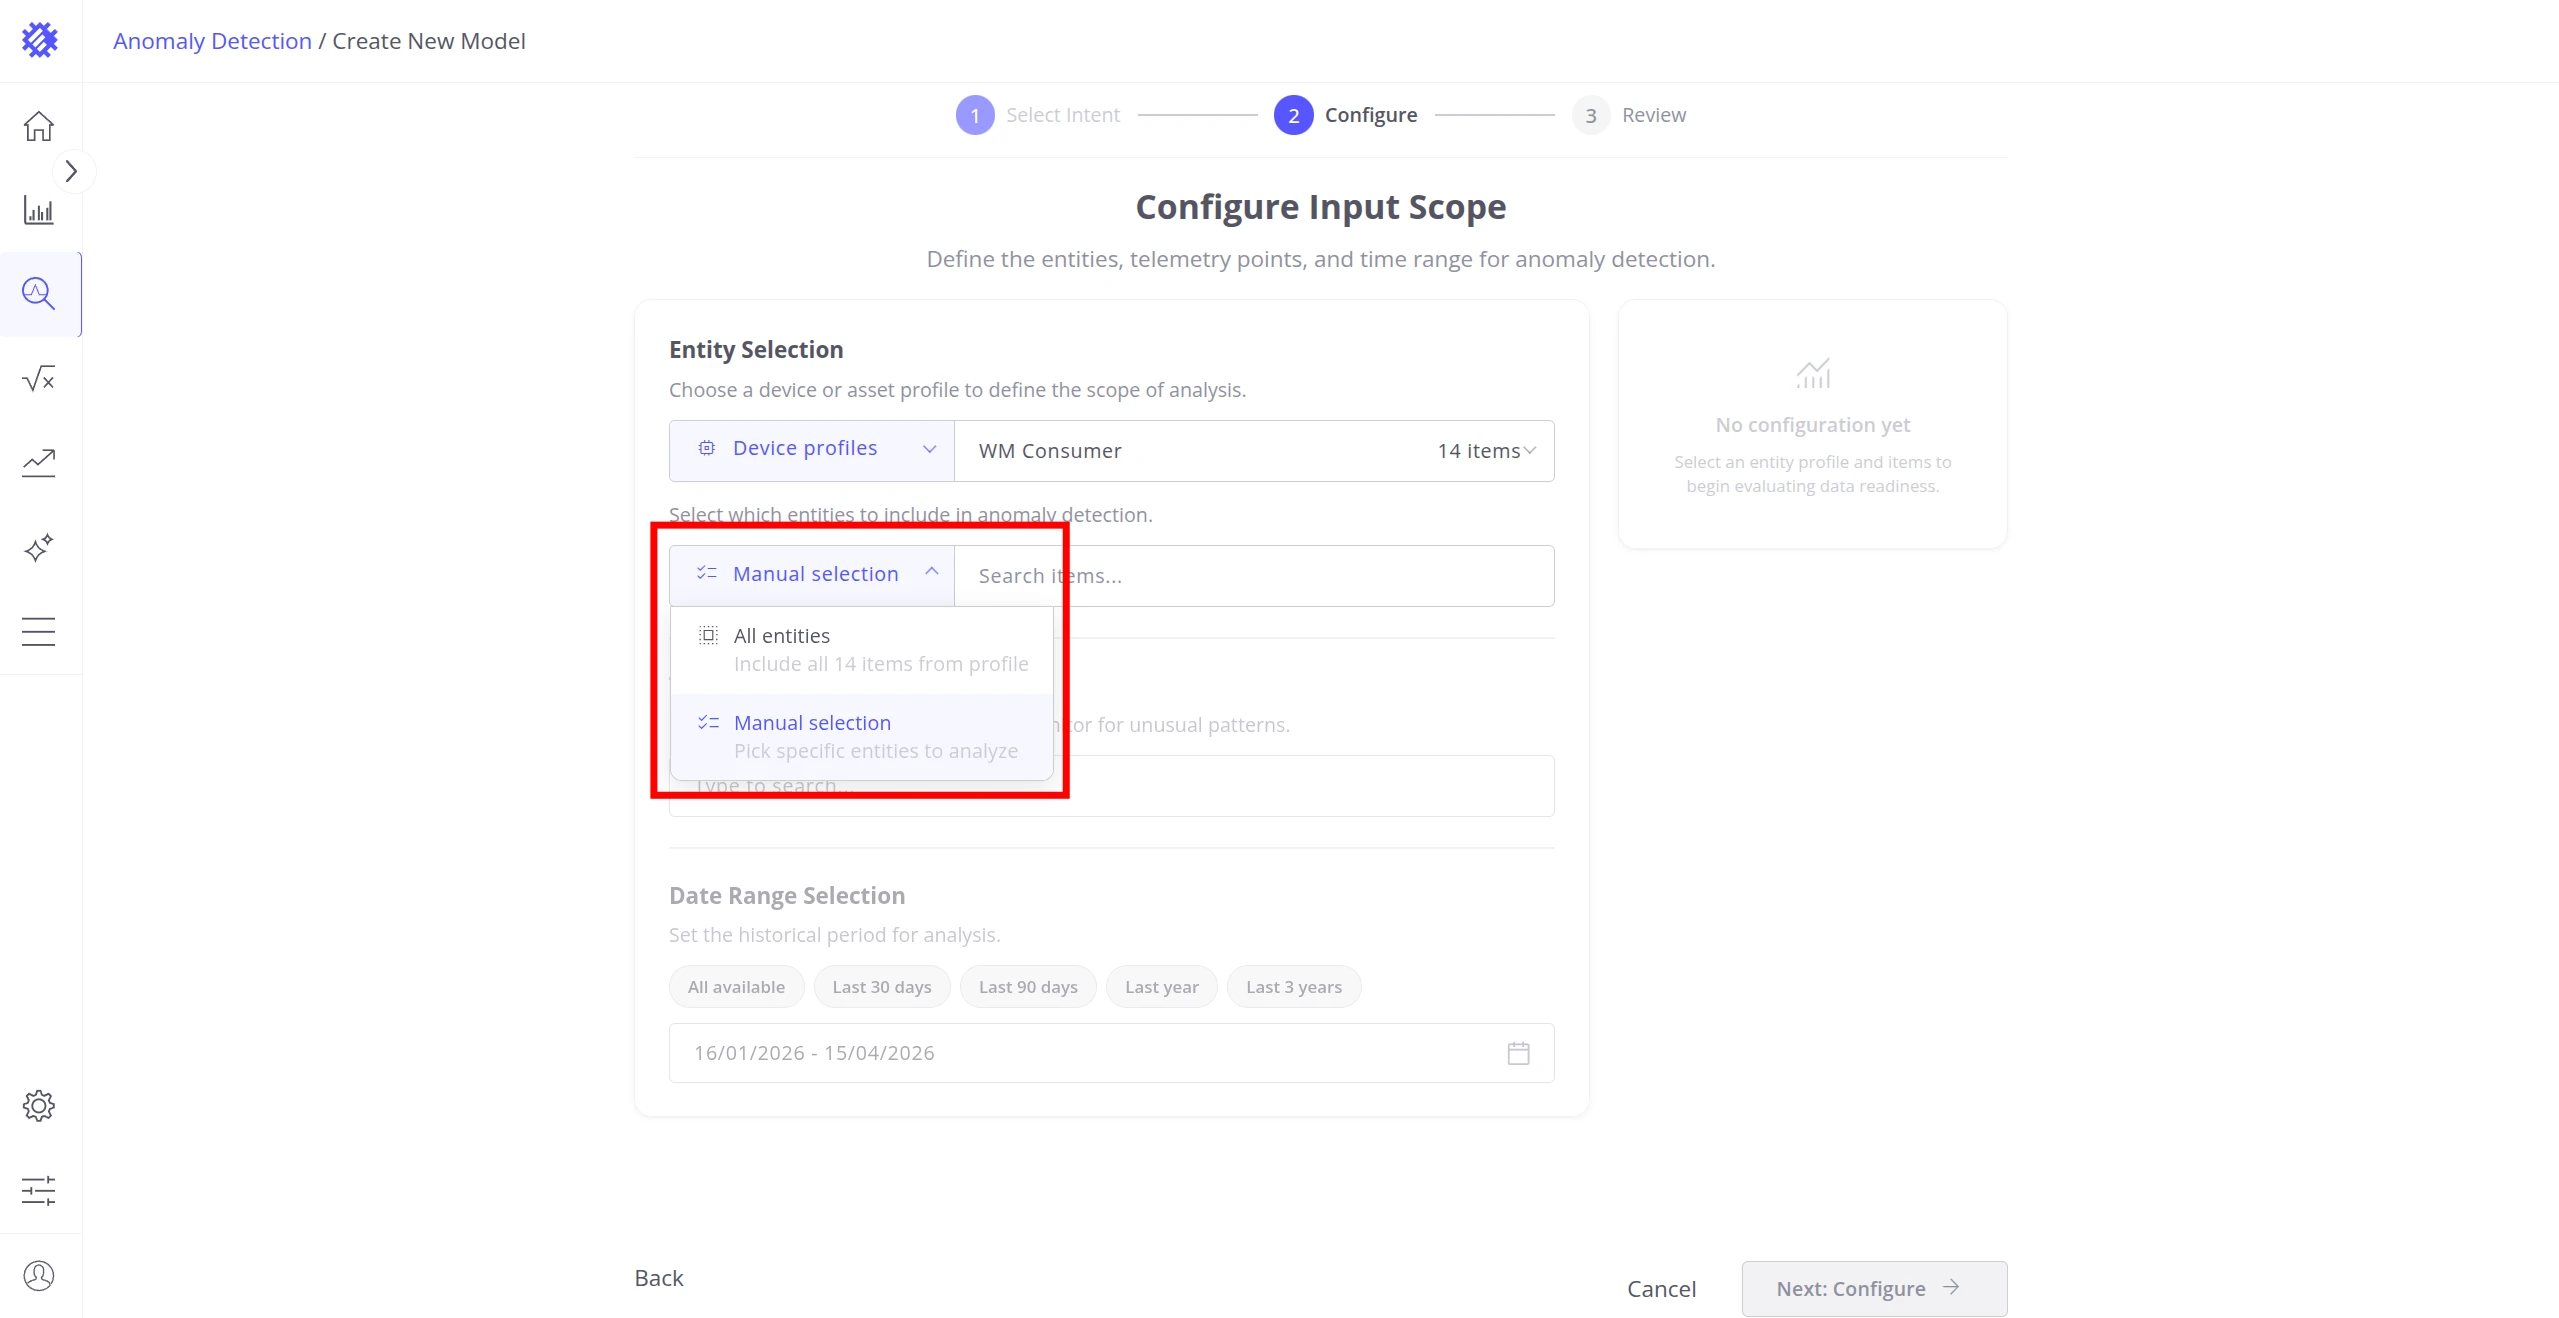
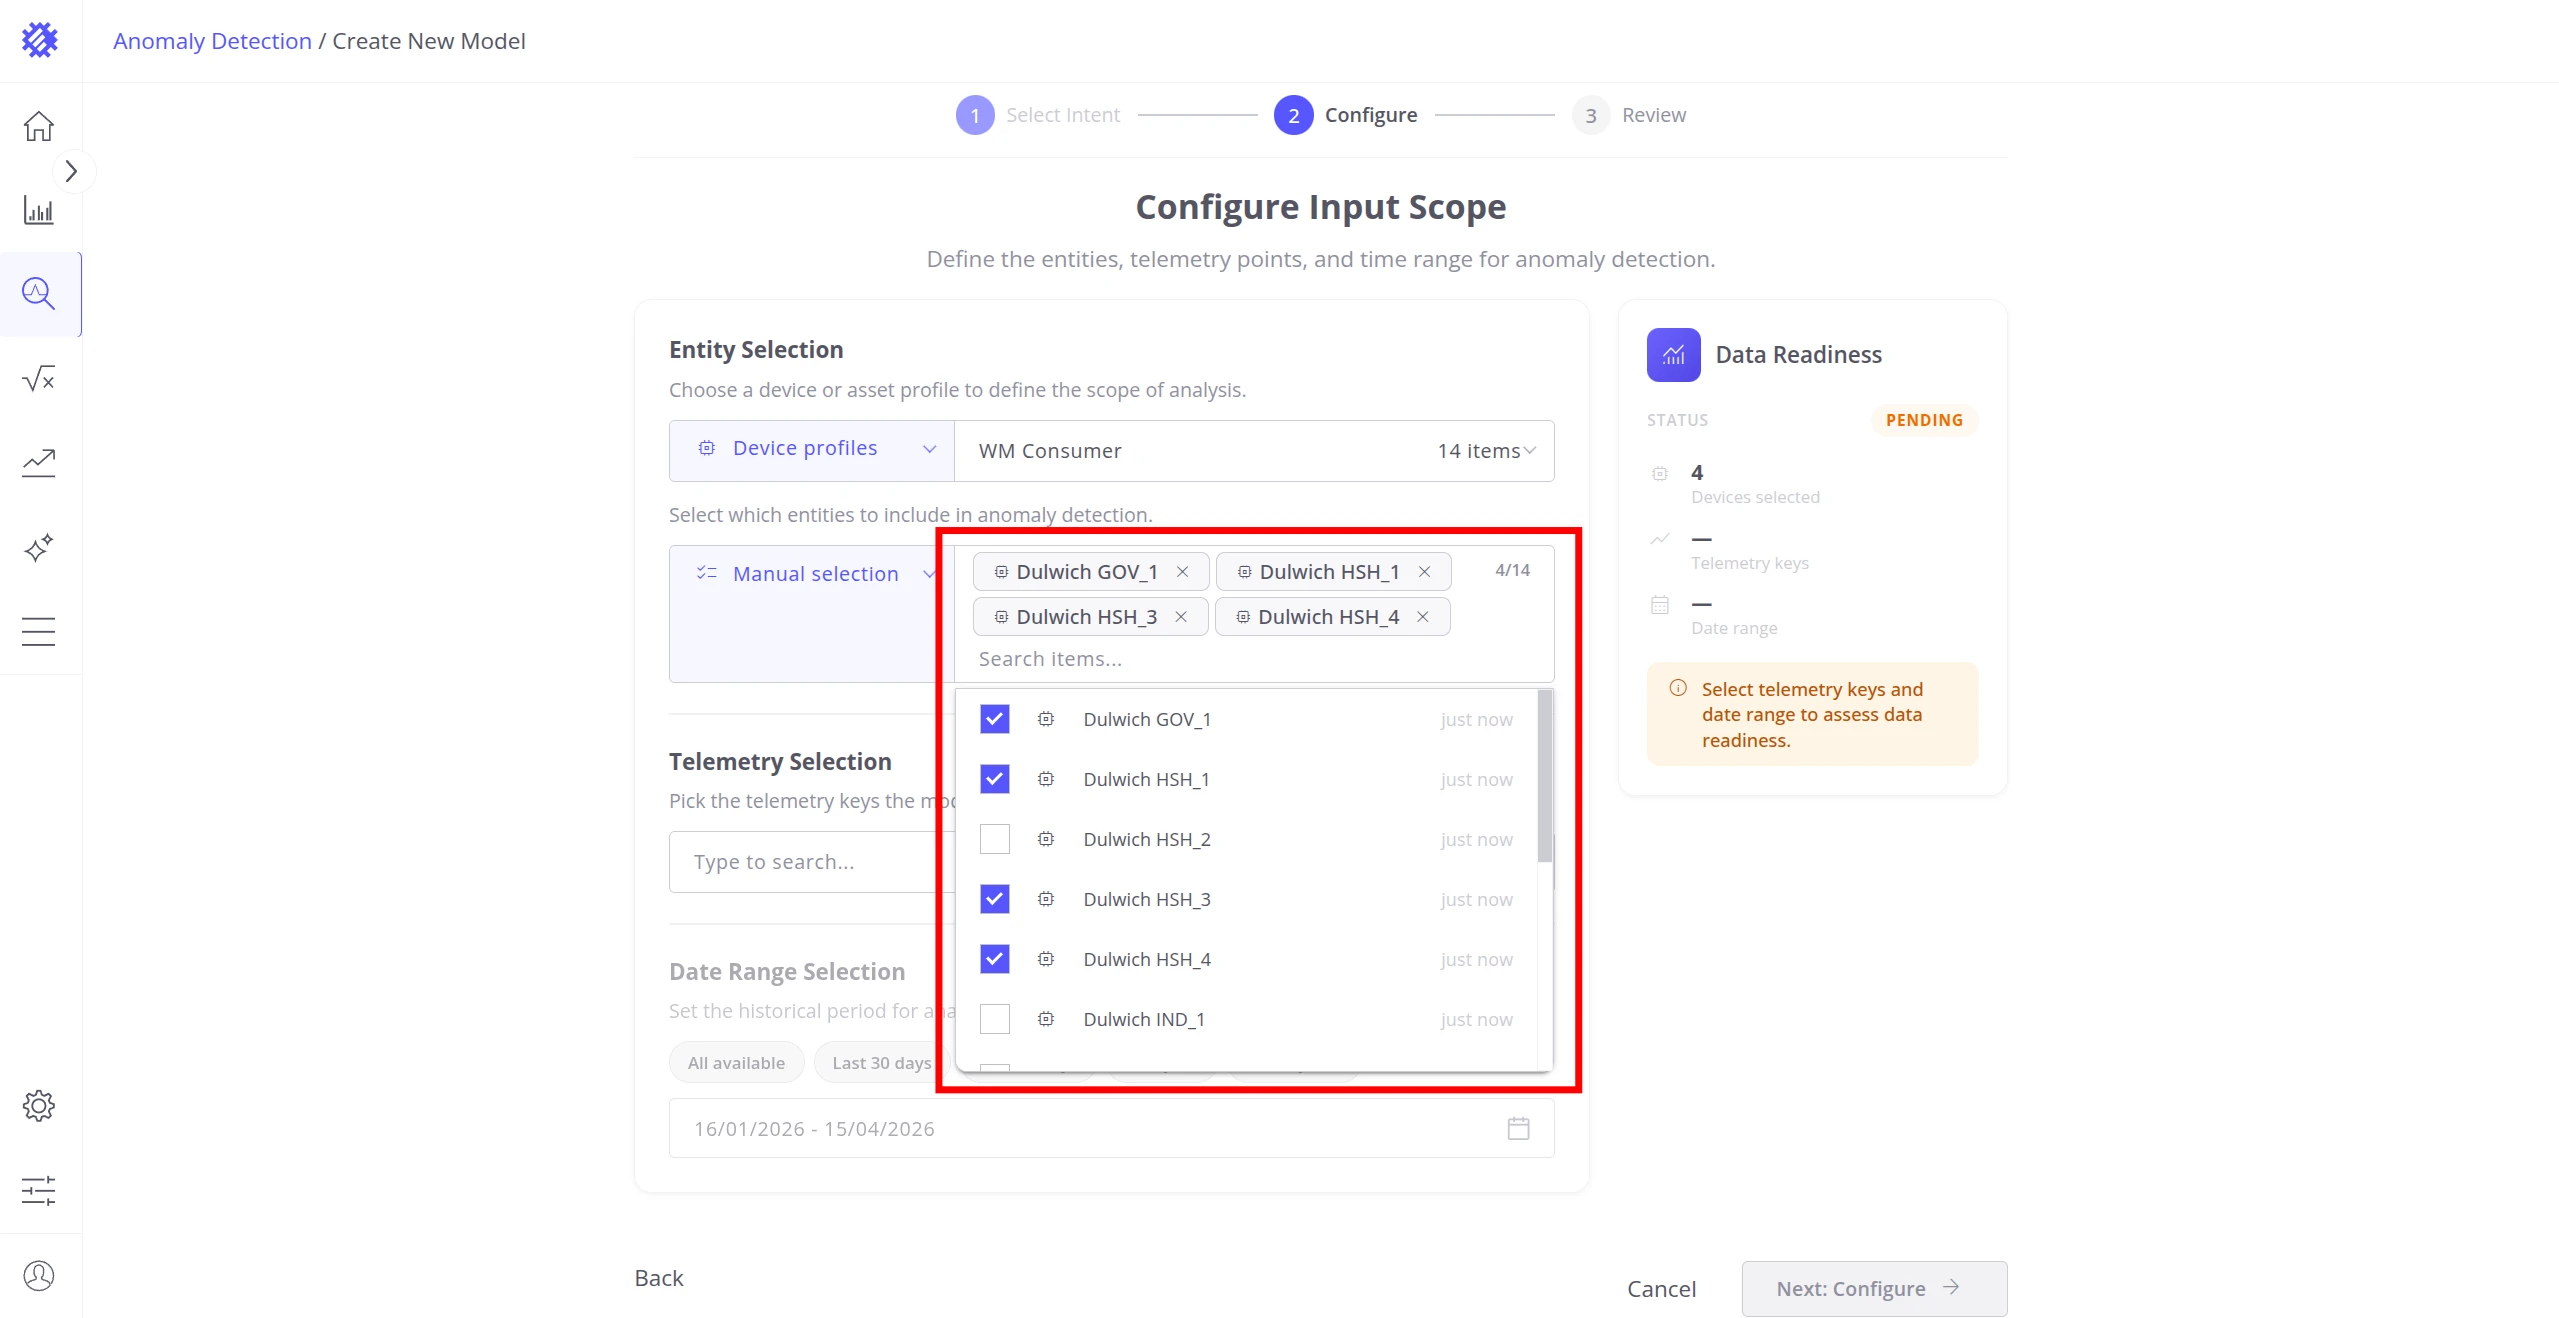
Item Selection — choose which devices or assets from the profile to include:
| Mode | Behavior |
|---|---|
| All entities | Includes every device or asset in the selected profile. |
| Manual selection | Pick specific items from a searchable list. |
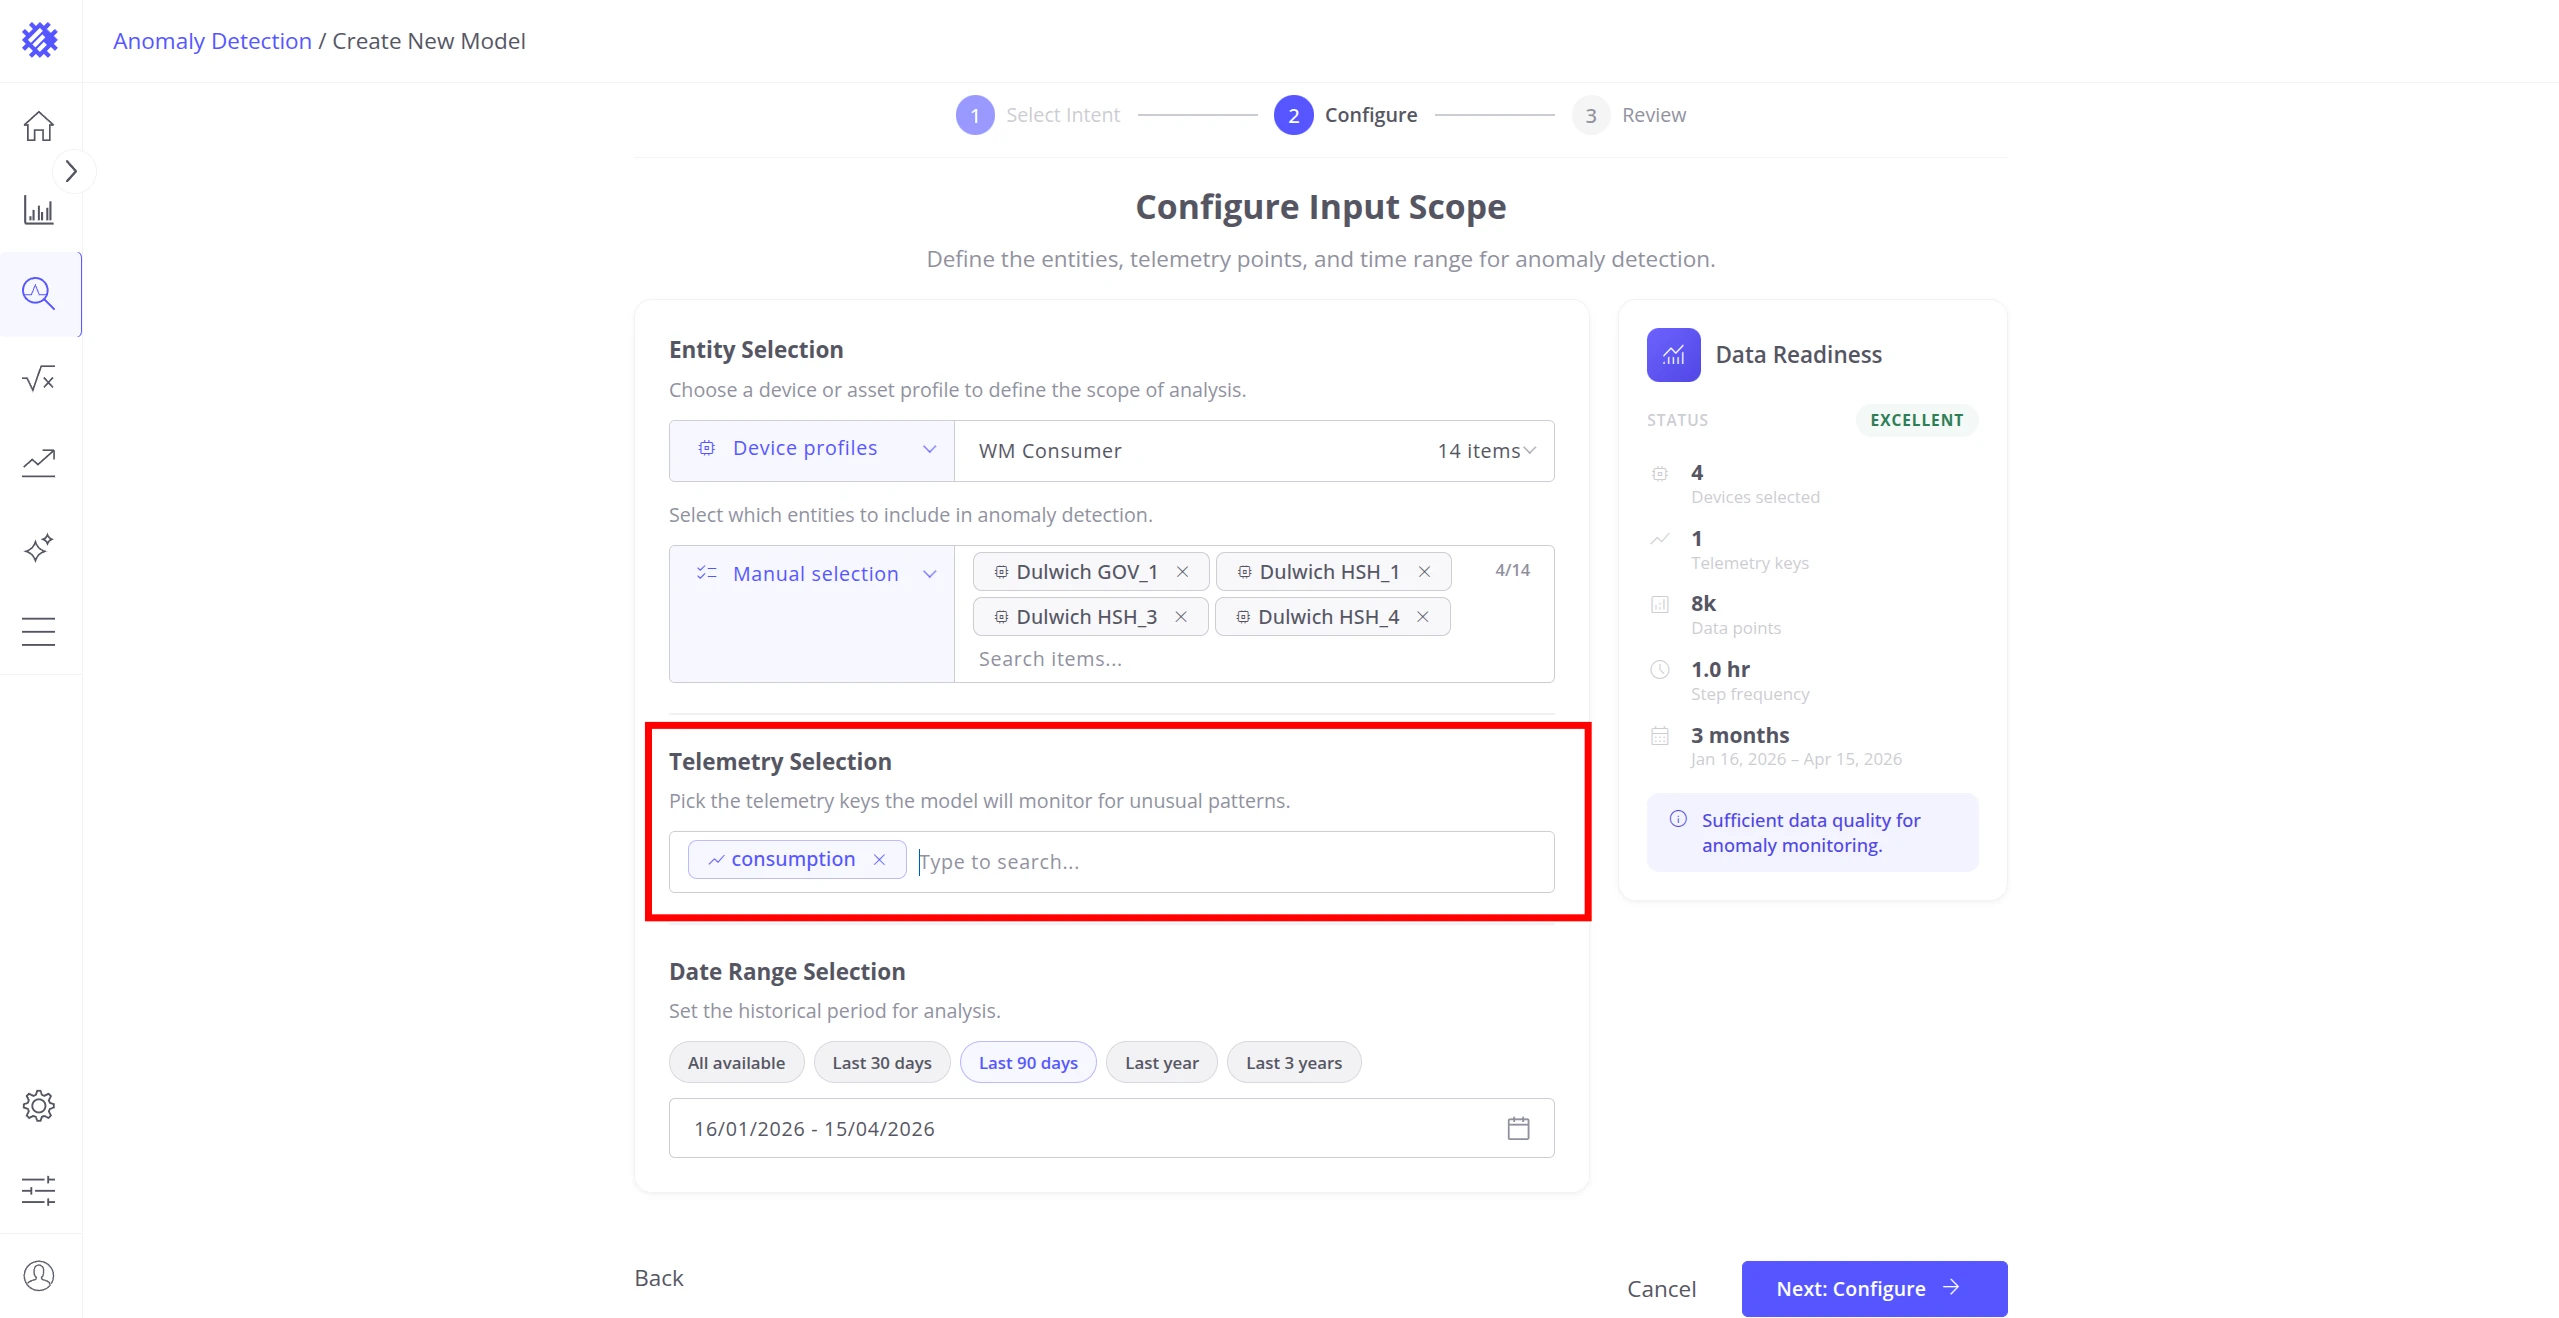
Telemetry Selection — pick the numeric telemetry keys the model will monitor. Type to search all keys available for the selected profile:
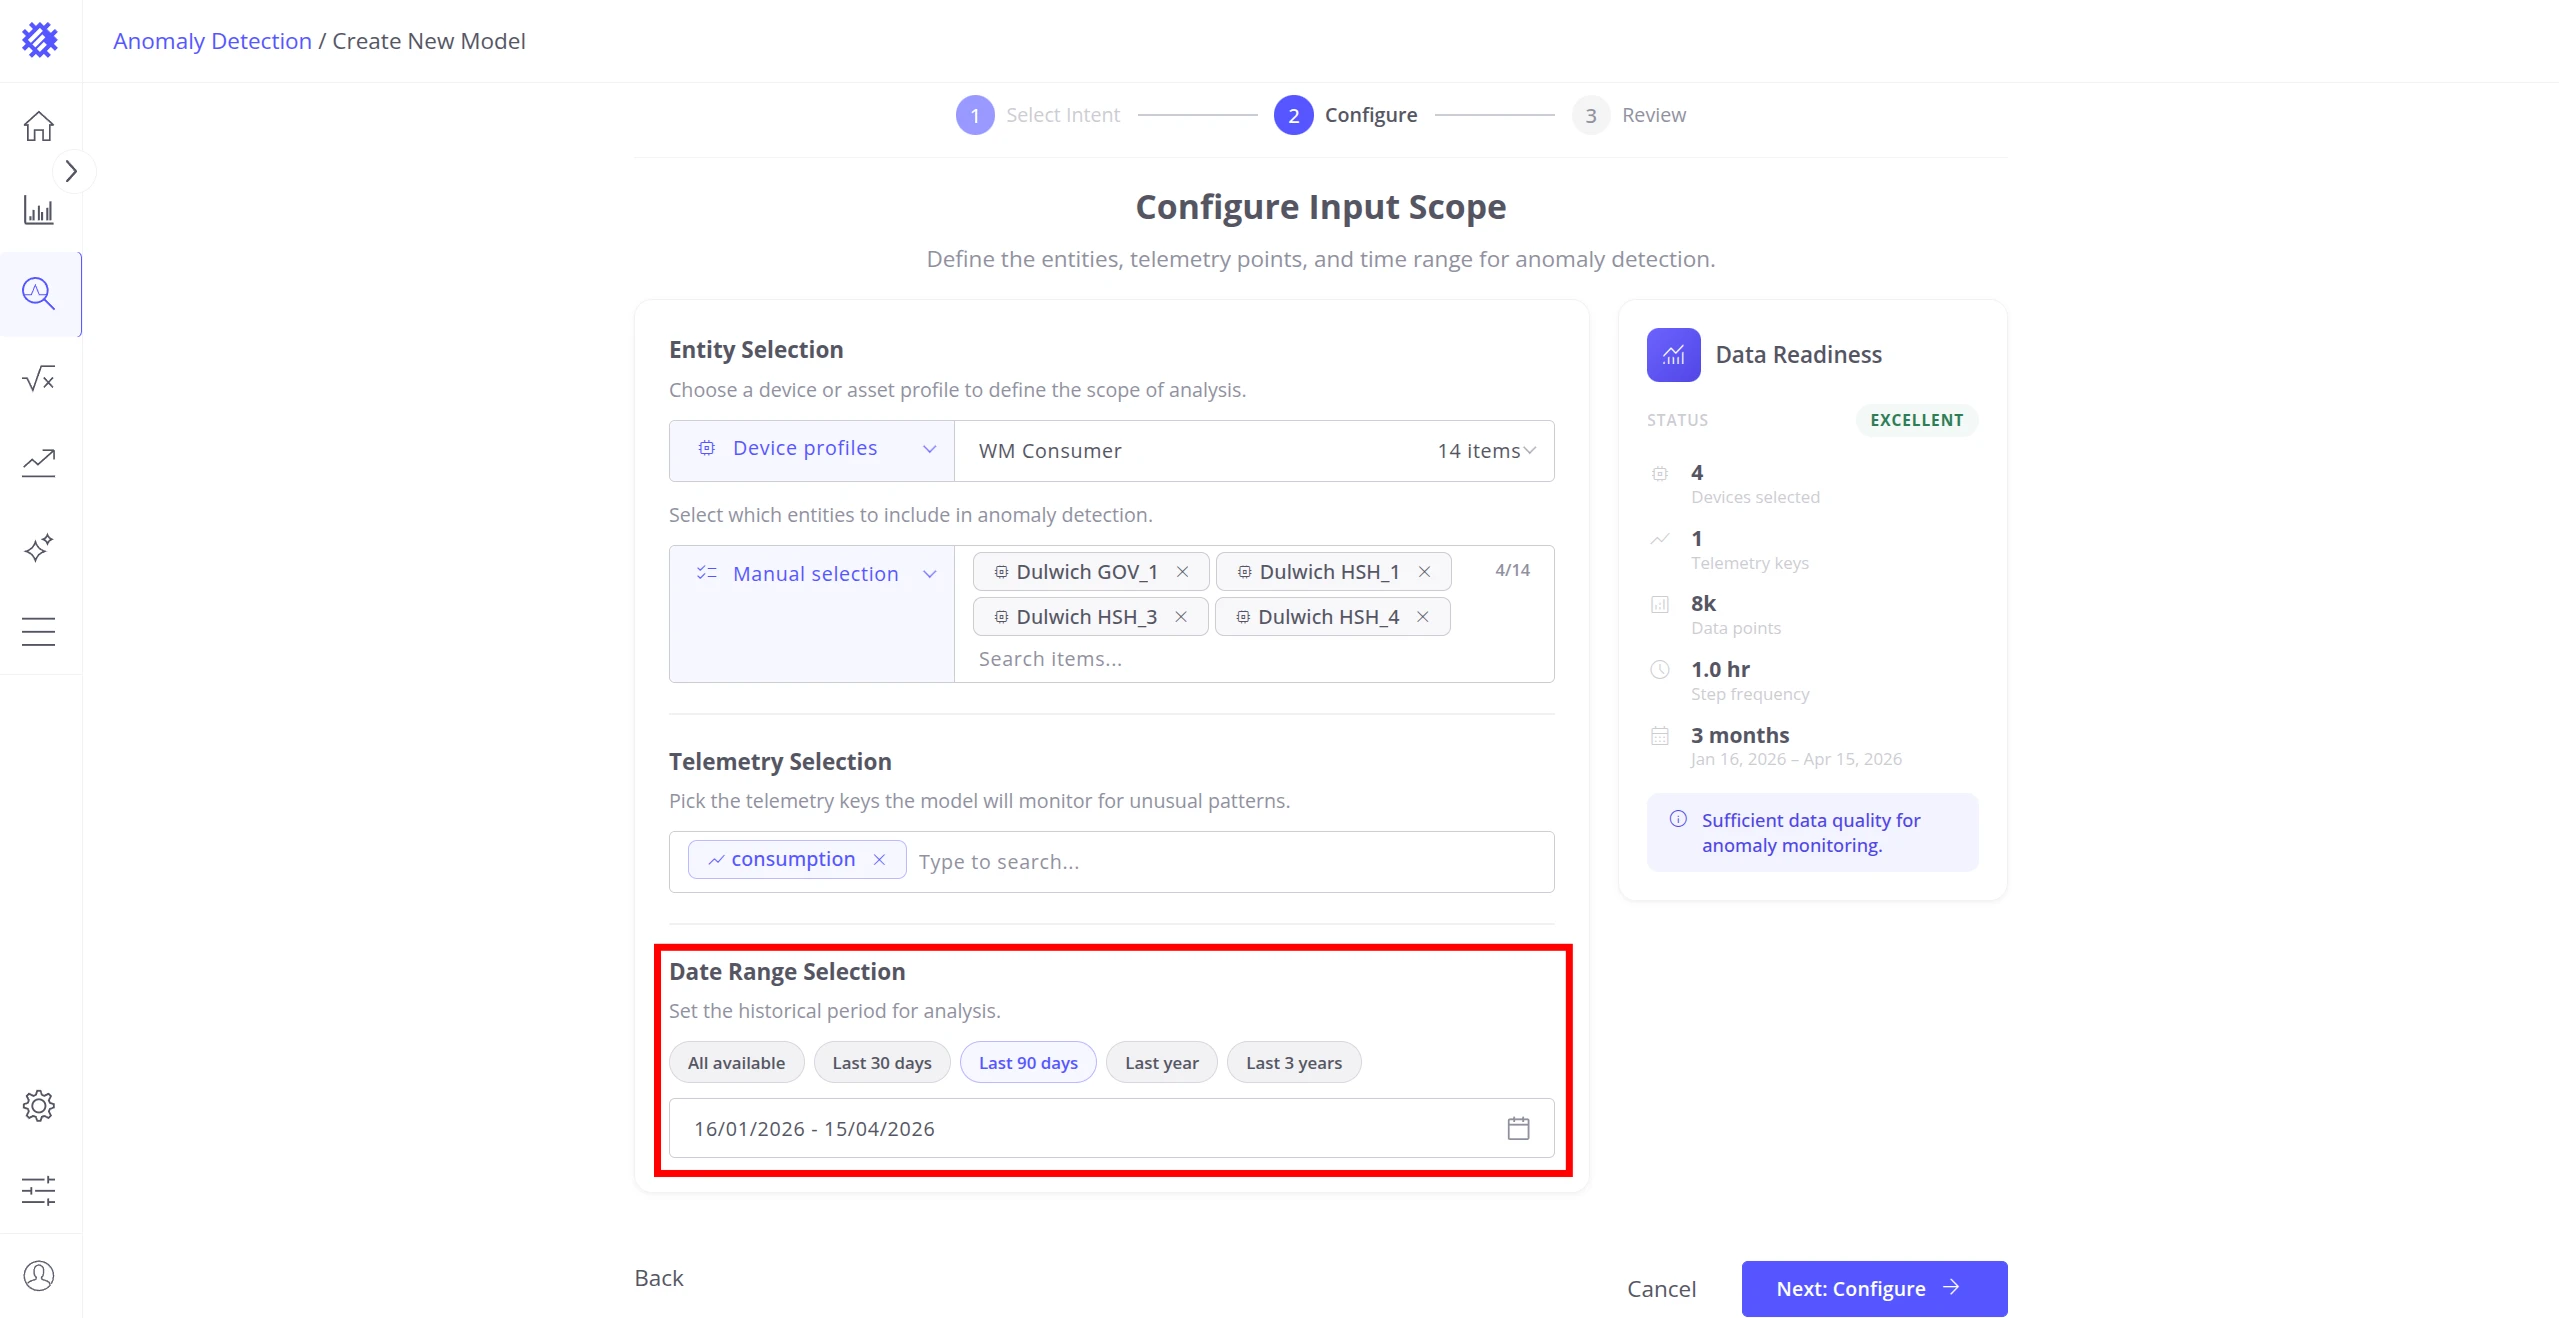
Date Range — set the historical period for training. Use a quick preset or enter a custom range:
Data Readiness — the panel on the right updates in real time as you fill in each field:
| Field | Description |
|---|---|
| Status | Overall assessment: Pending → Poor → Fair → Good → Excellent. |
| Entities | Number of devices or assets selected. |
| Telemetry keys | Number of keys selected. |
| Approximate points | Estimated total data points available for training. |
| Step frequency | Approximate interval between consecutive readings. |
| Time range | Duration of the selected training period. |
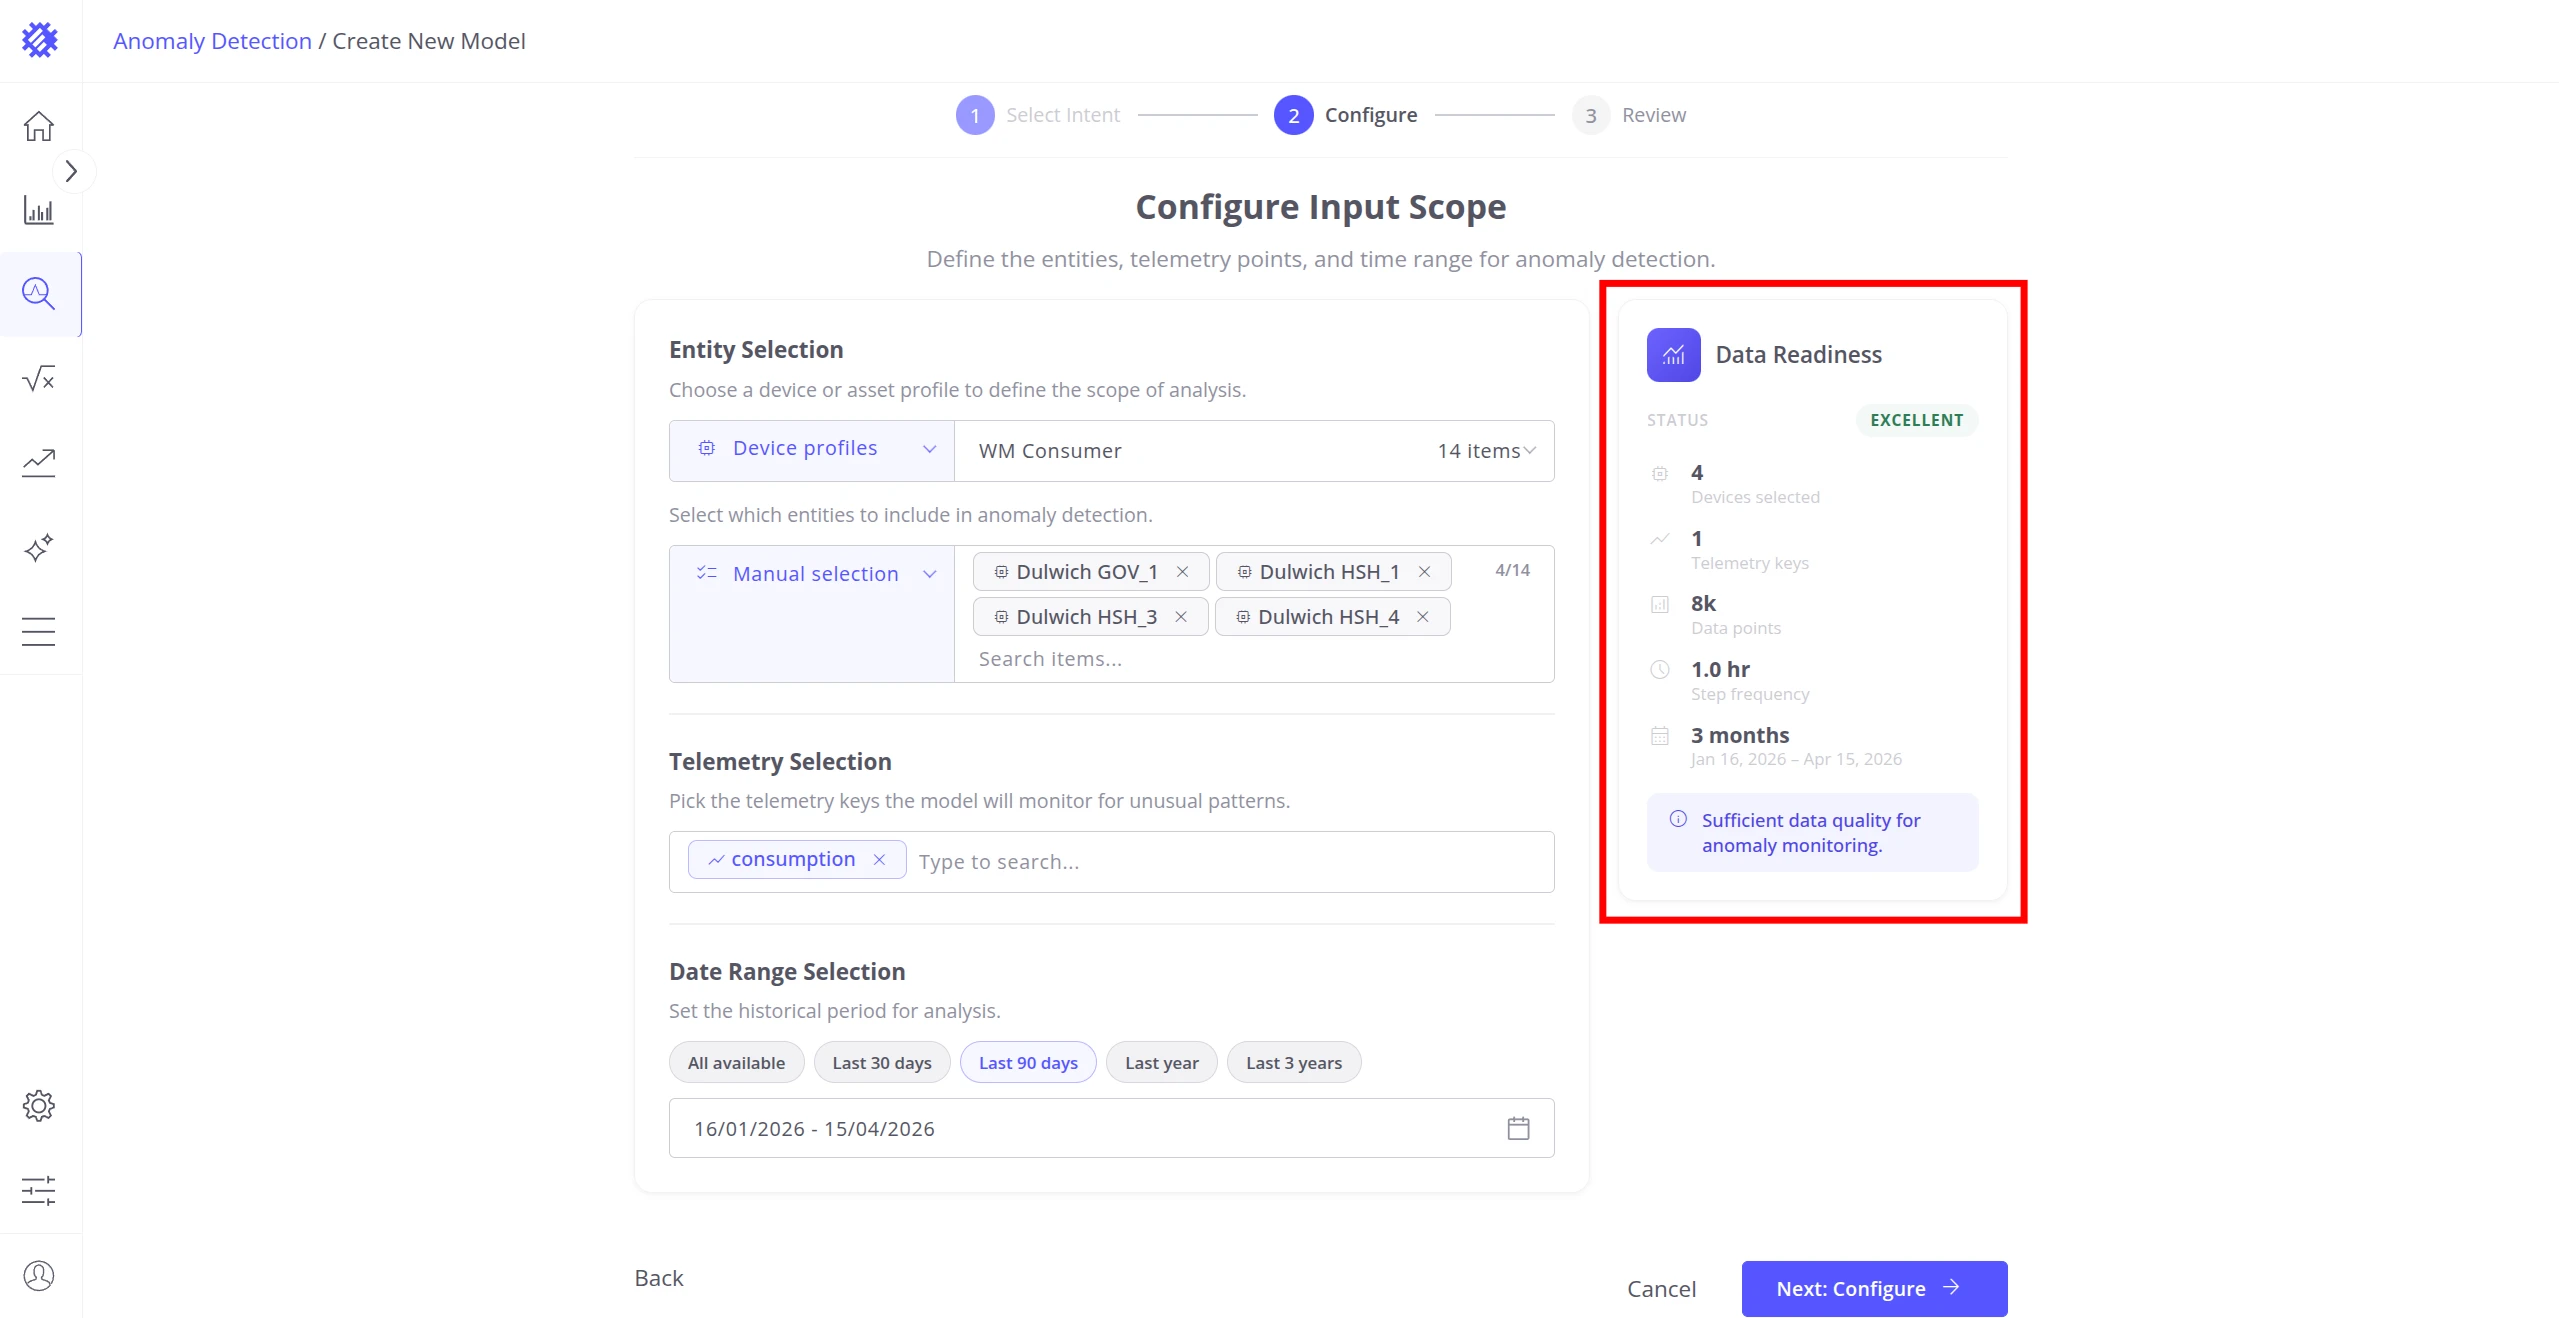
Aim for Good or Excellent before proceeding. A Poor status typically indicates too few data points, too short a time range, or too sparse a telemetry key.
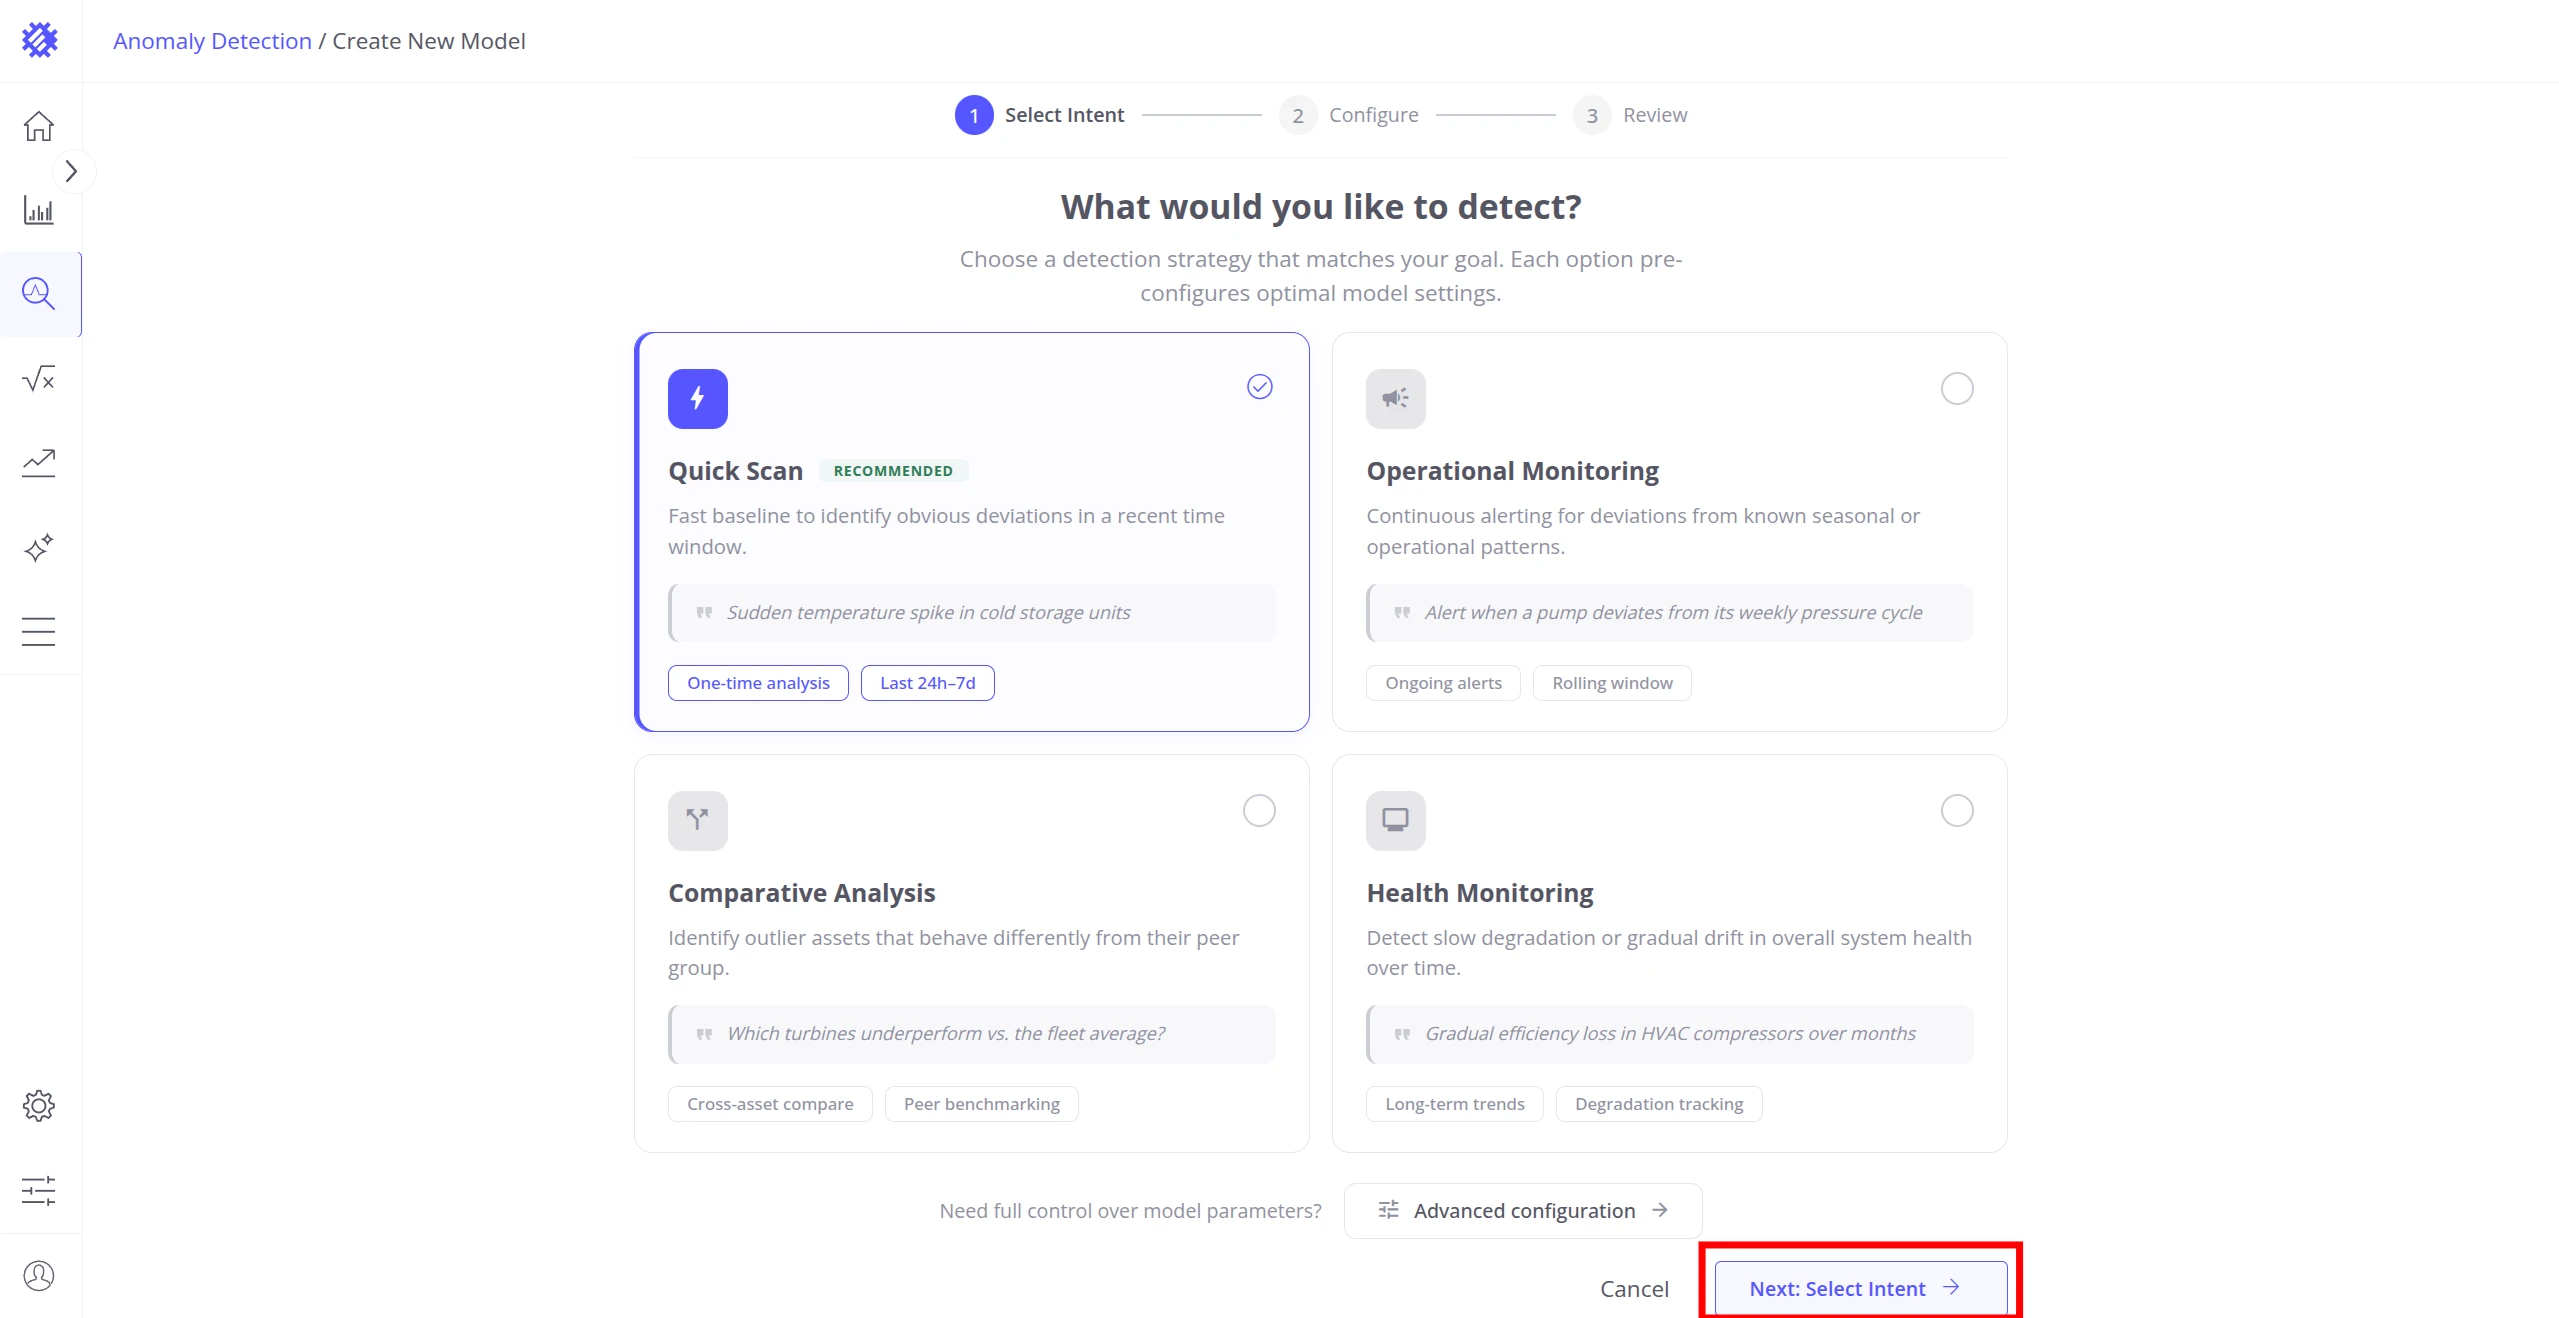
Once the status is acceptable, click Next: Configure to advance to the final step.
Step 4: Review & Build
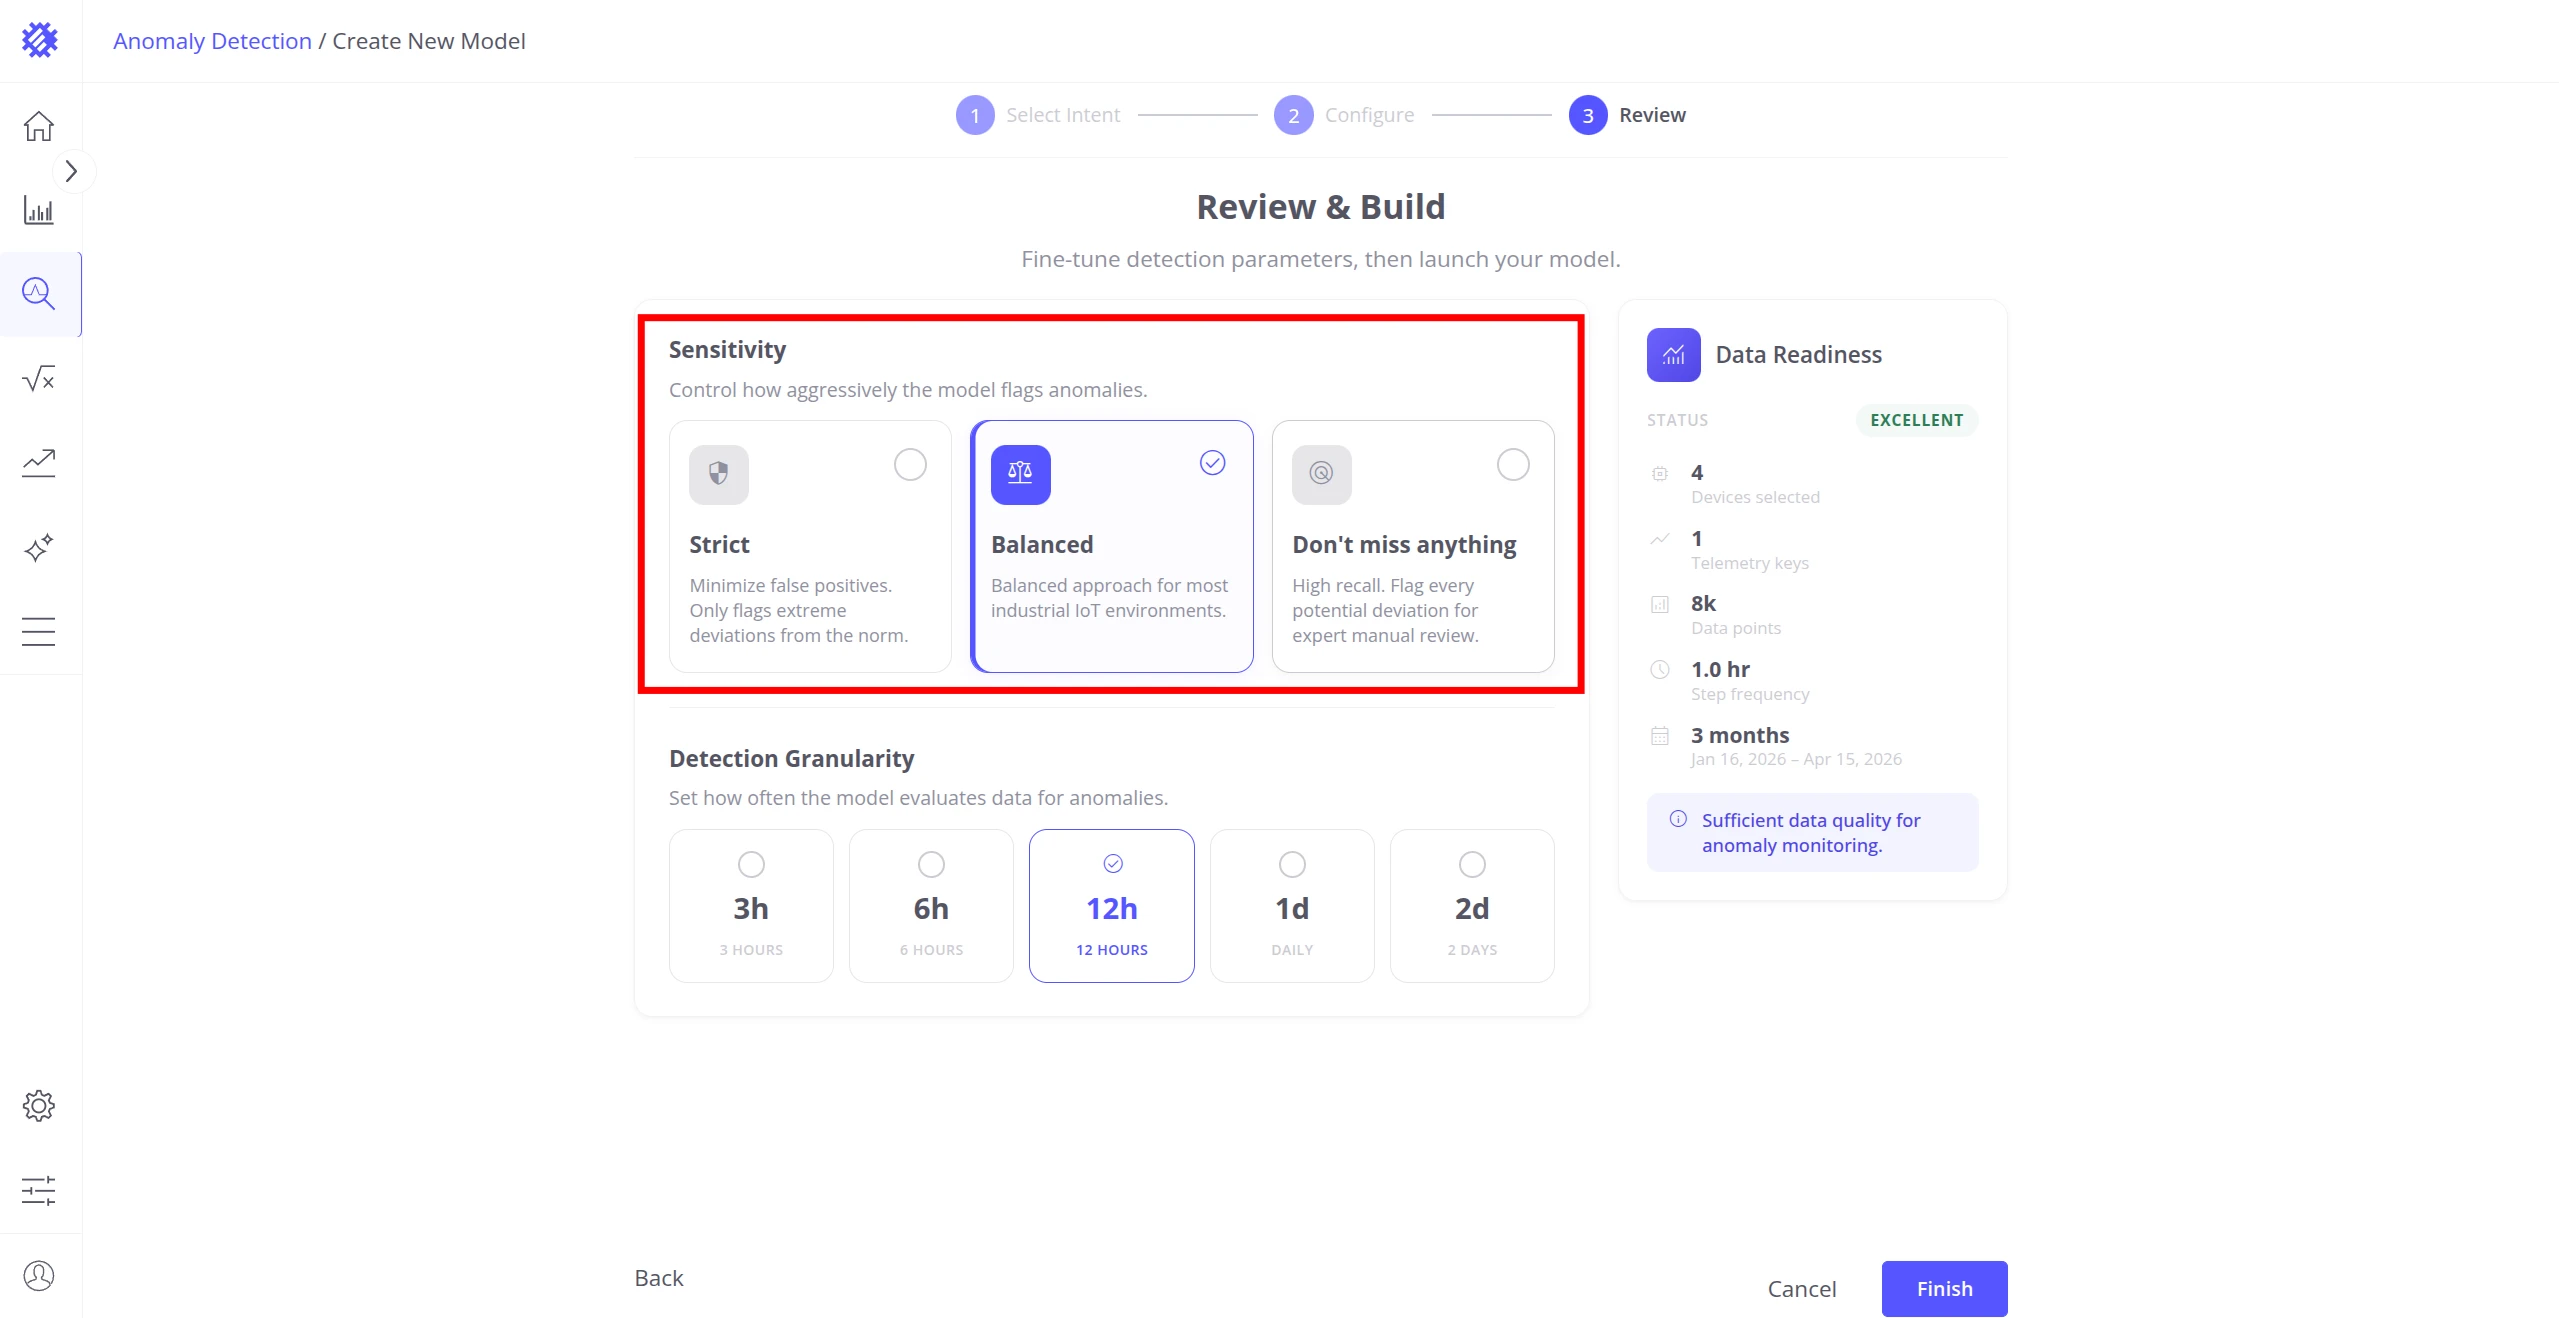
Section titled “Step 4: Review & Build”The Review step lets you fine-tune two parameters before the model trains.
Sensitivity — controls how aggressively the model flags anomalies:
| Option | Behavior |
|---|---|
| Strict | Minimizes false positives. Only flags extreme deviations. Best when alert fatigue is a concern. |
| Balanced (recommended) | Best default for most industrial IoT environments. |
| Don’t miss anything | Maximum recall — flags every potential deviation for expert review. Expect more false positives. |
Detection Granularity — the time window the model evaluates data in. Trendz suggests up to five options based on your data’s step frequency. Shorter windows catch brief spikes; longer windows surface gradual drift.
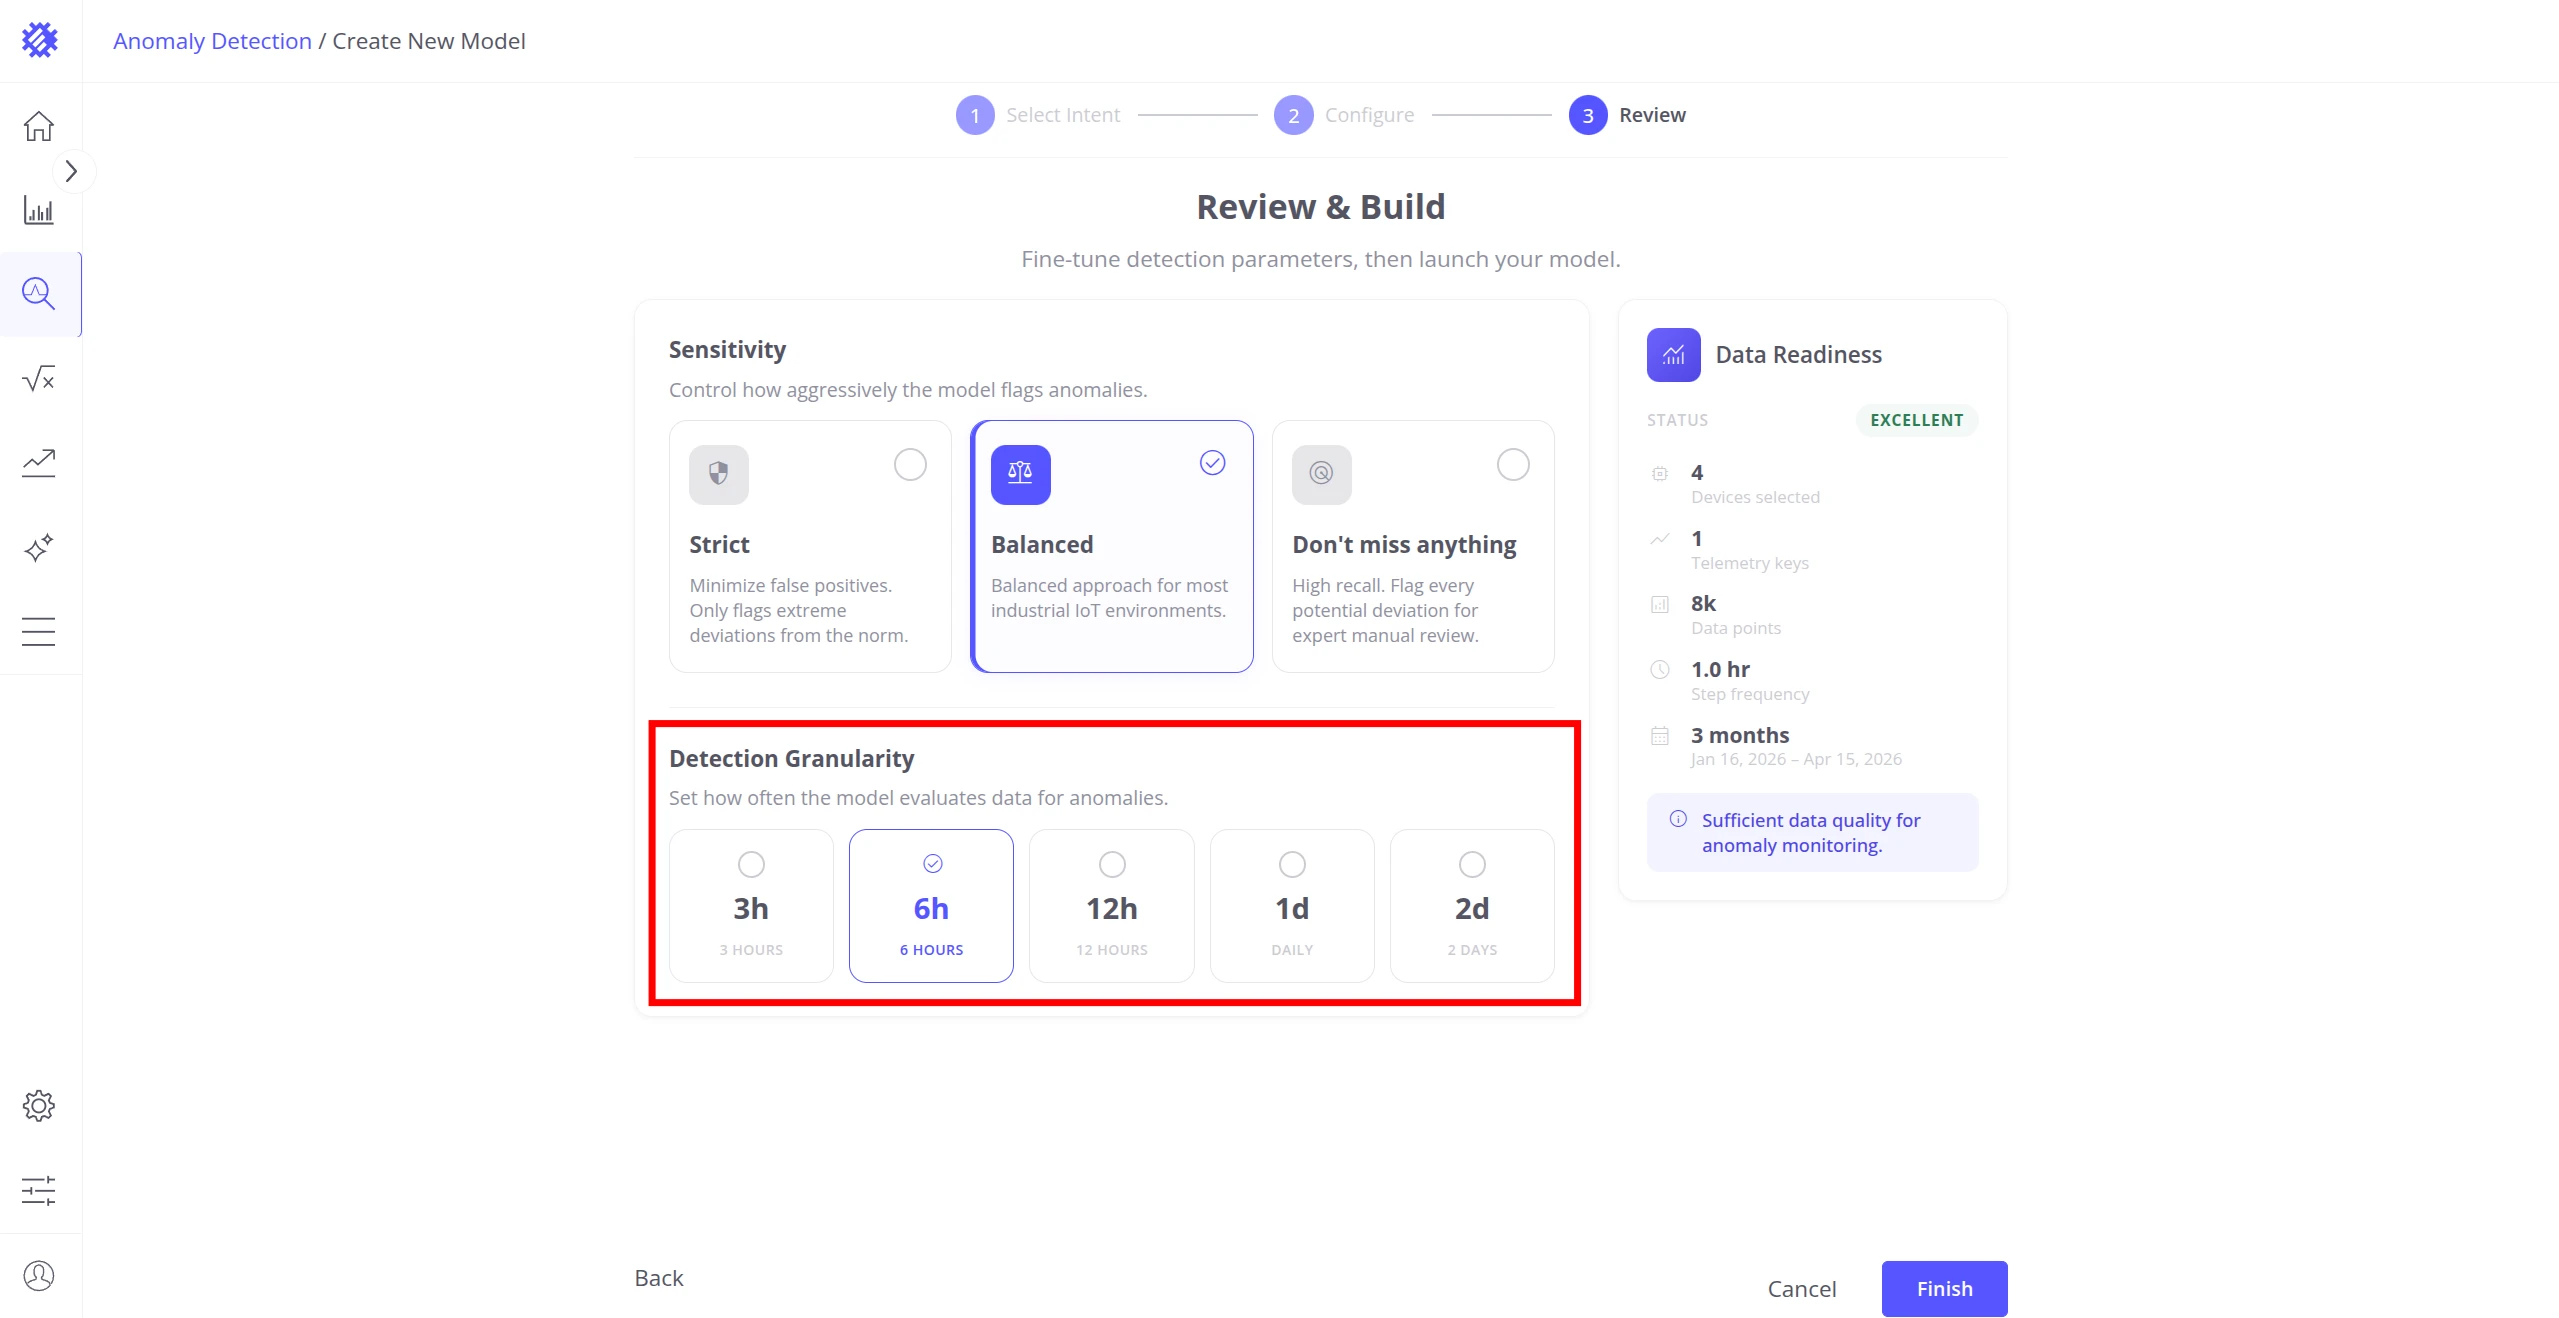
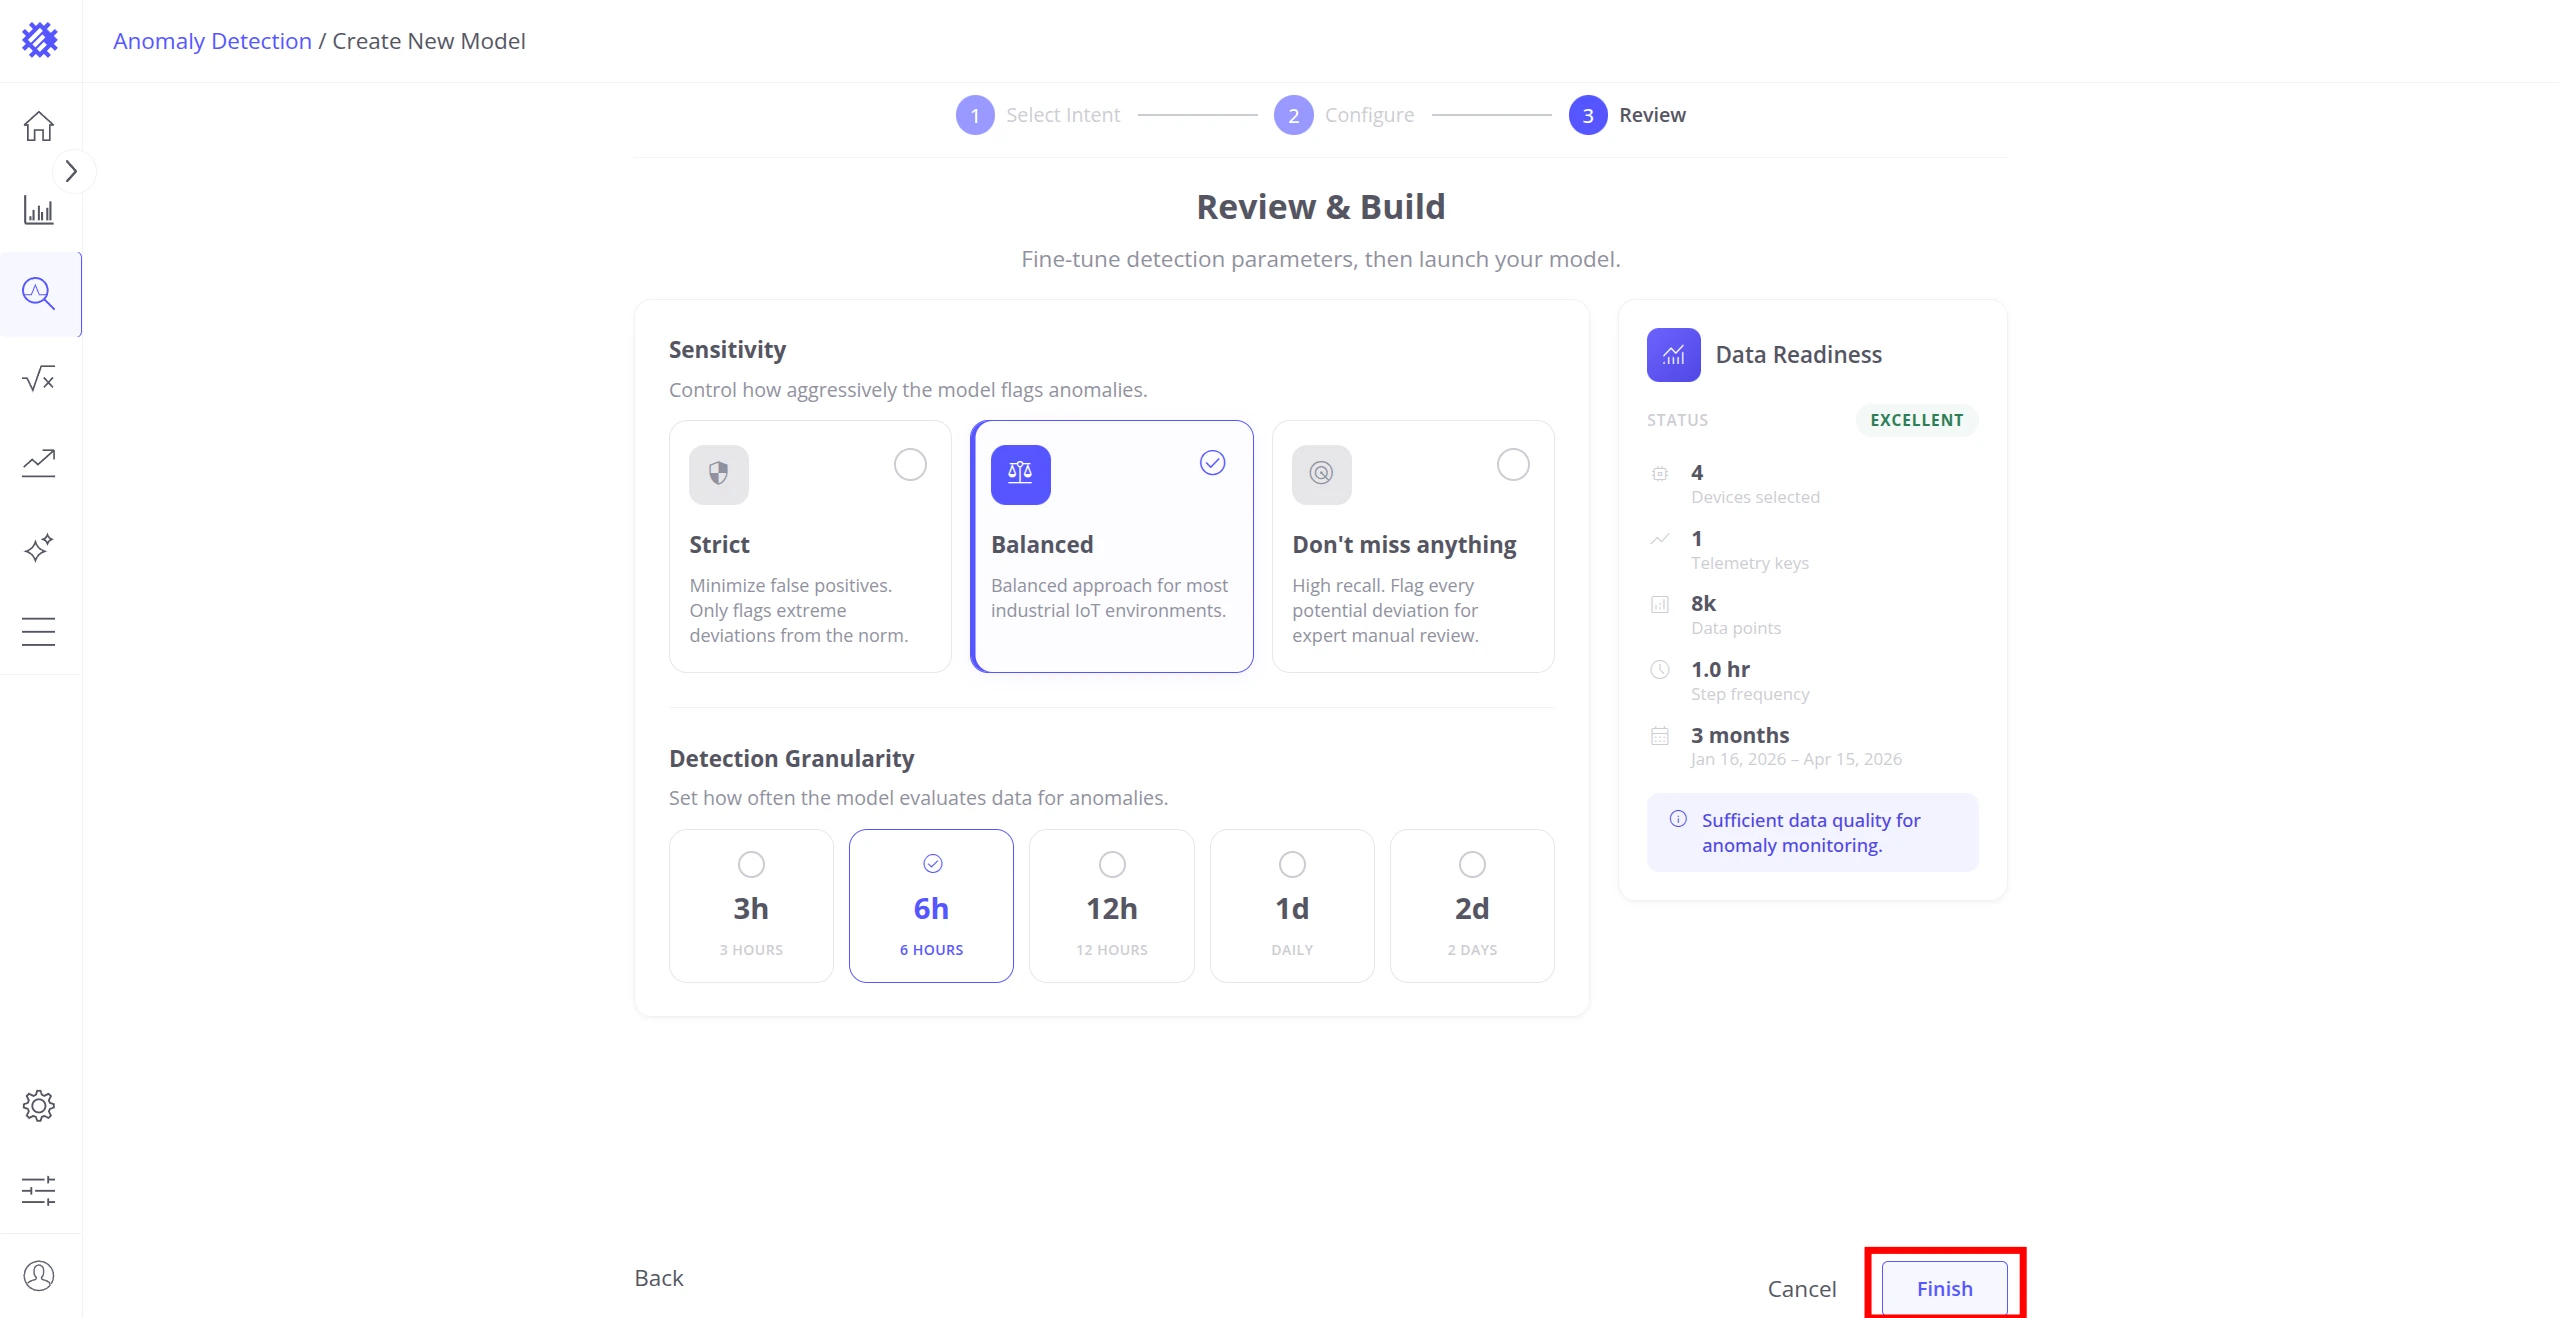
When satisfied, click Finish to submit the model for training.
The model enters the Queued → Running → Ready lifecycle. Training typically completes within seconds to a few minutes depending on data volume.
Step 5: Explore Results
Section titled “Step 5: Explore Results”Once training completes, Trendz redirects you to the Result tab of the newly built model. It shows an immediate overview of what the model found: key metrics, an activity heatmap, ranked items by anomaly impact, and a list of top anomalies.
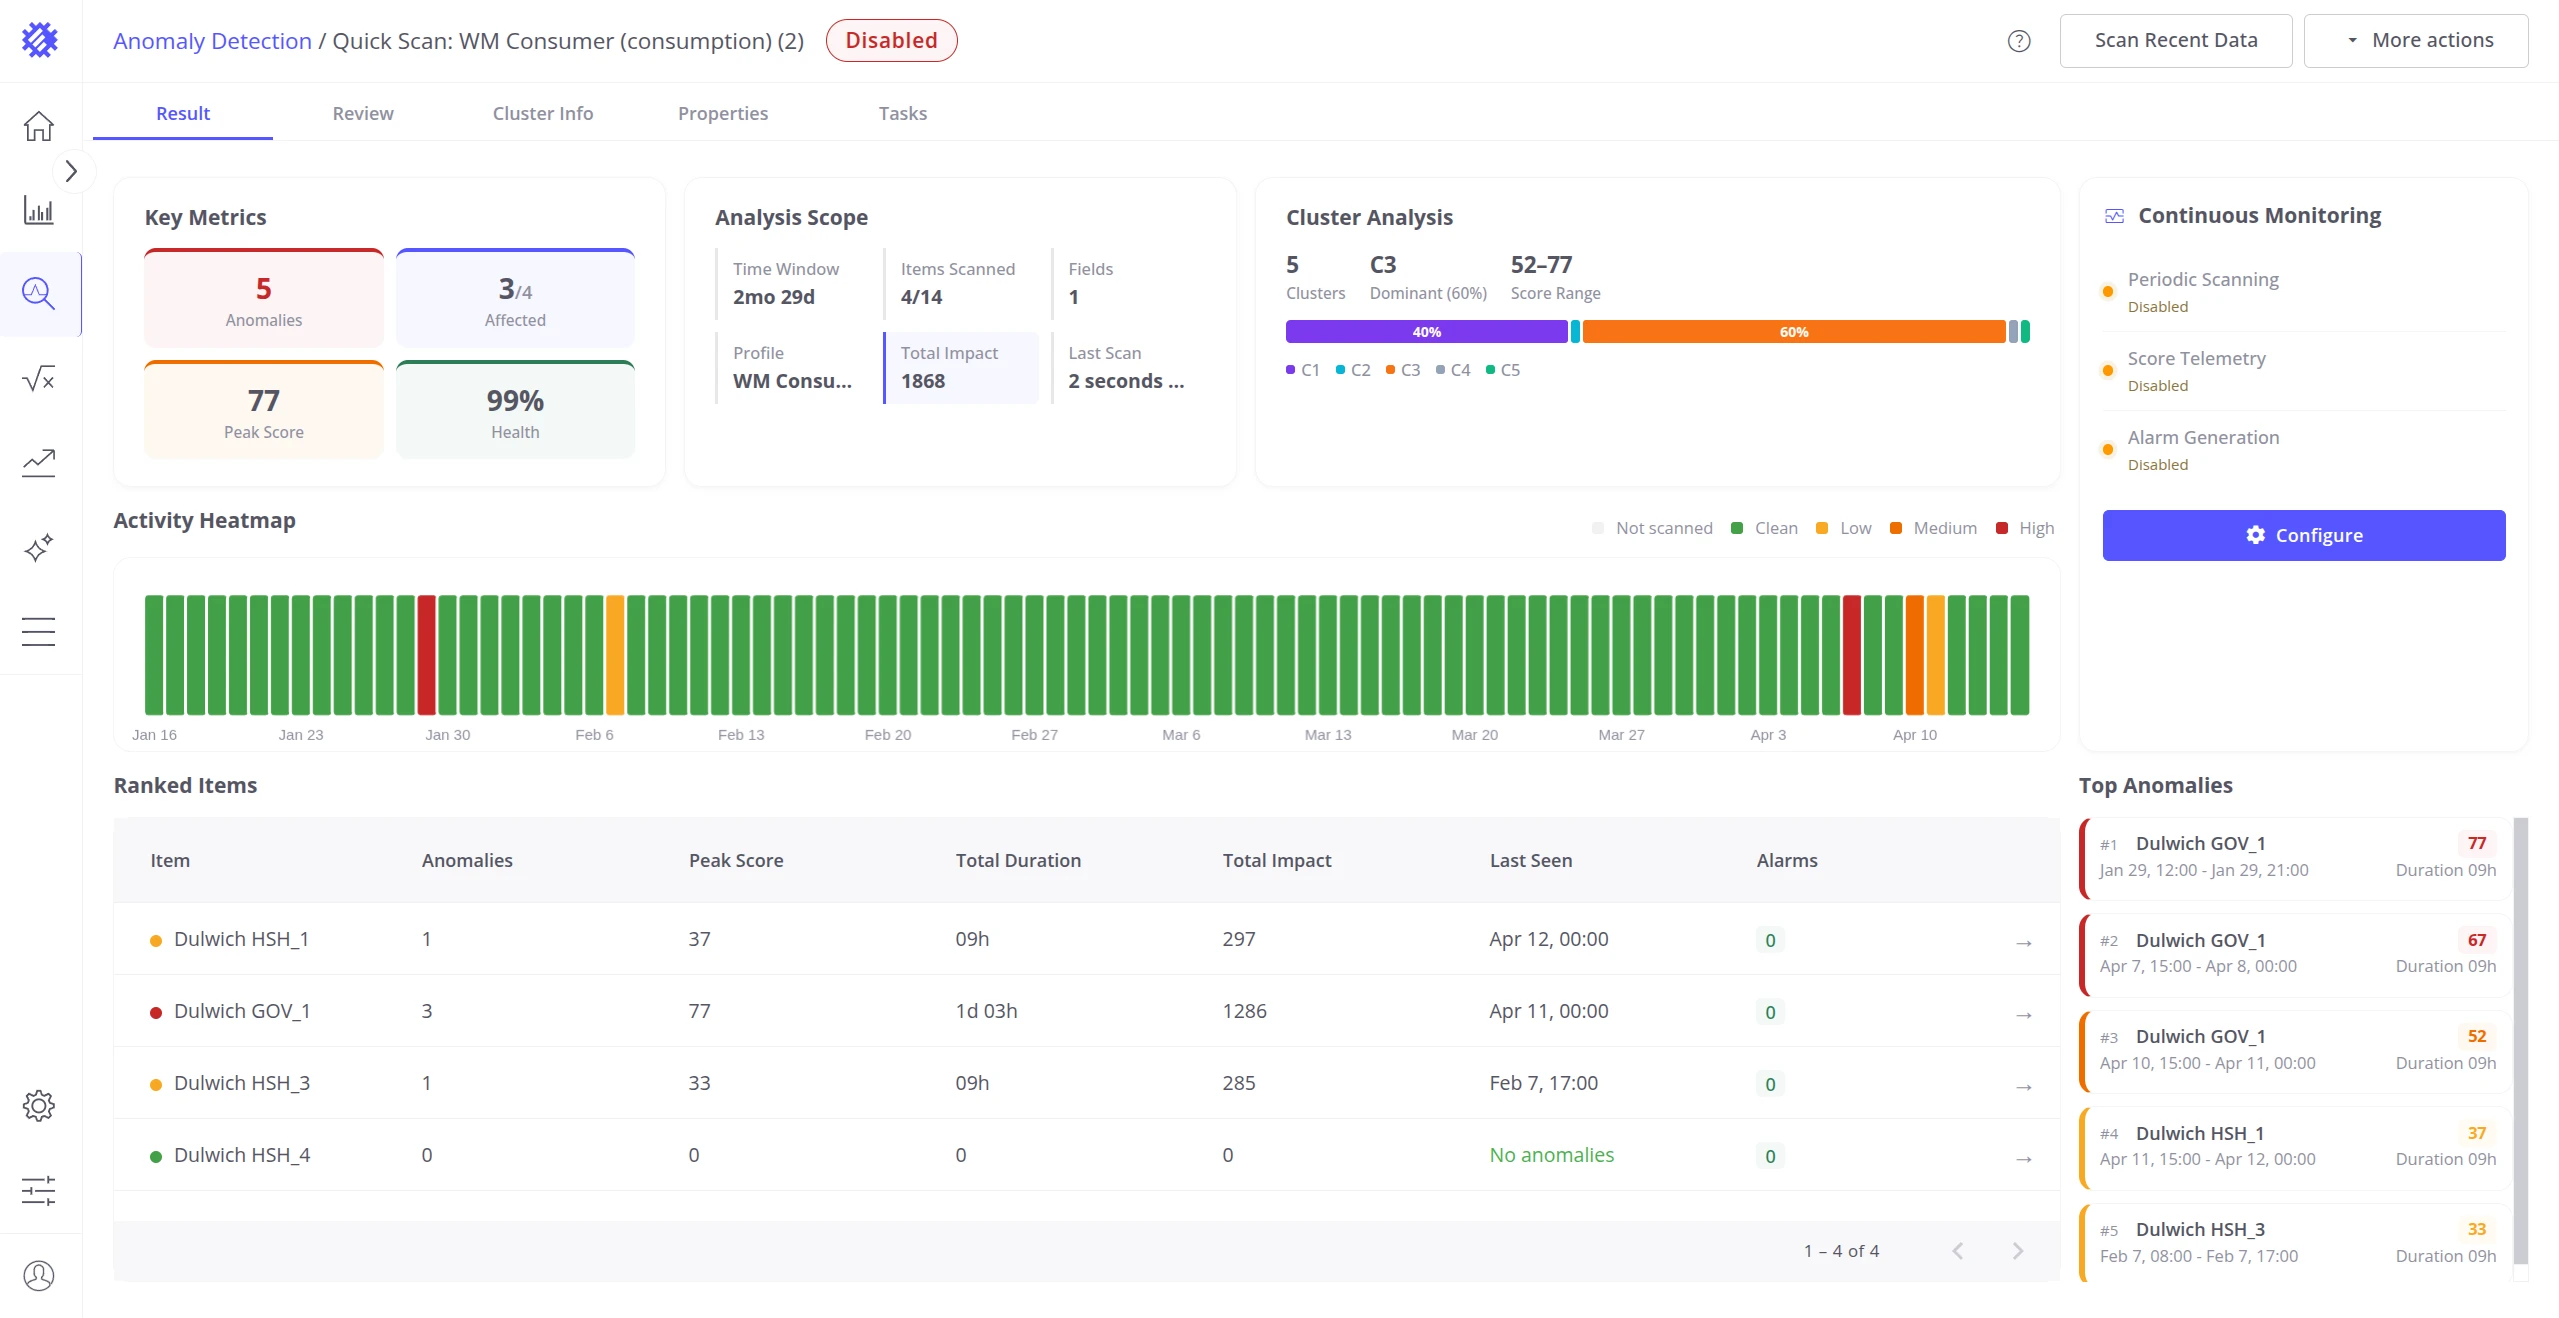
Review the results to verify the model is detecting meaningful anomalies before enabling continuous monitoring or alarms. See Anomaly Model Results for a detailed guide on analyzing results.
Advanced Mode
Section titled “Advanced Mode”The wizard covers the most common detection scenarios. For full control over every parameter — clustering algorithm, distance function, segmentation window, score thresholds, and limits — use Advanced Mode instead.
Access it via Advanced configuration on the intent selection step. Full parameter documentation is available in Anomaly Model Properties.
Best Practices
Section titled “Best Practices”| Situation | Recommendation |
|---|---|
| Too many anomalies | Switch to Strict sensitivity. The model is flagging normal variation — tighten the threshold to reduce noise. |
| Too few anomalies | Switch to Don’t miss anything or choose a shorter detection granularity. The model may be too conservative. |
| Selecting telemetry keys | Only combine keys that physically correlate — e.g. vibration and temperature on the same pump. Mixing unrelated keys degrades model accuracy. |
| Training data quality | Use a period of normal operation. Avoid ranges covering outages, commissioning, or maintenance — they skew what the model learns as “normal.” |
| Using Advanced Mode | Only switch if you understand clustering and segmentation. Misconfigured parameters can produce worse results than the defaults. |
| Training data volume | Aim for at least 3 months of regular telemetry. Sparse or short datasets result in Poor readiness and unreliable detection. |
Was this helpful?