Analyze Model Results
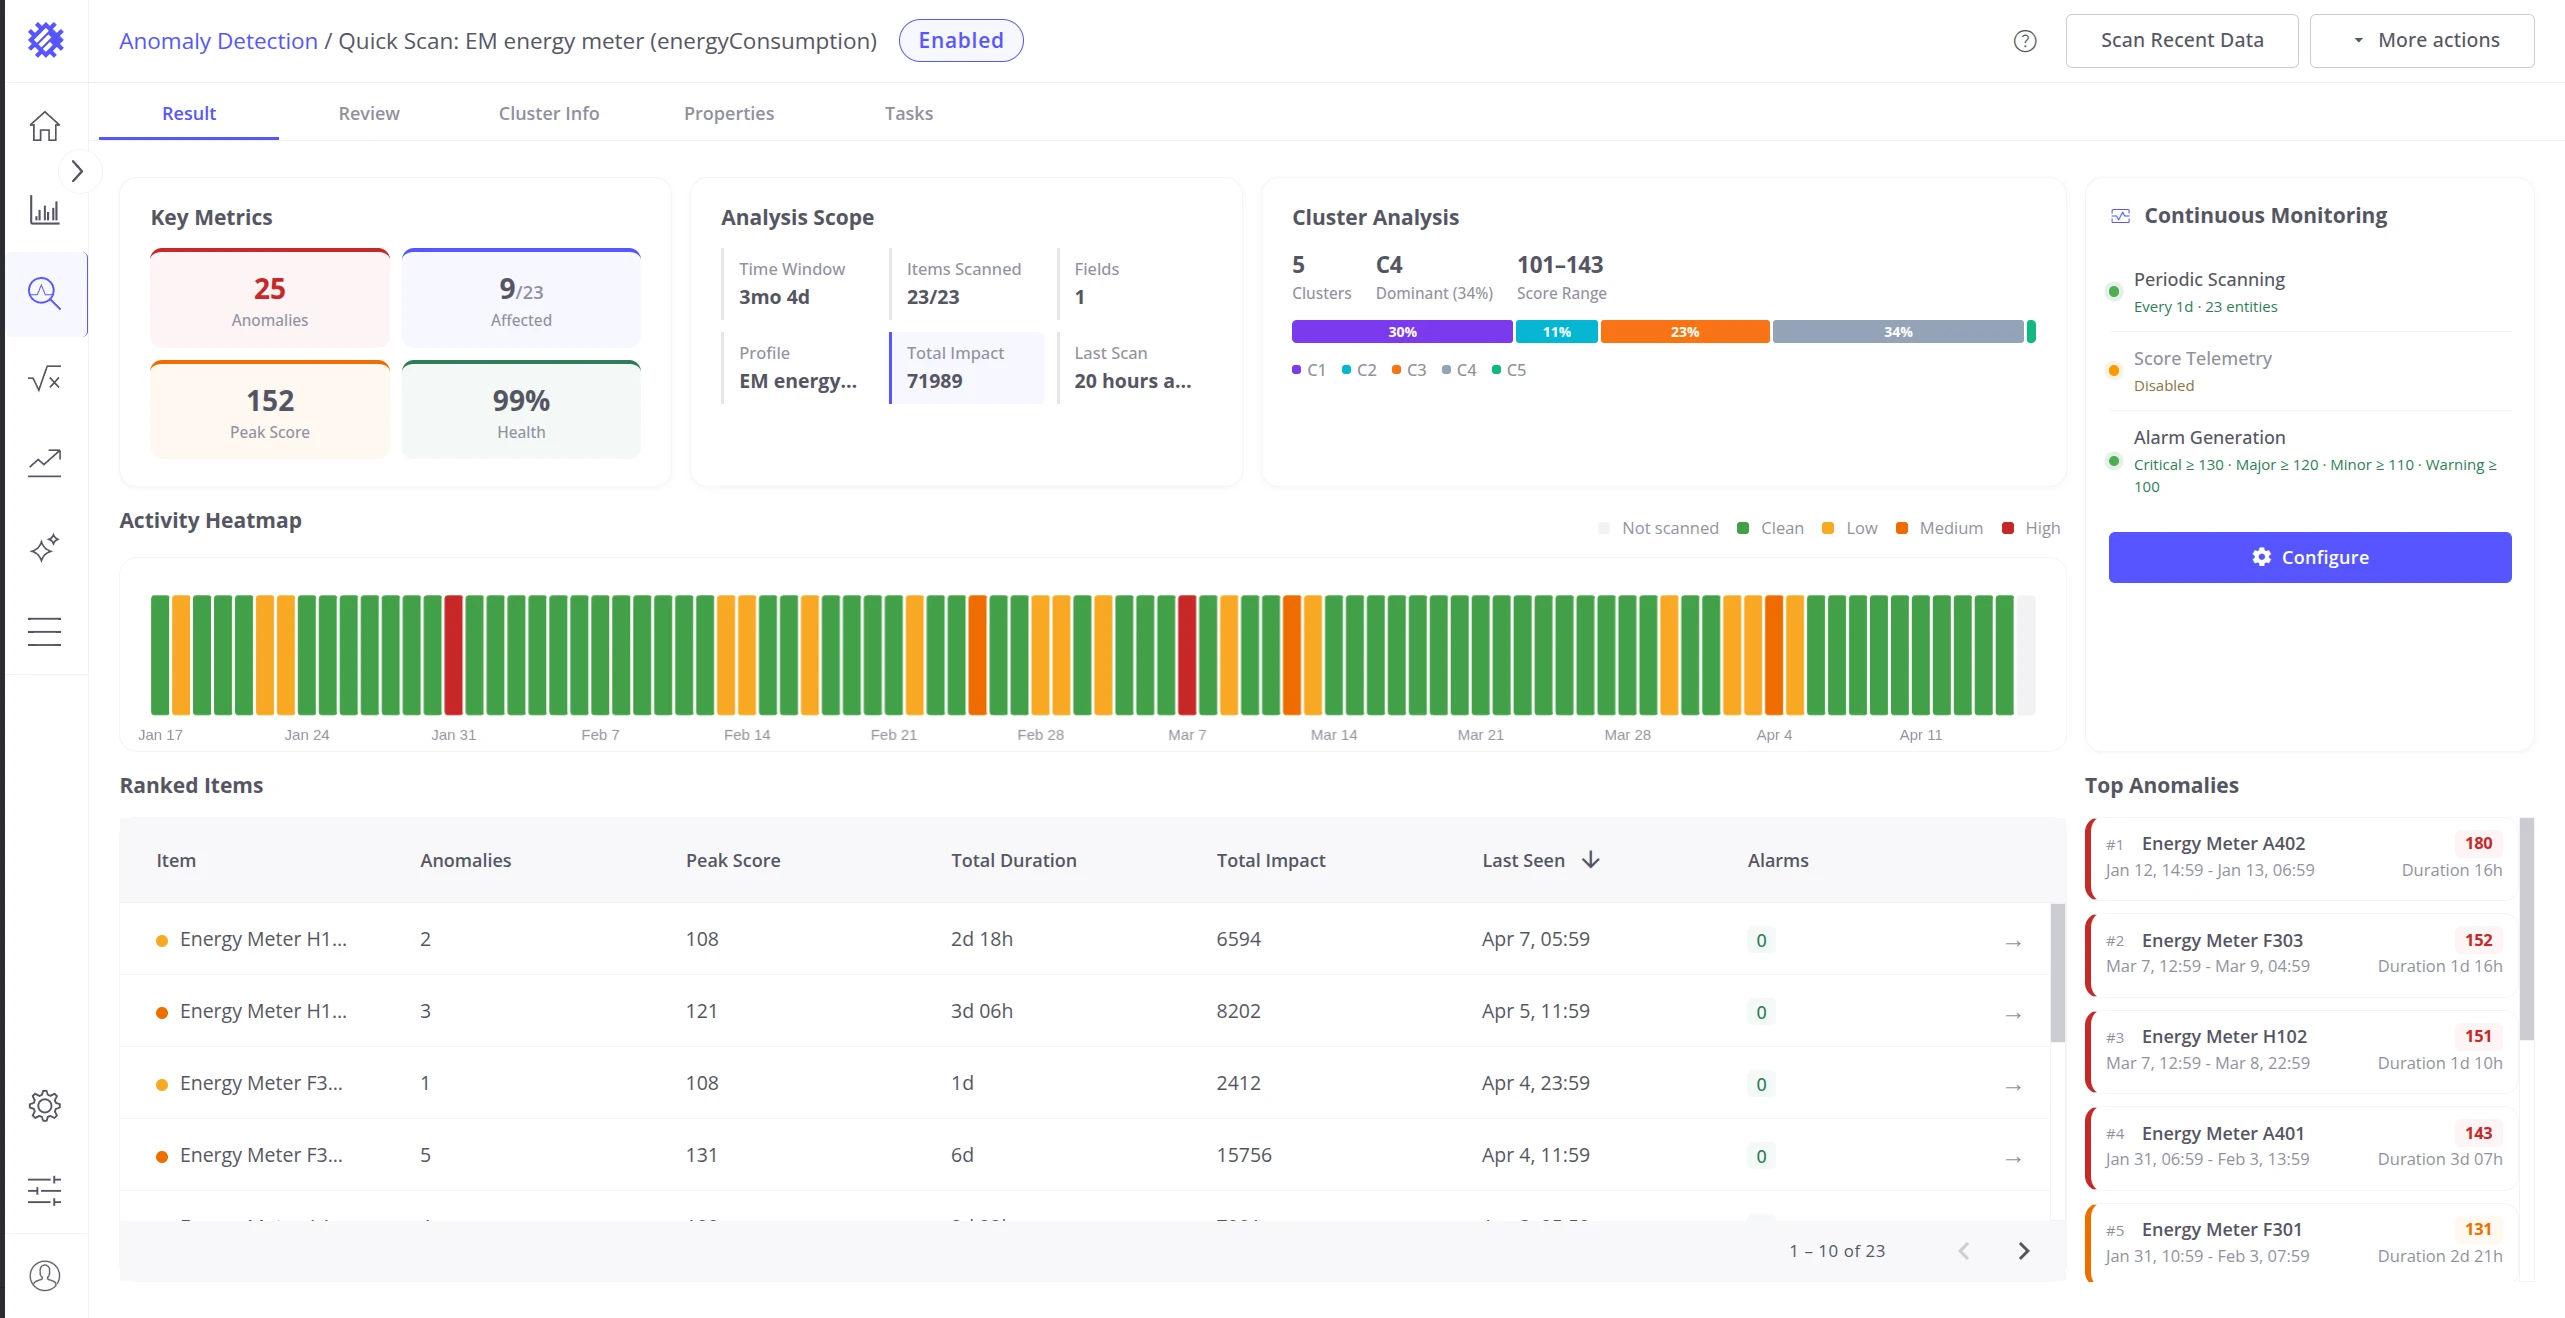
Once an anomaly model finishes building, its detail view opens automatically. The interface is organized into five tabs — Result, Review, Cluster Info, Properties, and Tasks — each serving a distinct role in understanding and managing detection quality.
Result Tab
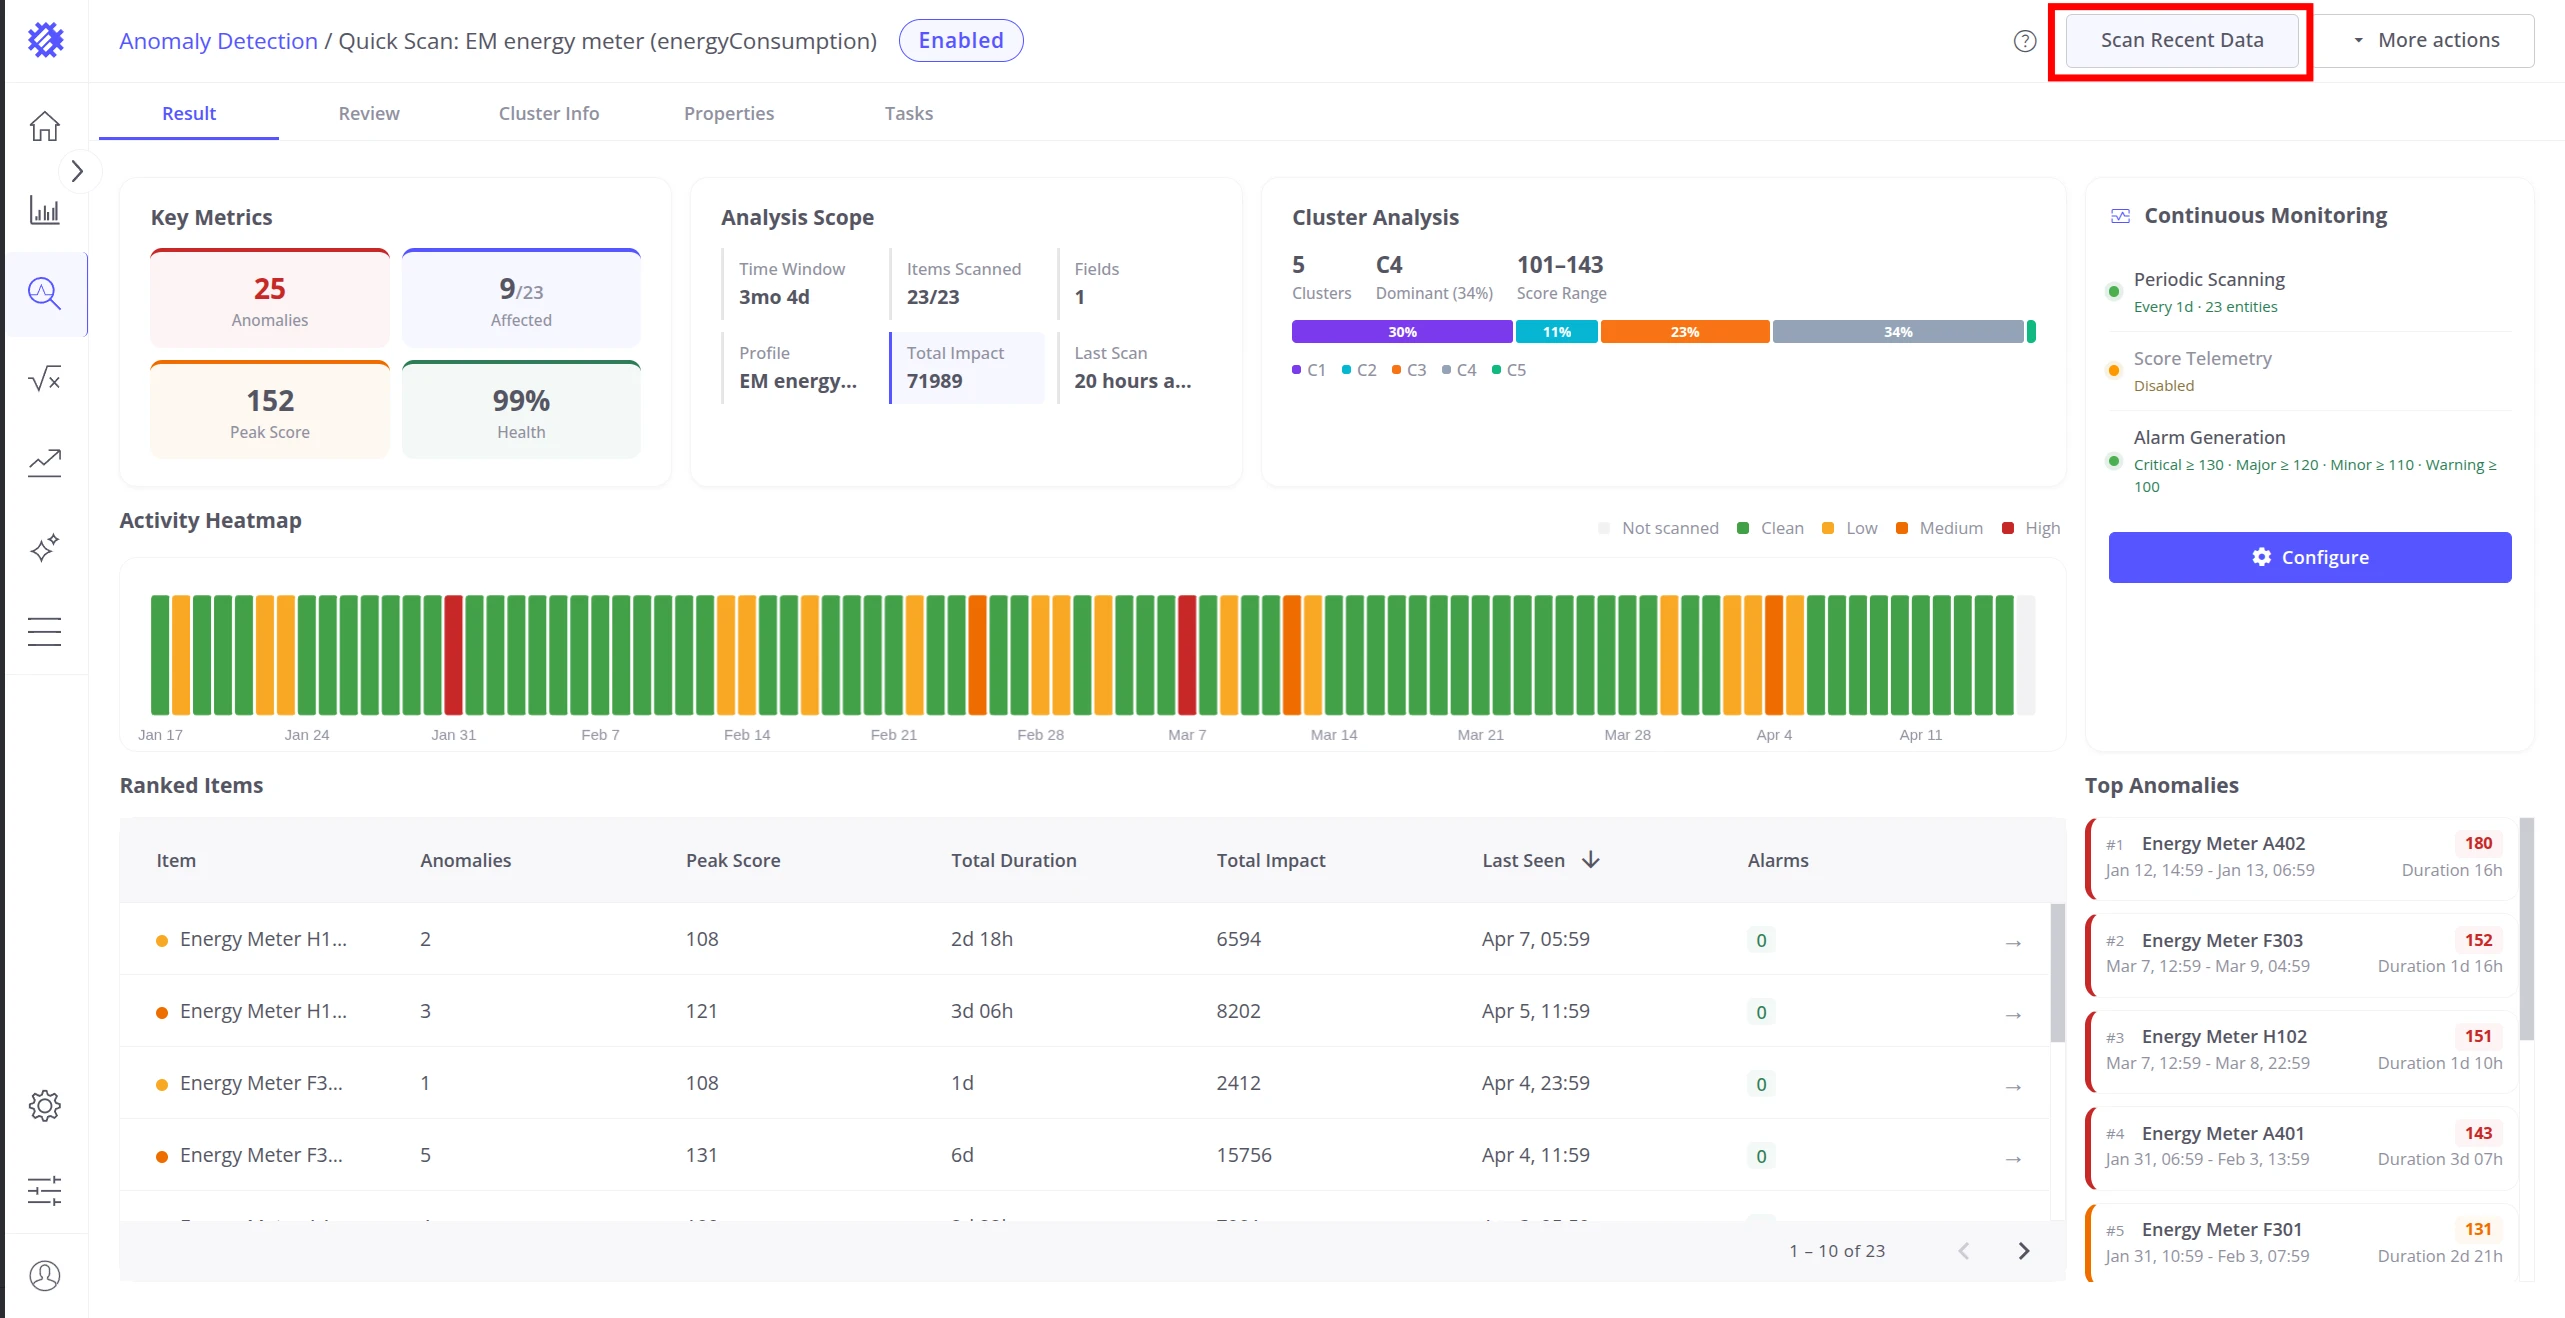
Section titled “Result Tab”The Result tab is the primary view for analyzing what the model detected. It shows fleet-level metrics, device-by-device rankings, and the most significant anomalies found.
Key Metrics
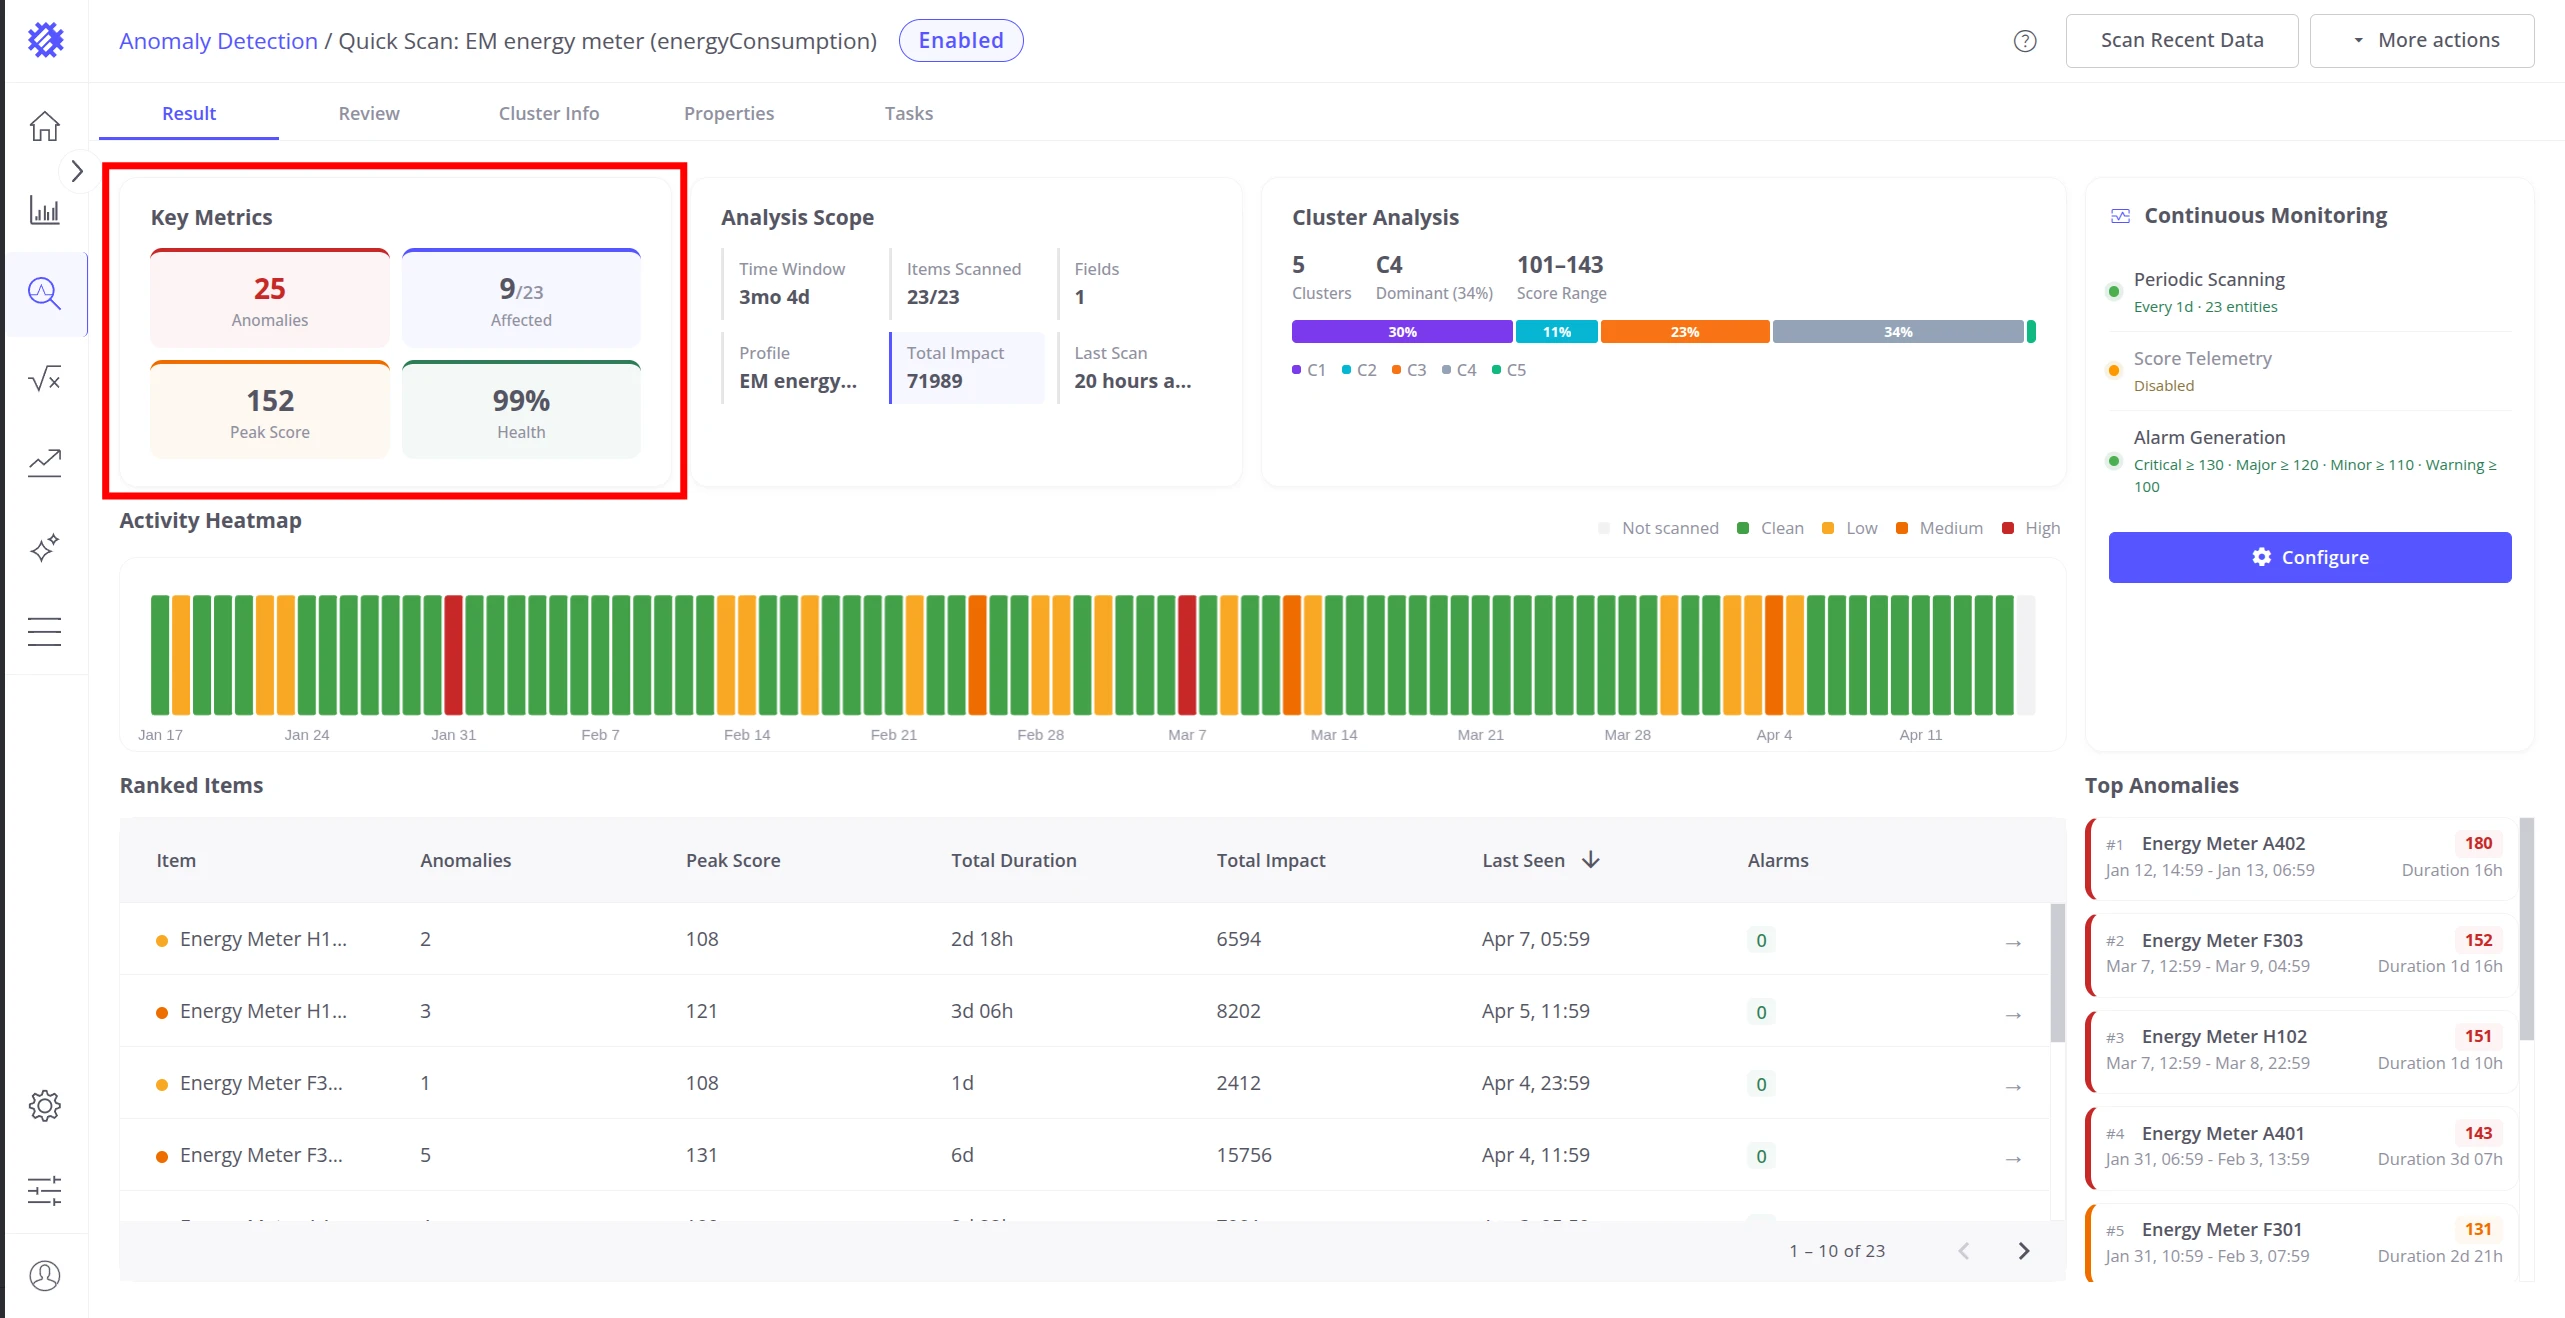
Section titled “Key Metrics”Four cards at the top of the Result tab summarize detection quality at a glance:
| Card | Color | Meaning |
|---|---|---|
| Anomalies | Red | Total count of anomaly events detected by this model |
| Affected | Blue | Ratio of items with at least one anomaly to total scanned items (e.g. 12 / 535) |
| Peak Score | Orange | The highest anomaly score recorded by this model across all items and time |
| Health | Green | Percentage of time during which telemetry showed no anomalous behavior |
Analysis Scope
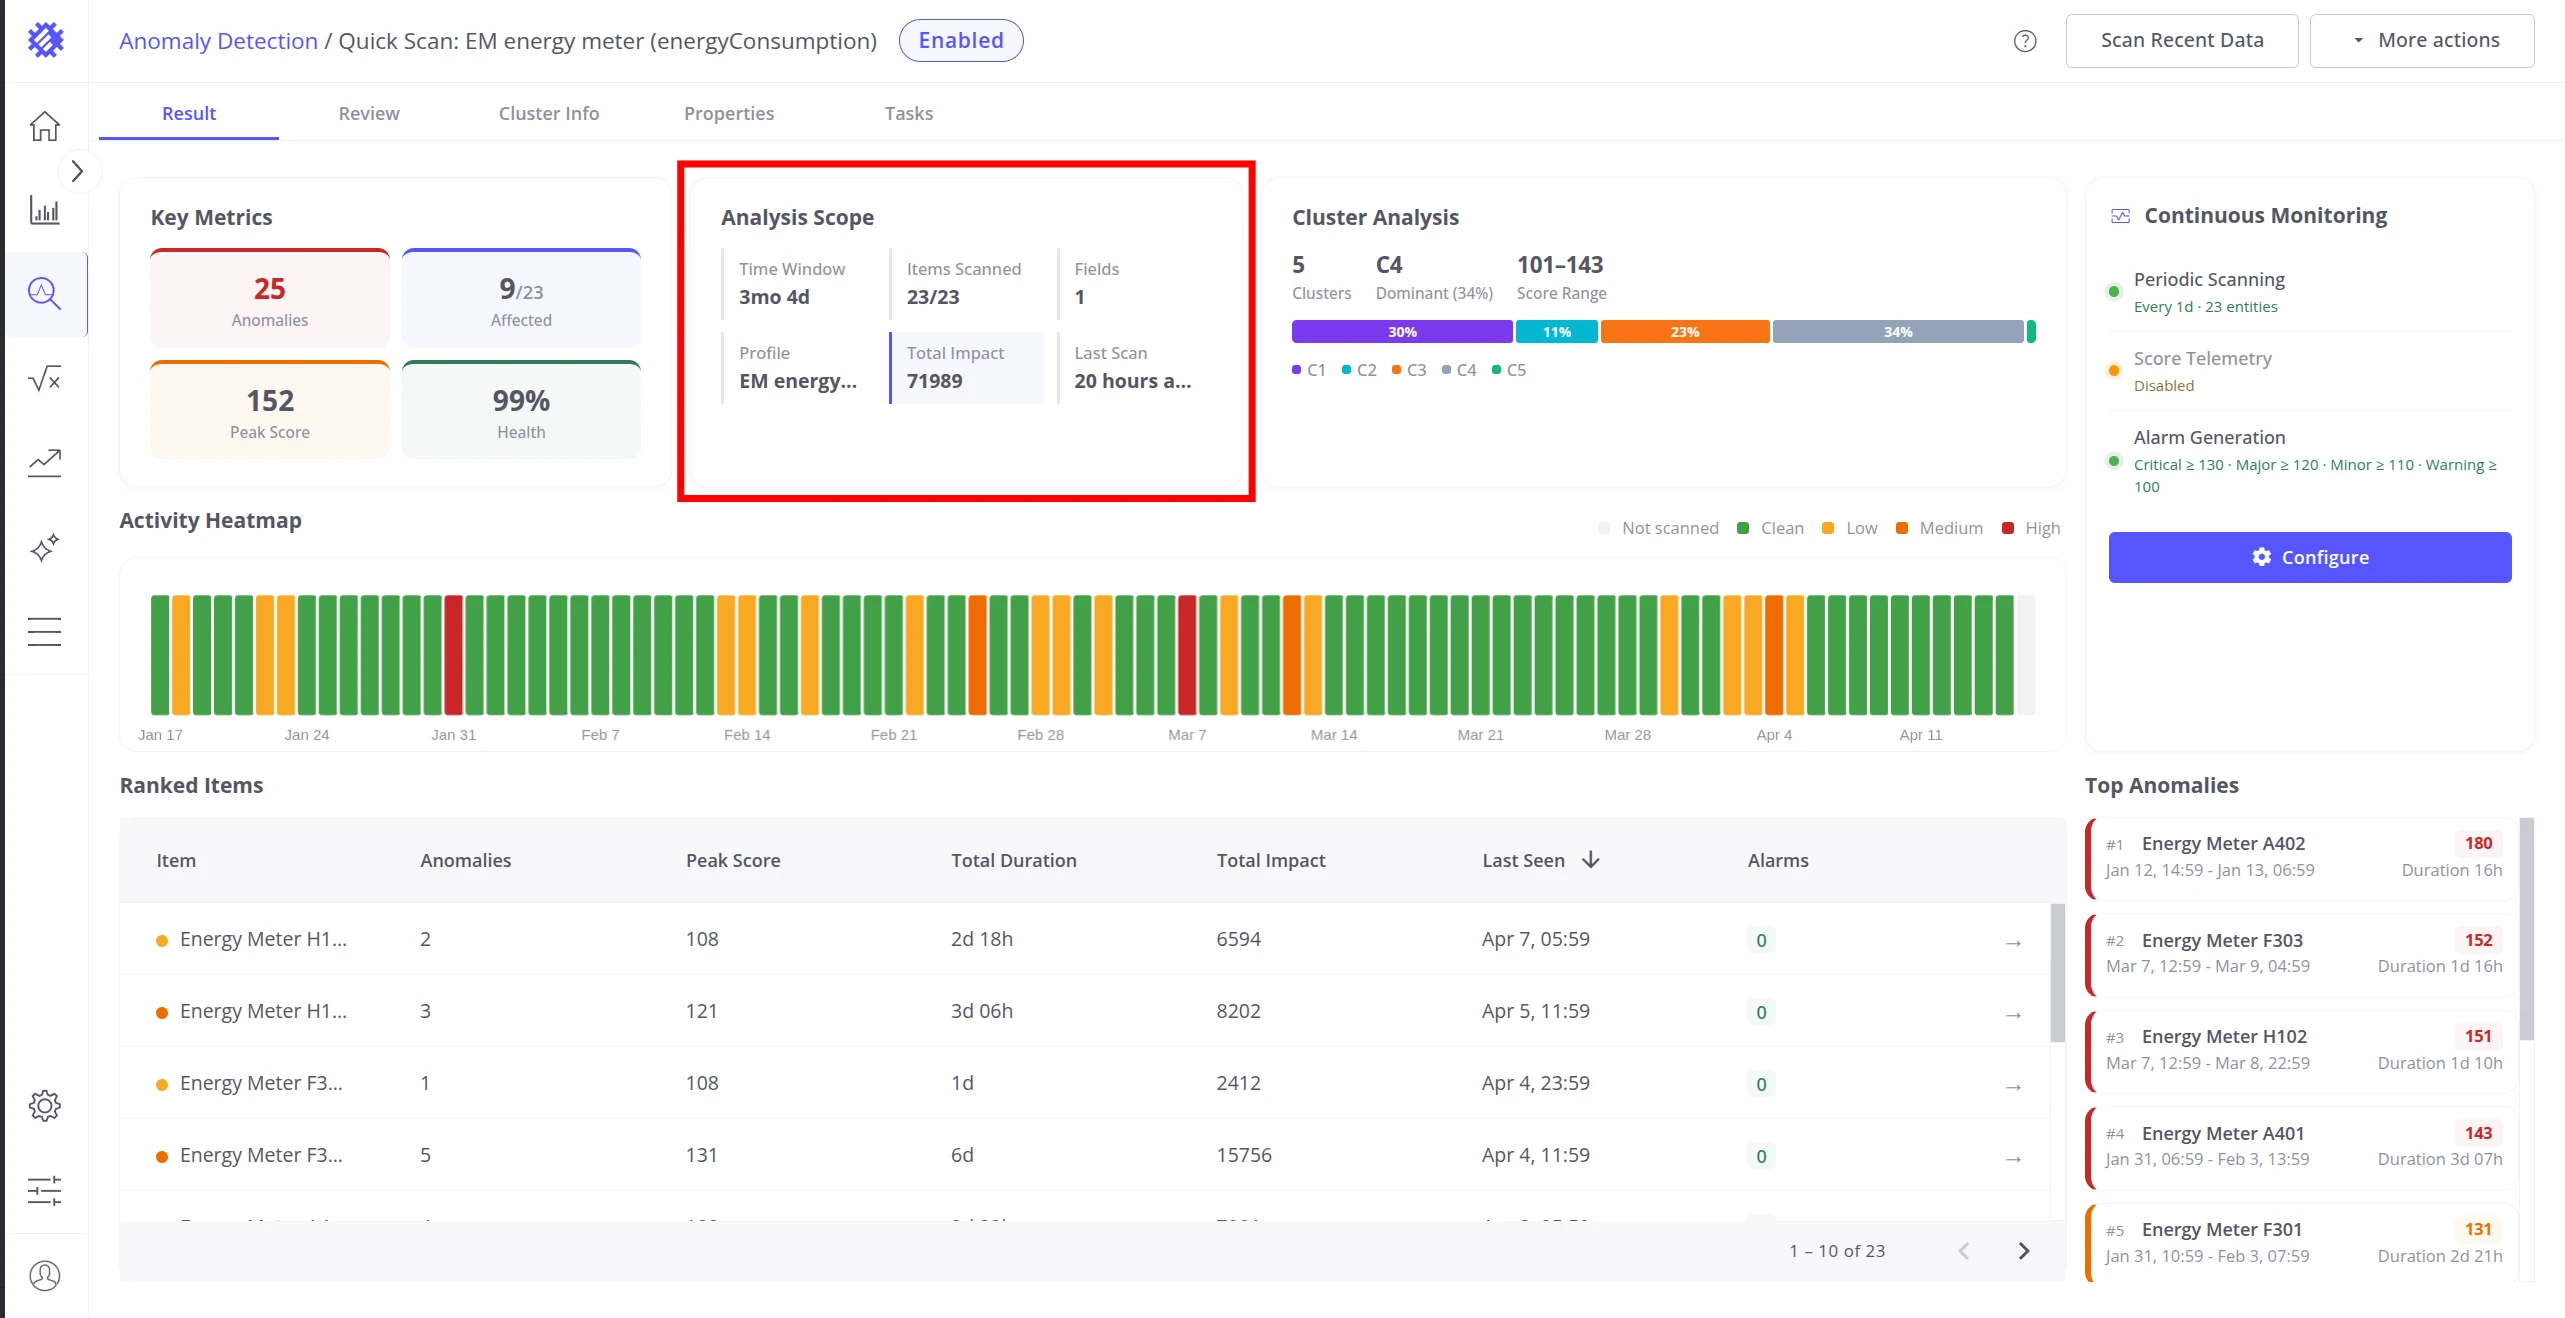
Section titled “Analysis Scope”The Analysis Scope section provides context about what data the model processed:
| Field | Description |
|---|---|
| Time Window | Total duration of the analyzed time range (e.g. 2 months 29 days) |
| Items Scanned | Number of scanned items out of total items in the profile (e.g. 5/10) |
| Fields | Number of telemetry keys used by this model for detection |
| Profile | The device or asset profile whose items were analyzed |
| Total Impact | Sum of all anomaly score indexes across all detected anomalies — reflects the total cumulative deviation load |
| Last Scan | Time elapsed since the most recent scan run (e.g. “5 minutes ago”) |
Cluster Analysis
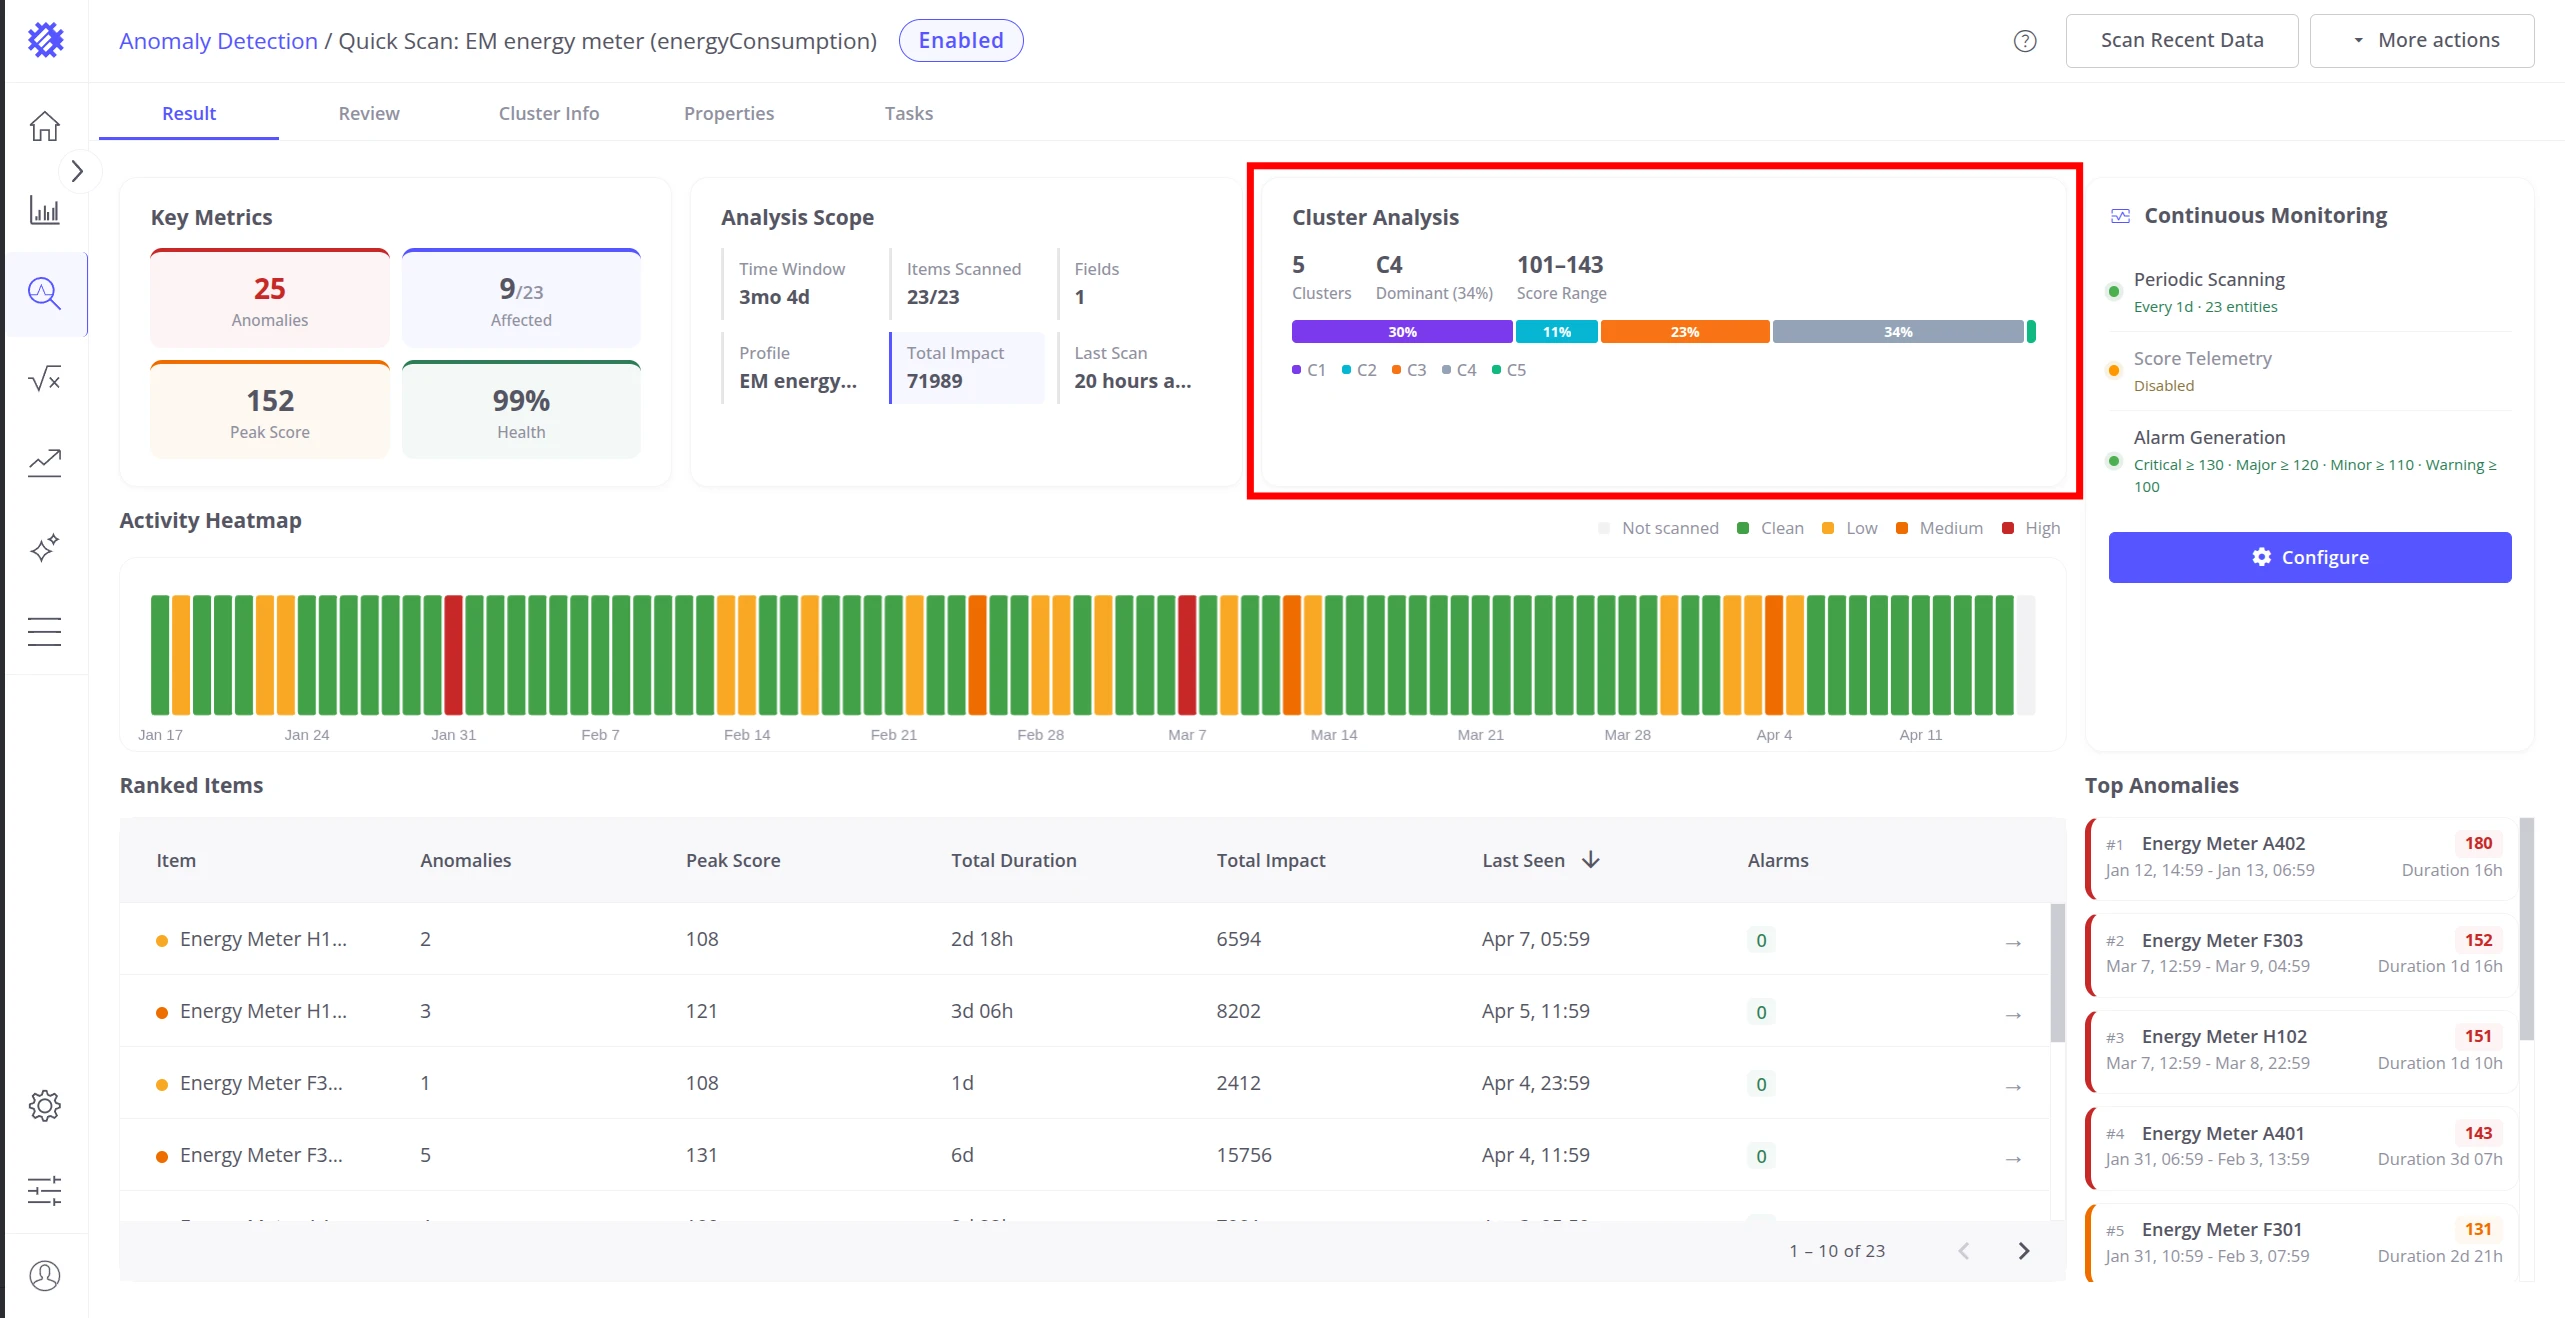
Section titled “Cluster Analysis”The Cluster Analysis section summarizes how the model partitioned normal behavior into clusters during training:
| Element | Description |
|---|---|
| Cluster count | Total number of clusters the model identified |
| CS (dominant cluster) | The cluster containing the highest percentage of training segments — represents the most common normal behavior pattern |
| Score range | Min–max anomaly score range observed across all clusters (e.g. 76–335) |
| Color bar | Each color segment represents one cluster, sized proportionally to the percentage of training data it covers |
Clusters with less than 10% of segments are unlabeled in the bar but still represented by a color. Hover over a segment to see the cluster ID and percentage.
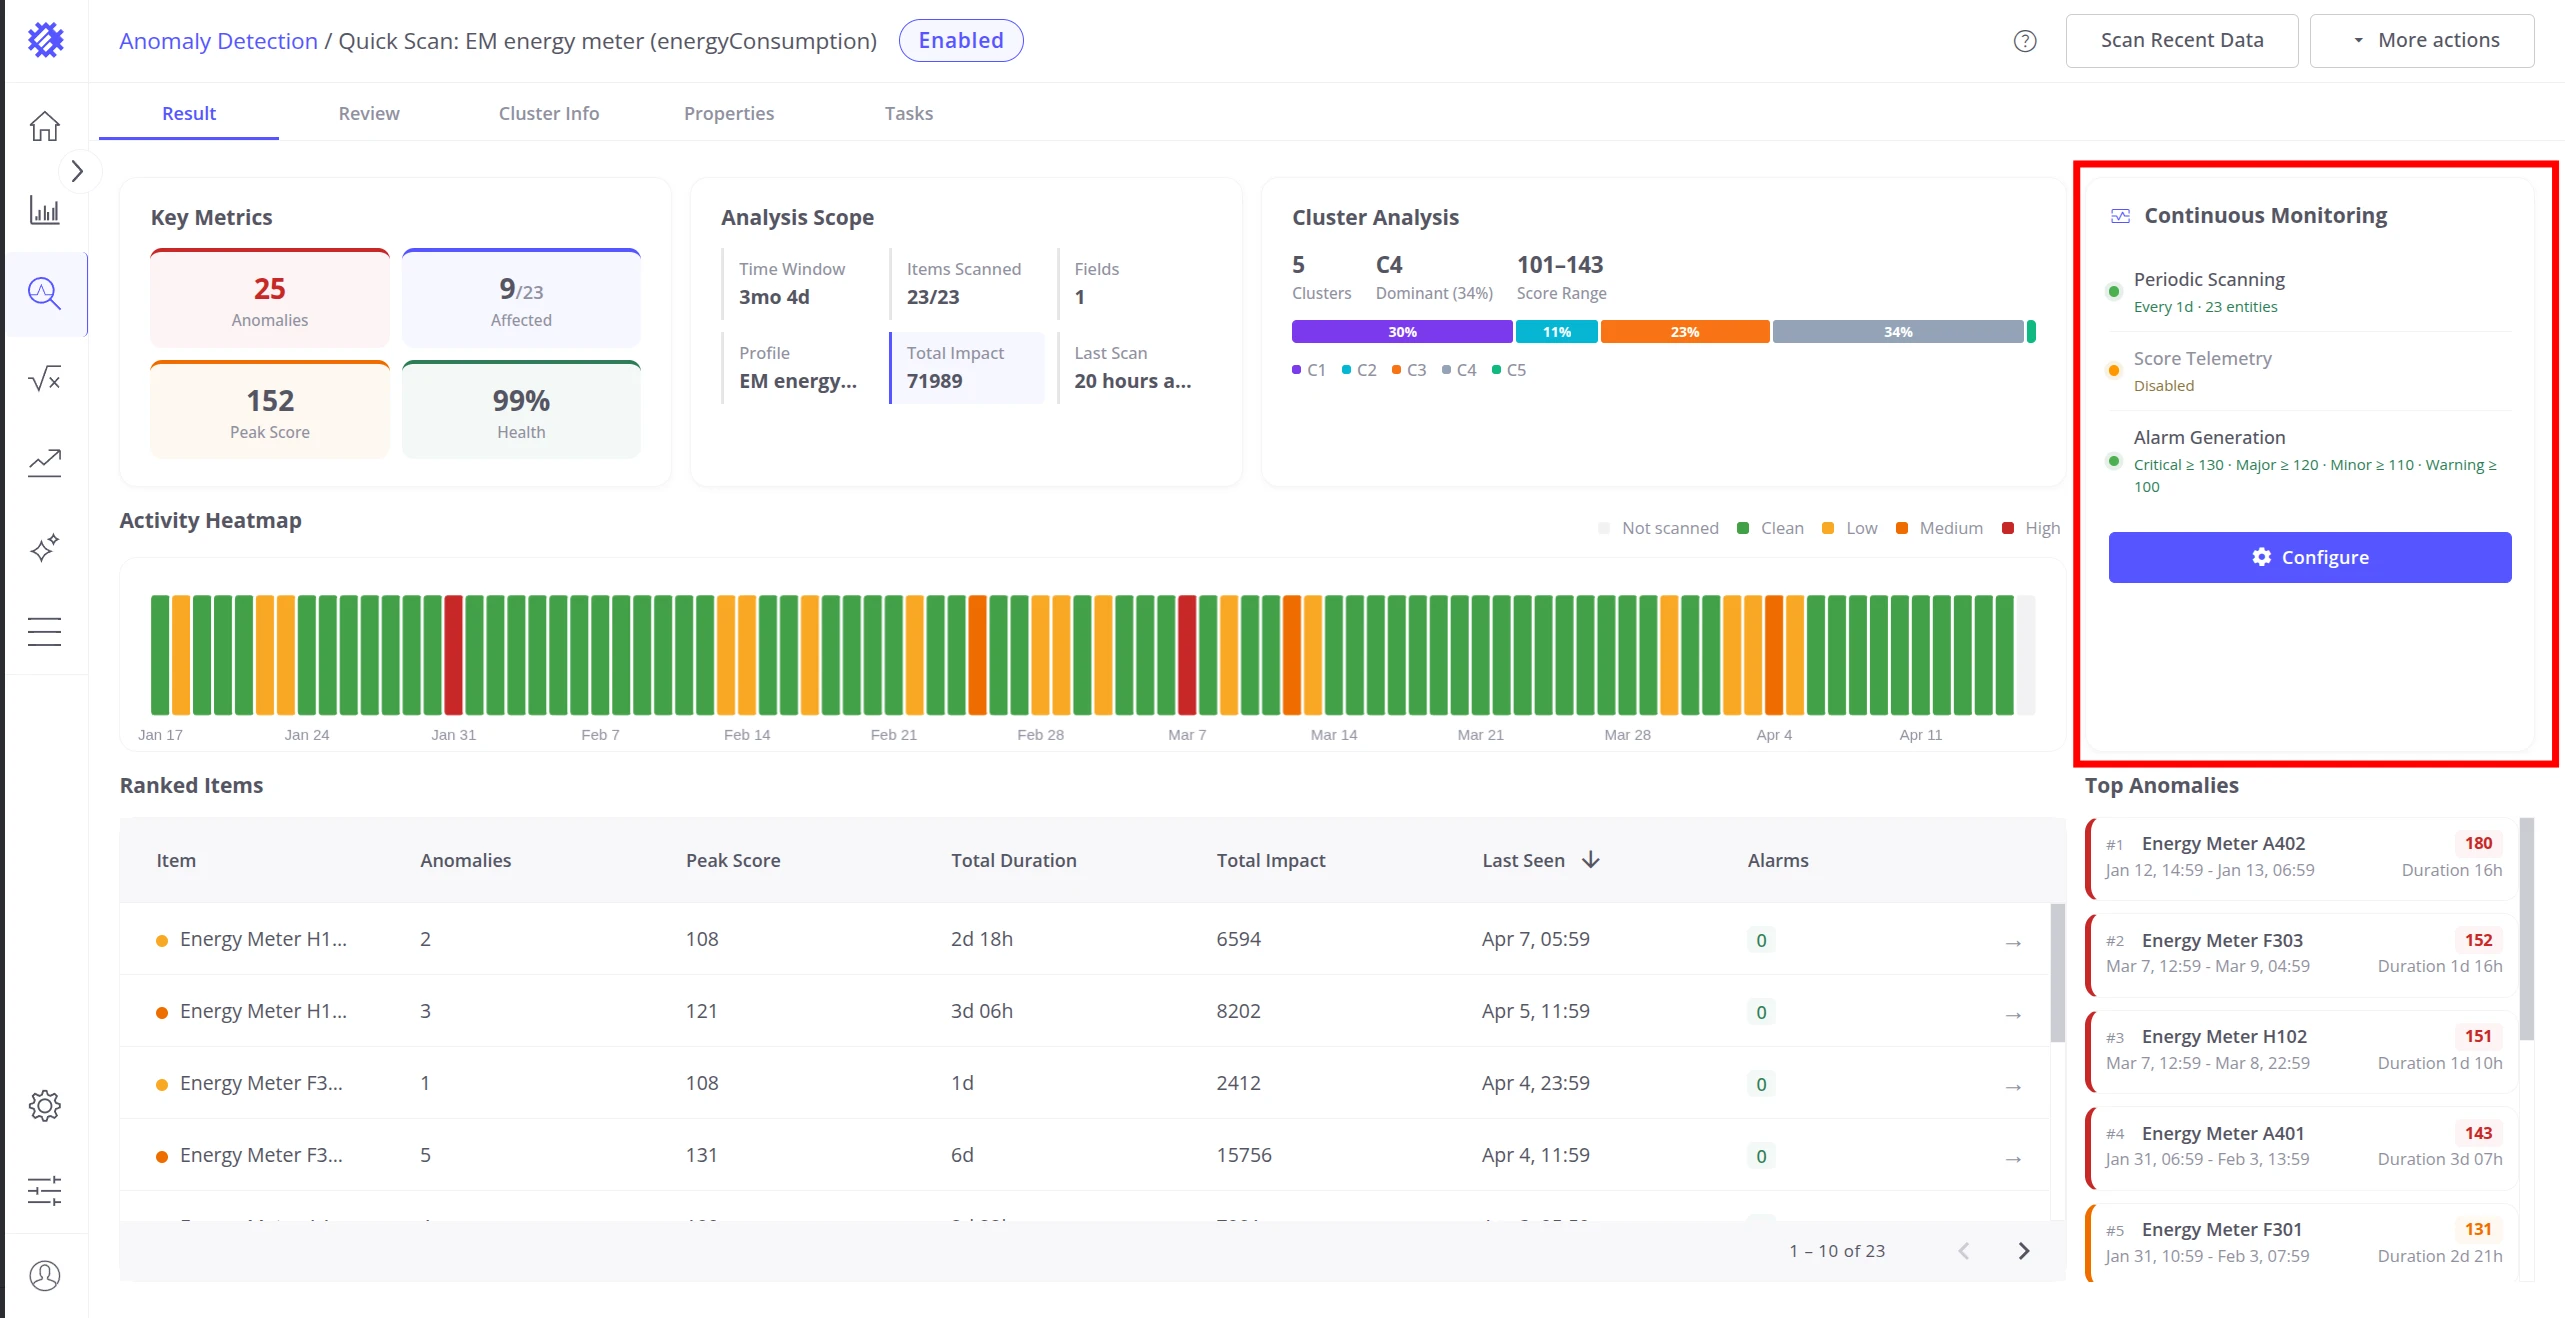
Continuous Monitoring
Section titled “Continuous Monitoring”The Continuous Monitoring card on the right side of the Result tab shows whether automated detection is running for this model. Three status indicators are displayed:
| Indicator | Active state | Inactive state |
|---|---|---|
| Periodic Scanning | Scan frequency and entity count (e.g. “Every 1h · 5 entities”) | “Disabled” |
| Score Telemetry | ”Enabled" | "Disabled” |
| Alarm Generation | Severity thresholds (e.g. “Critical ≥ 80 · Major ≥ 60”) | “Disabled” |
Click Configure to open the monitoring setup dialog. See Monitoring & Alarms for full configuration details.
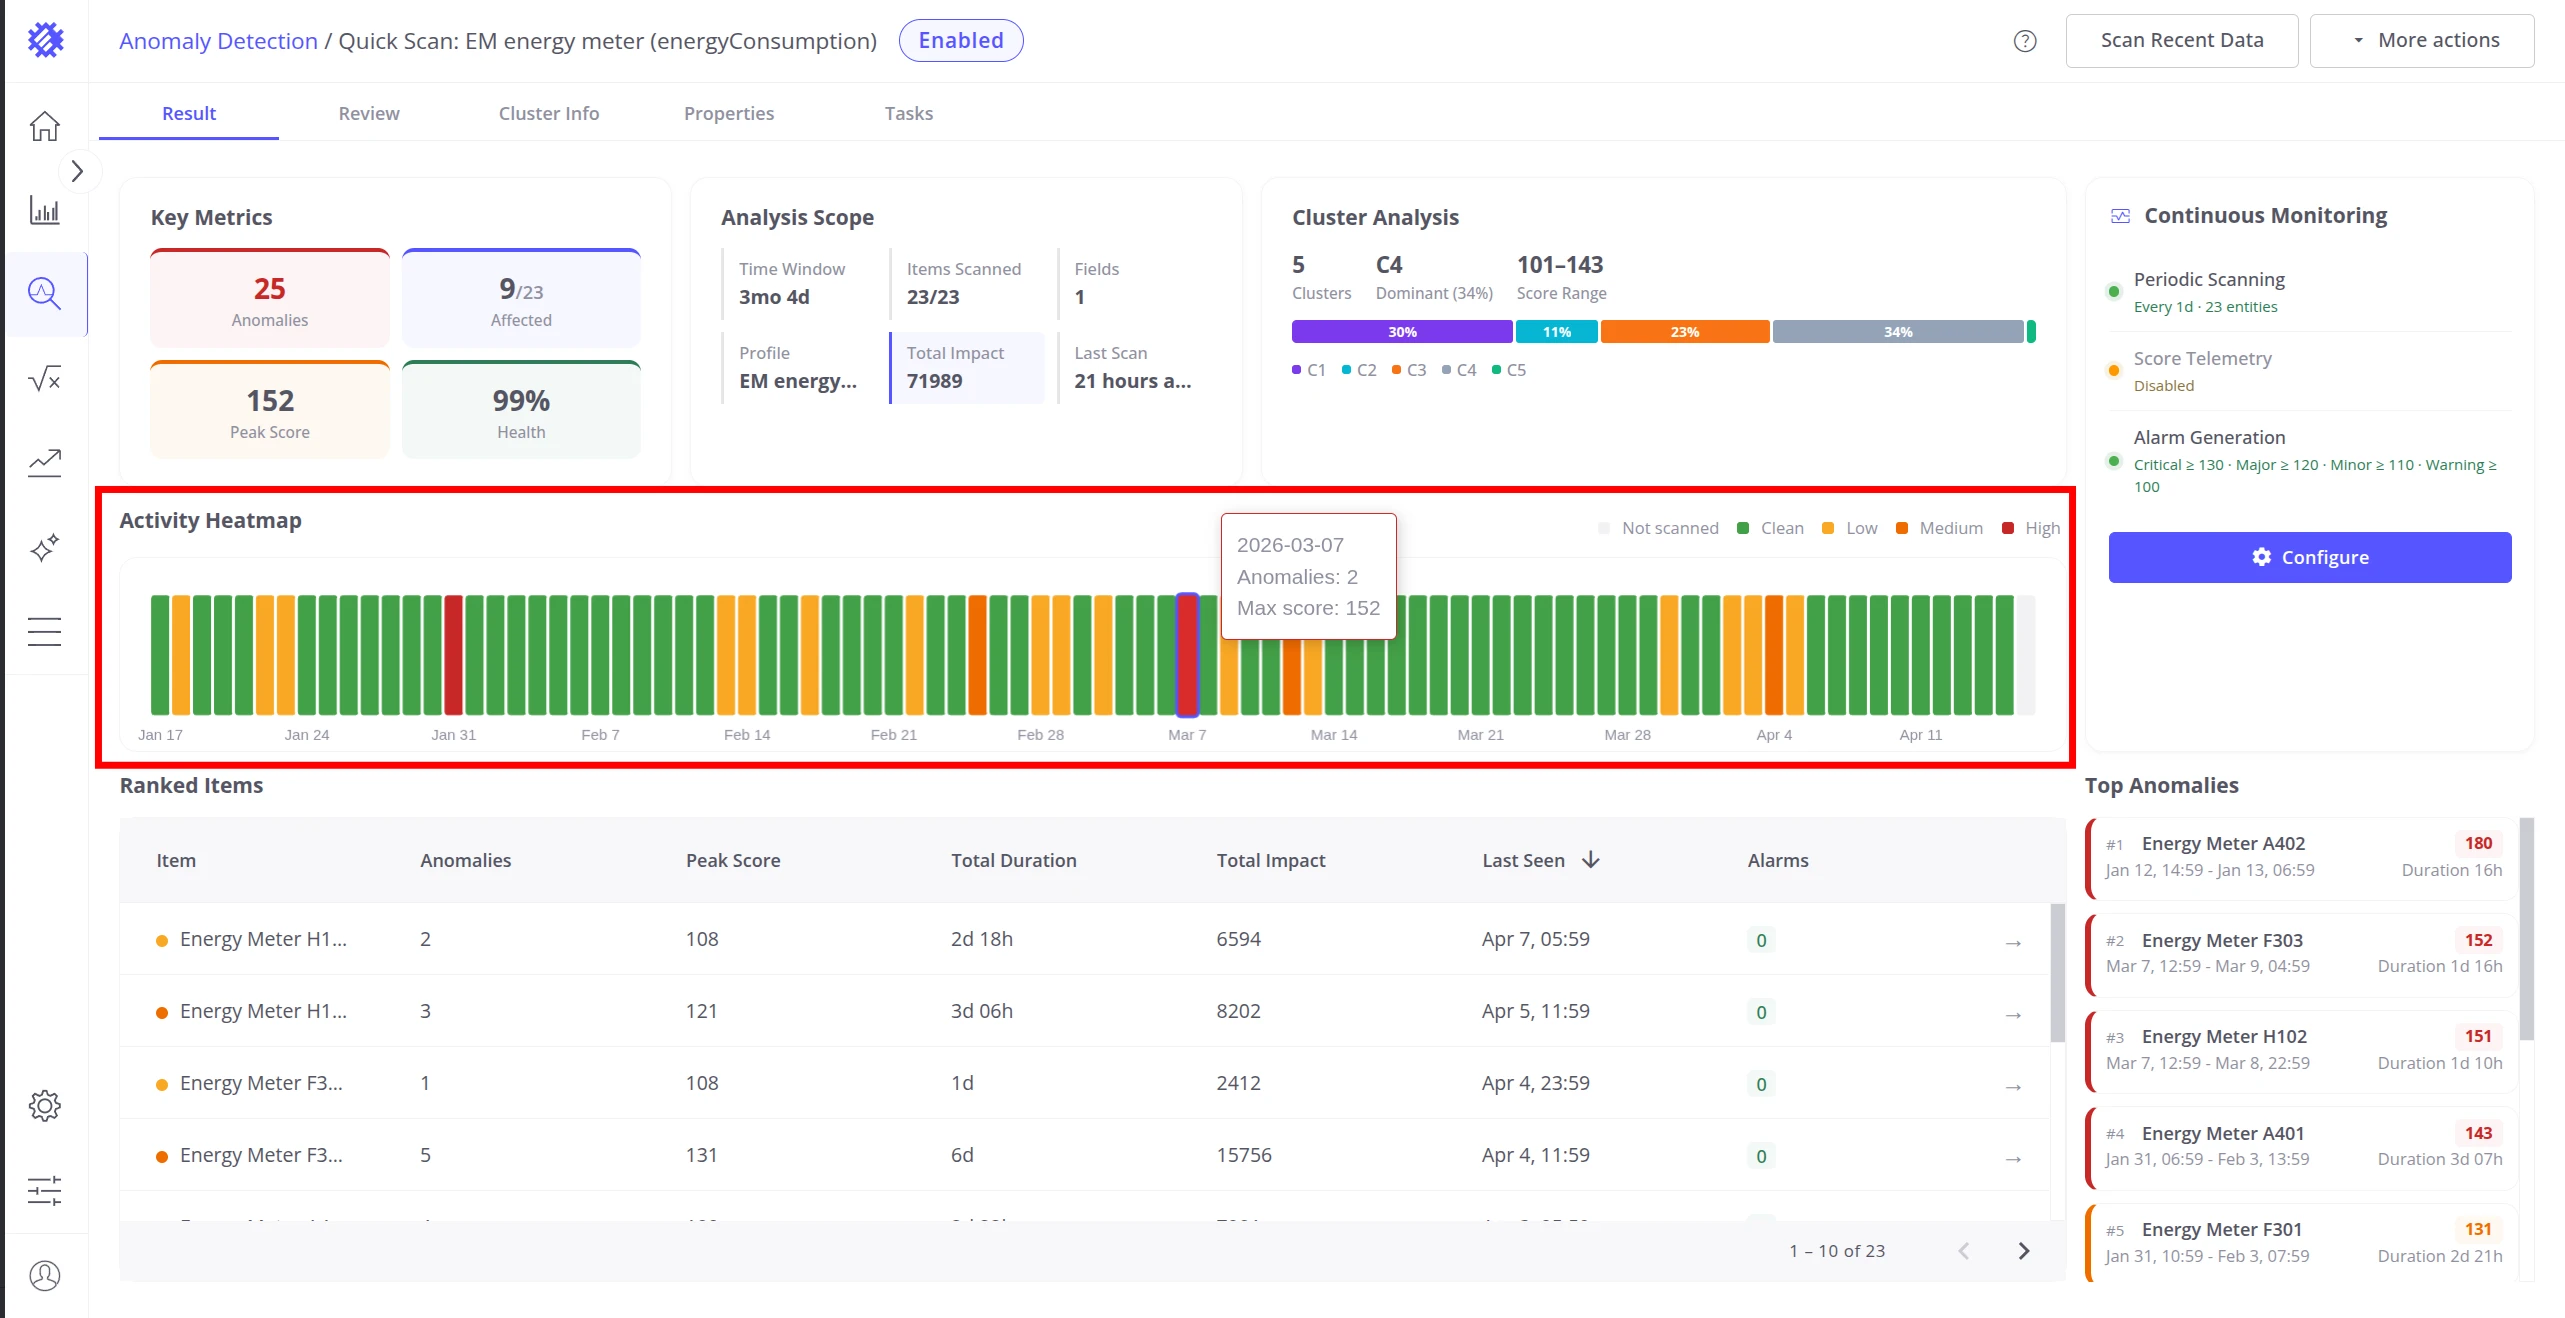
Activity Heatmap
Section titled “Activity Heatmap”The Activity Heatmap shows anomaly intensity across the last 90 days — one cell per day per item. Color encodes how severe the anomaly activity was on each day:
| Color | Meaning |
|---|---|
| Gray | Not scanned — no data available for this day |
| Green | Clean — no anomalies detected |
| Yellow | Low anomaly activity |
| Orange | Moderate anomaly activity |
| Red | High anomaly activity |
Hover over any cell to see the date, anomaly count, and maximum score for that day.
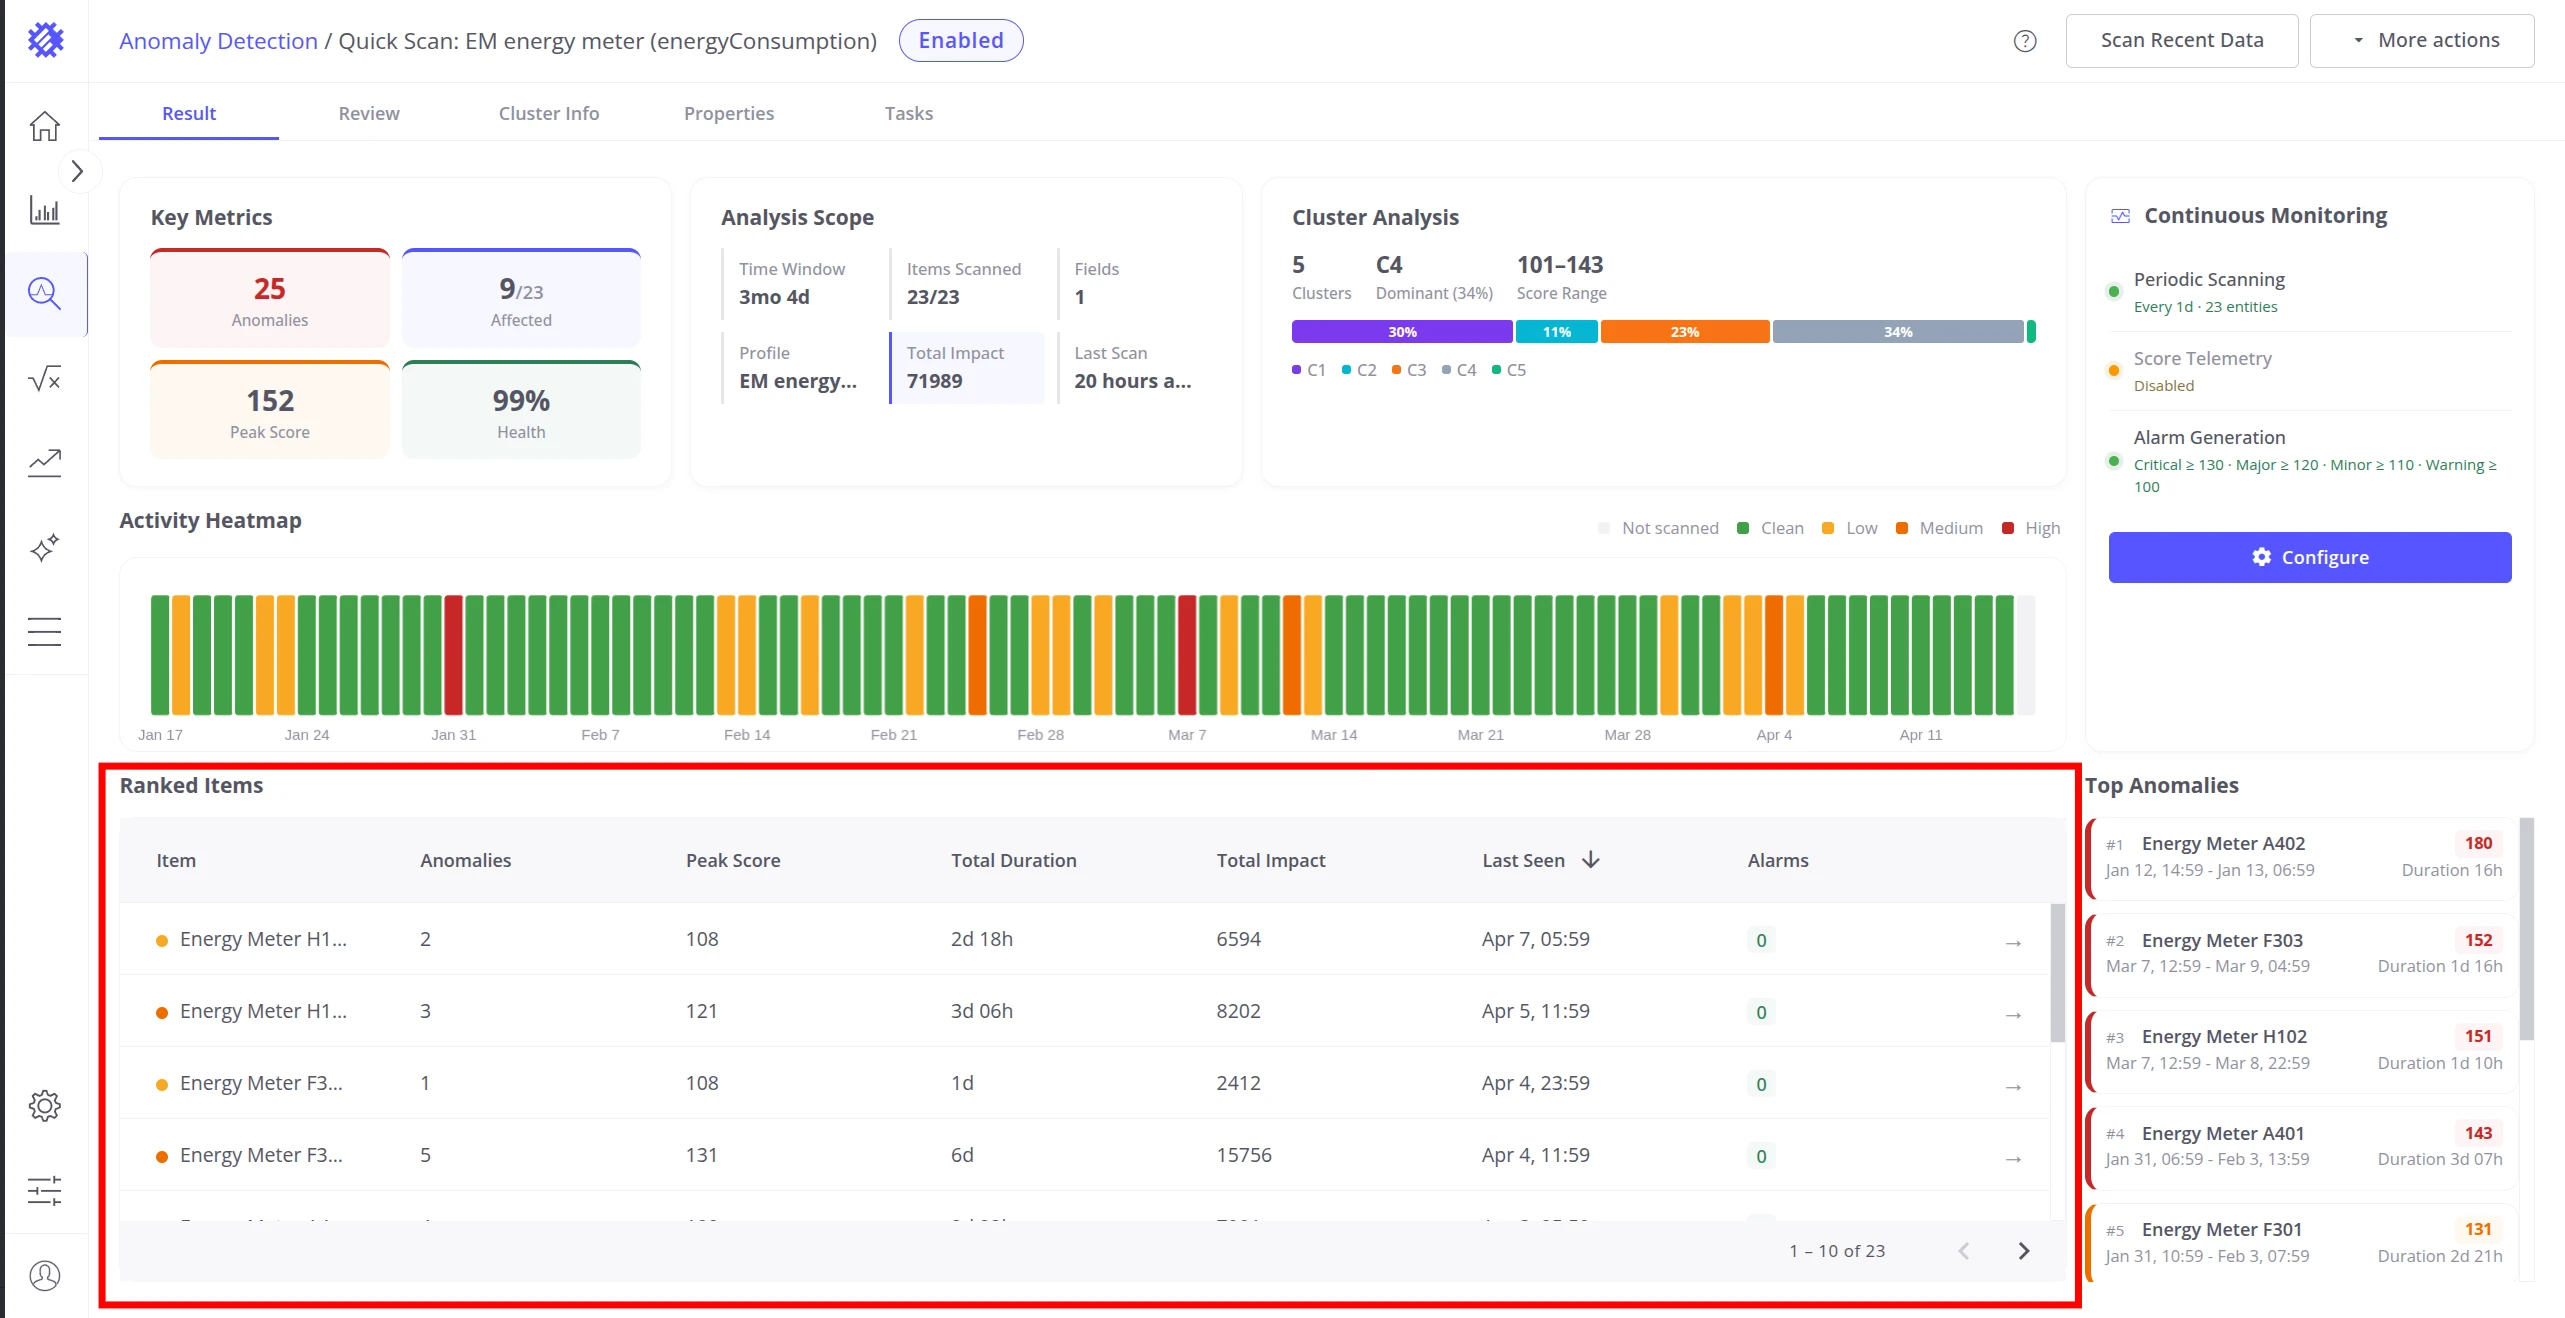
Ranked Items
Section titled “Ranked Items”The Ranked Items table lists all scanned devices or assets sorted by anomaly activity. Each row shows:
| Column | Description |
|---|---|
| Item | Device or asset name with a color indicator dot |
| Anomalies | Count of anomaly events detected for this item |
| Peak Score | Highest anomaly score recorded for this item |
| Total Duration | Combined duration of all anomaly events for this item |
| Total Impact | Sum of score indexes — cumulative anomaly footprint |
| Last Seen | Timestamp of the most recent anomaly, or green “No anomalies” if clean |
| Alarms | Number of ThingsBoard alarms created for this item |
Click any row to open the Review tab with that item pre-selected, showing its anomaly chart and detection history.
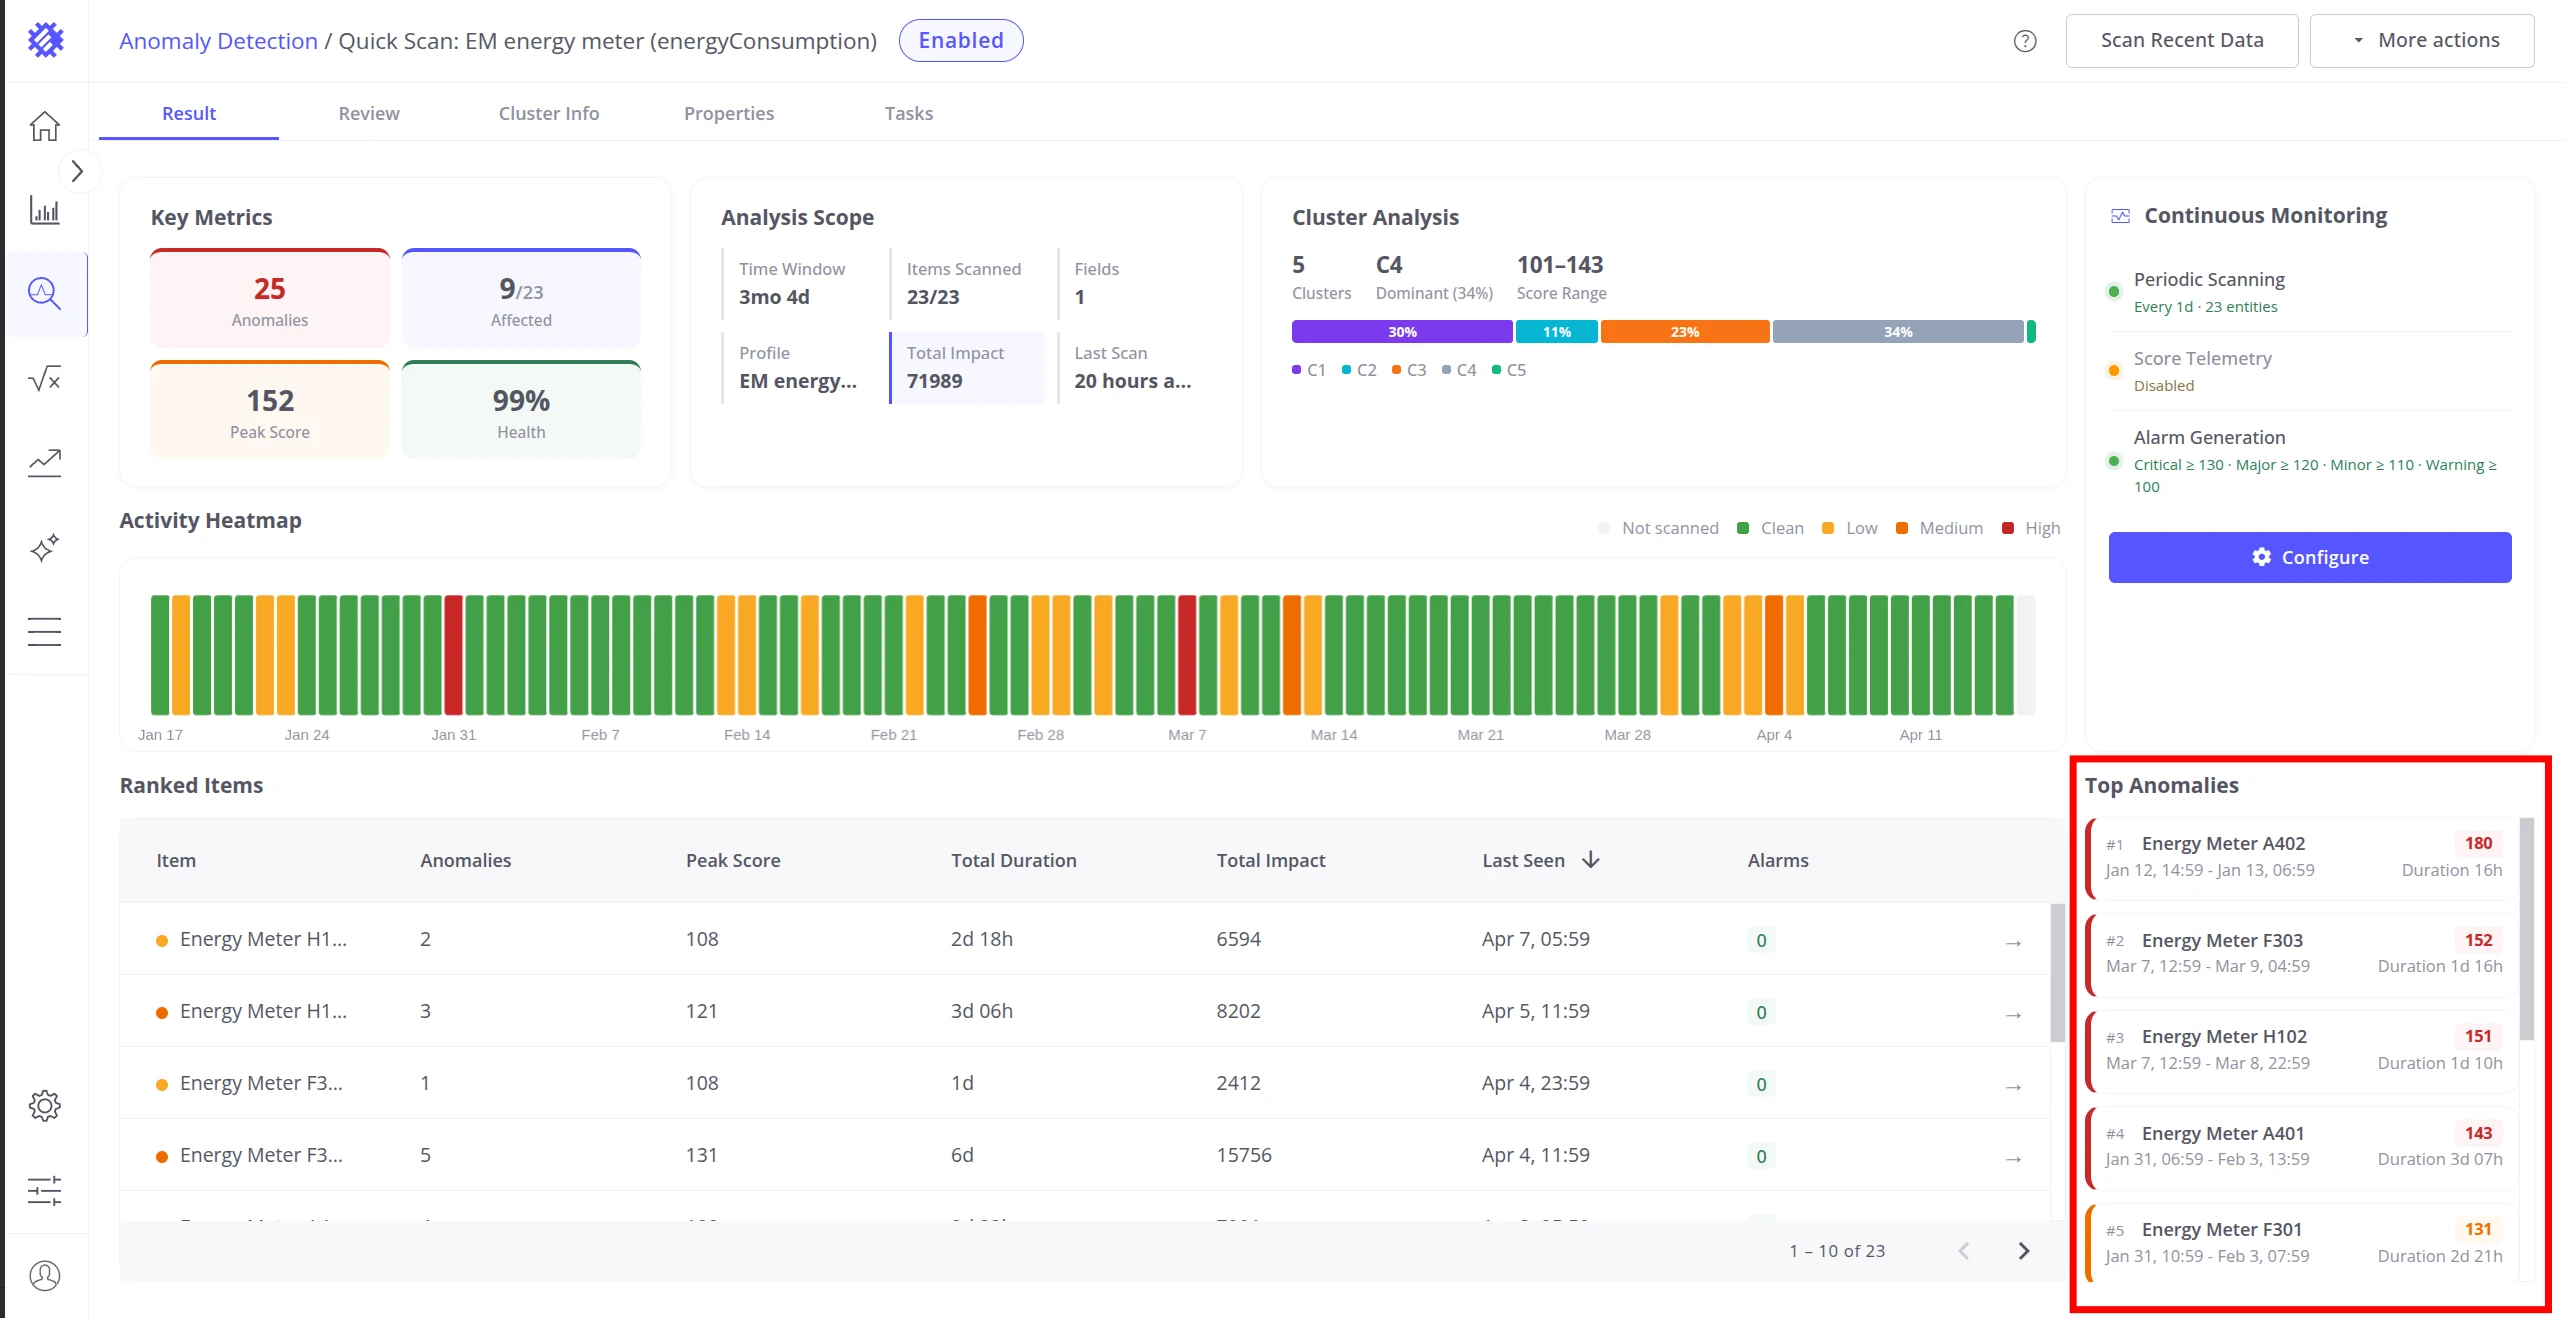
Top Anomalies
Section titled “Top Anomalies”The Top Anomalies panel on the right side of the Result tab lists the 10 highest-scoring individual anomaly events across all items. Each entry shows the item name, score badge, start/end time, and duration. Border color indicates severity:
Click any entry to open the Review tab navigated directly to that anomaly.
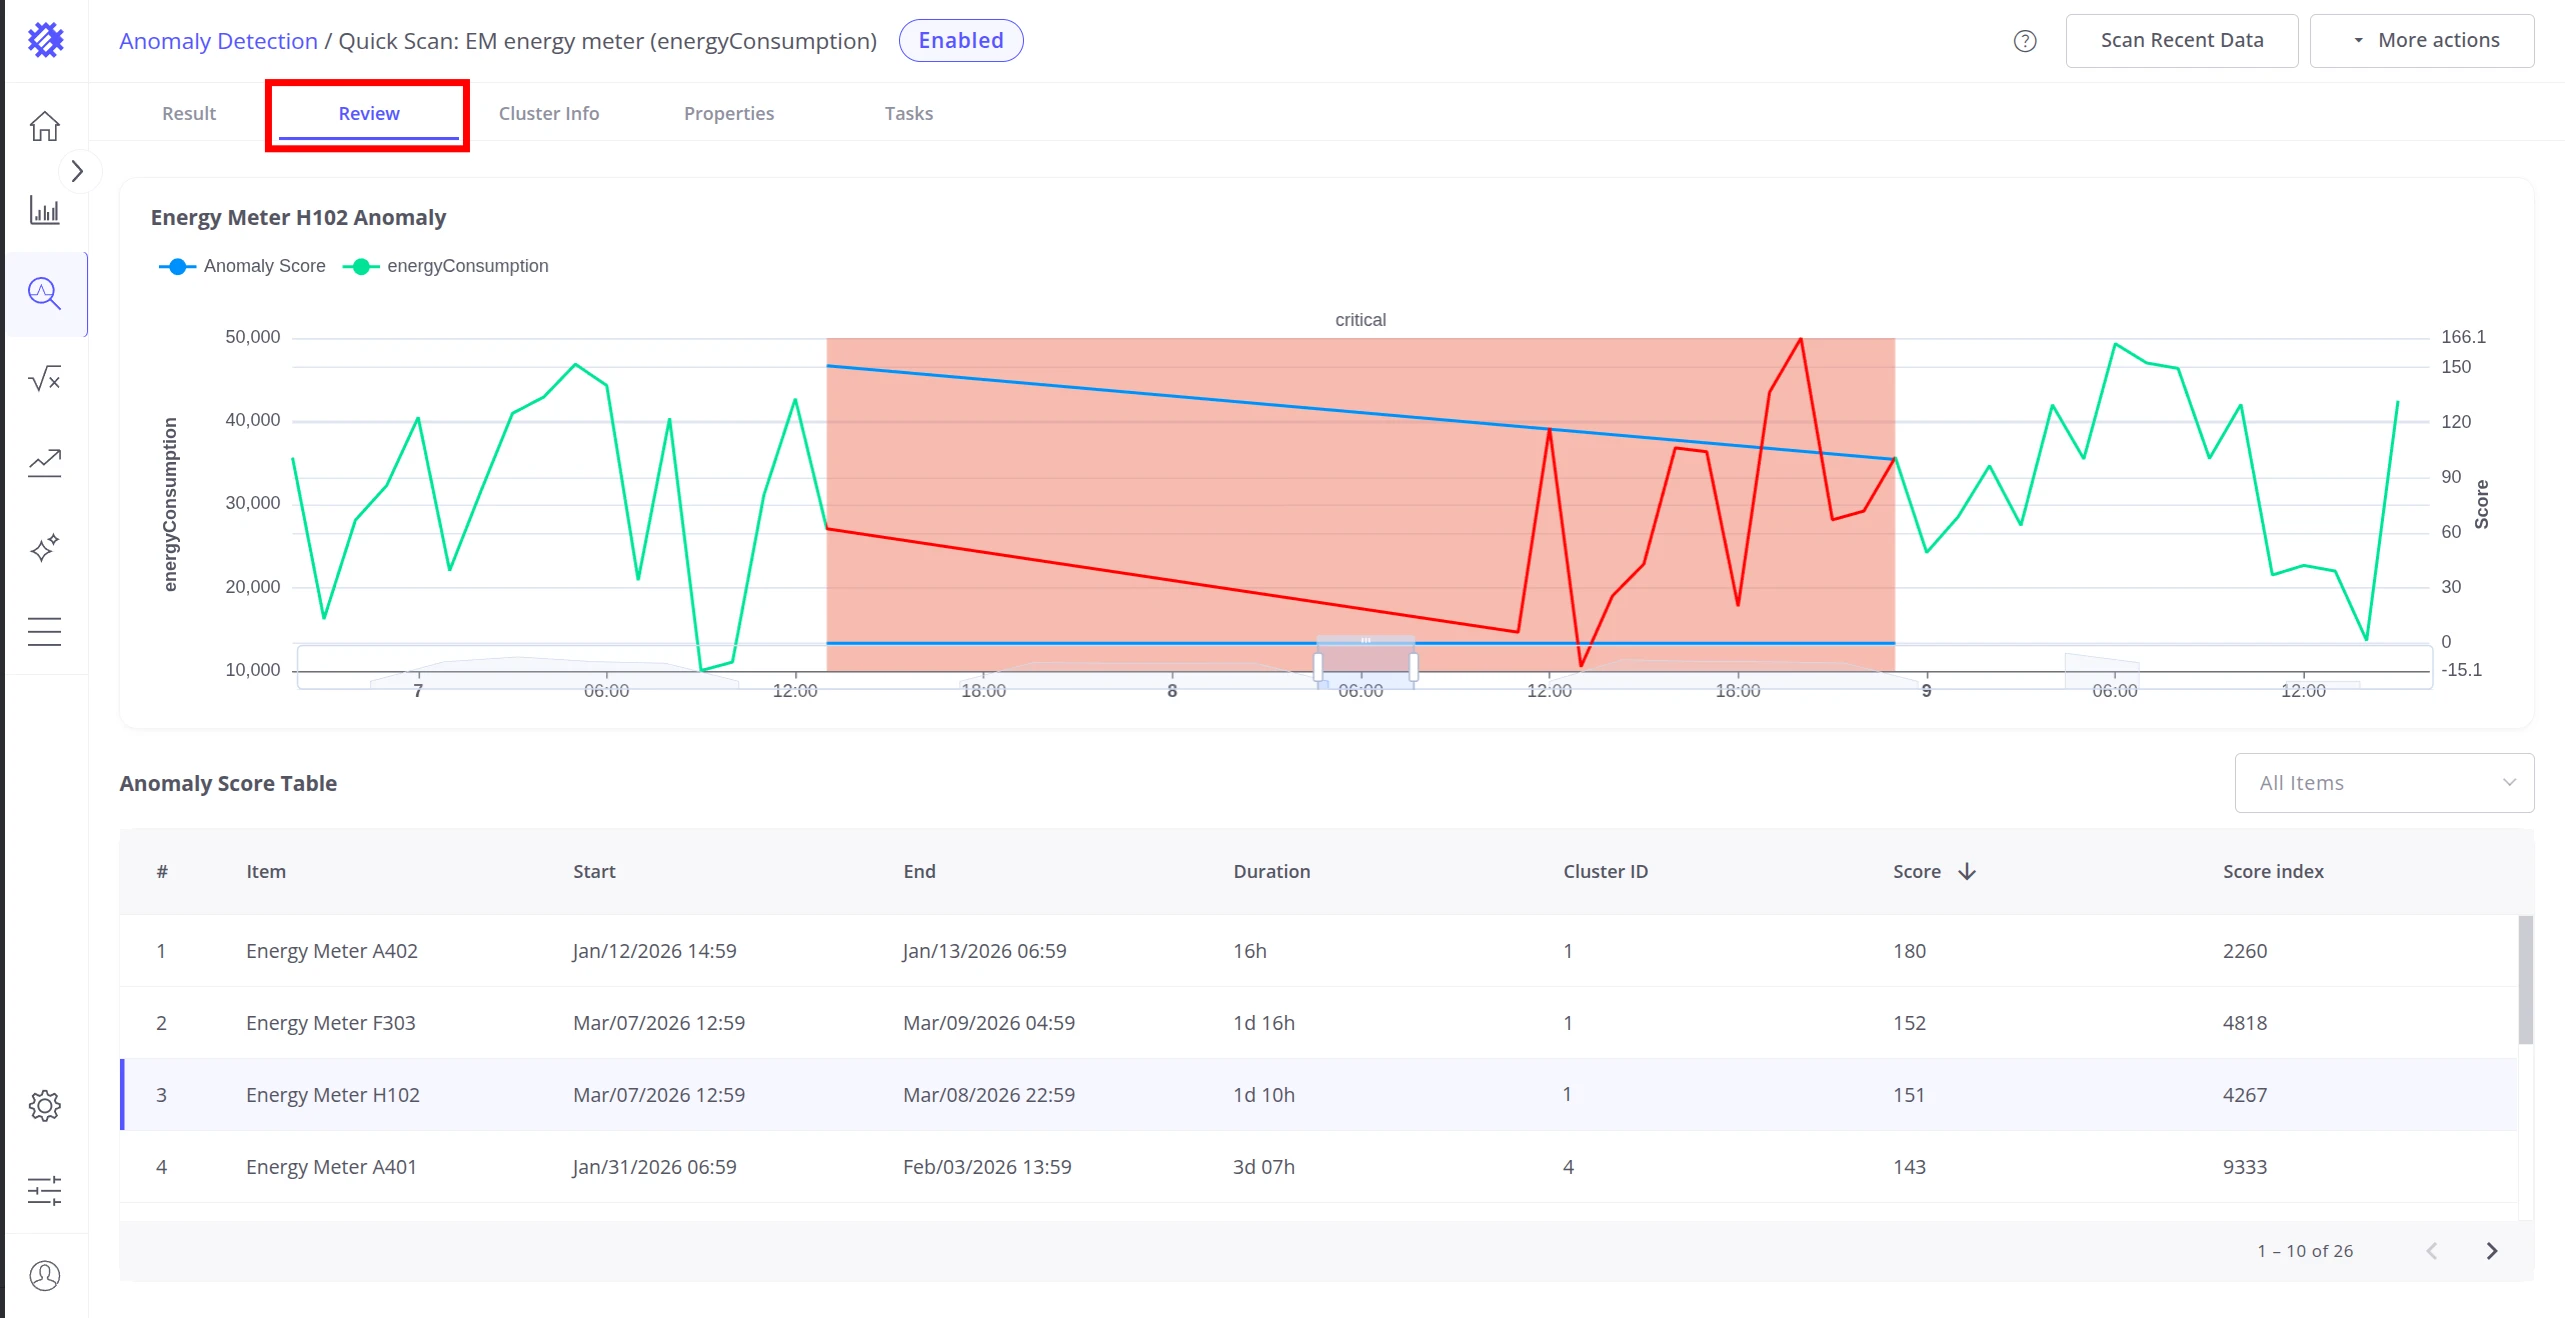
Review Tab
Section titled “Review Tab”The Review tab shows the full anomaly detection history for the model. Use it to inspect individual anomaly events, validate detection quality, and determine whether results are reliable before enabling monitoring or alarms.
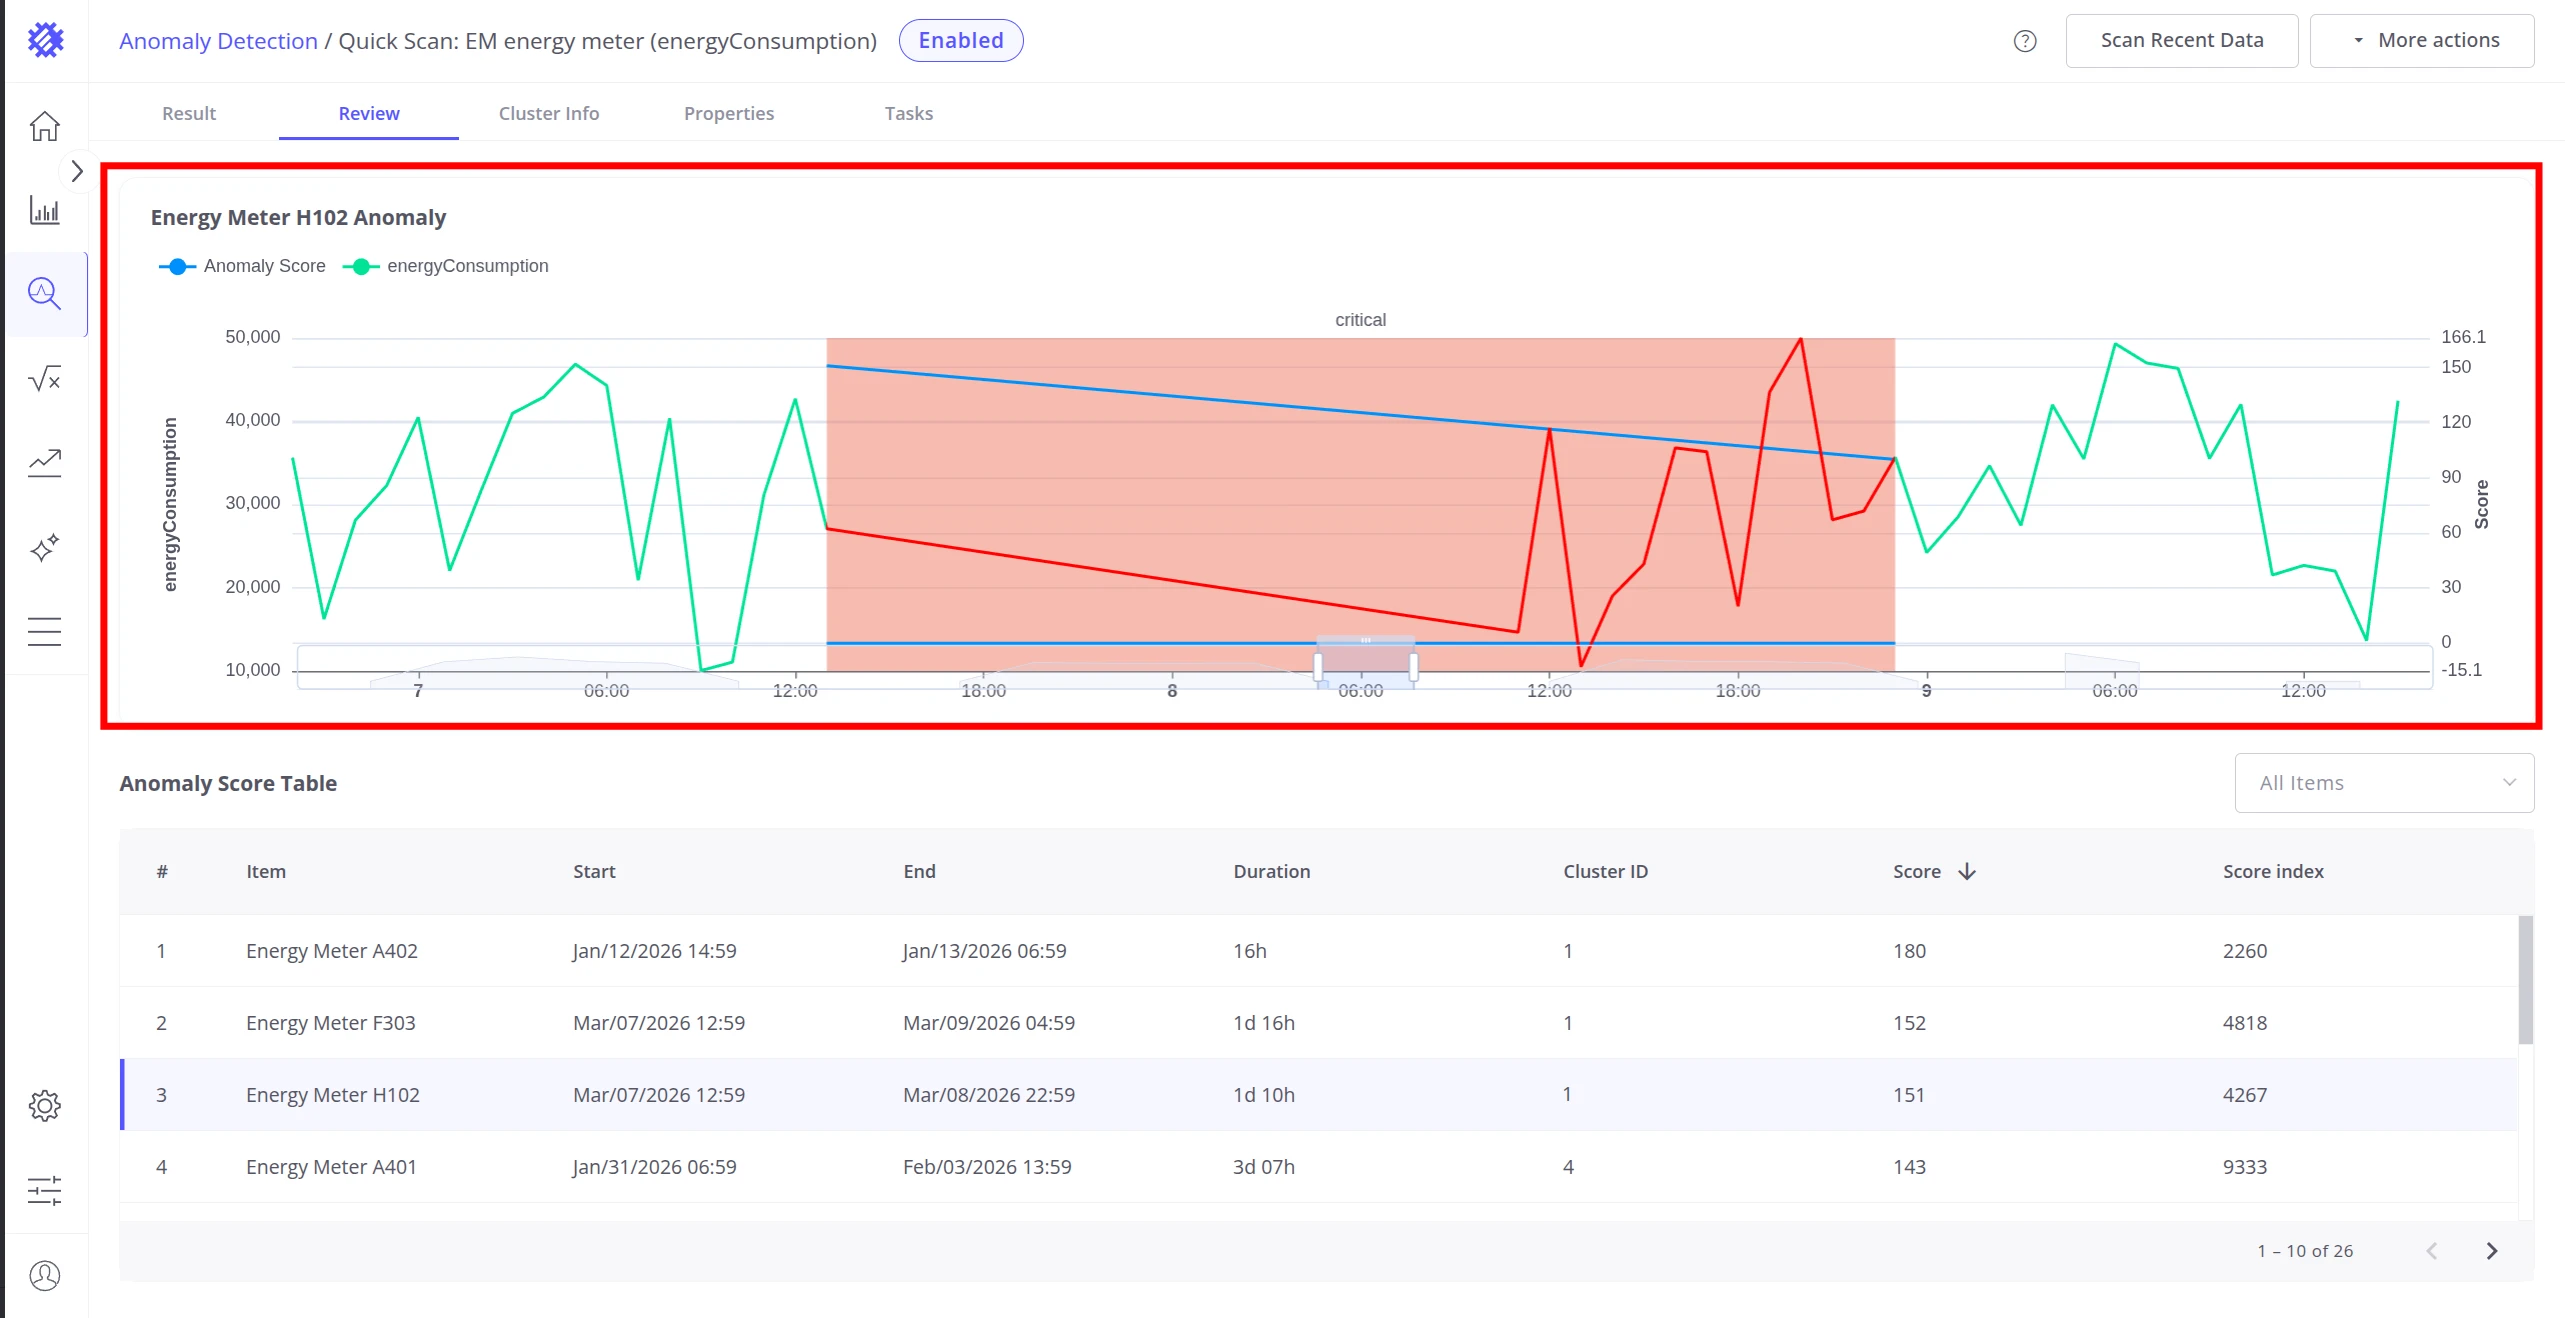
Chart — the top section displays the telemetry and anomaly score for the selected row:
- Raw telemetry values on the left Y-axis
- Anomaly score on the right Y-axis
- Red background highlights the active anomaly window
Hover over the chart to see exact values at any point in time.
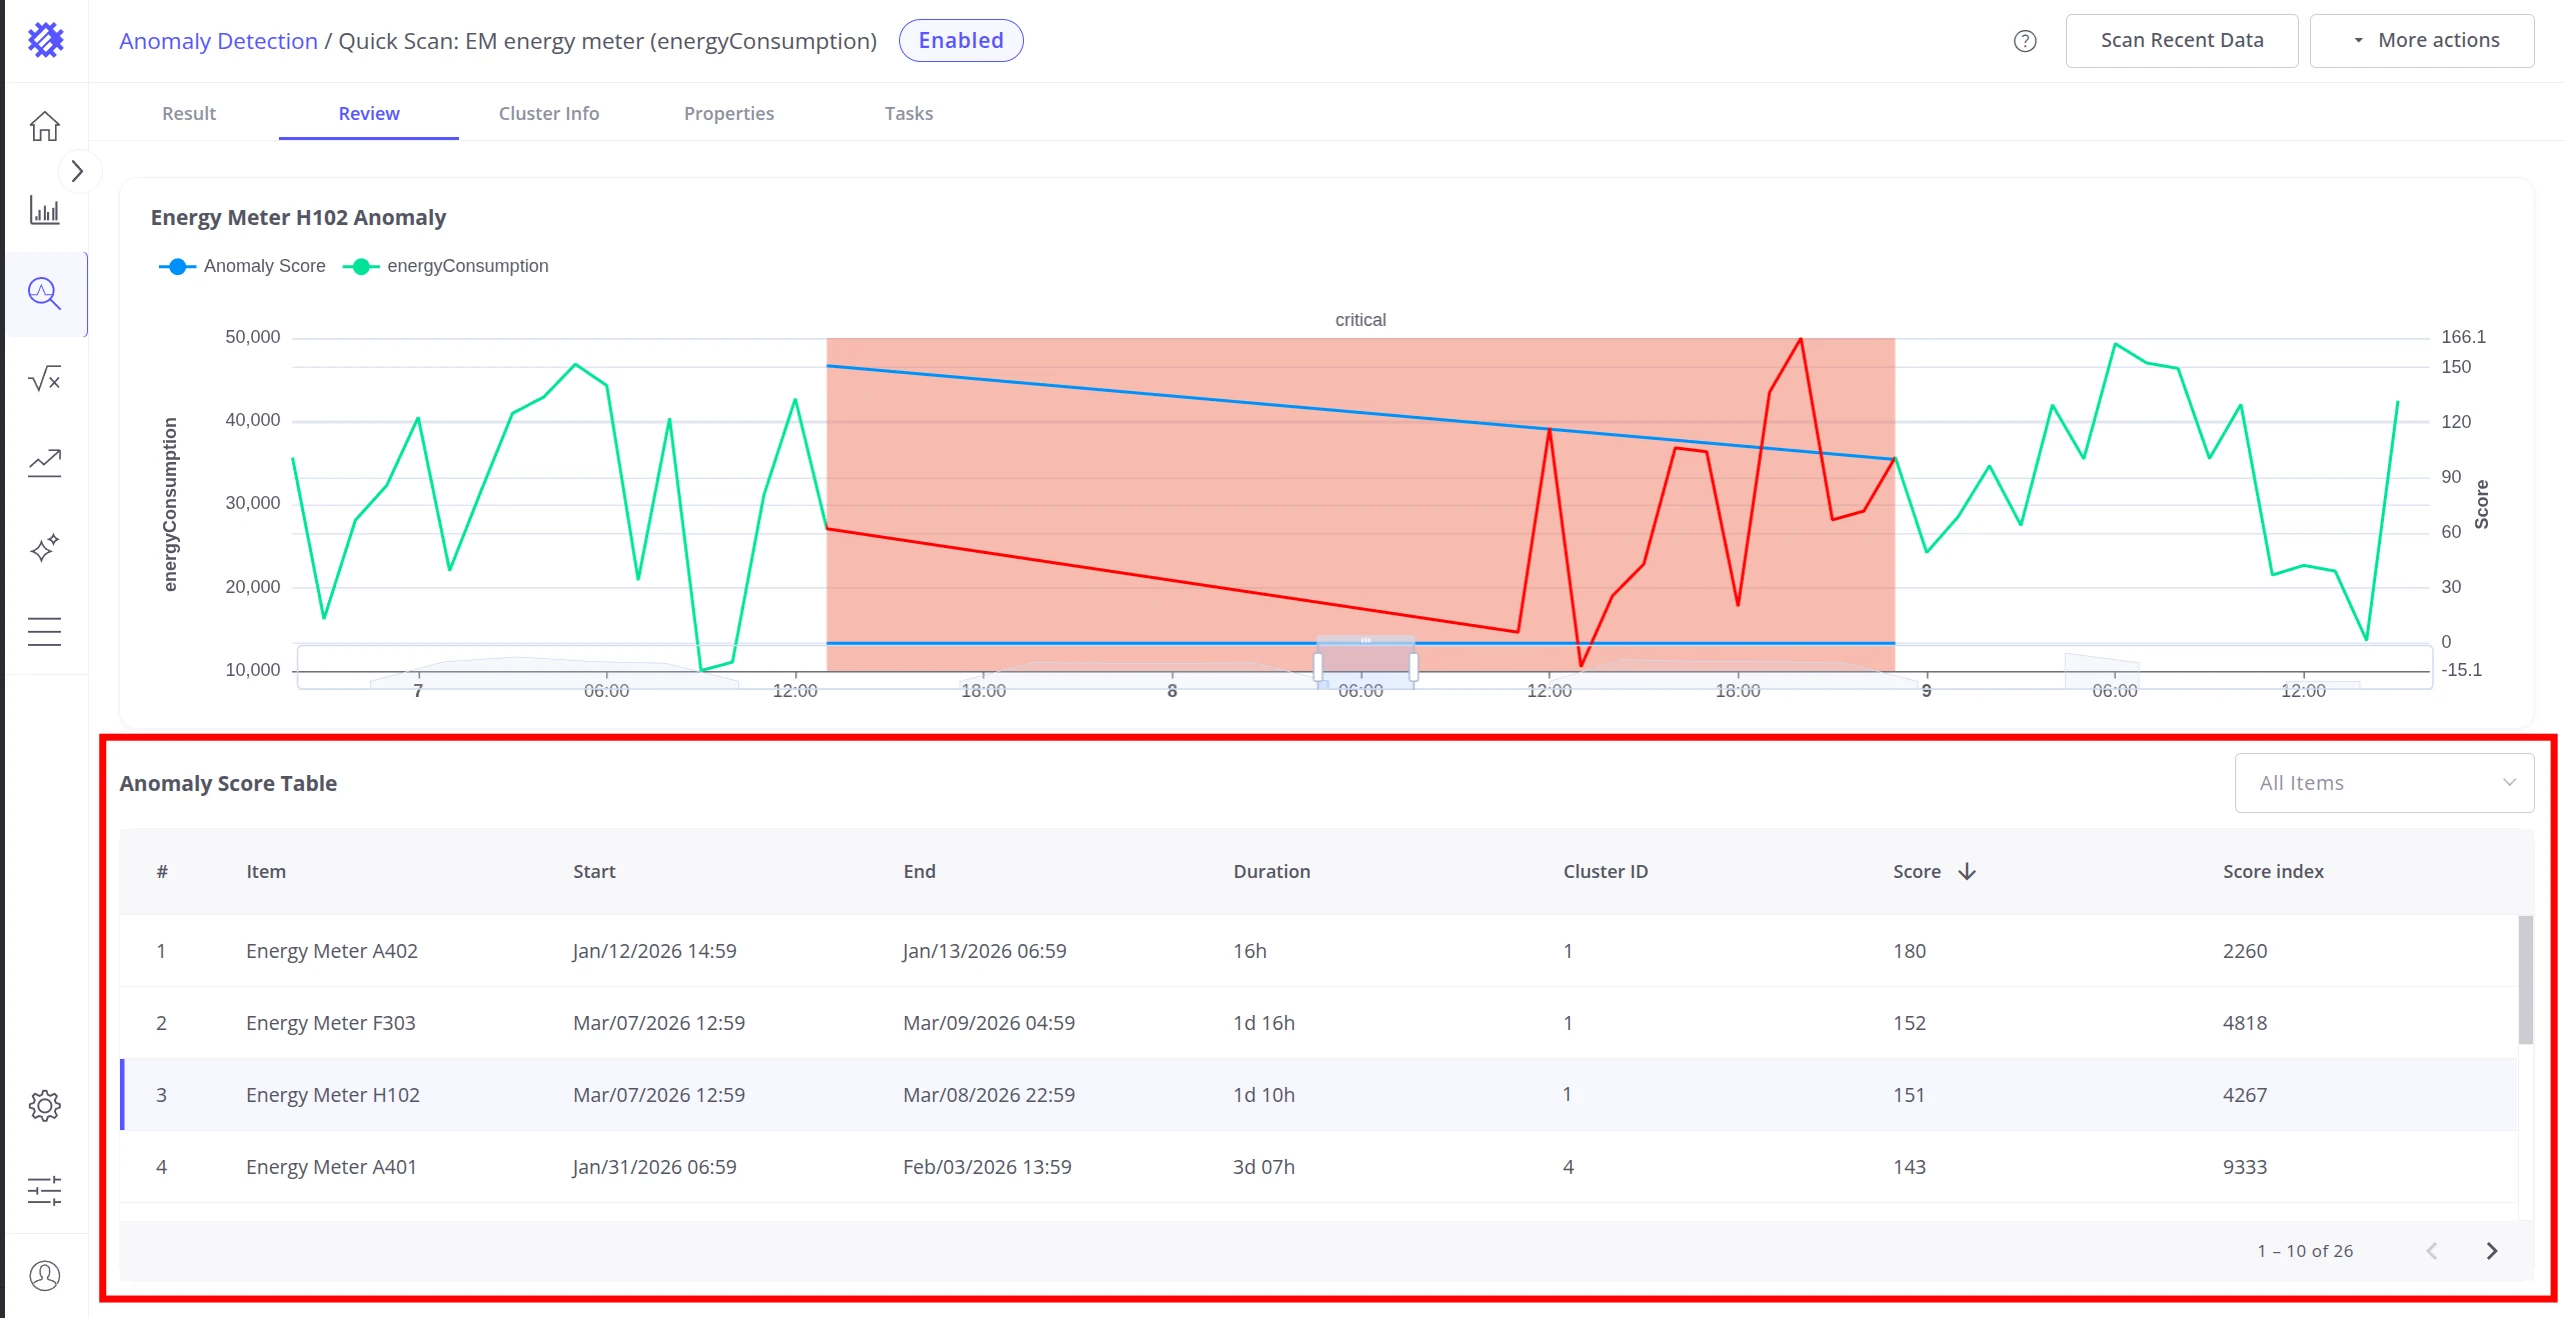
Anomaly Score Table — the bottom section lists every anomaly detected during build, refresh, and reprocess runs. Each row contains:
| Column | Description |
|---|---|
| Item | Device or asset name |
| Start | Anomaly start timestamp |
| End | Anomaly end timestamp |
| Duration | Length of the anomaly event |
| Cluster ID | Which cluster this anomaly segment was compared against |
| Score | Anomaly score — how far the segment deviated from normal |
| Score Index | Anomaly score index — cumulative impact value |
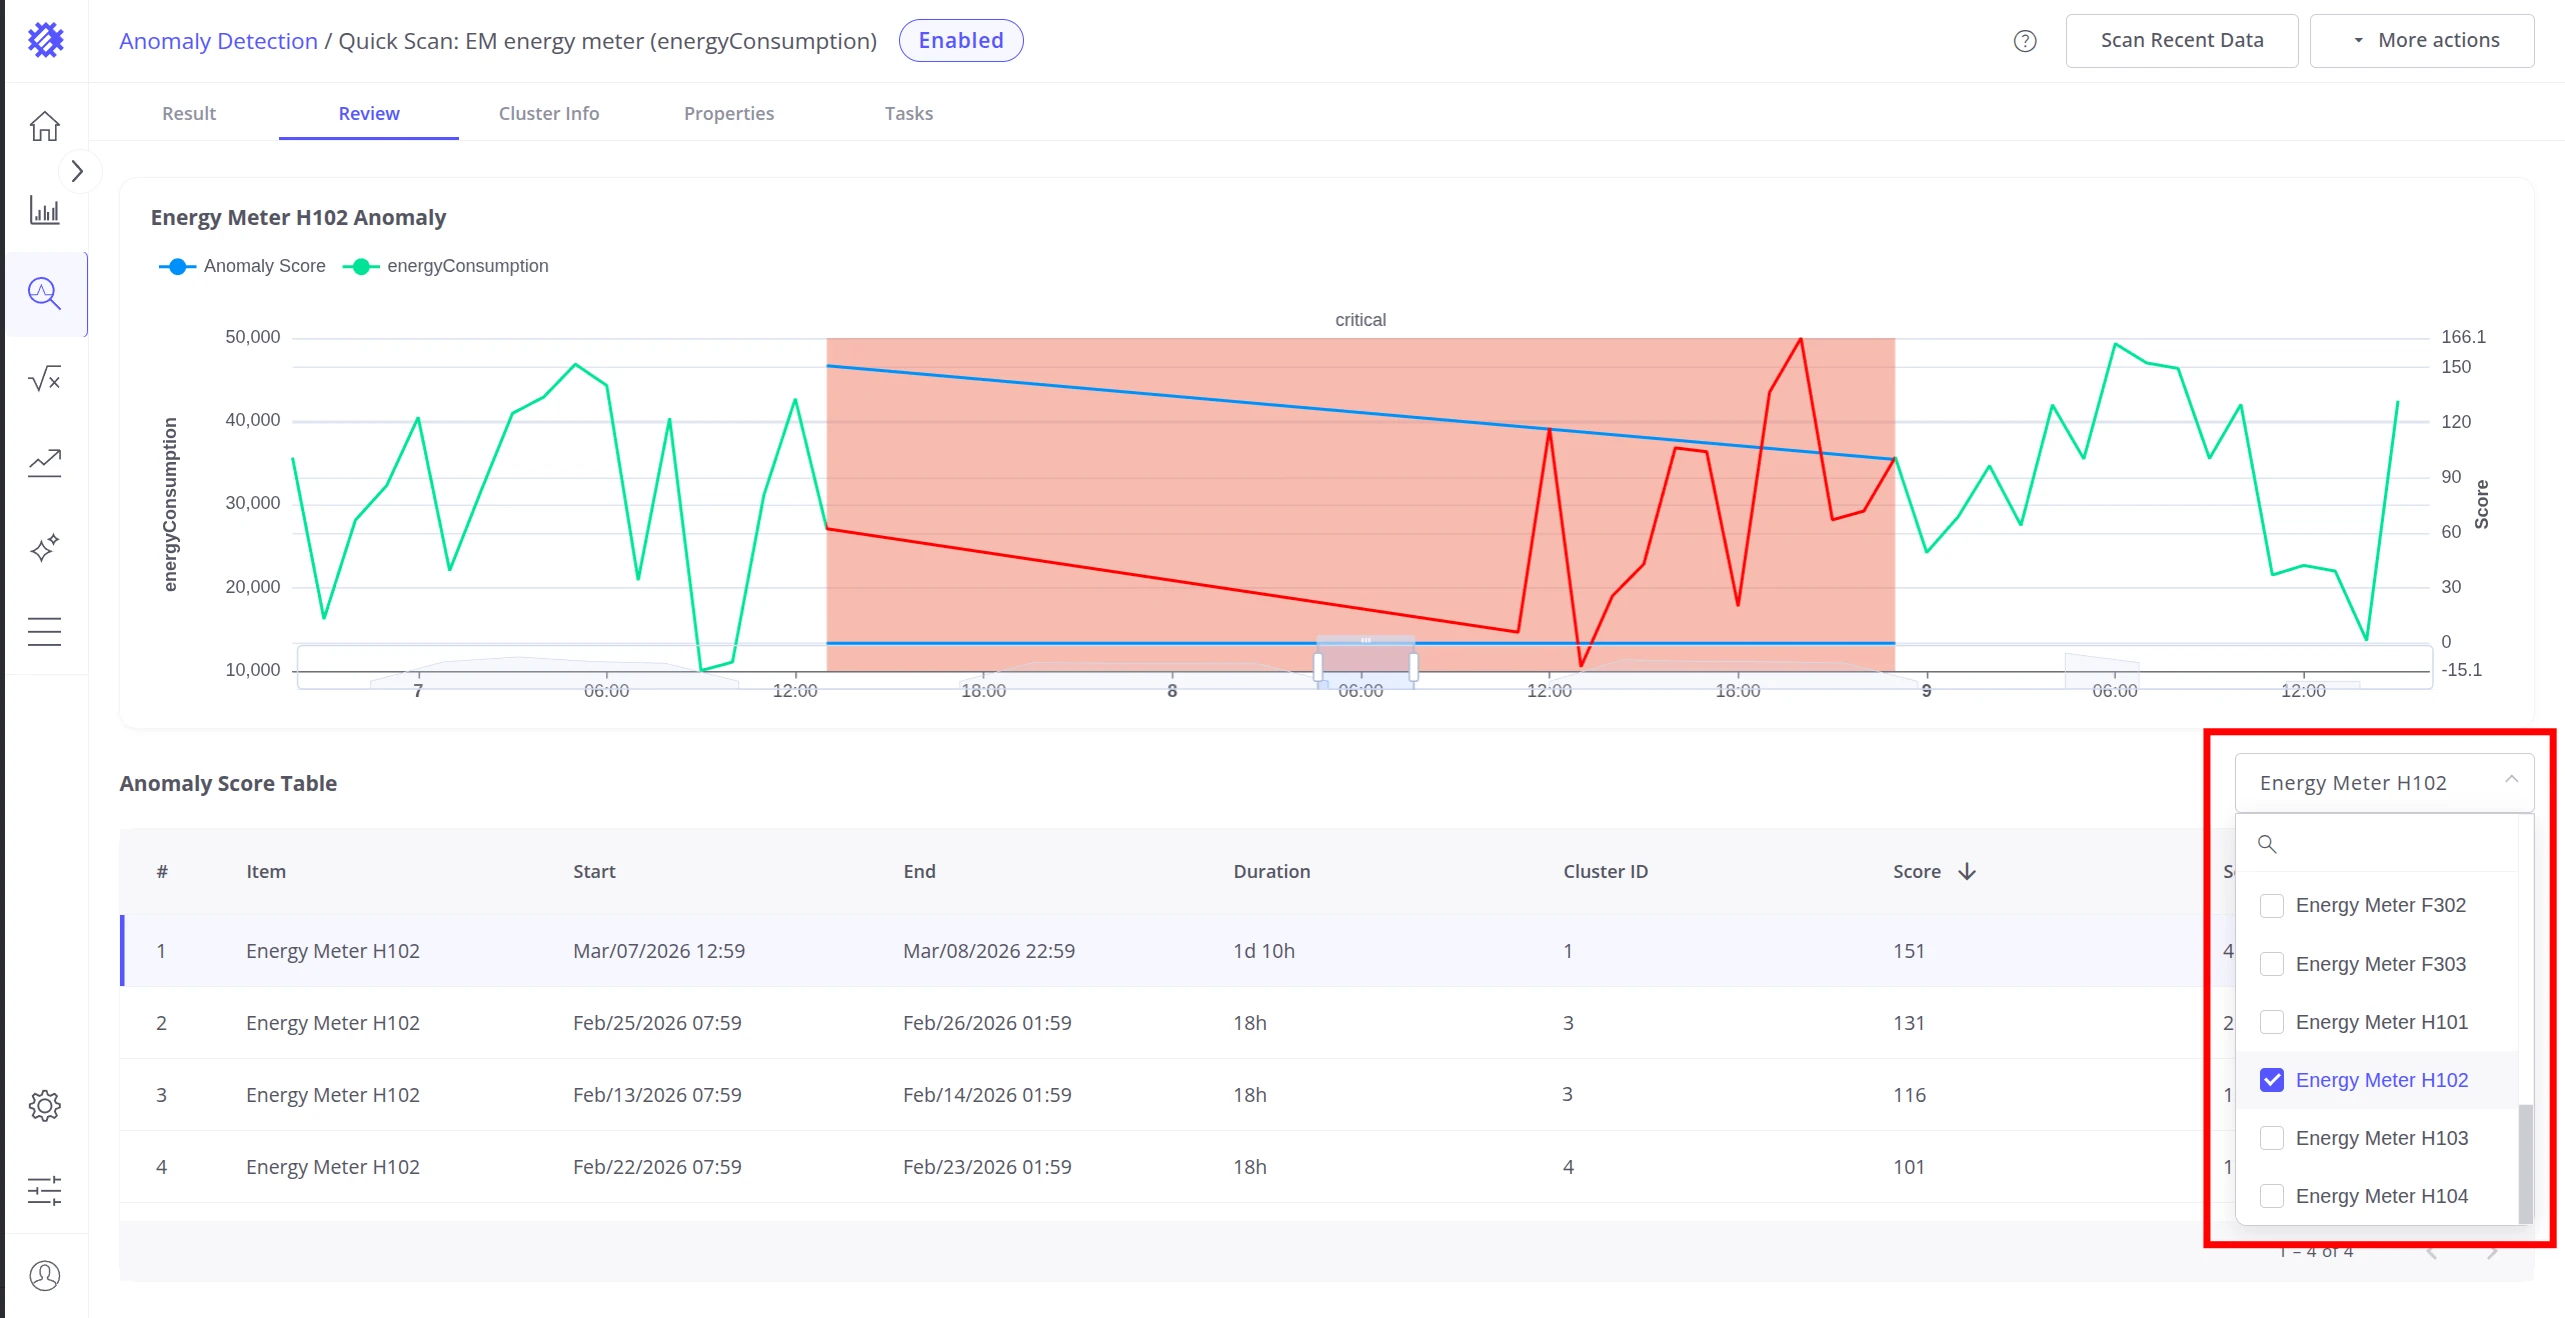
Sort by any column to prioritize analysis. Use the All items dropdown in the top-right corner of the table to filter by a specific device or asset.
Click any row in the table to load that anomaly event into the chart above — the telemetry and anomaly score for the selected time window are displayed together, with the anomaly window highlighted in red.
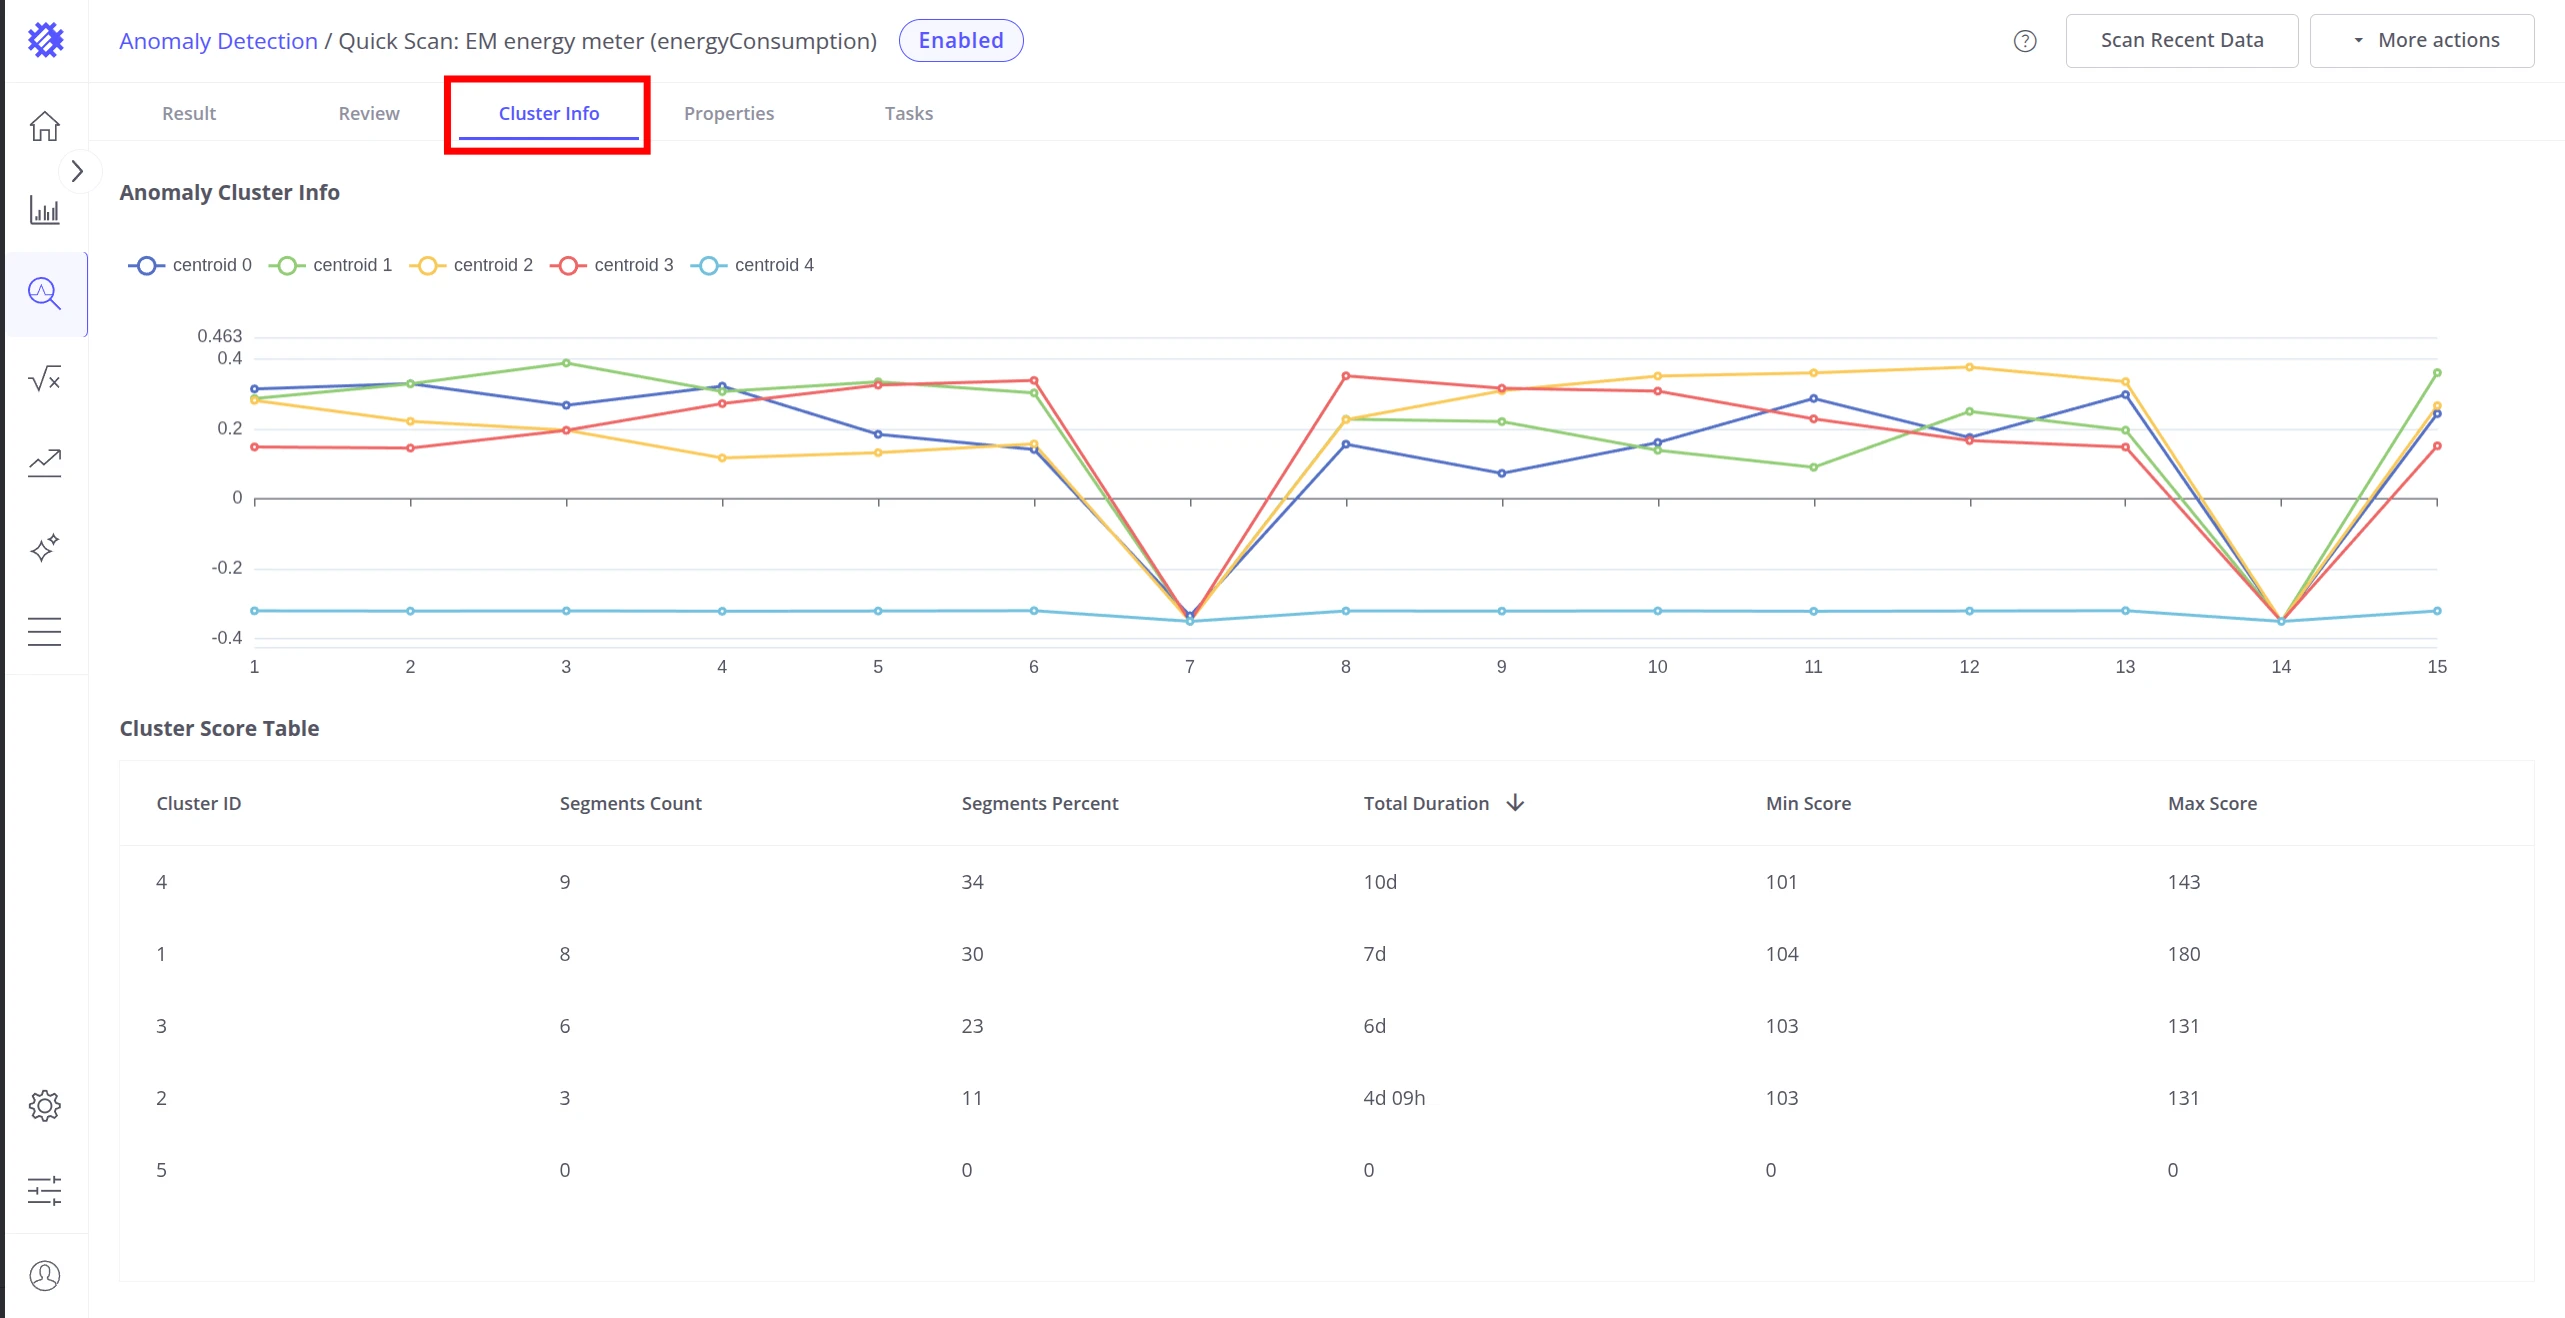
Cluster Info Tab
Section titled “Cluster Info Tab”The Cluster Info tab shows how the model organized training data into clusters. Use it to validate that clustering accurately captured the range of normal operating behaviors before interpreting anomaly results.
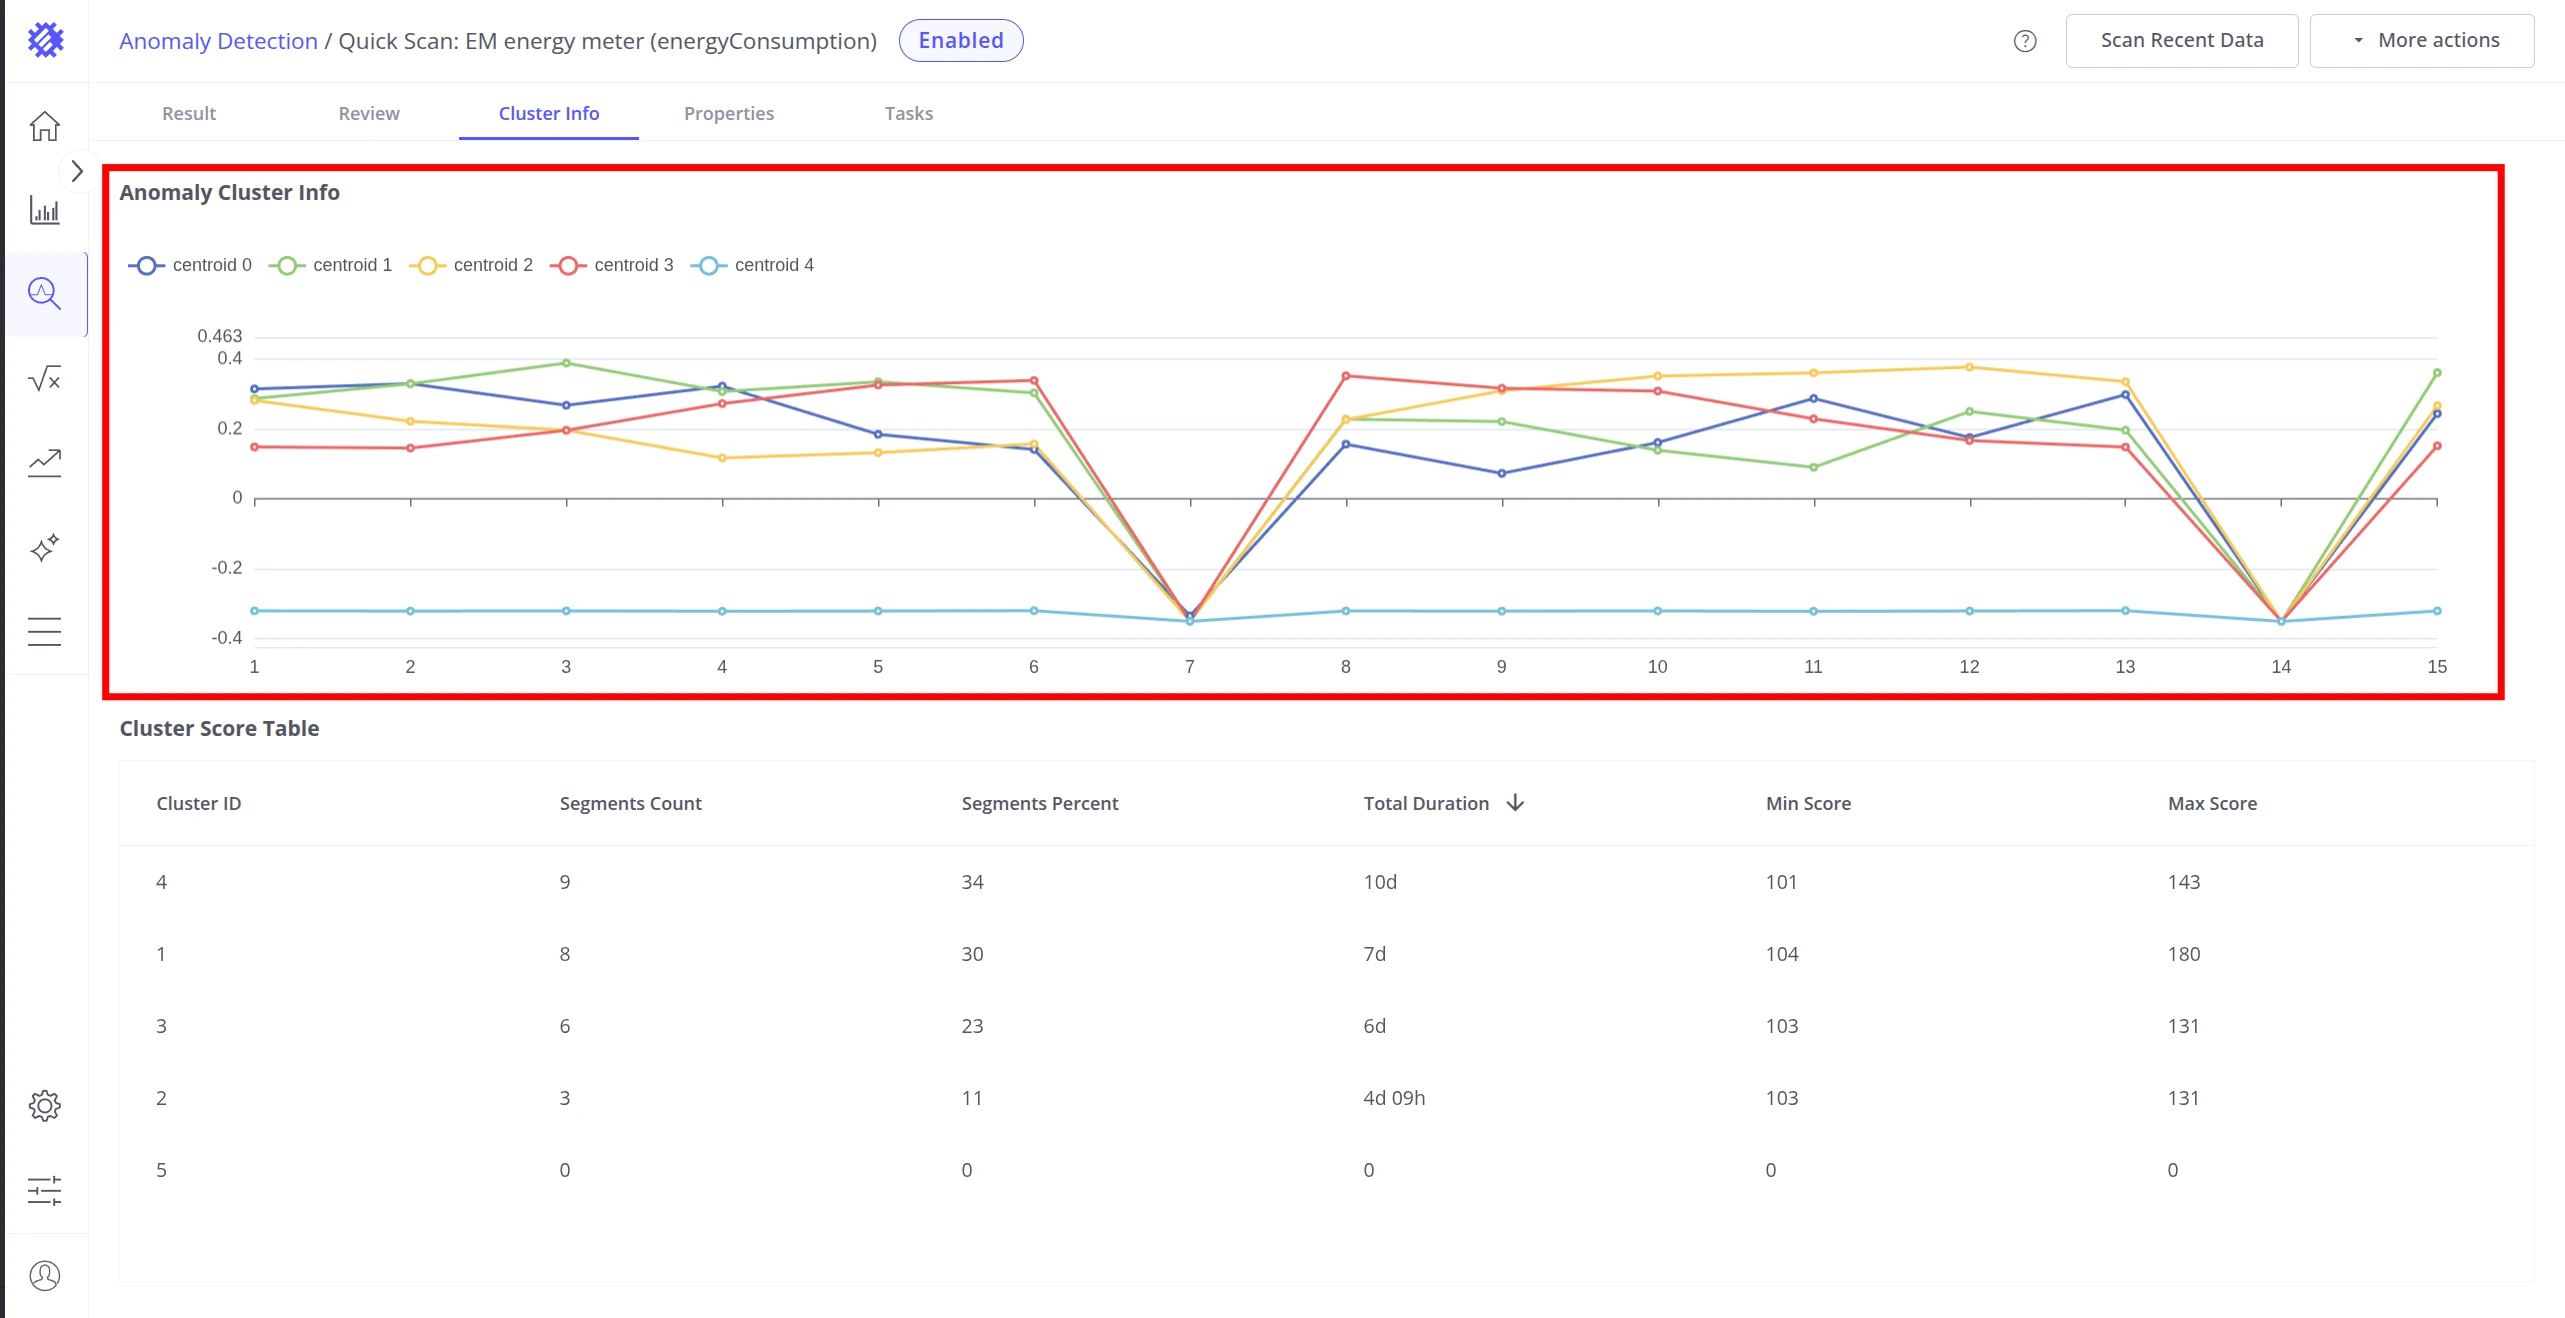
Centroid visualization — the chart at the top shows the average shape (centroid) for each cluster. Each line represents the typical pattern of segments belonging to that cluster. A well-trained model produces clearly distinct centroid shapes.
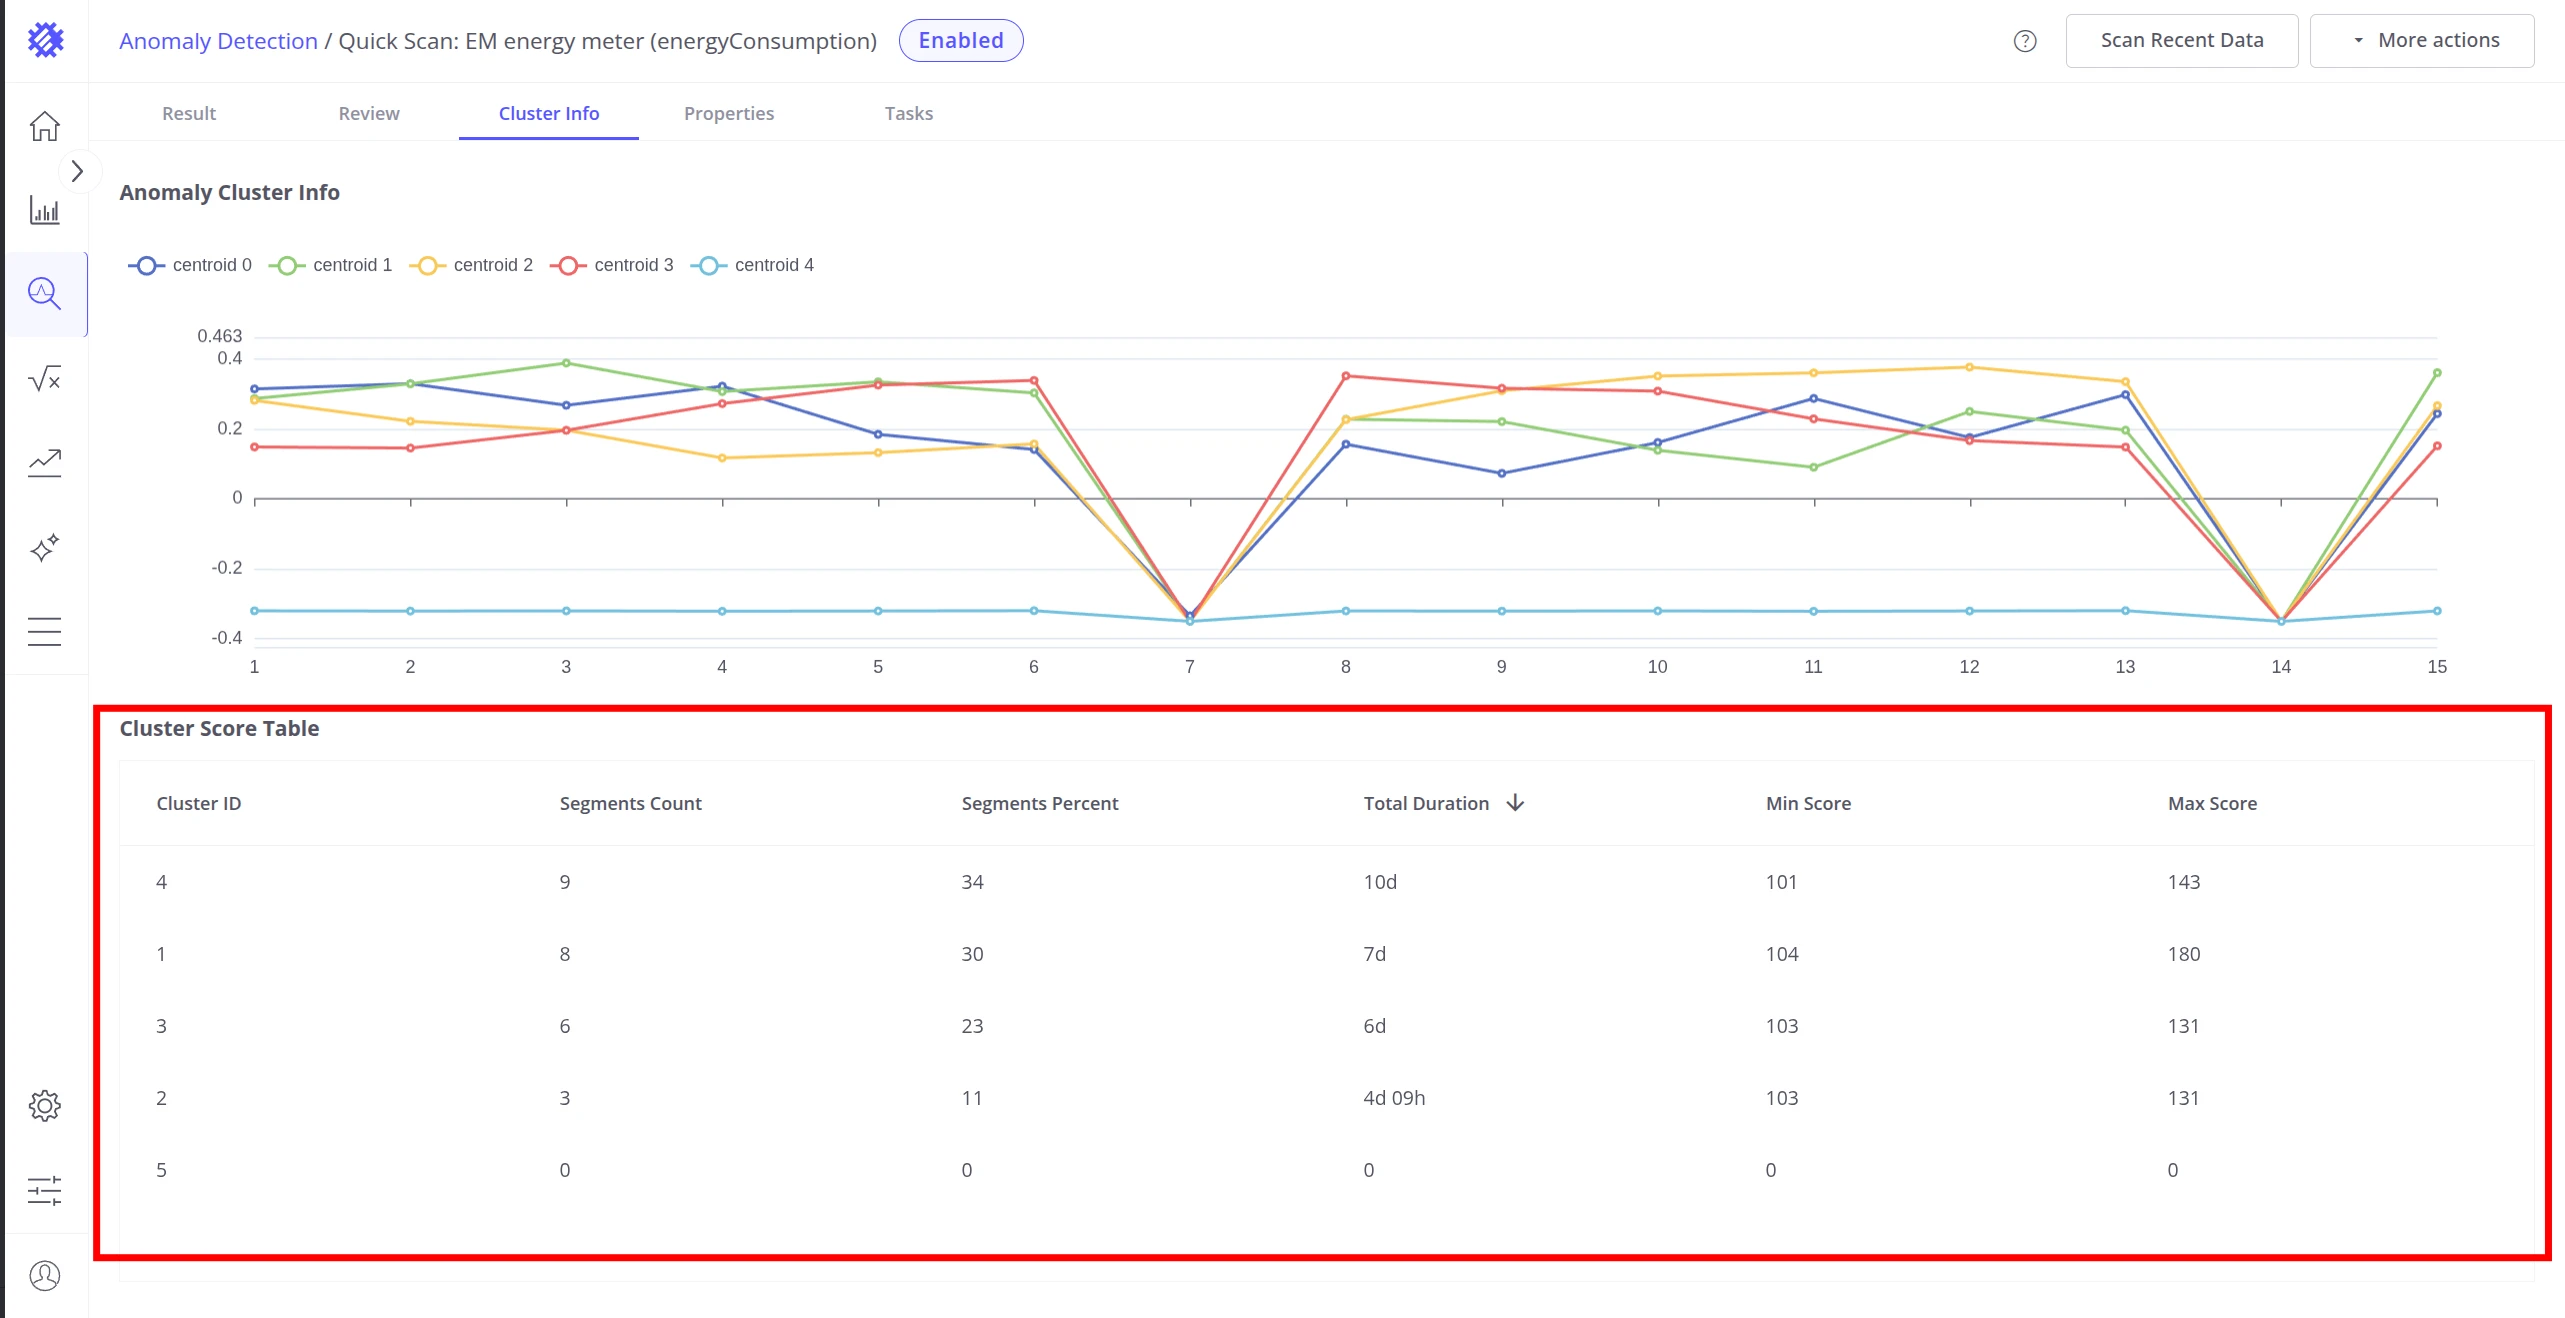
Cluster Score Table — the bottom section summarizes each cluster:
| Column | Description |
|---|---|
| Cluster ID | Unique cluster identifier |
| Segments Count | Number of training segments assigned to this cluster |
| Segments Percent | Percentage of all training segments in this cluster |
| Sum Duration | Combined duration of all segments in this cluster |
| Min Score | Minimum anomaly score among segments in this cluster |
| Max Score | Maximum anomaly score among segments in this cluster |
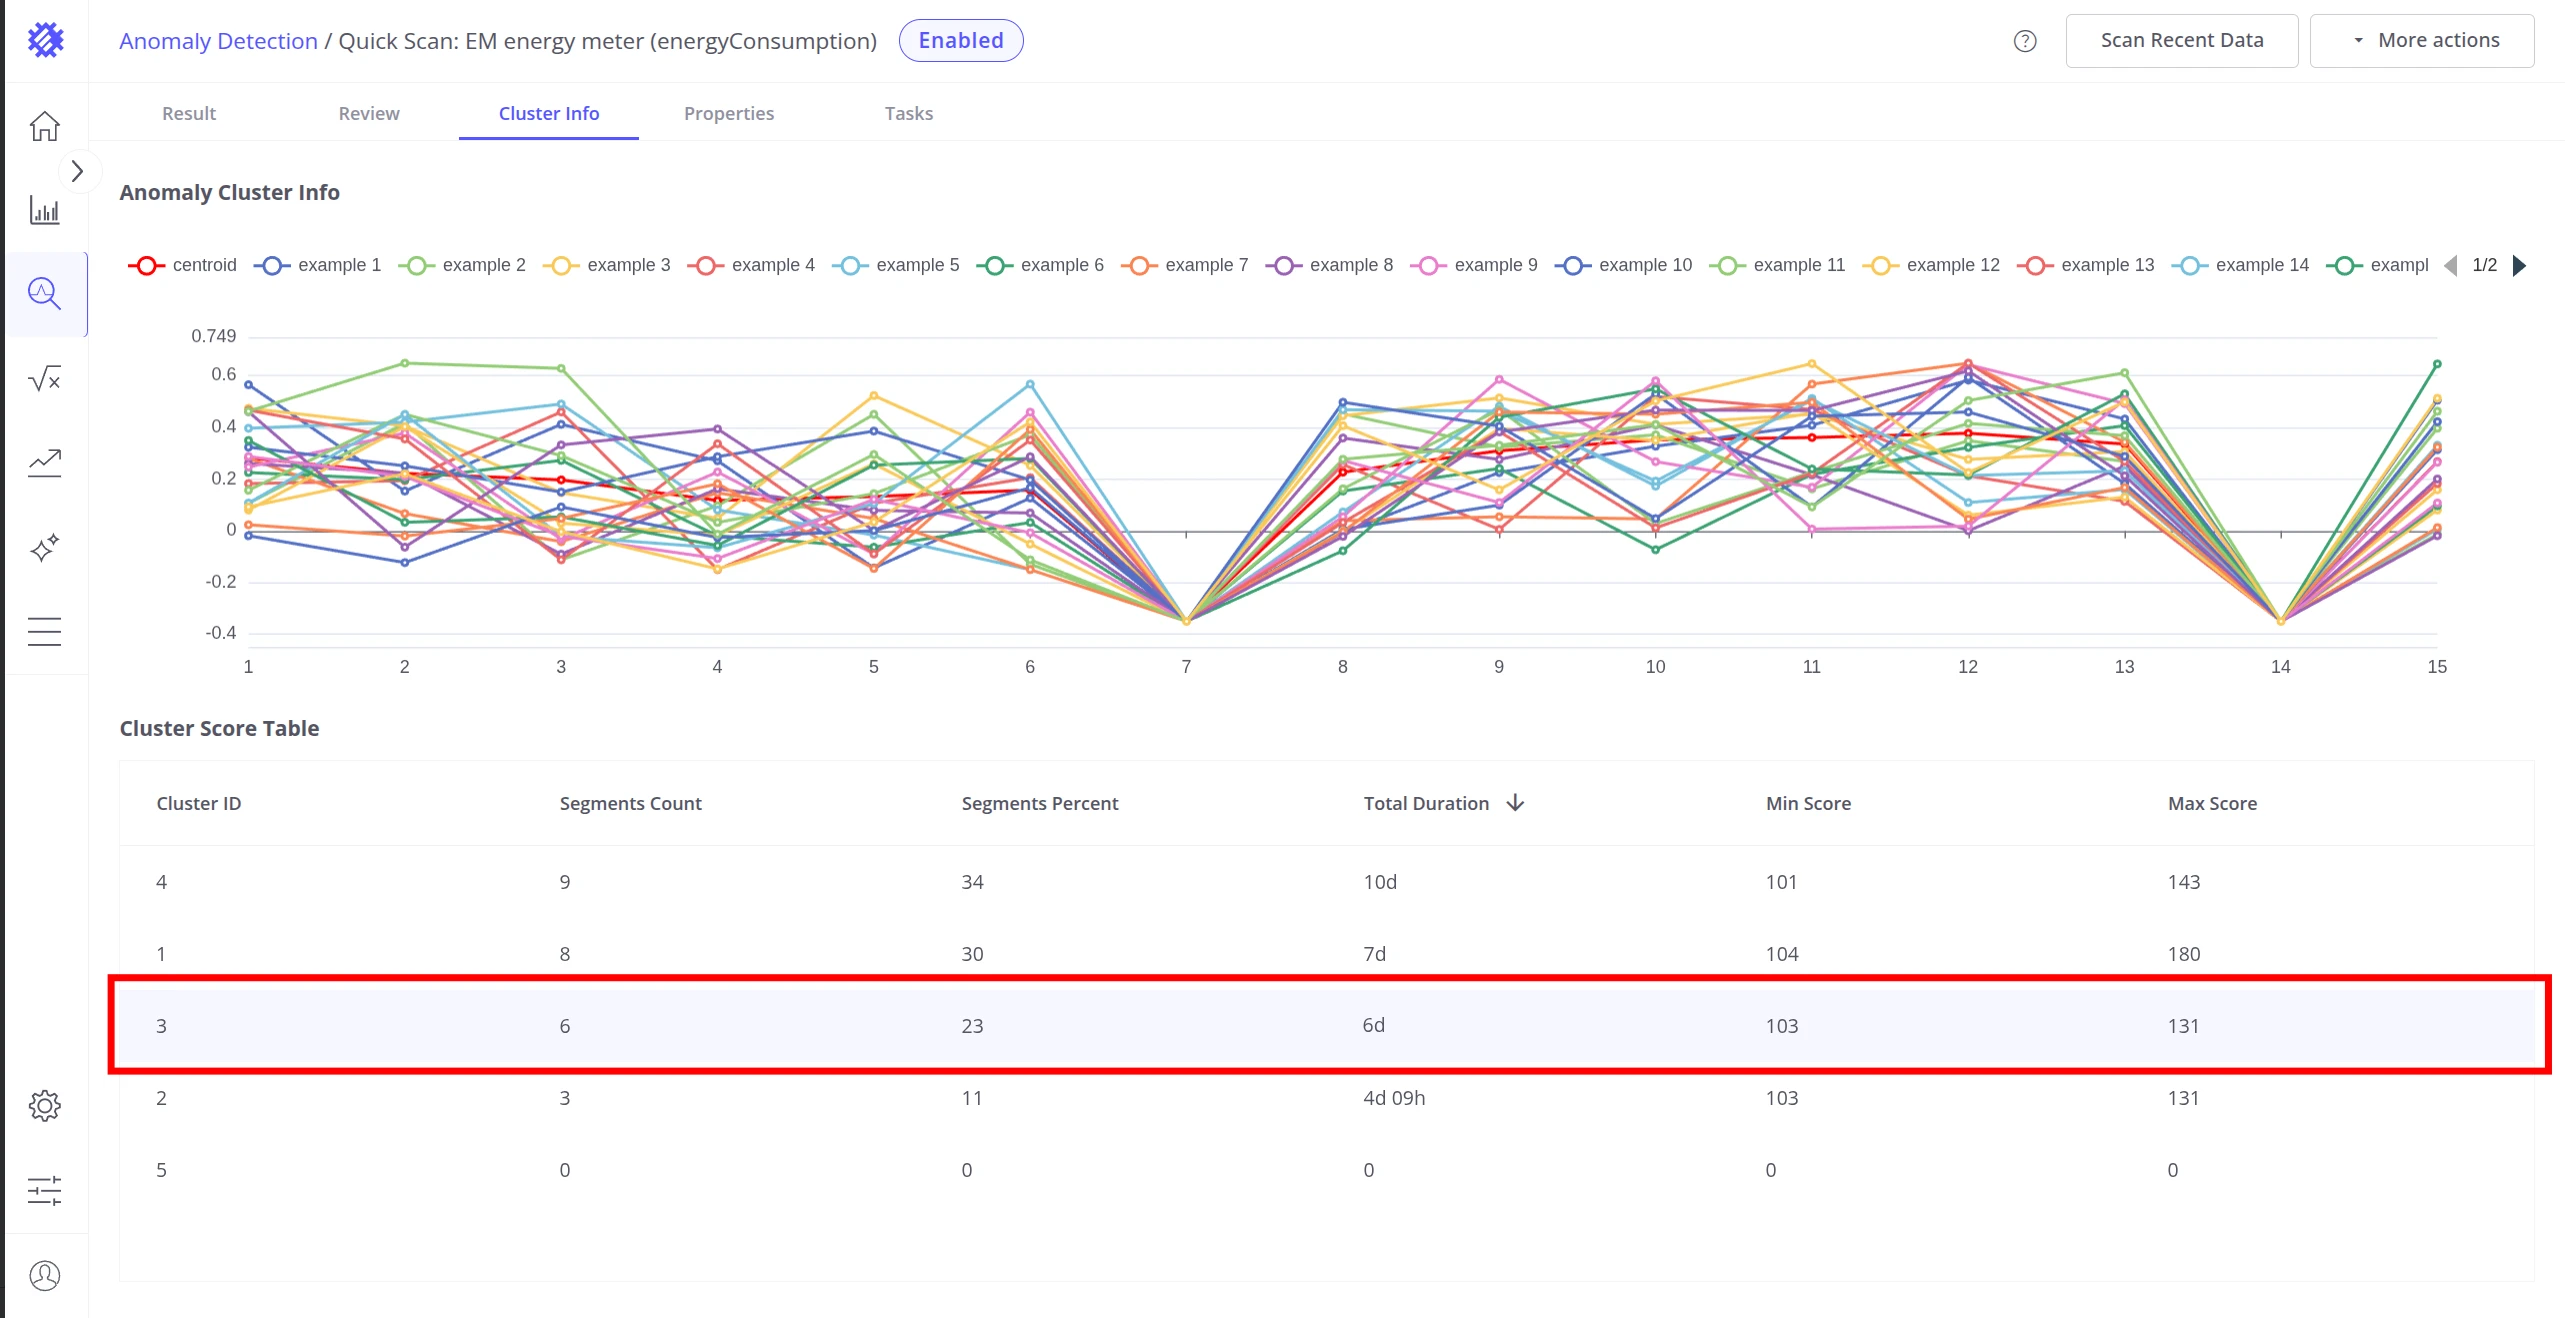
Click any row to see a detailed view of that cluster: its centroid shape alongside 20+ random member segments, plus a score distribution histogram. This is useful for assessing how consistent the cluster is and whether it captures a coherent operating pattern.
Properties Tab
Section titled “Properties Tab”The Properties tab contains the full model configuration — general settings, clustering algorithm, segmentation parameters, anomaly detection thresholds, limits, and alarm configuration.
Use the Properties tab to review current settings, rename the model, or modify parameters and rebuild.
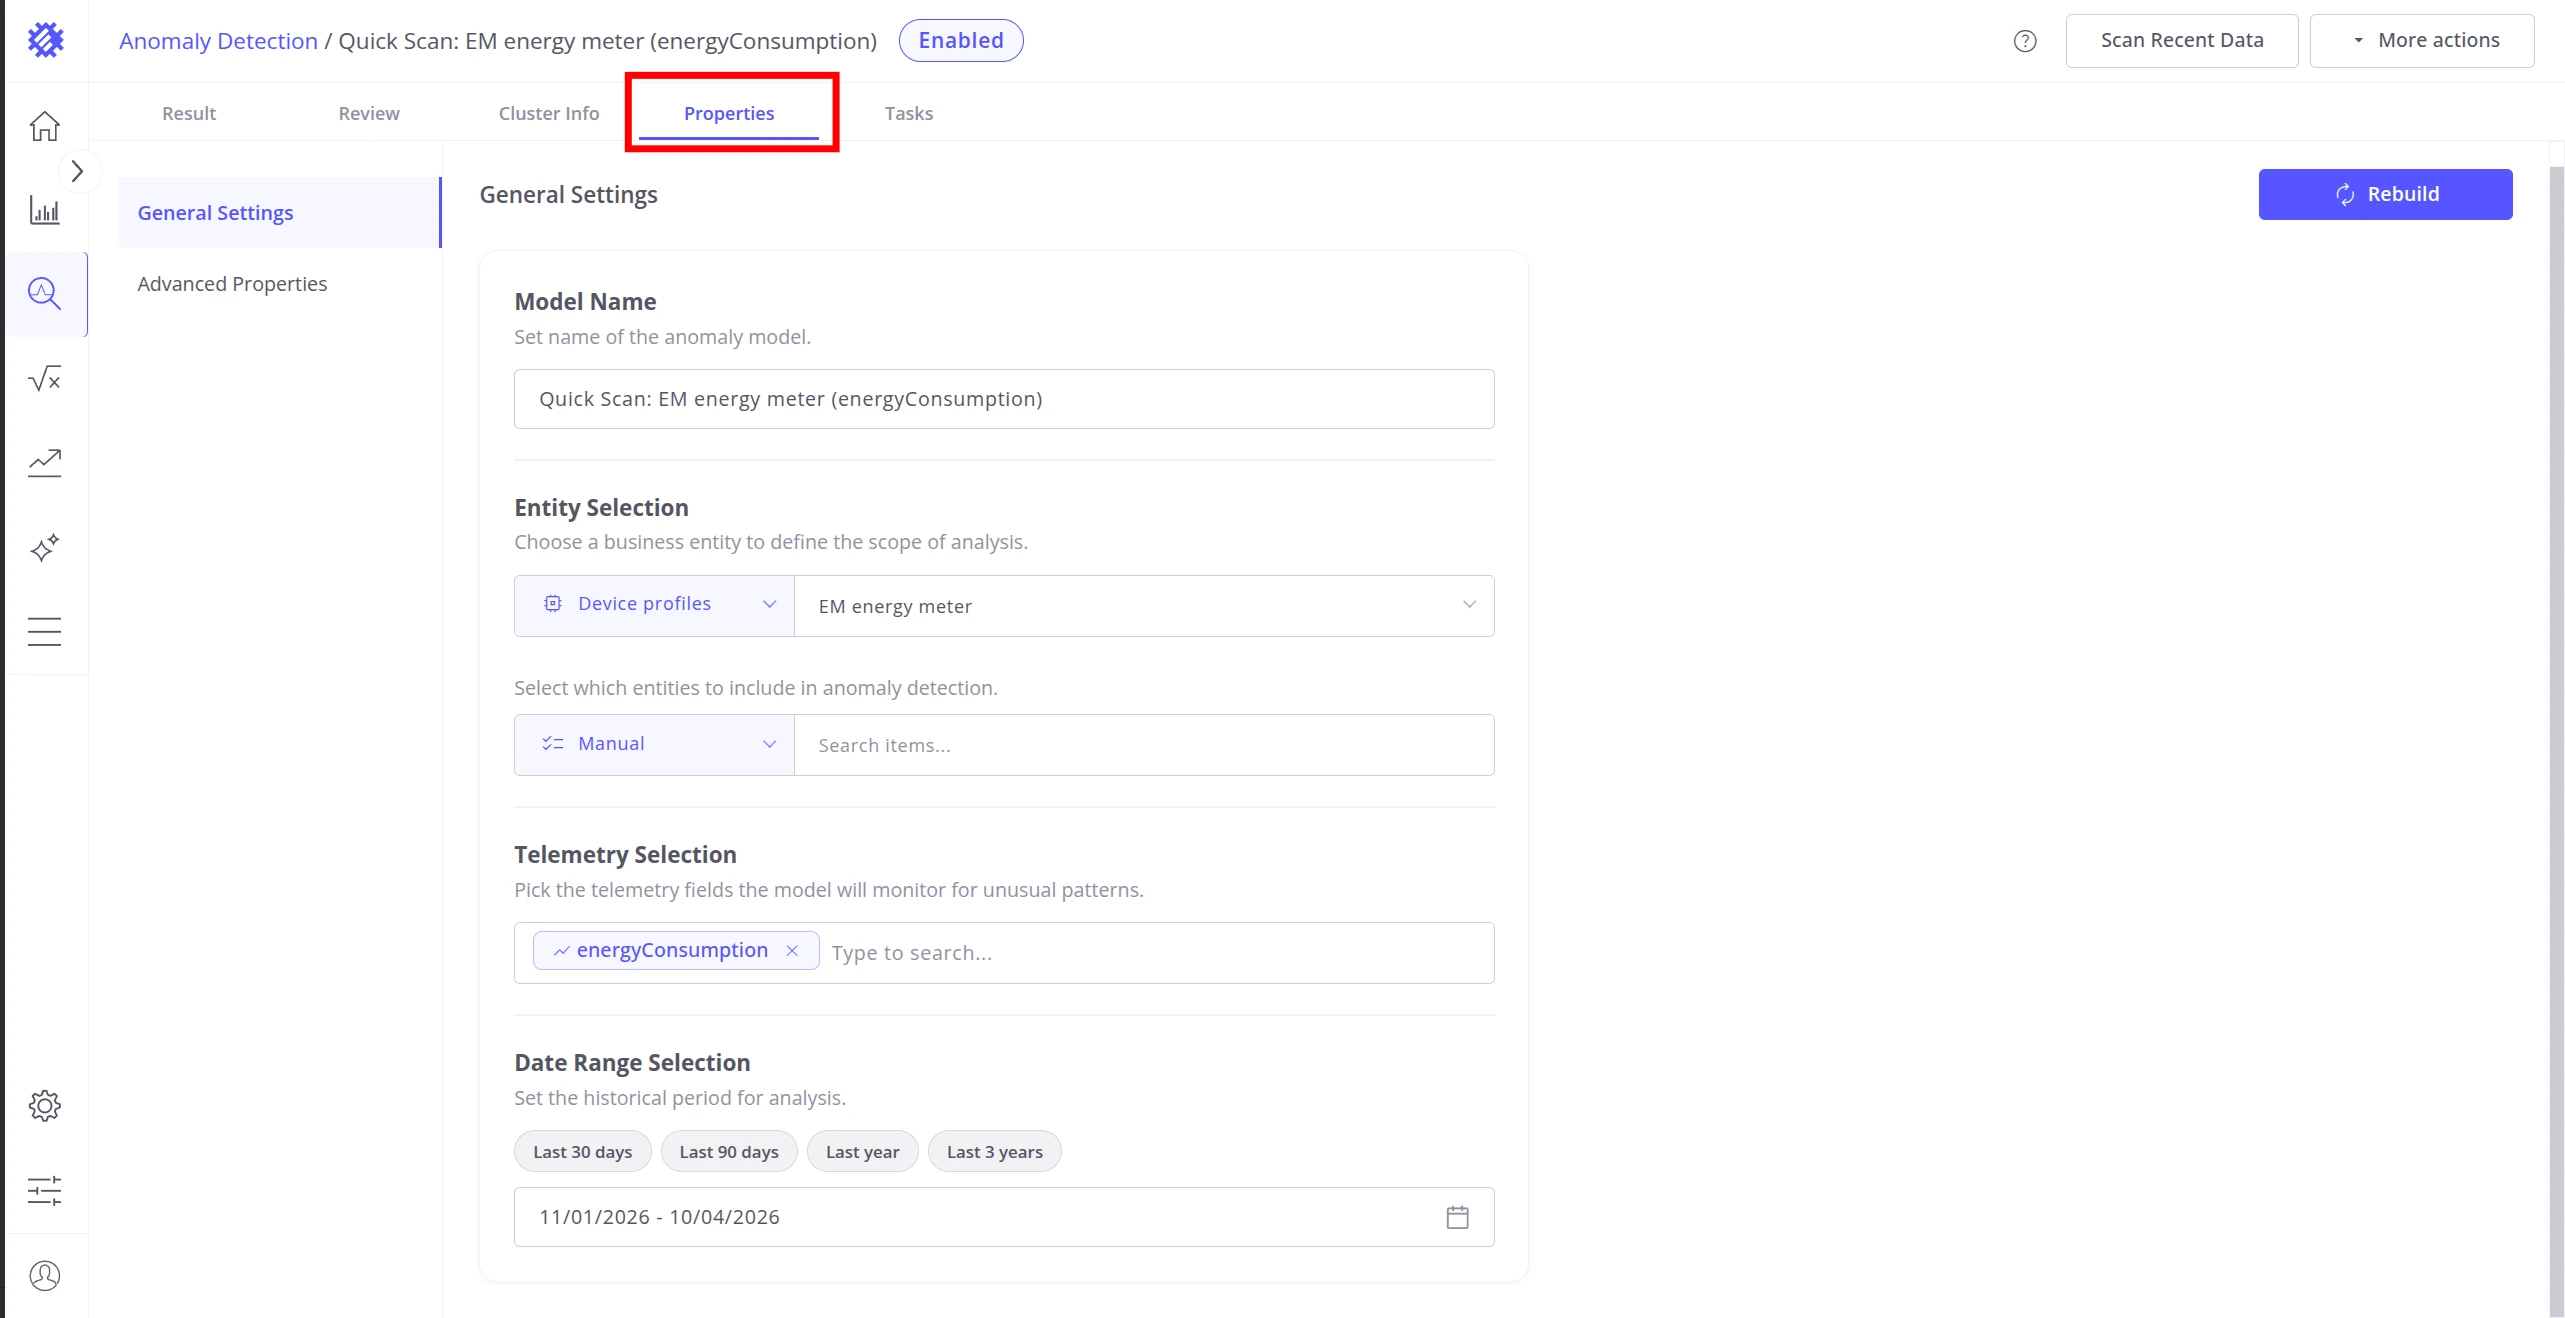
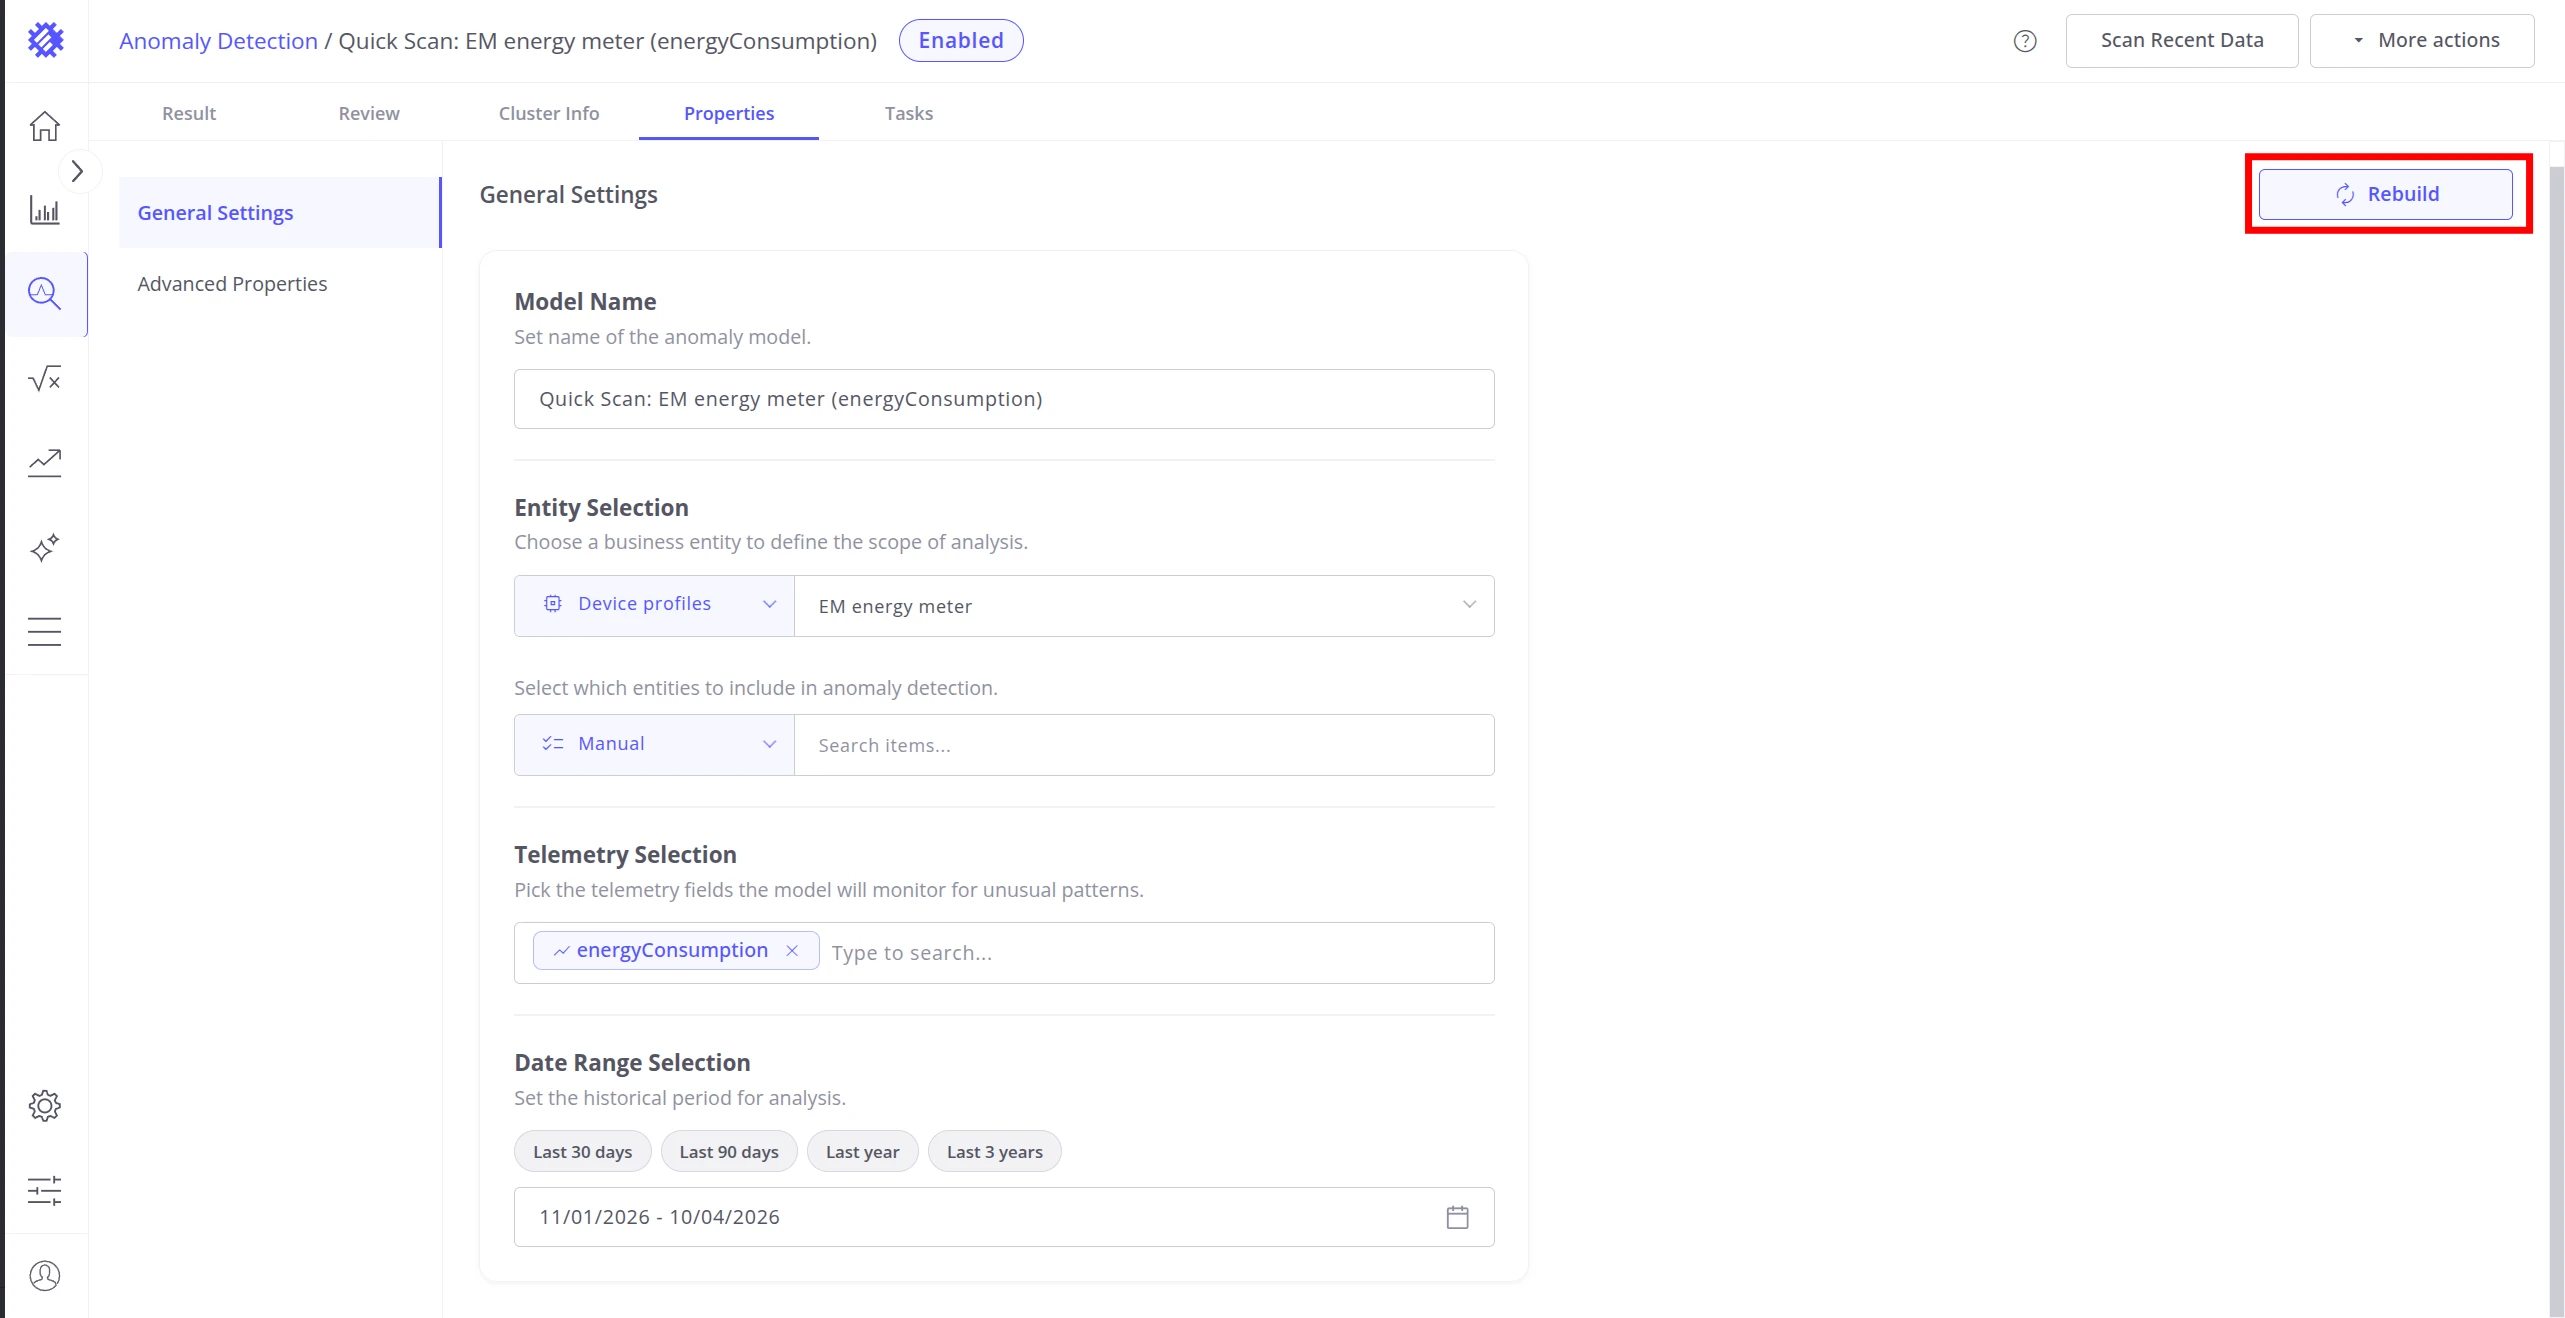
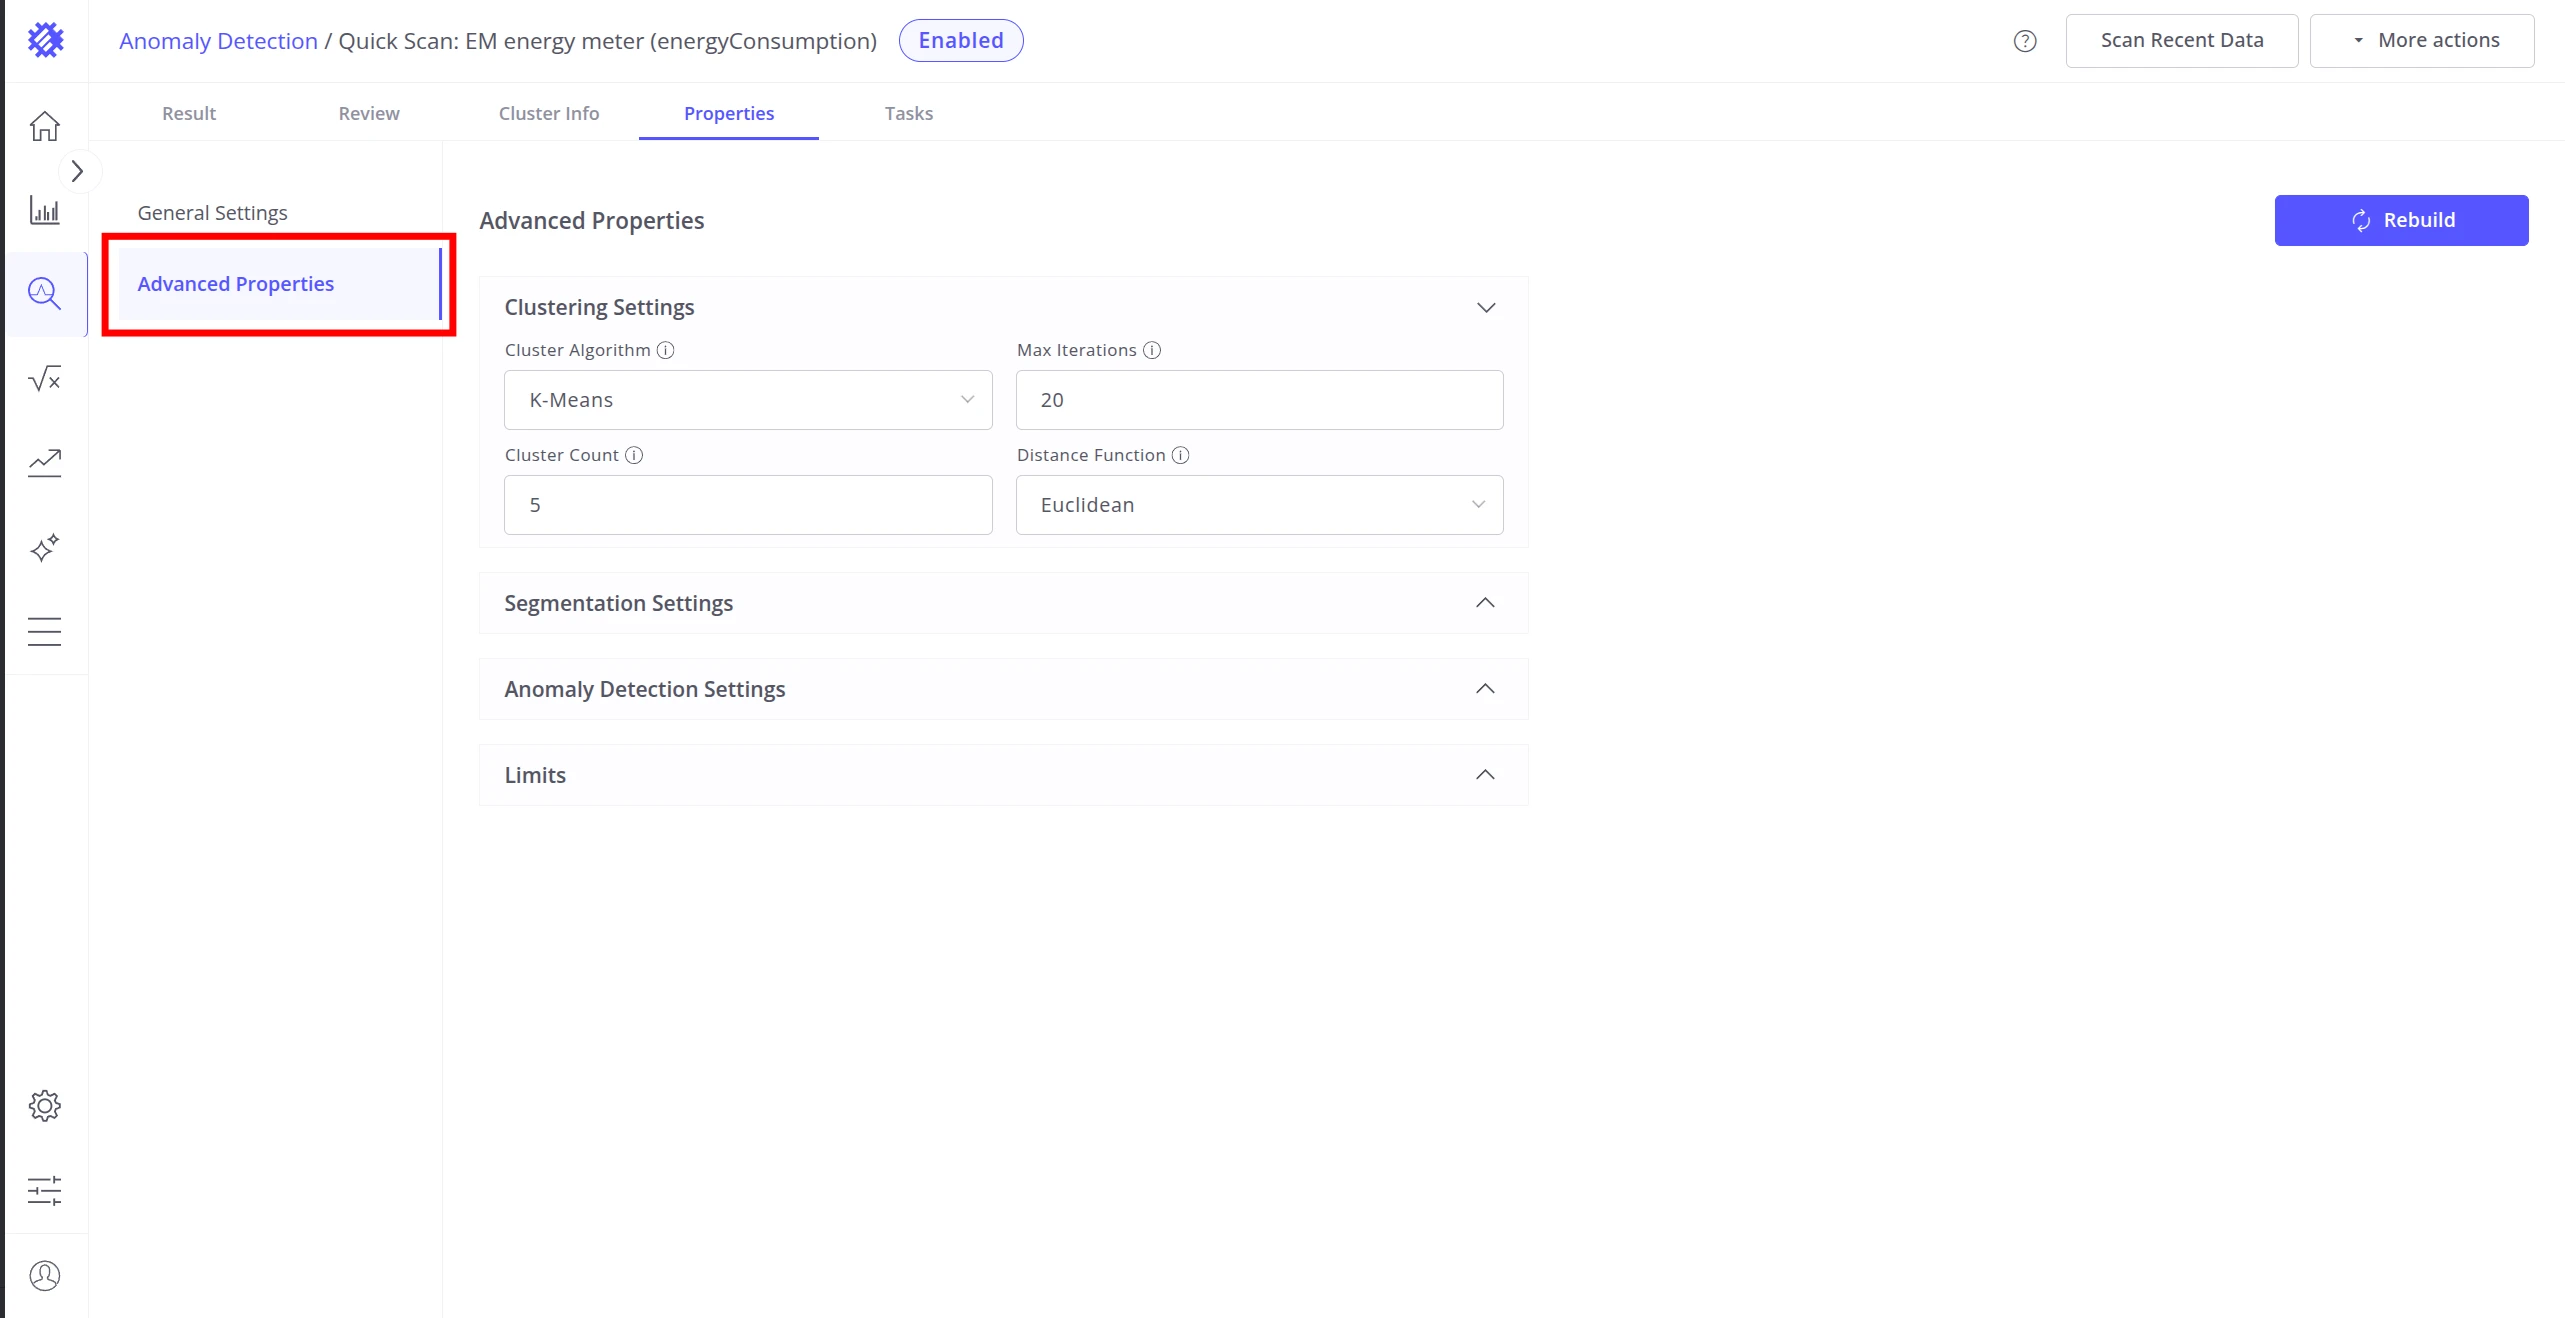
See Anomaly Model Properties for a complete reference of all available settings.
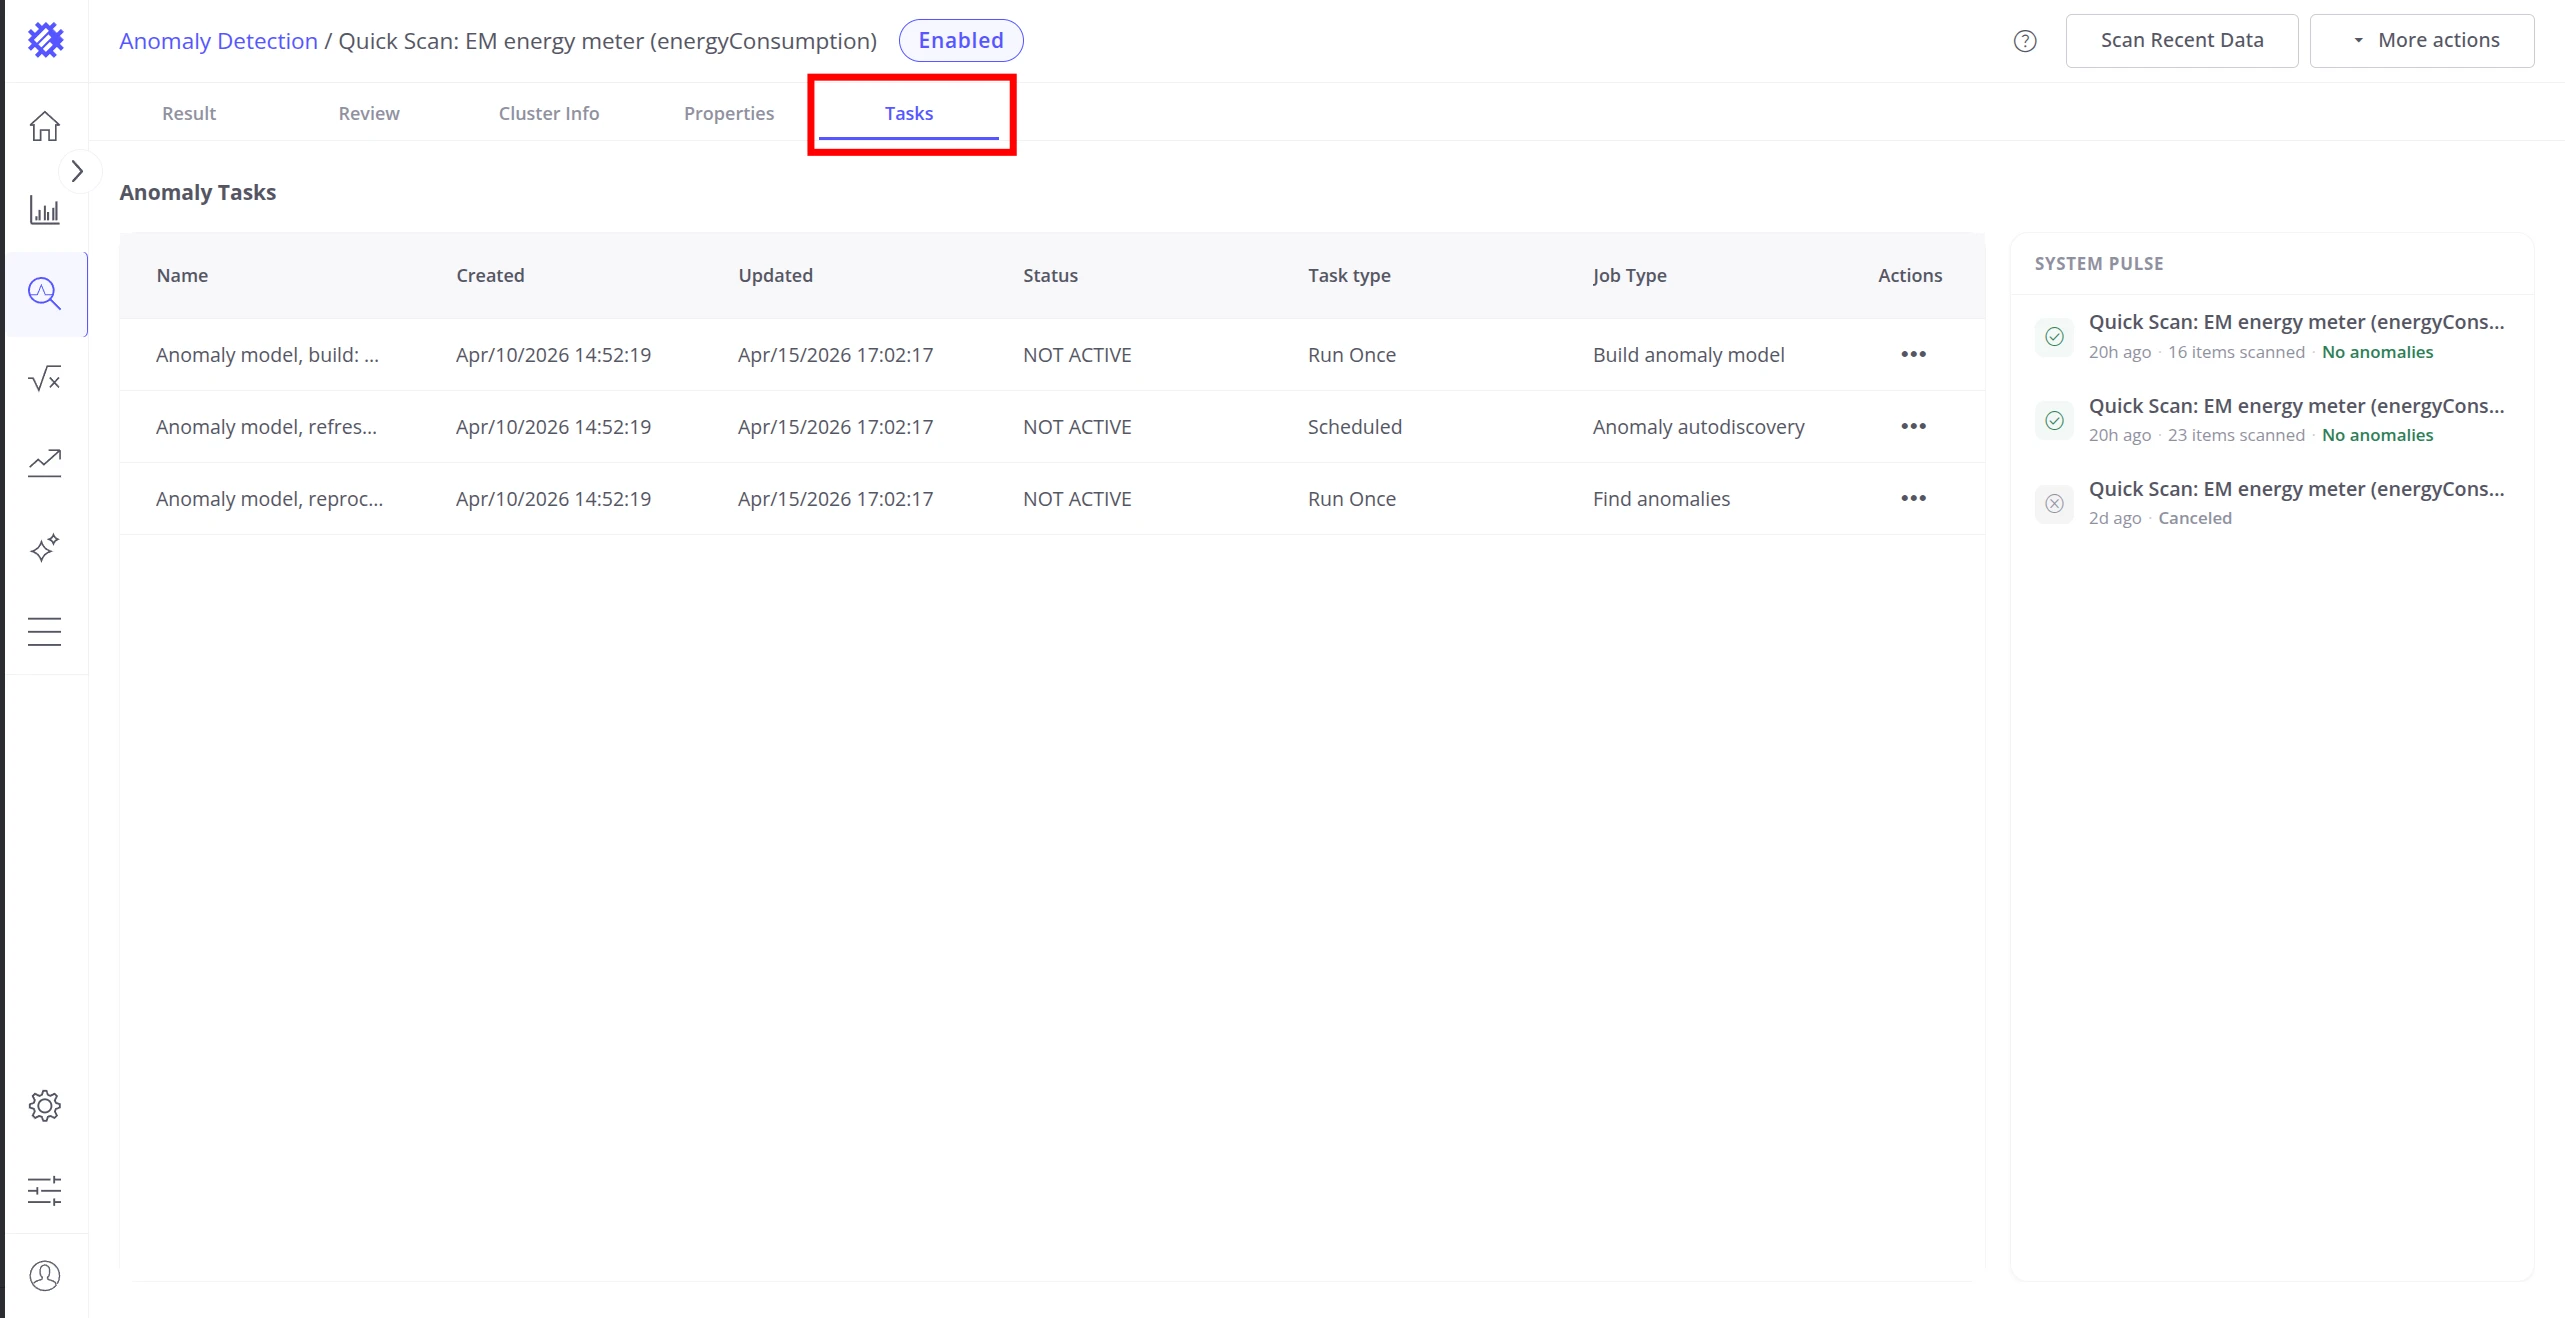
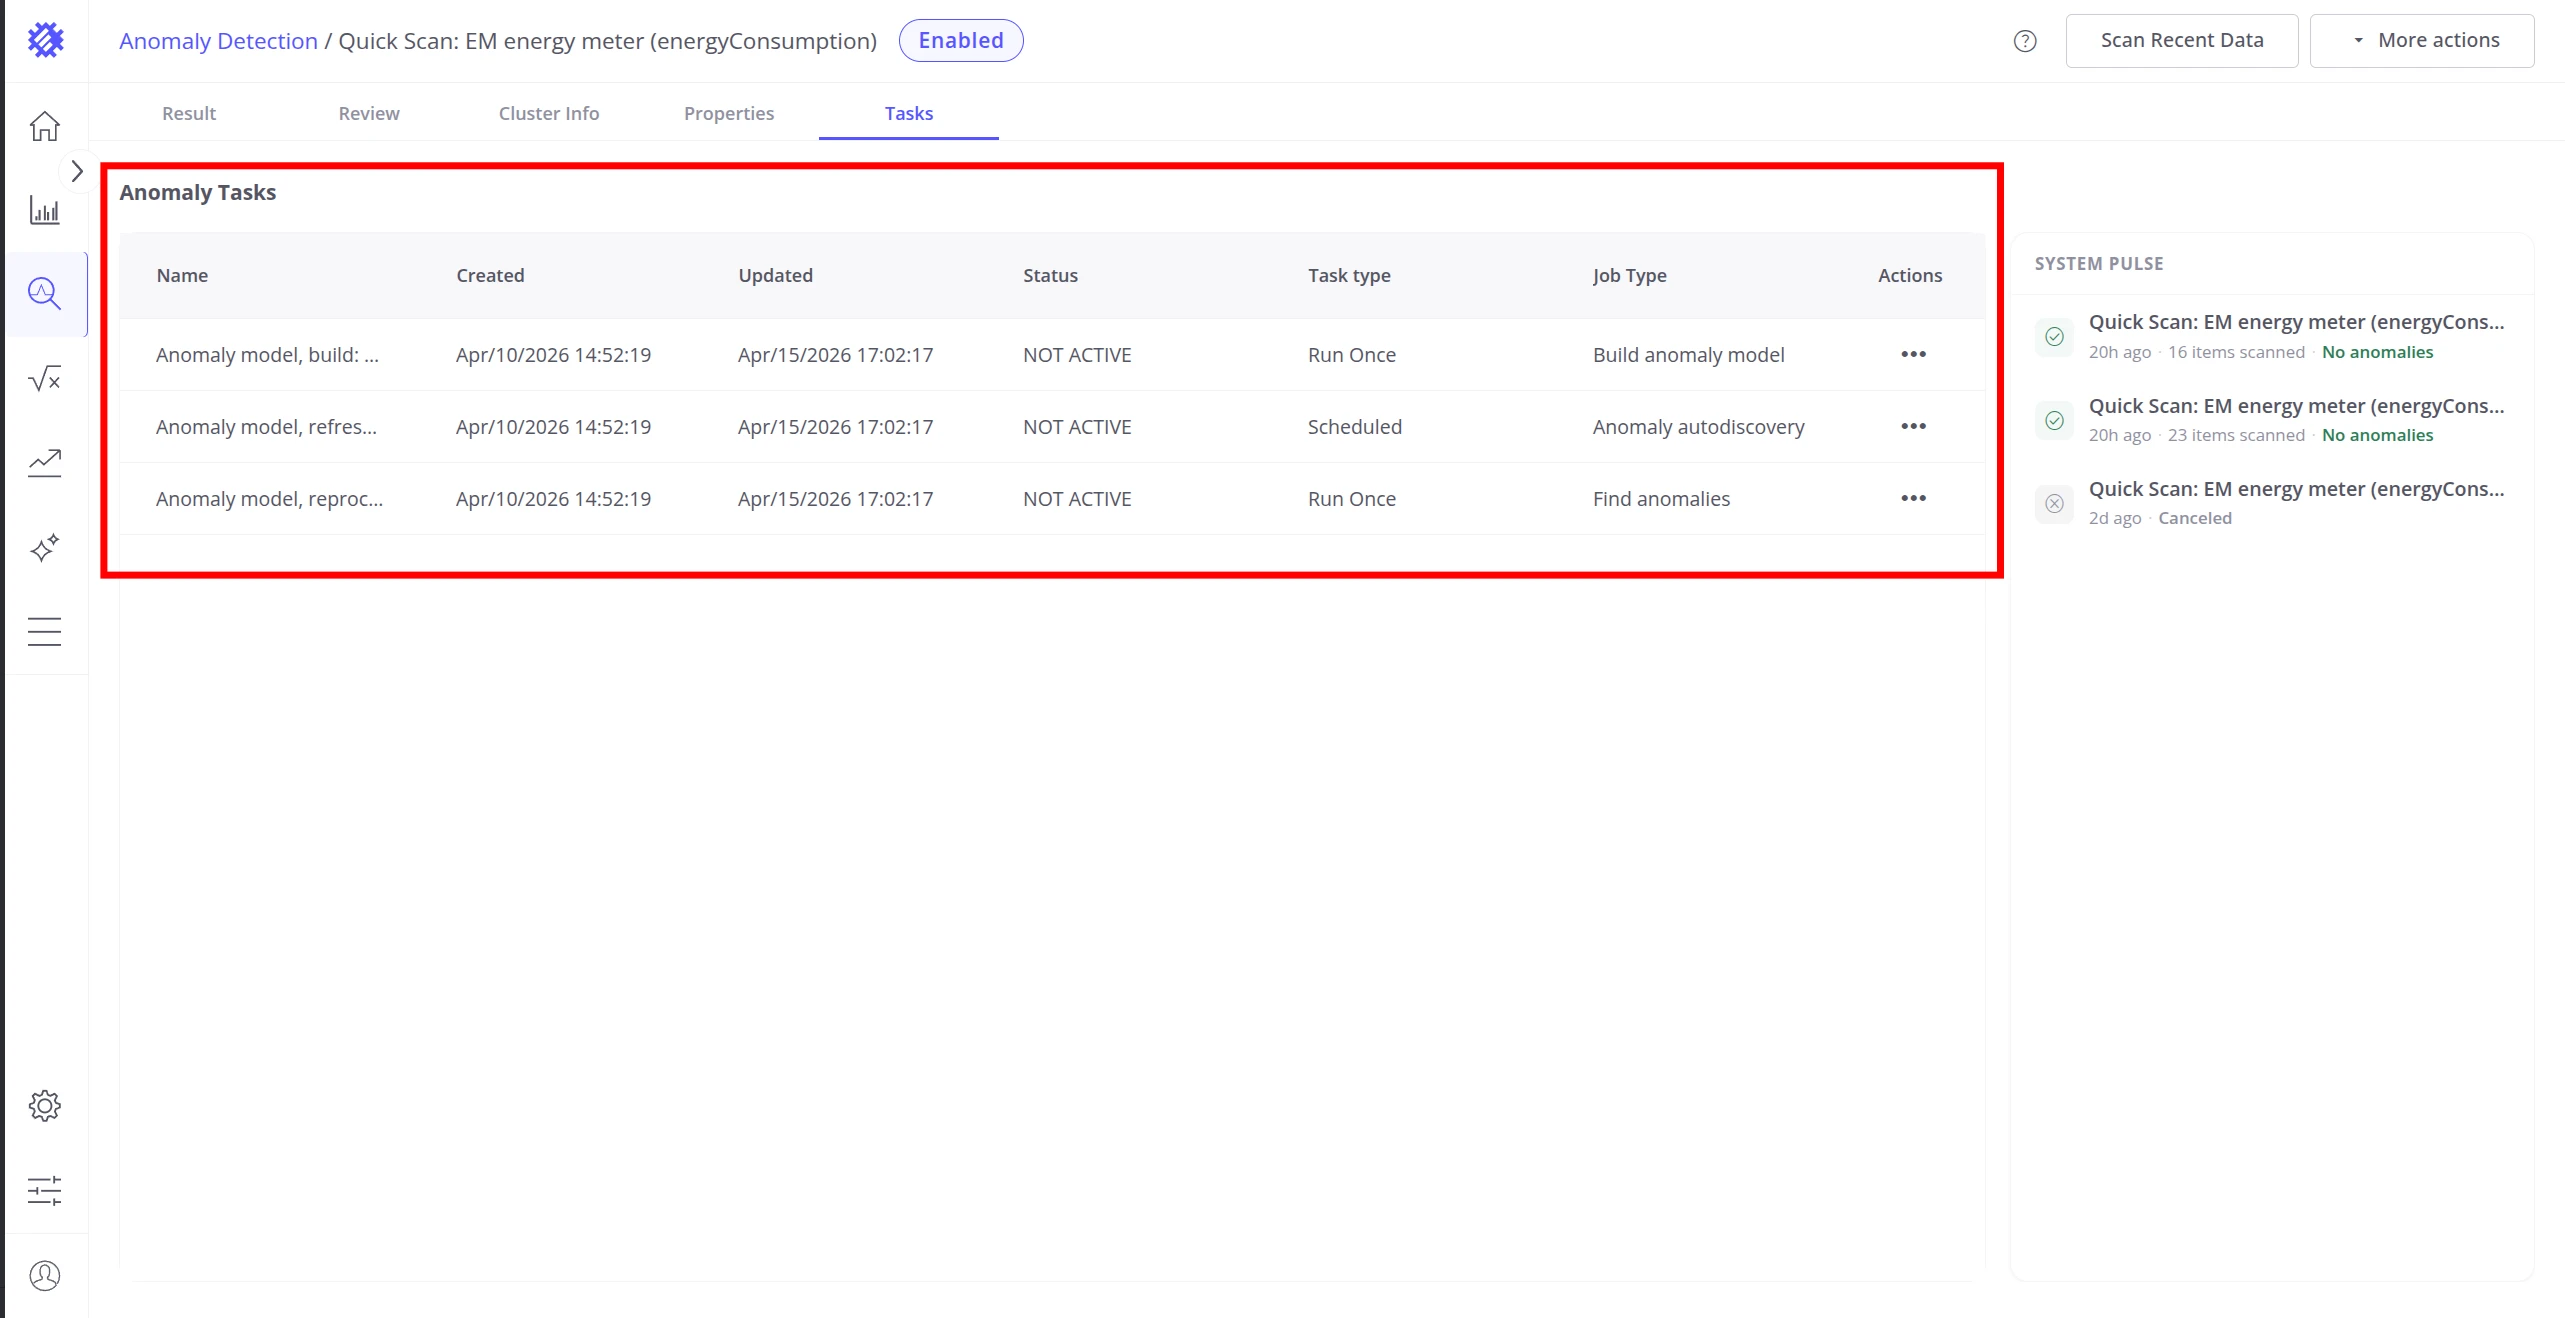
Tasks Tab
Section titled “Tasks Tab”The Tasks tab provides visibility into the execution history of all background operations associated with this model. See Task Service for full details on managing background tasks in Trendz.
Anomaly Tasks
Section titled “Anomaly Tasks”Three task types run against an anomaly model:
| Job Type | Task type | Description |
|---|---|---|
| Build anomaly model | Run Once | Initial training run that produces clusters and baseline anomaly scores. Triggered on model creation or save. |
| Anomaly autodiscovery | Scheduled | Incremental scan of new telemetry to detect ongoing and new anomalies. Runs automatically at the configured refresh interval. |
| Find anomalies | Run Once | Applies the trained model to a historical date range. Triggered on demand via Reprocess. |
Each row shows the task name, creation time, last updated time, status, task type, and job type.
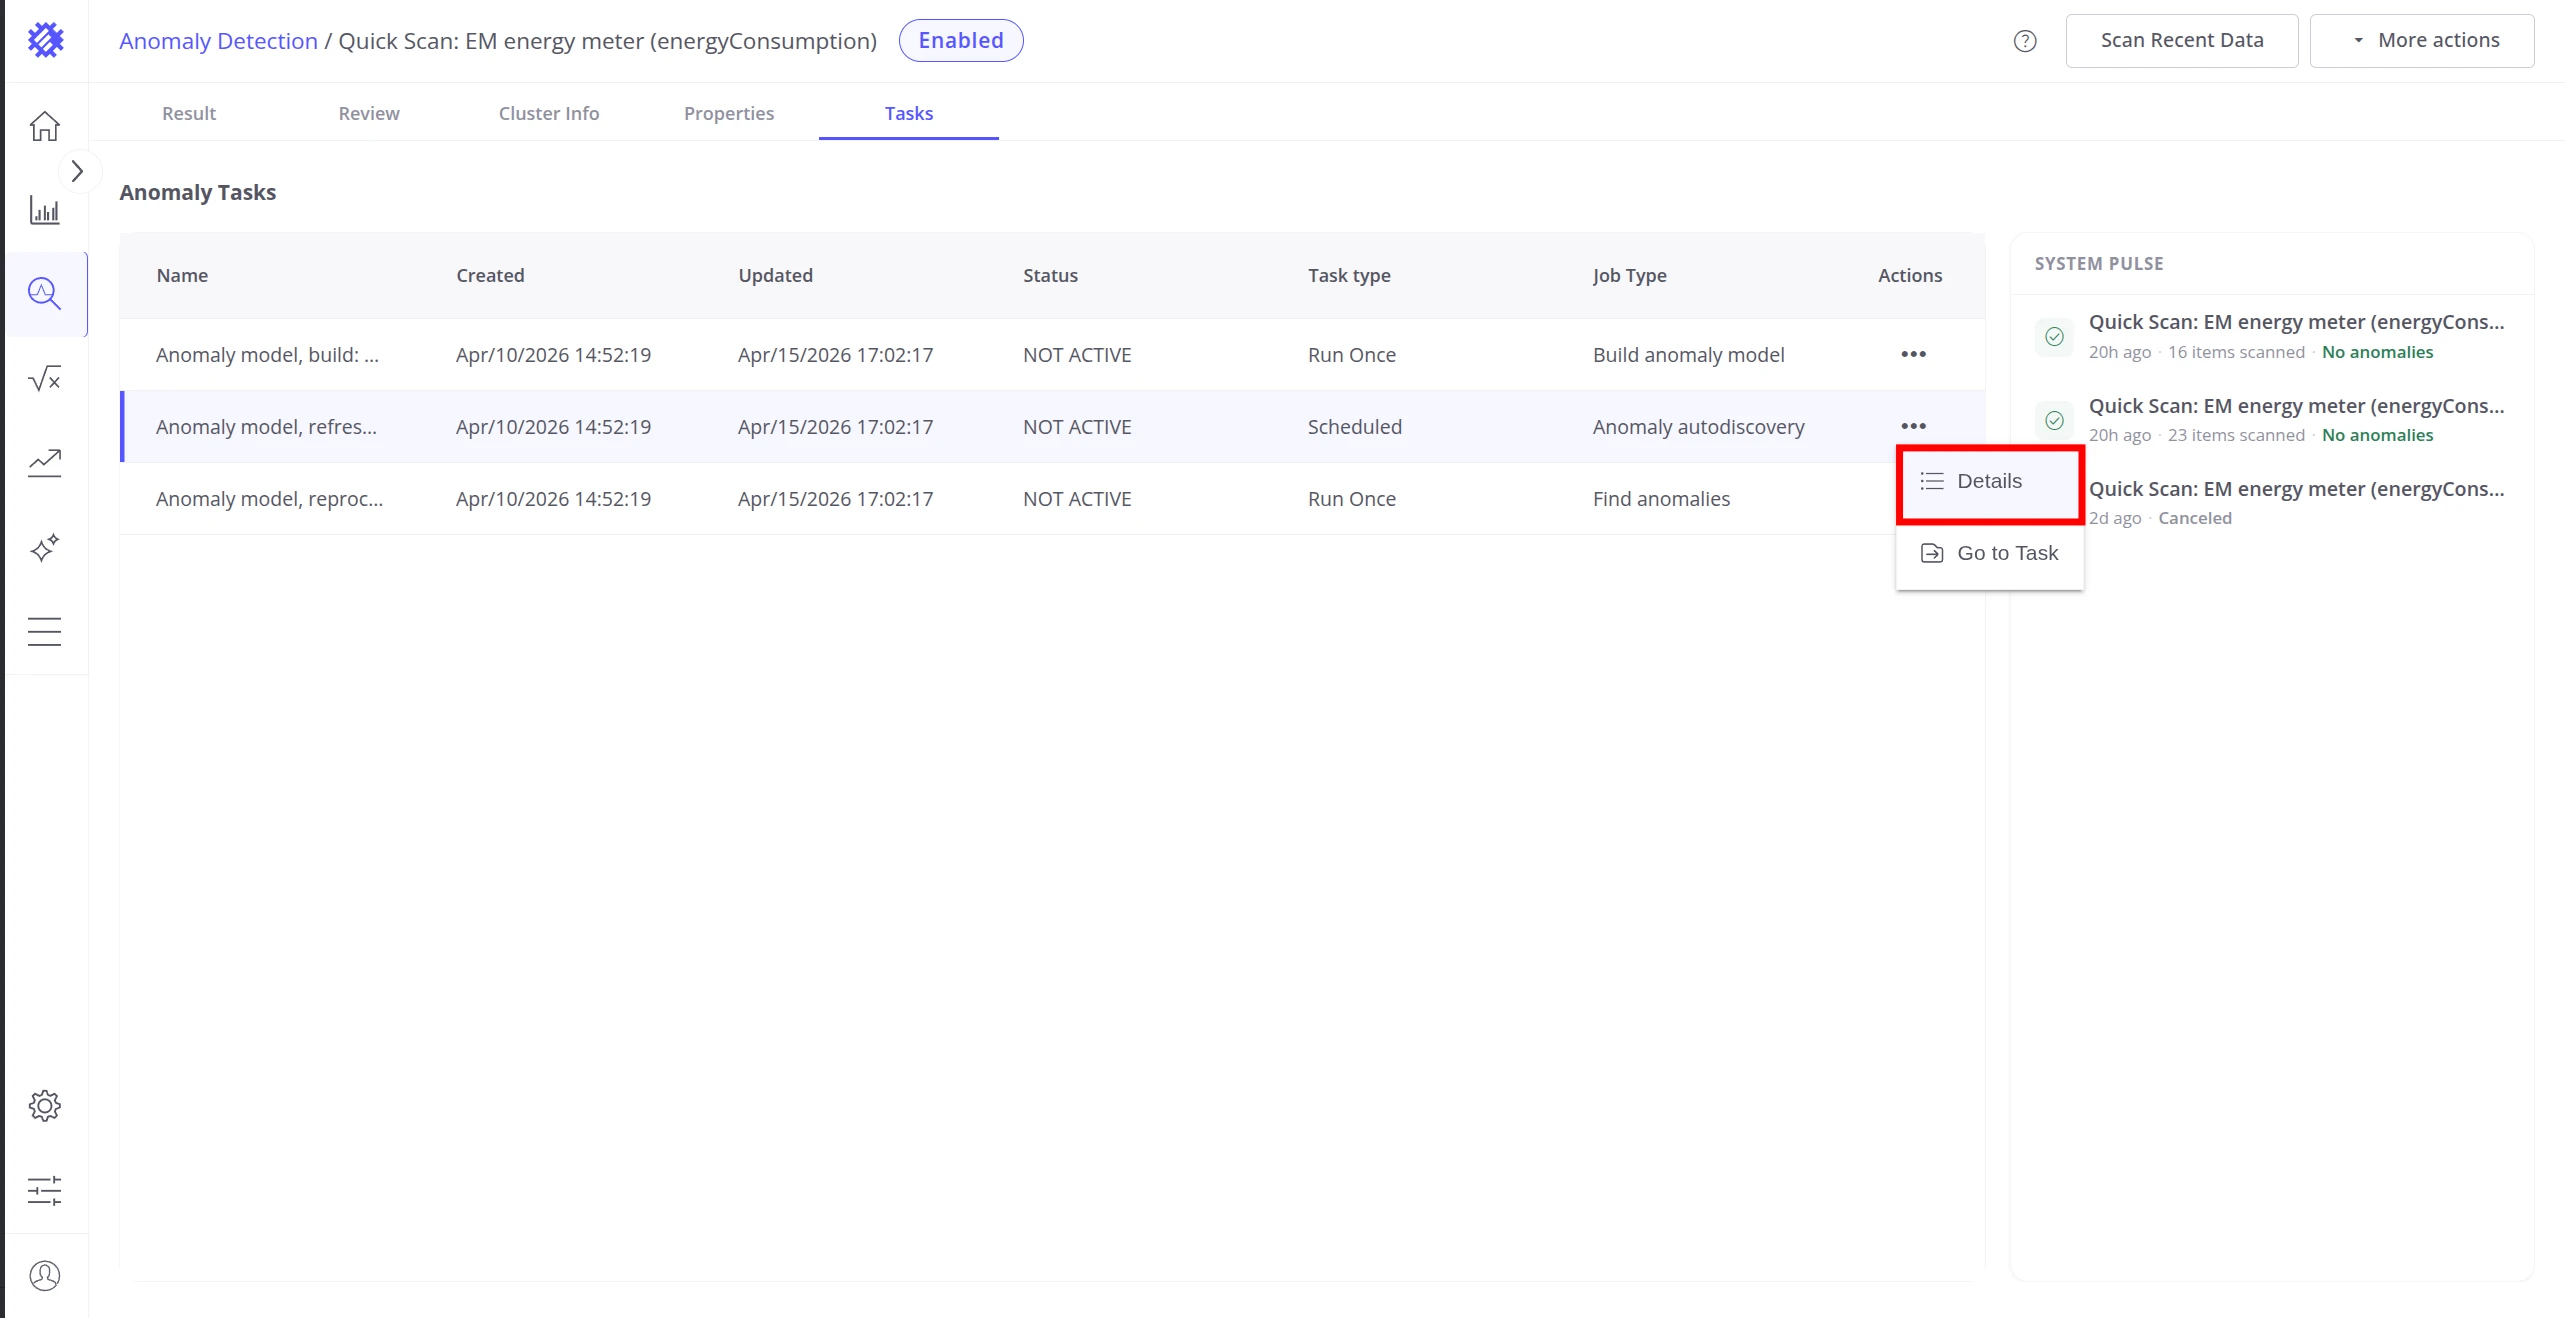
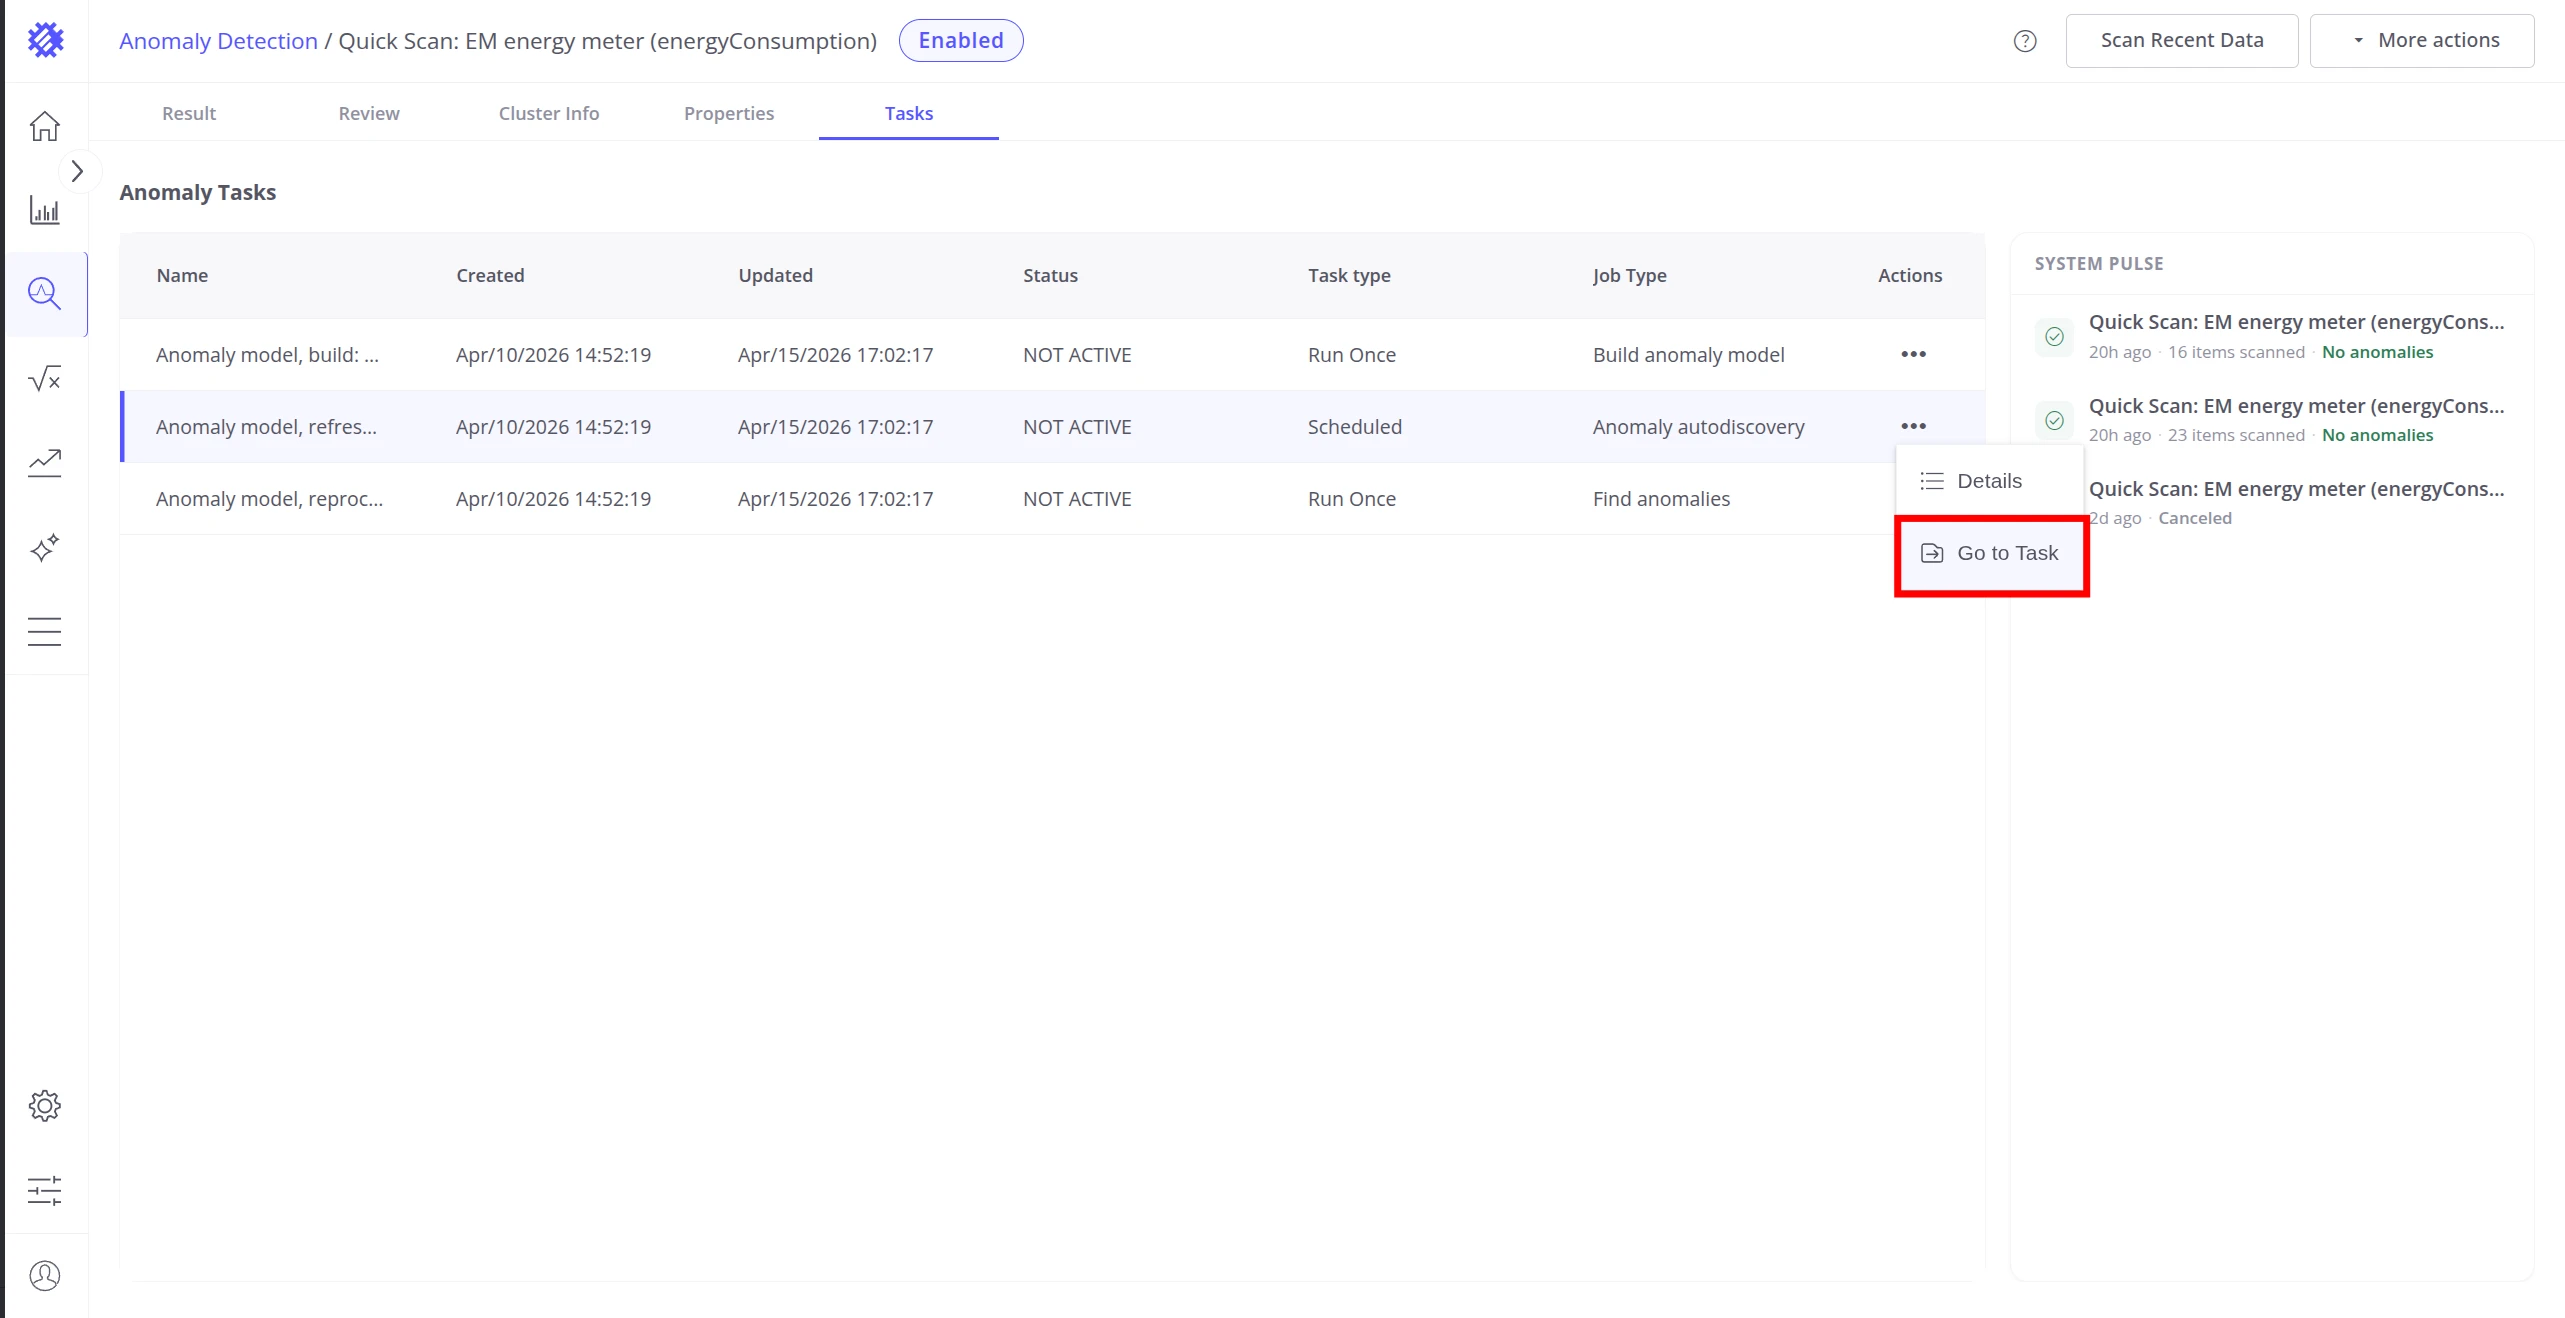
Click ⋯ on any row to open the row action menu.
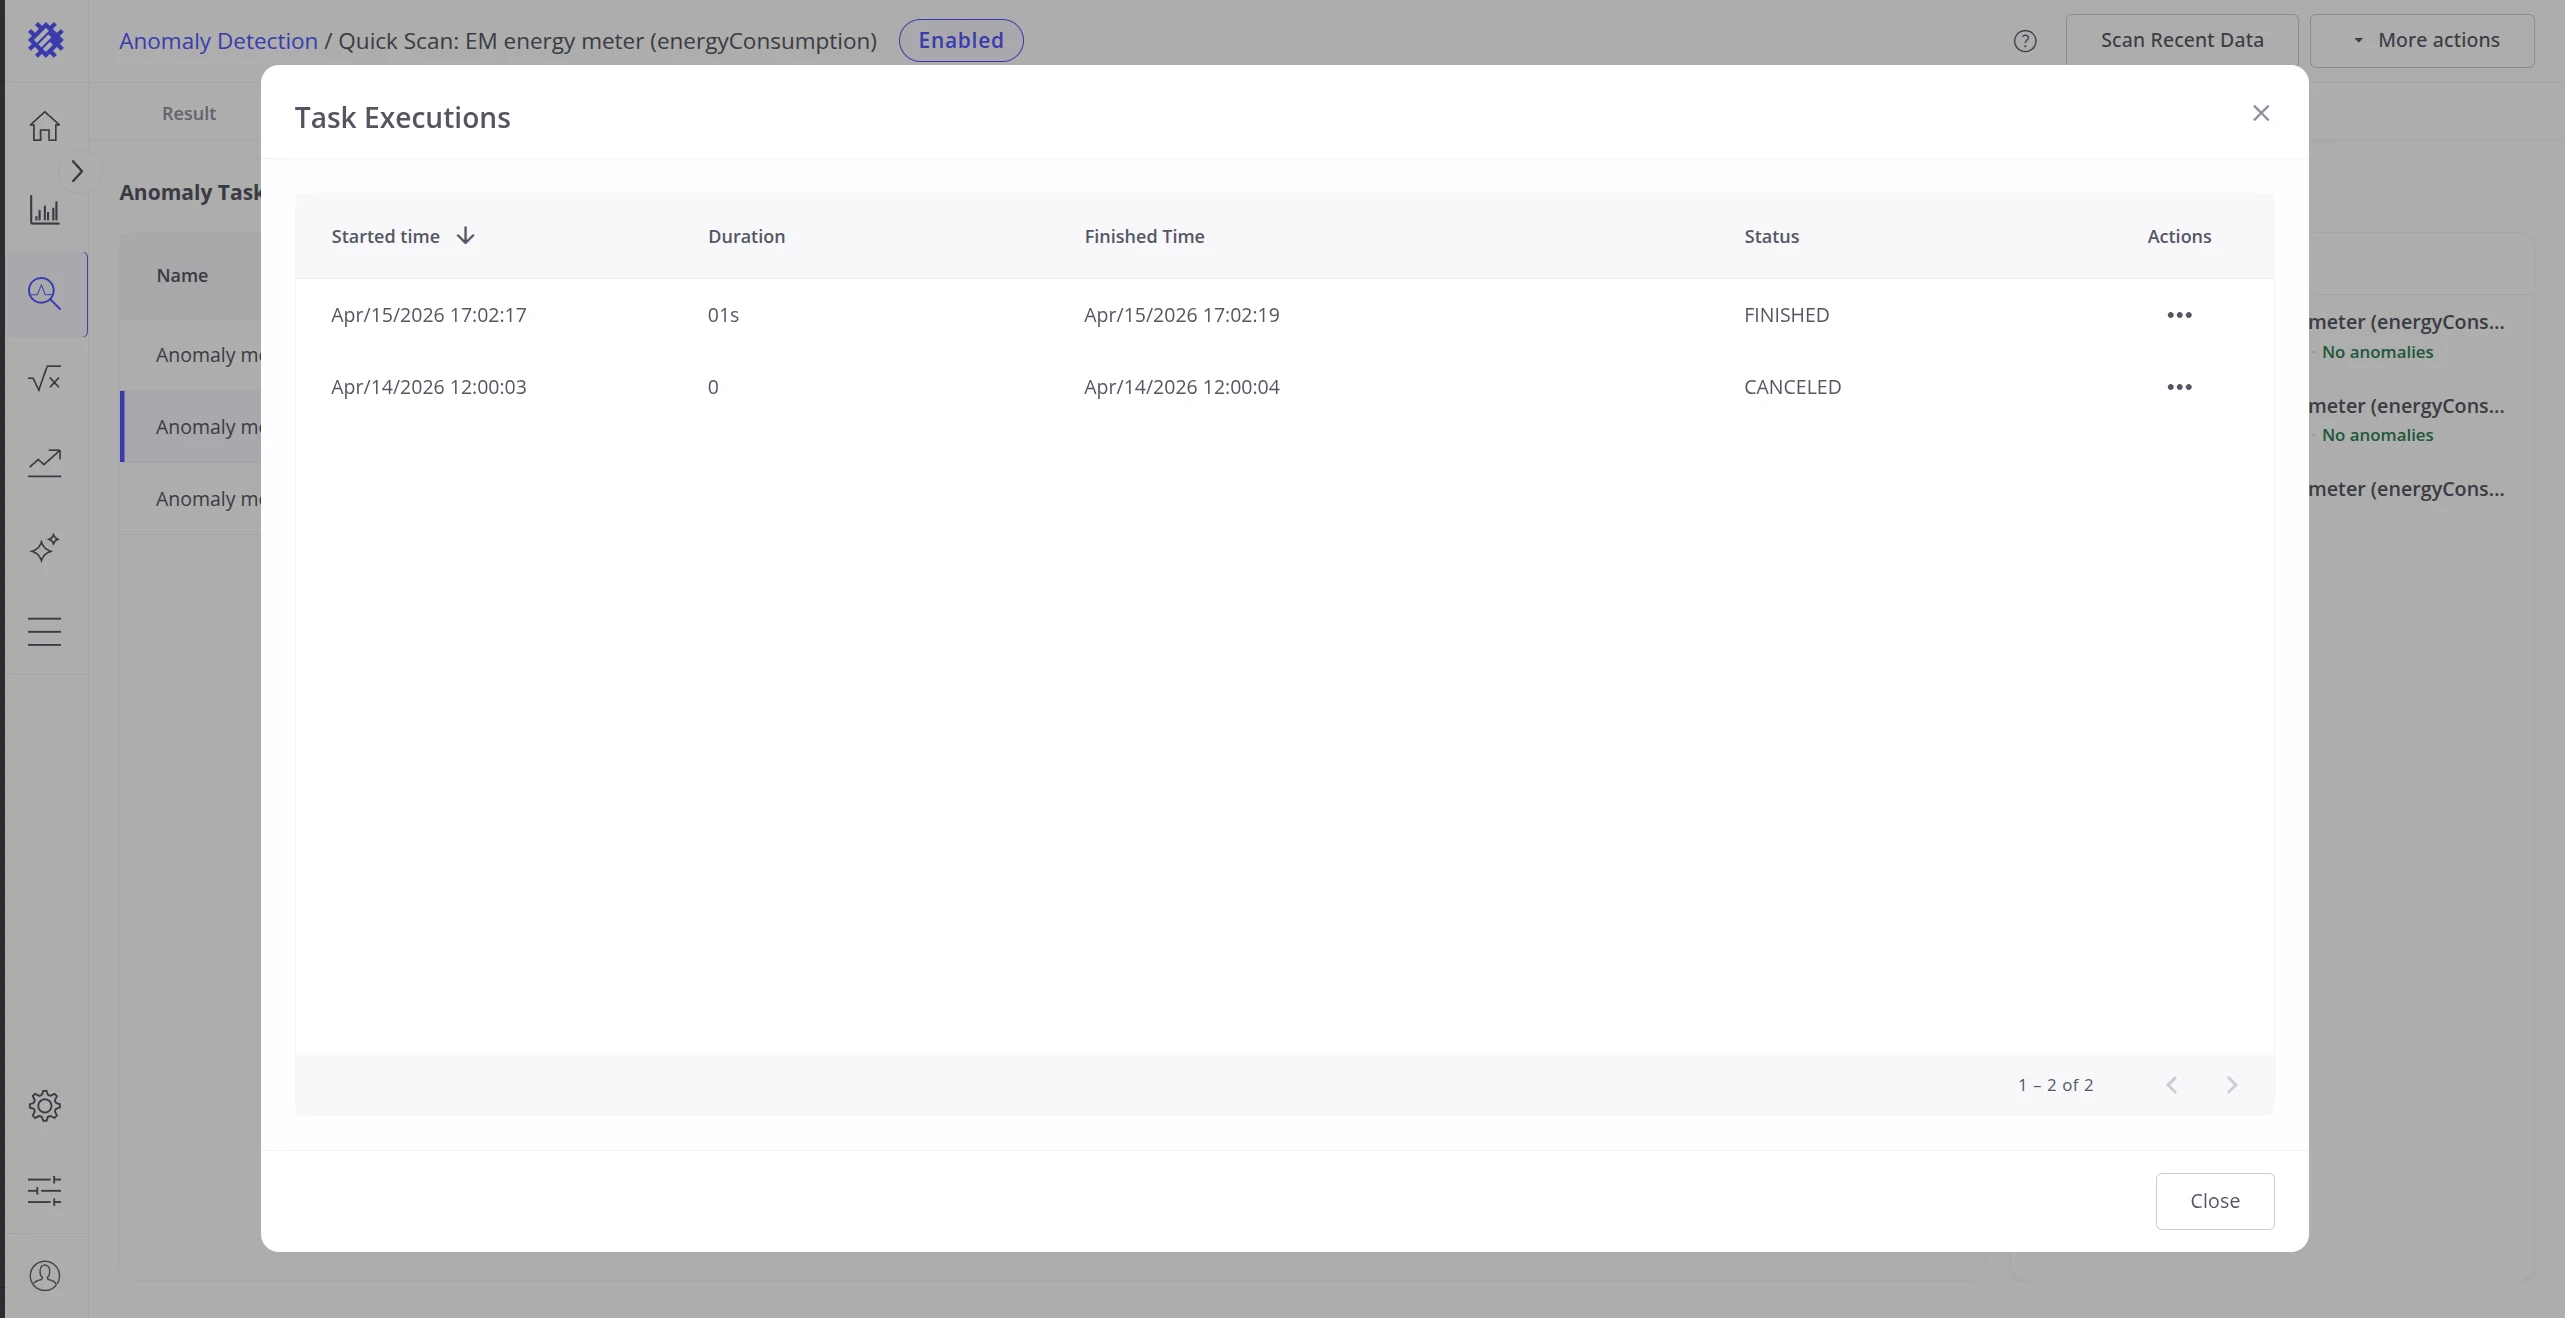
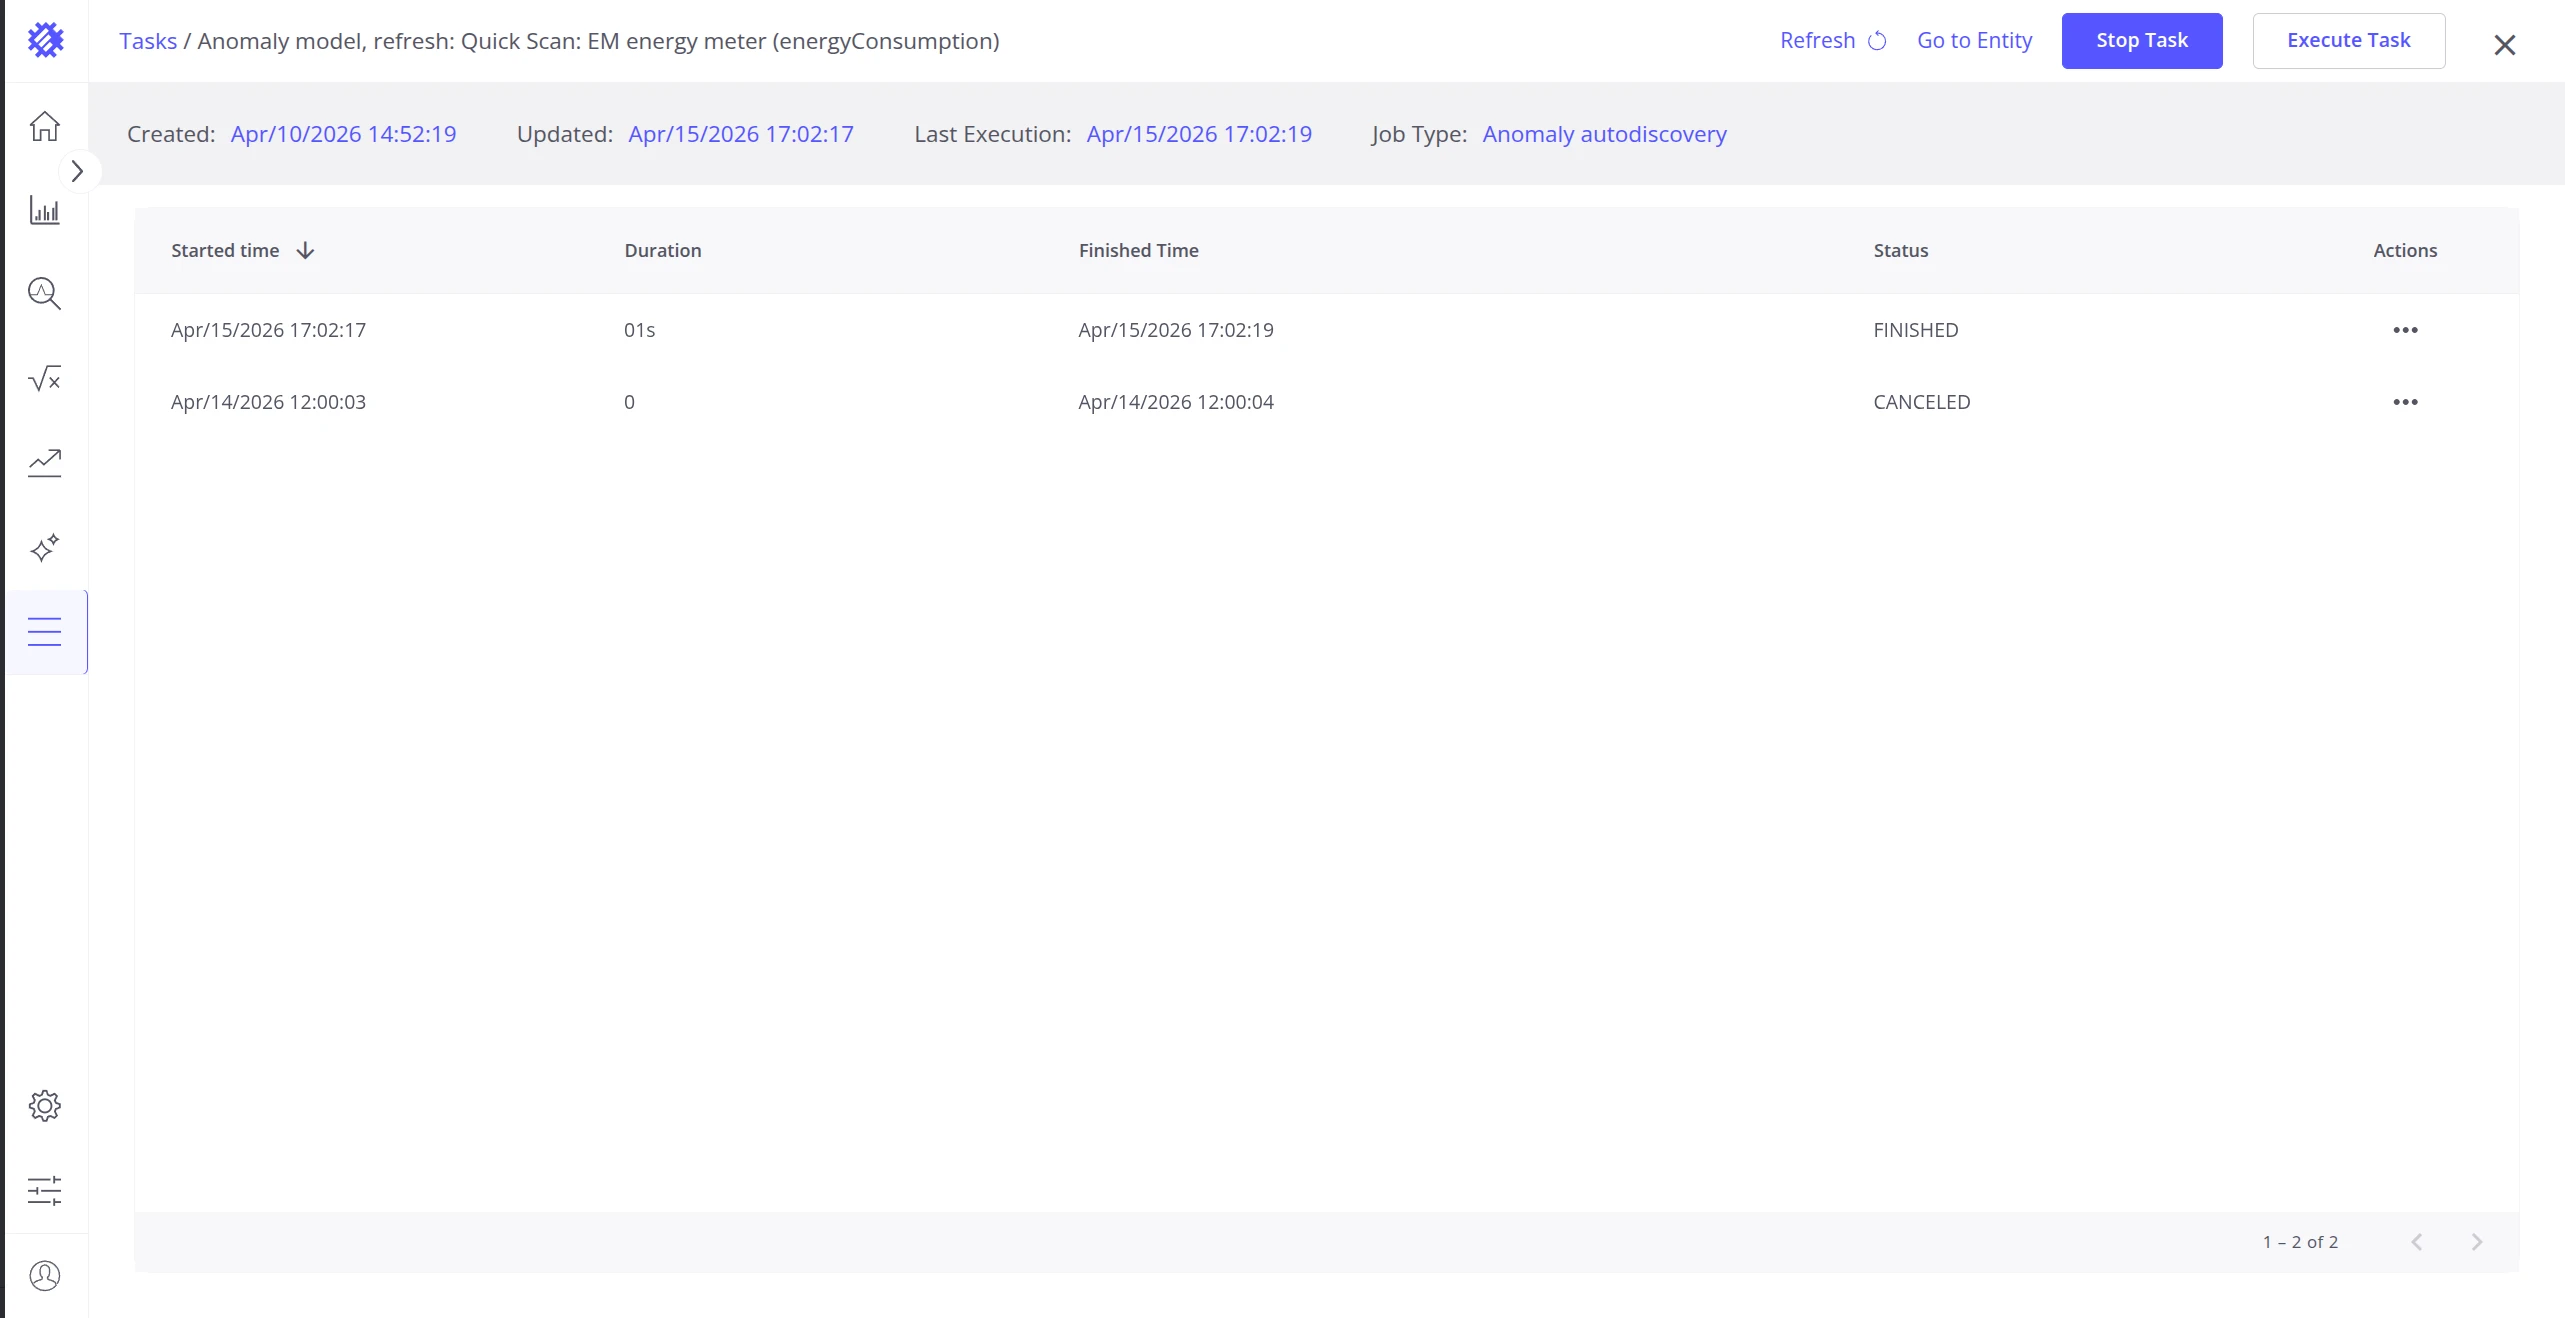
Details opens the Task Executions dialog showing the full run history for that task — each execution with its start time, duration, finish time, and status.
Go to Task navigates to the standalone task detail page, showing full task metadata and the complete execution history outside the anomaly model context.
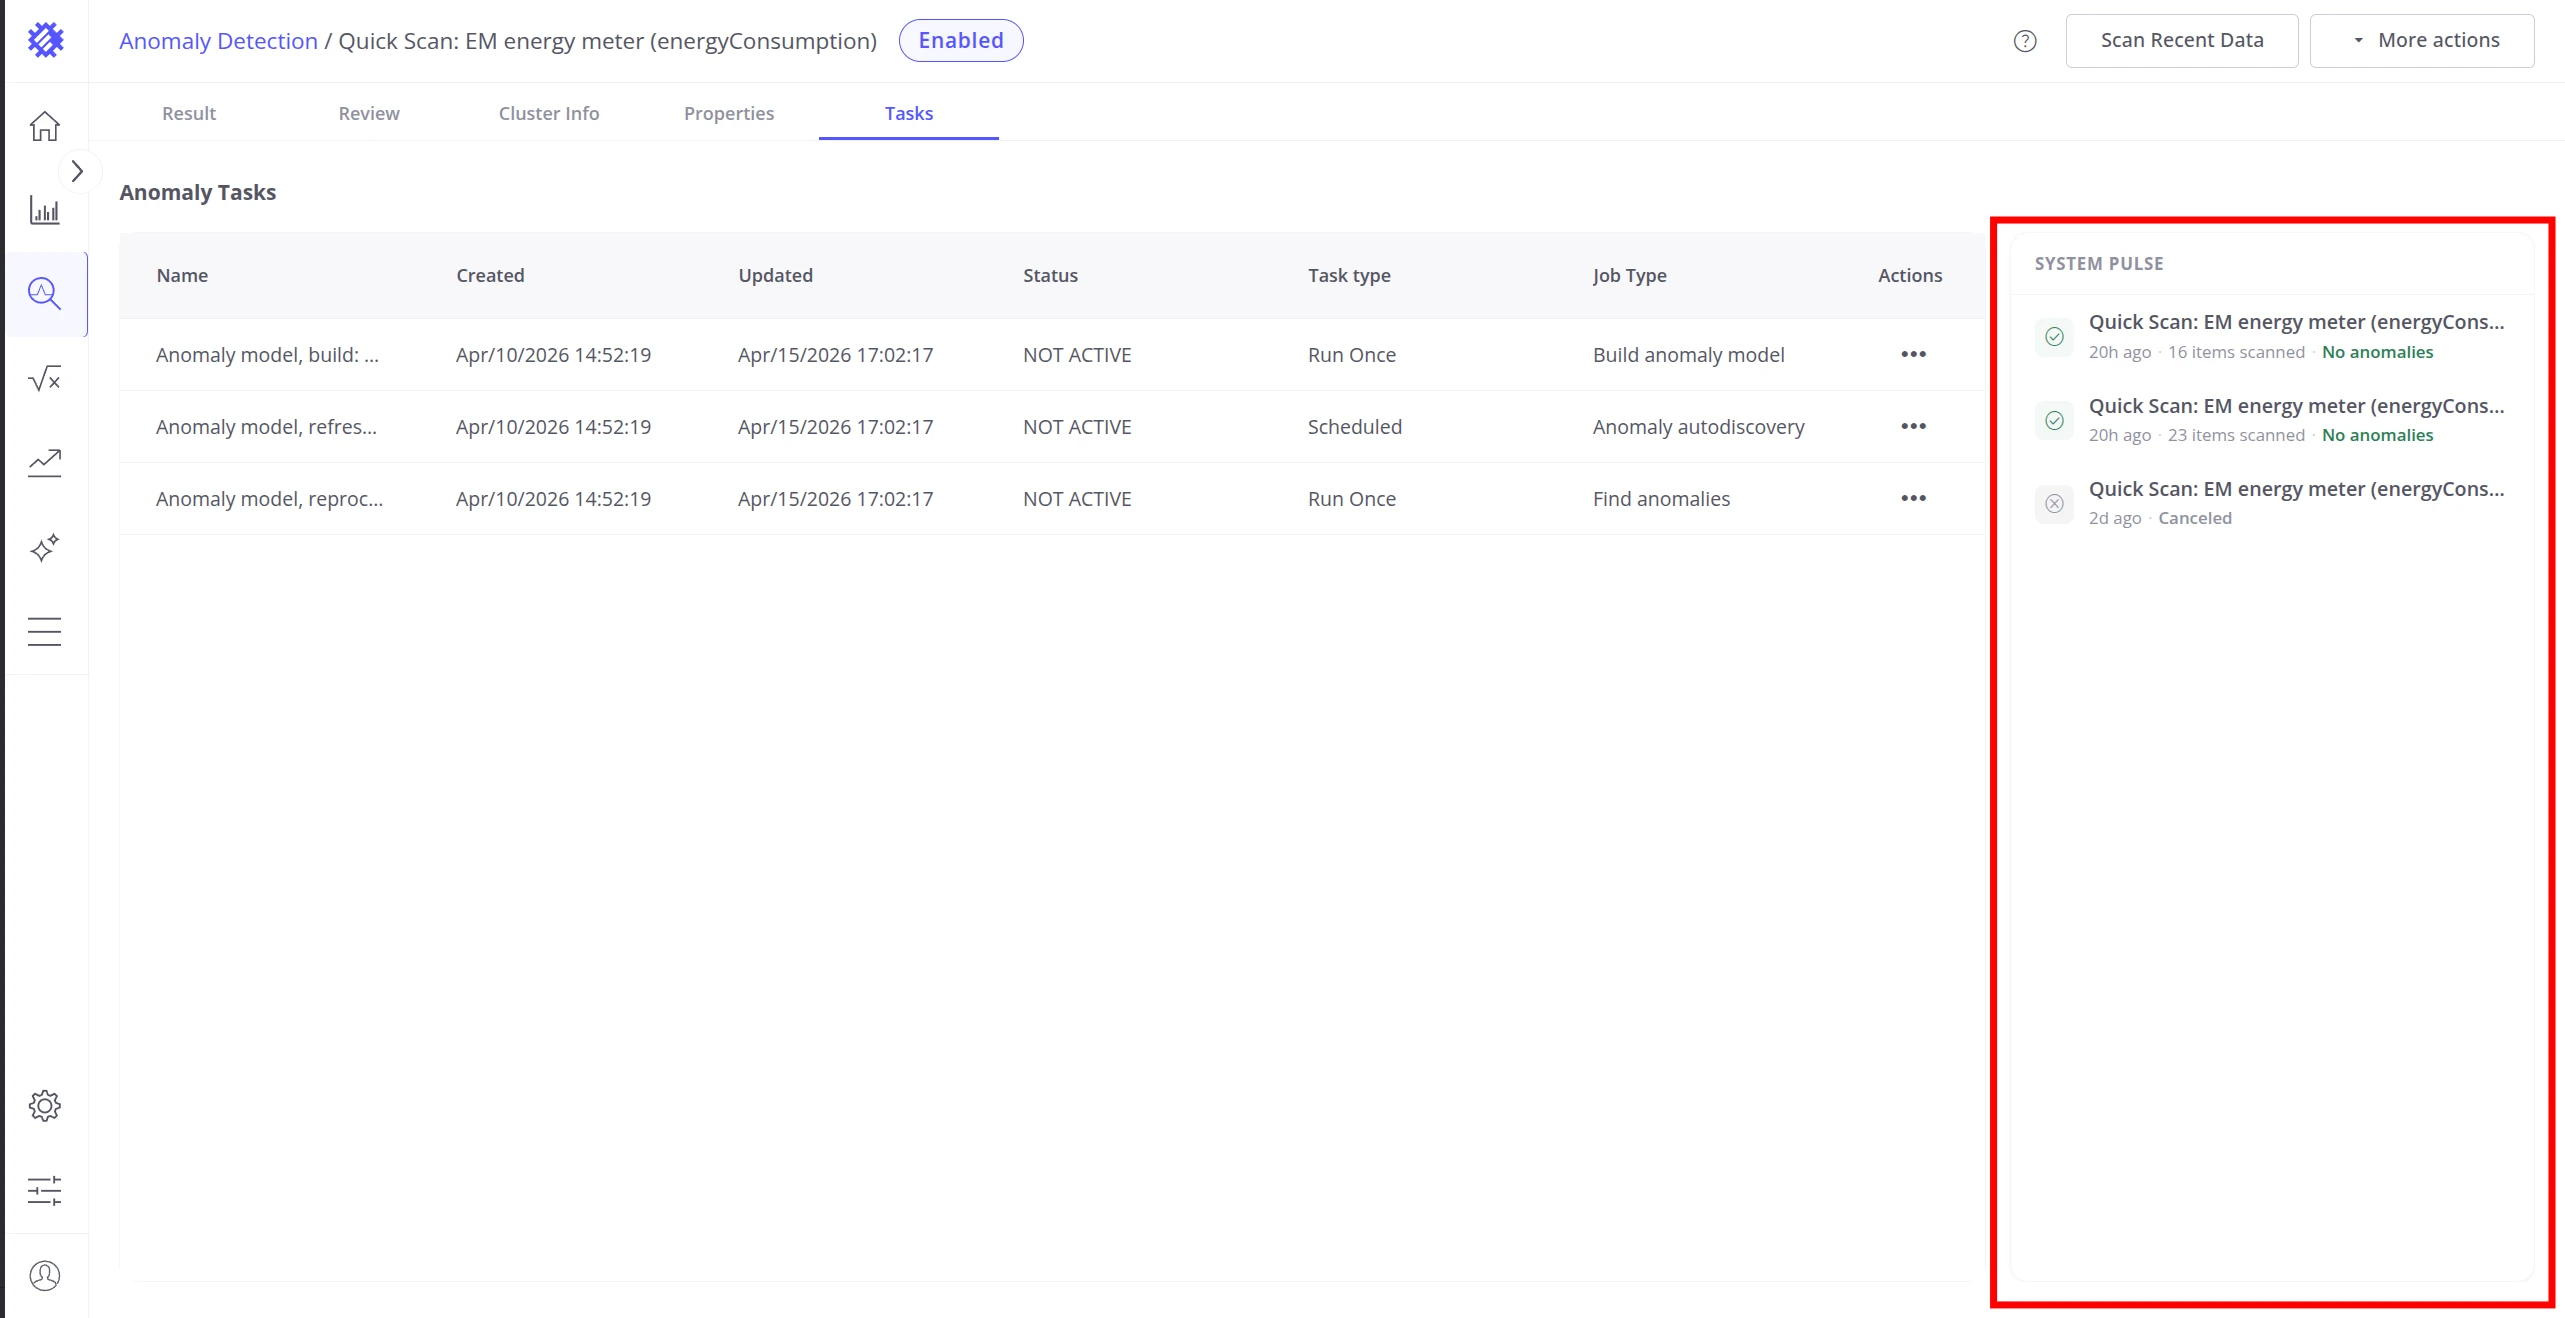
System Pulse
Section titled “System Pulse”The System Pulse panel shows the last 10 scan executions for this model. Each entry displays the execution time and one of four status indicators:
| Color | Status | Meaning |
|---|---|---|
| Green | OK | Scan completed — no anomalies found |
| Orange | Anomalies | Scan completed — anomalies were detected |
| Red | Failed | Scan terminated due to an unexpected error |
| Gray | Canceled | Scan task was canceled before completion |
Click any pulse entry to navigate directly to the relevant view — the Review tab if anomalies were found, or the Result tab for a clean run.
Actions
Section titled “Actions”Two page-level actions are available in the top-right corner of any model detail view.
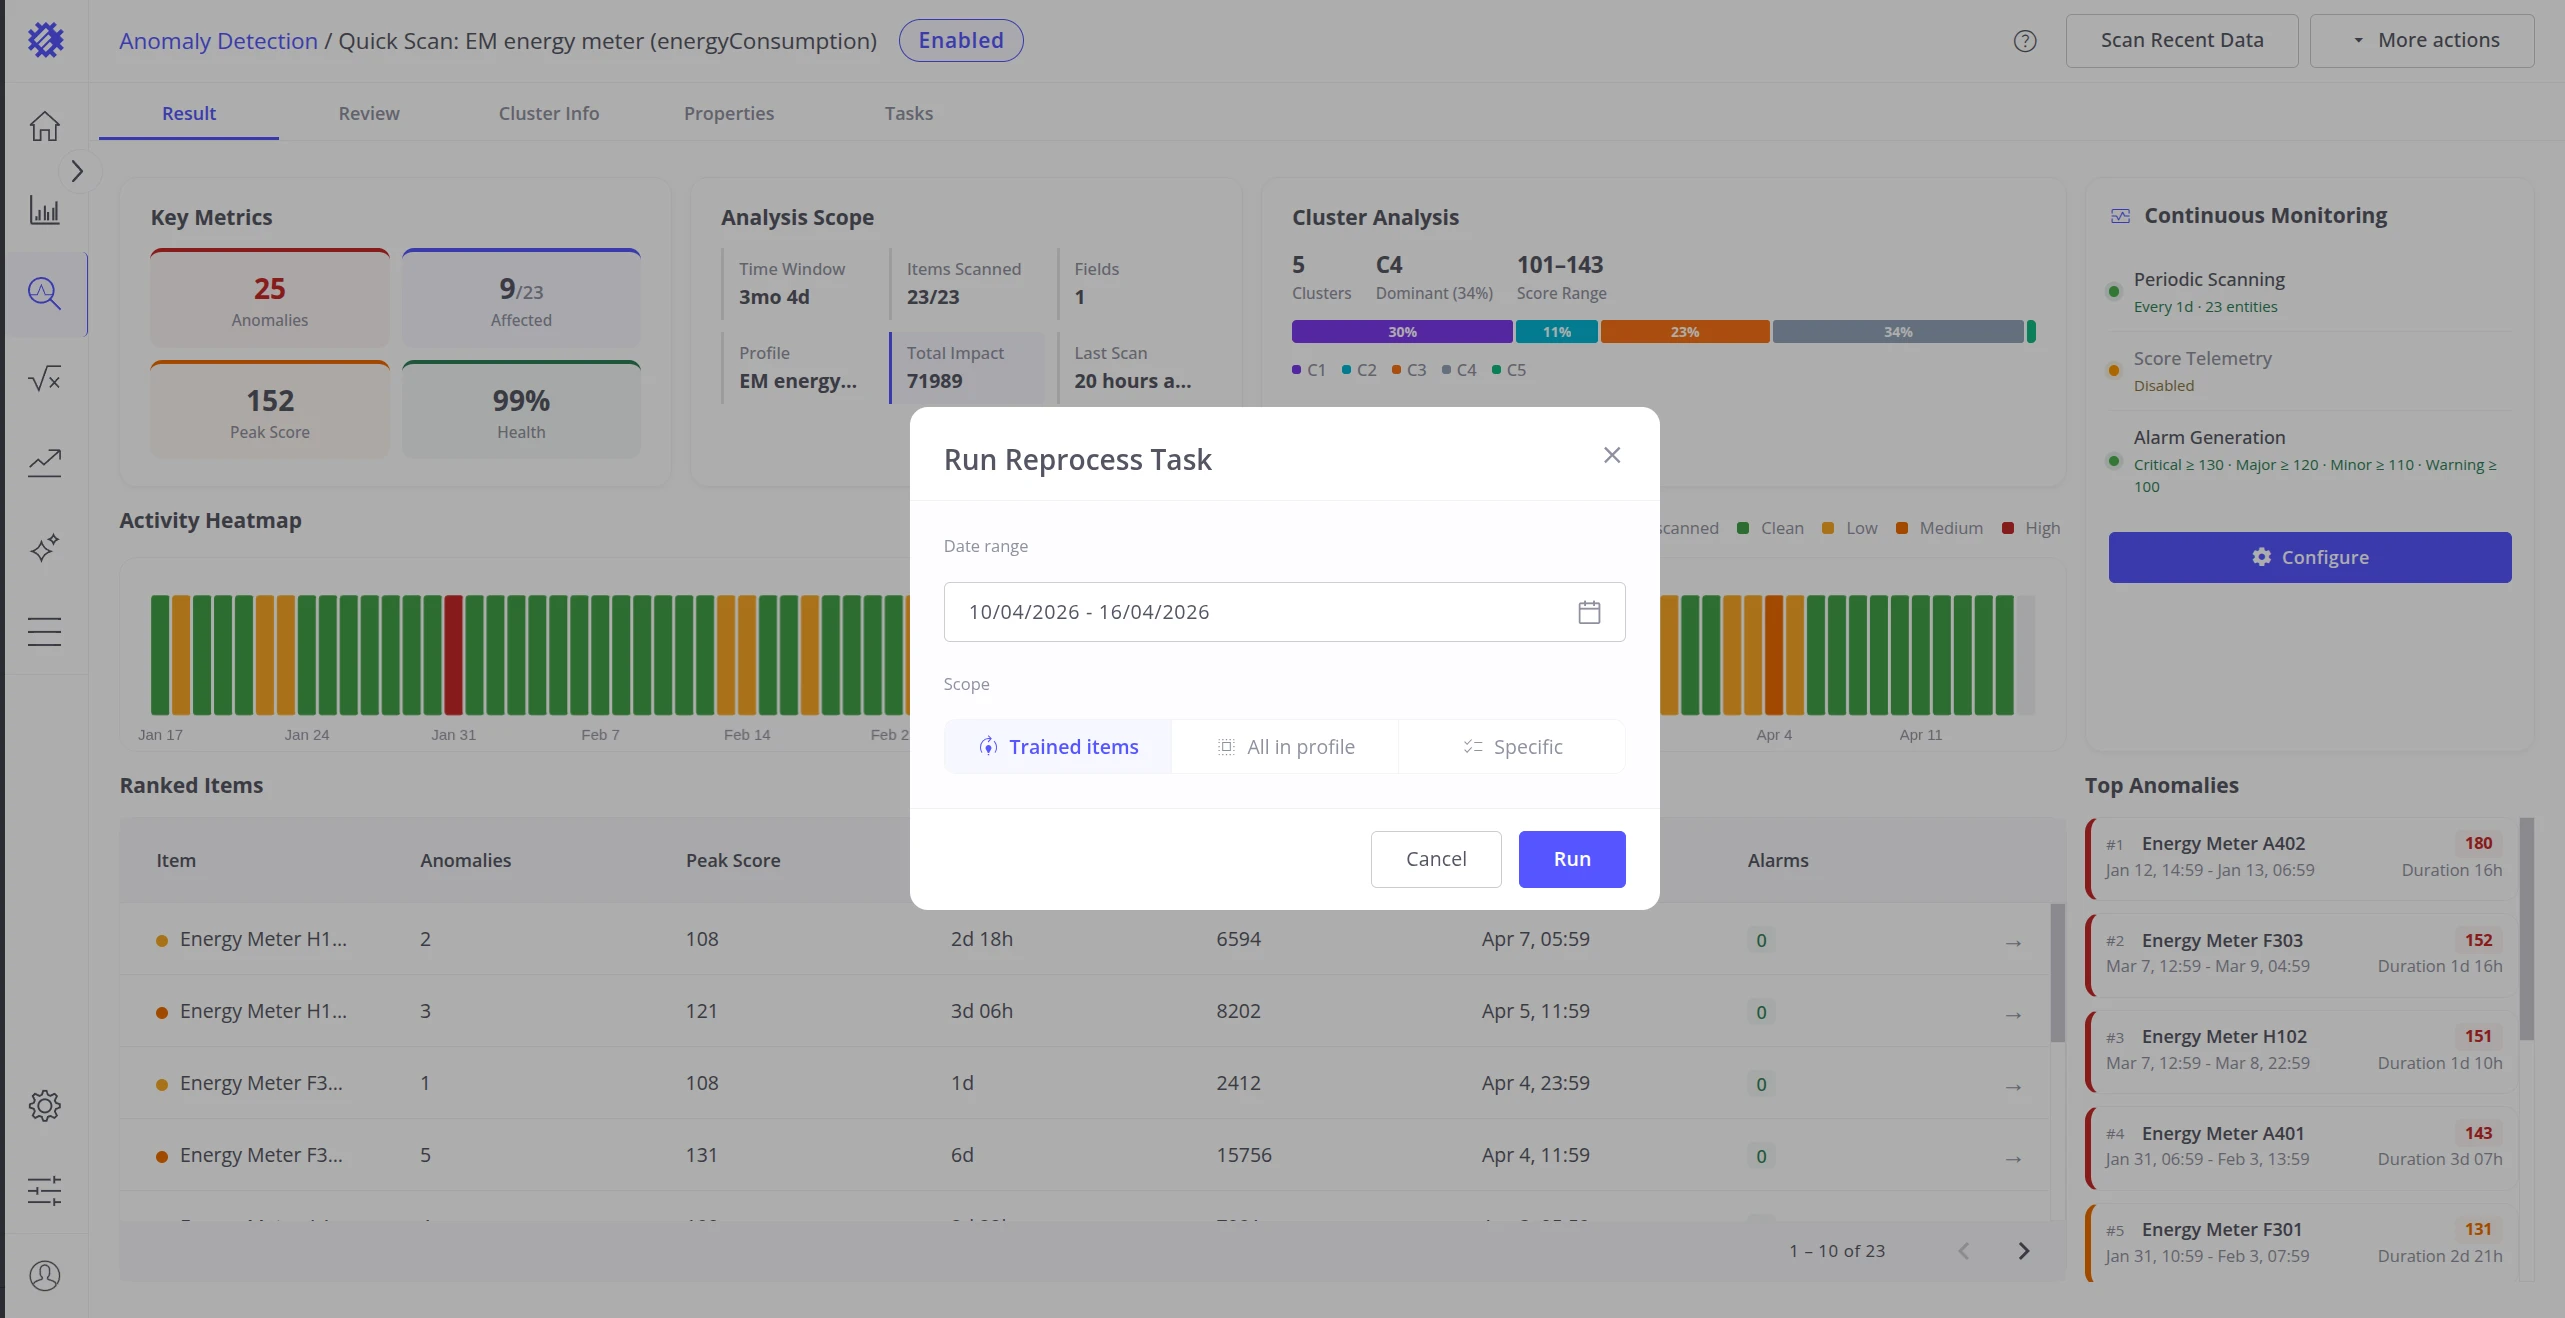
Scan Recent Data
Section titled “Scan Recent Data”The Scan Recent Data button opens the Reprocess Task dialog, letting you apply the trained model to any historical time range on demand. This is equivalent to triggering a reprocess without navigating to the Tasks tab. See Monitoring & Alarms for details on scheduled scanning and reprocess configuration.
More Actions
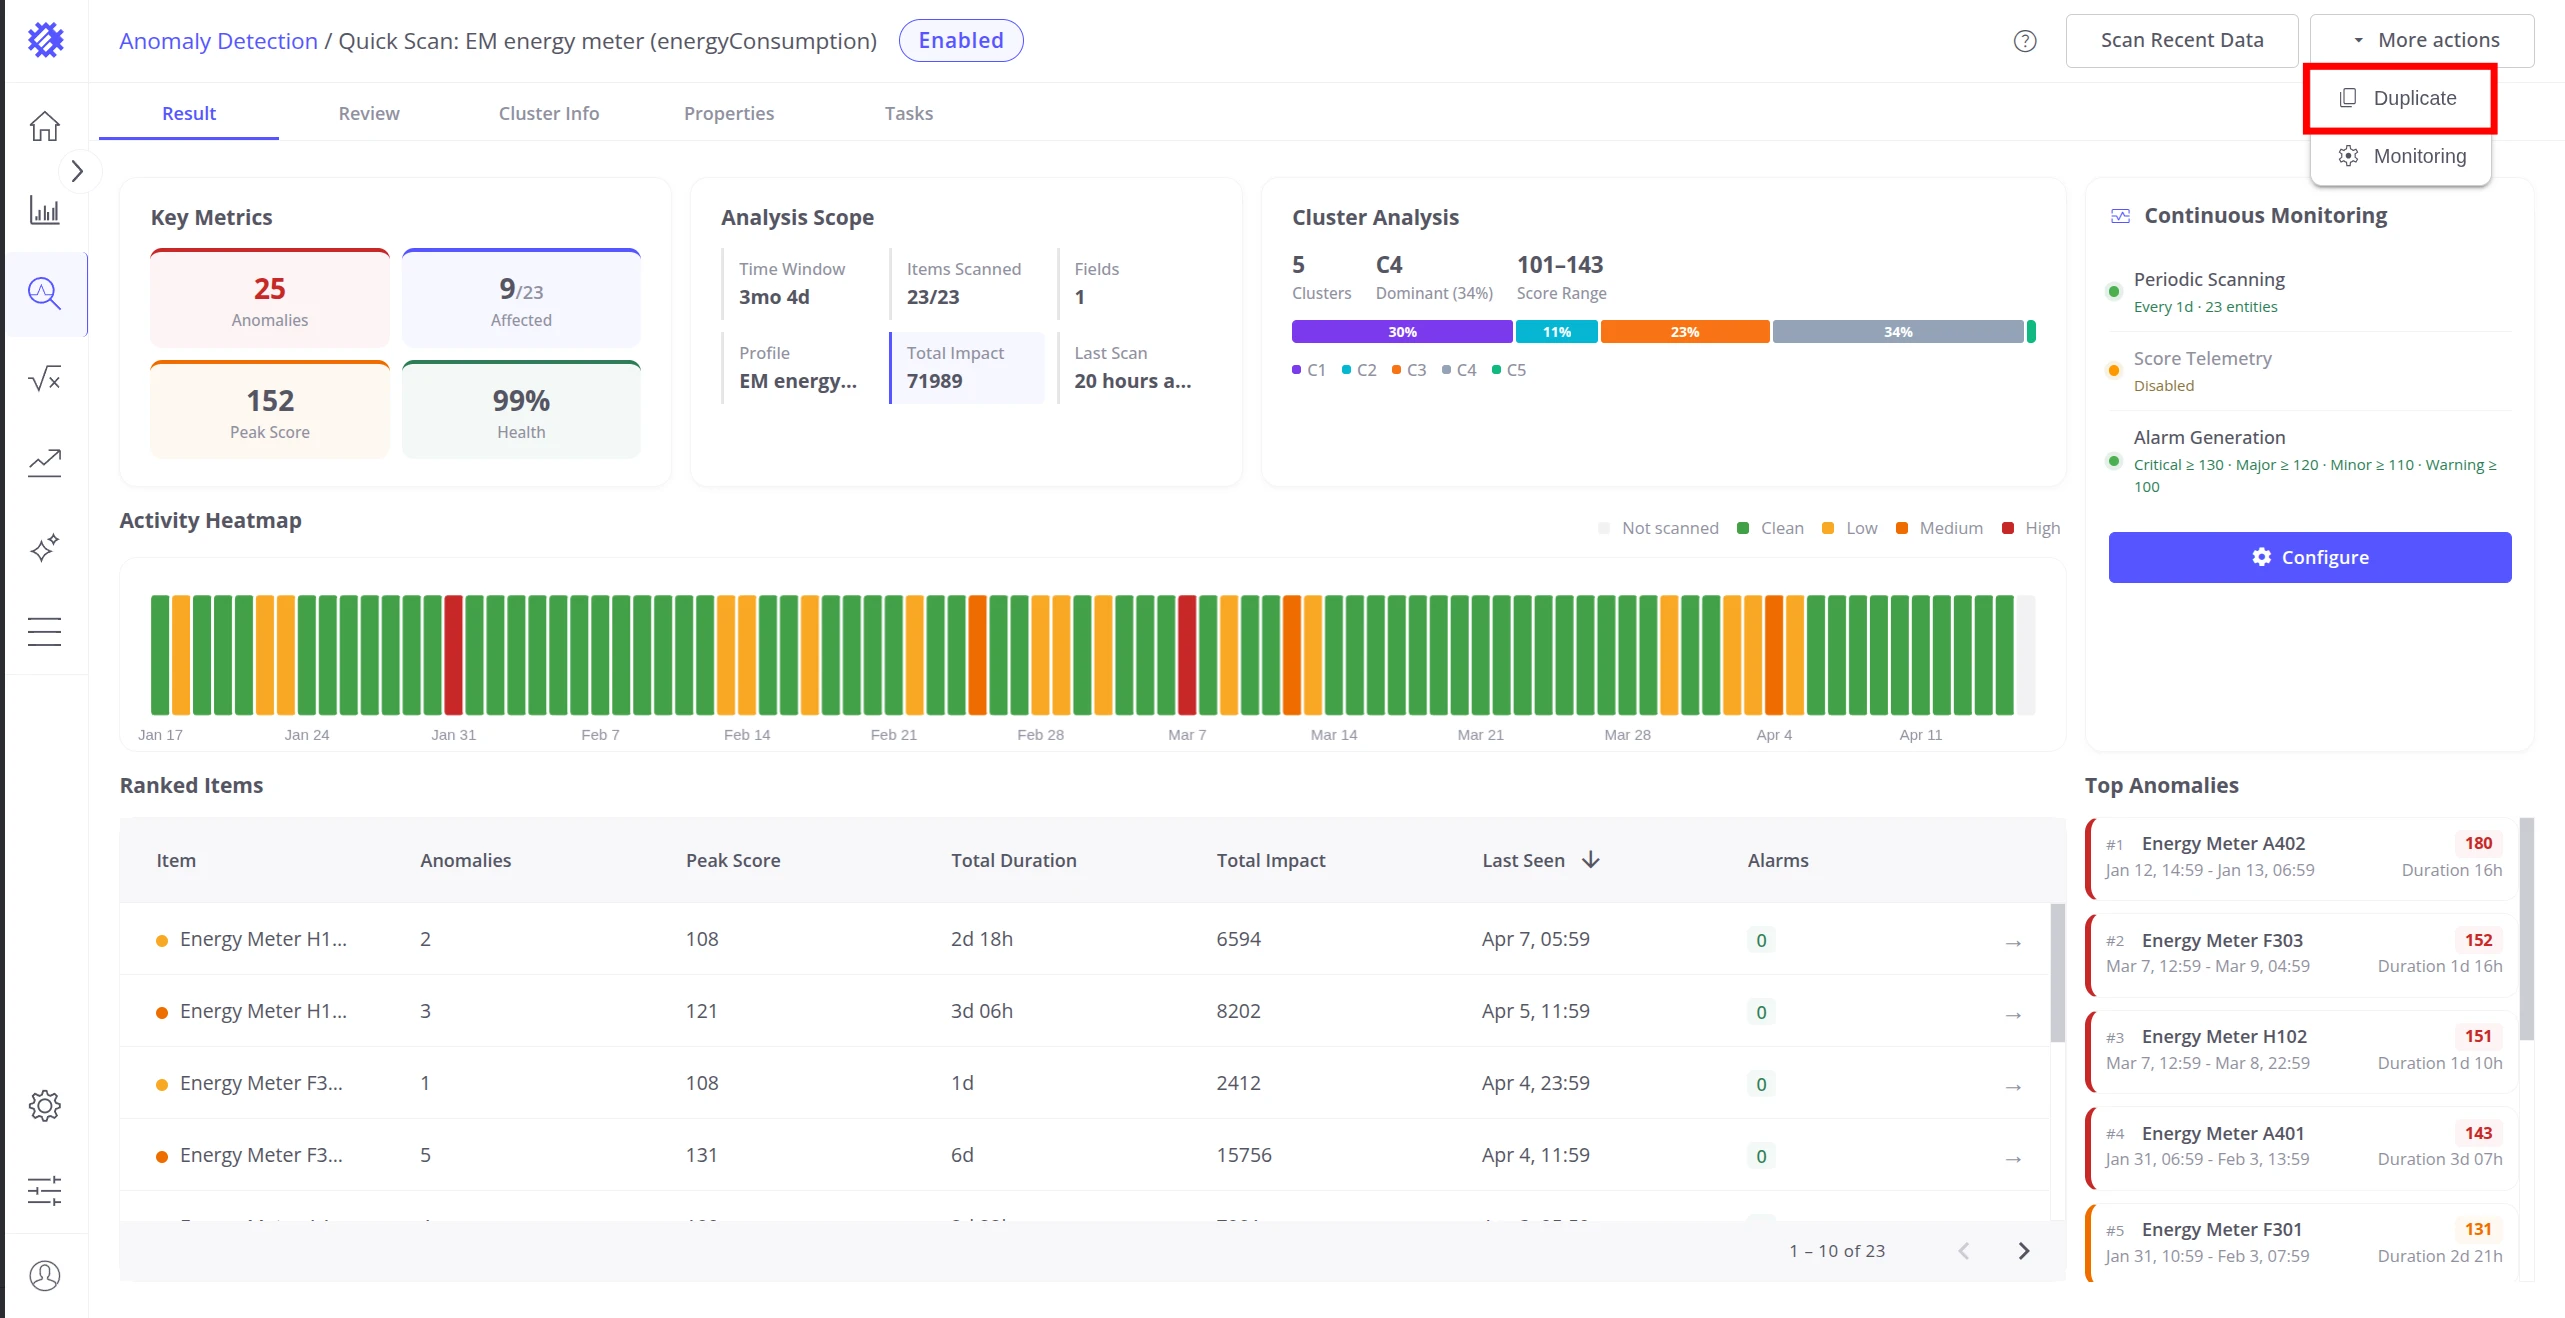
Section titled “More Actions”The More actions menu (⋯) provides two additional options:
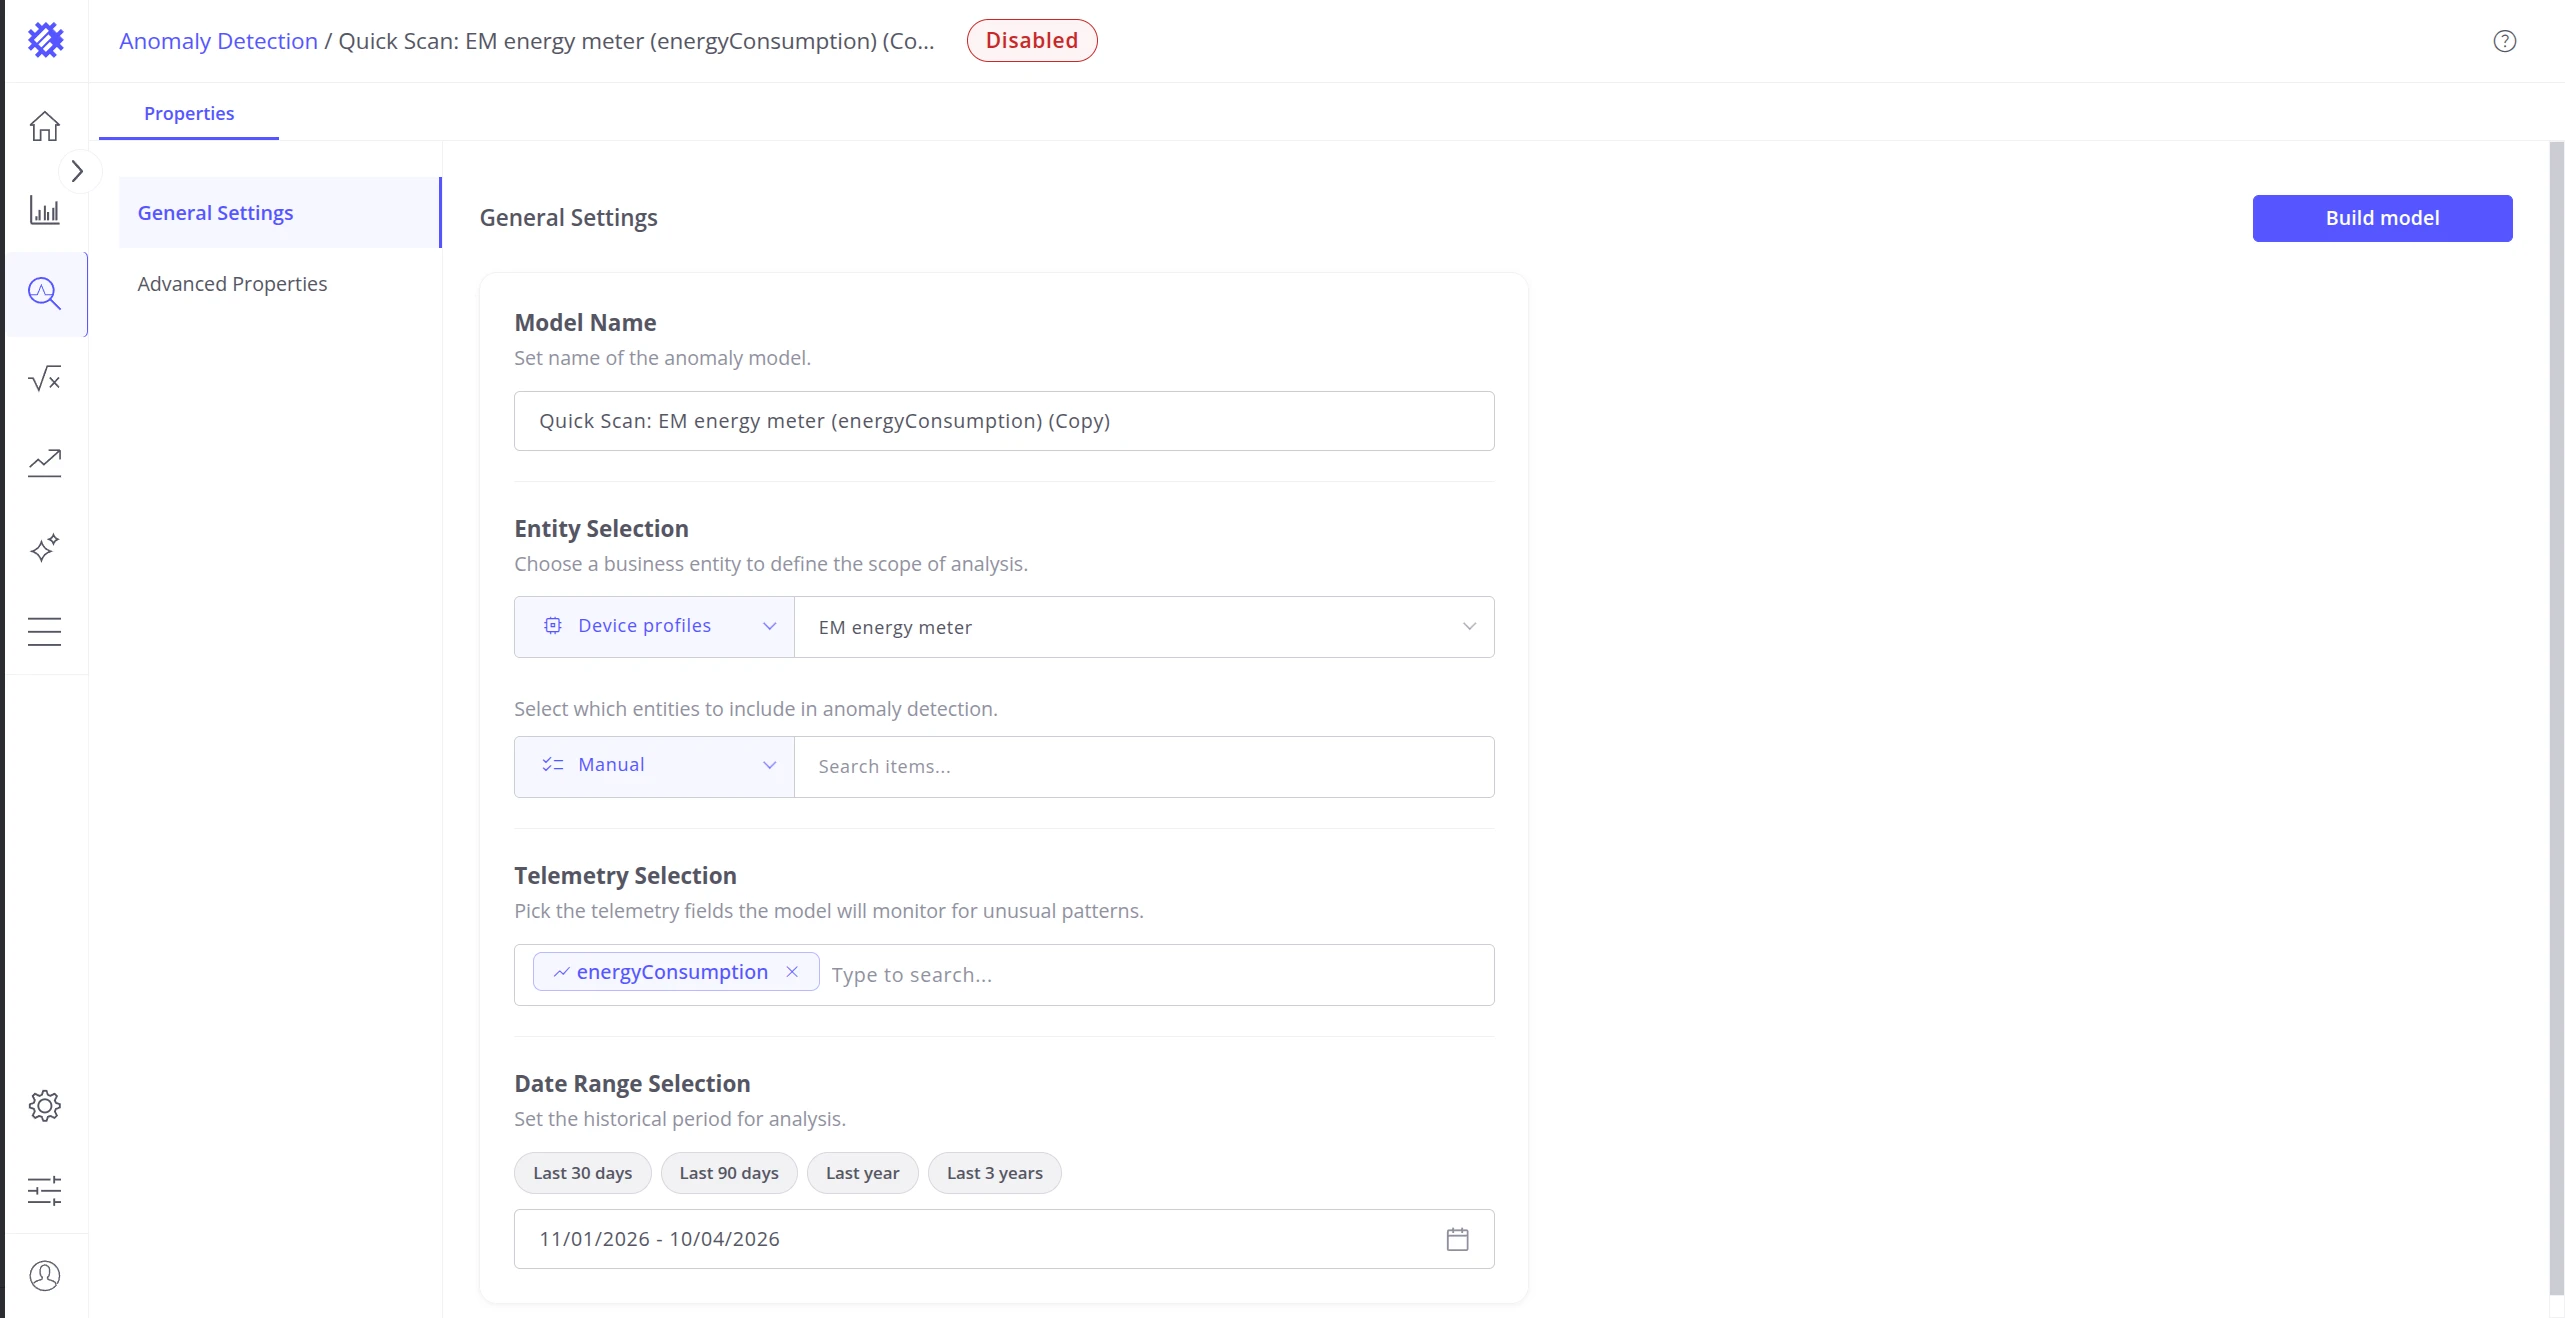
Duplicate creates a copy of this model’s full configuration as a new model. The copy opens in the Properties tab ready for modification and rebuild — useful for testing parameter variations without losing the original.
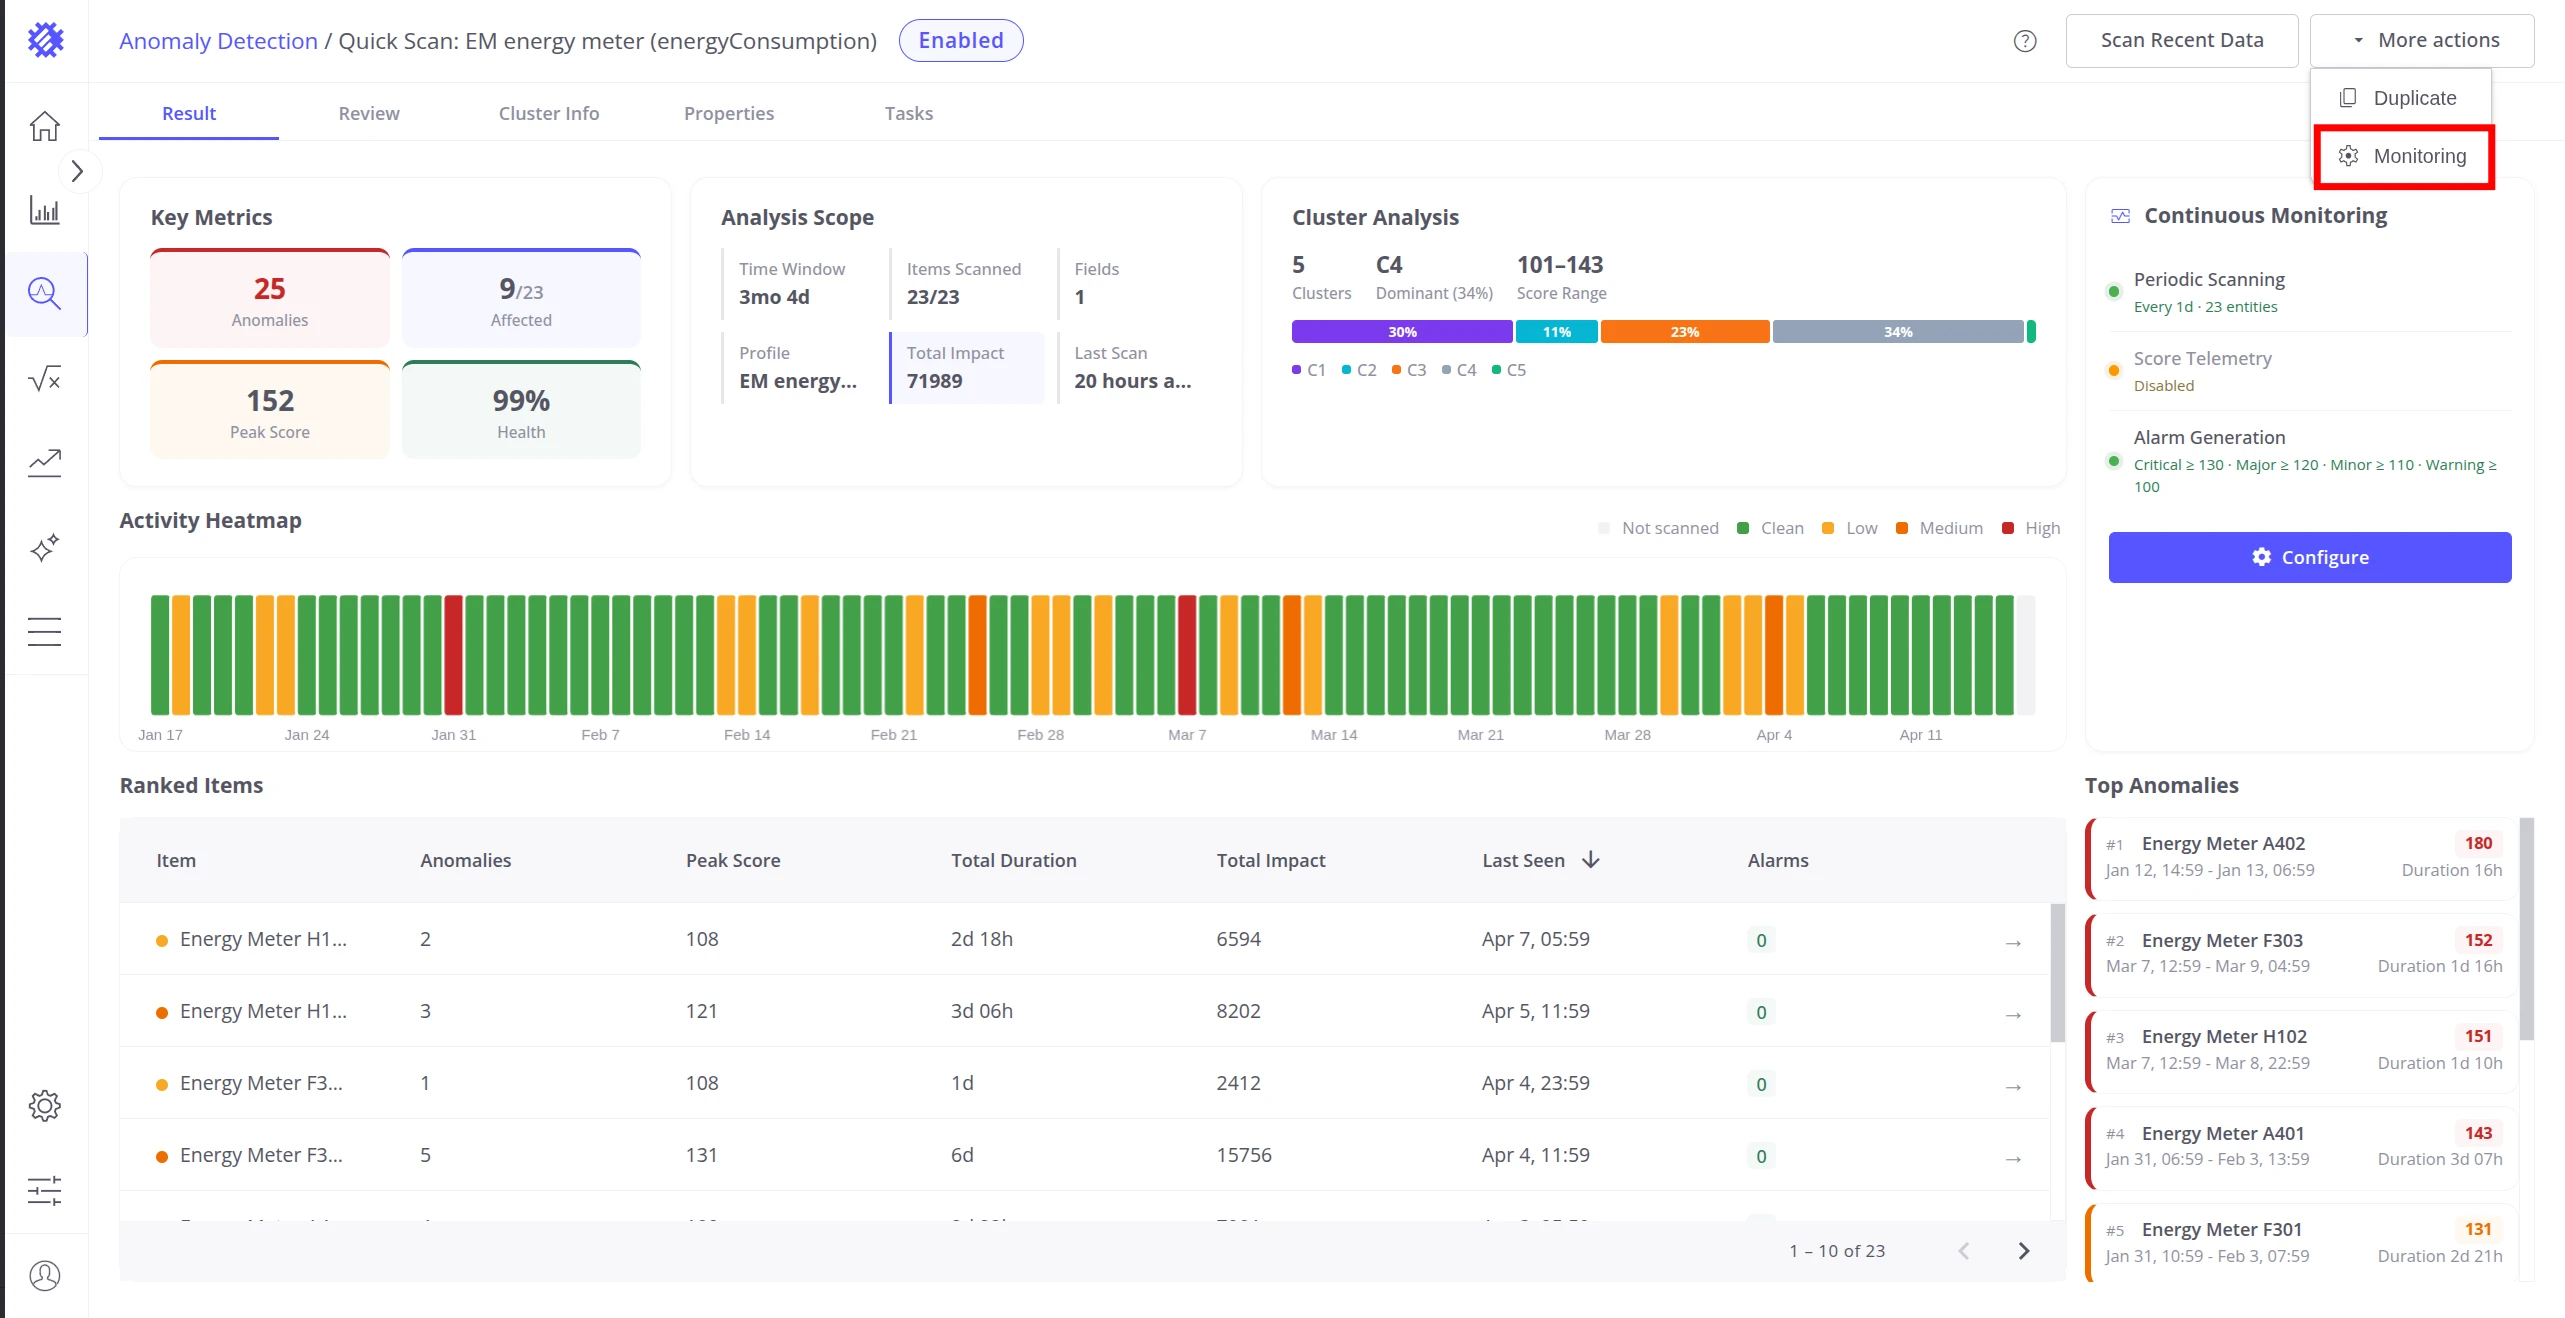
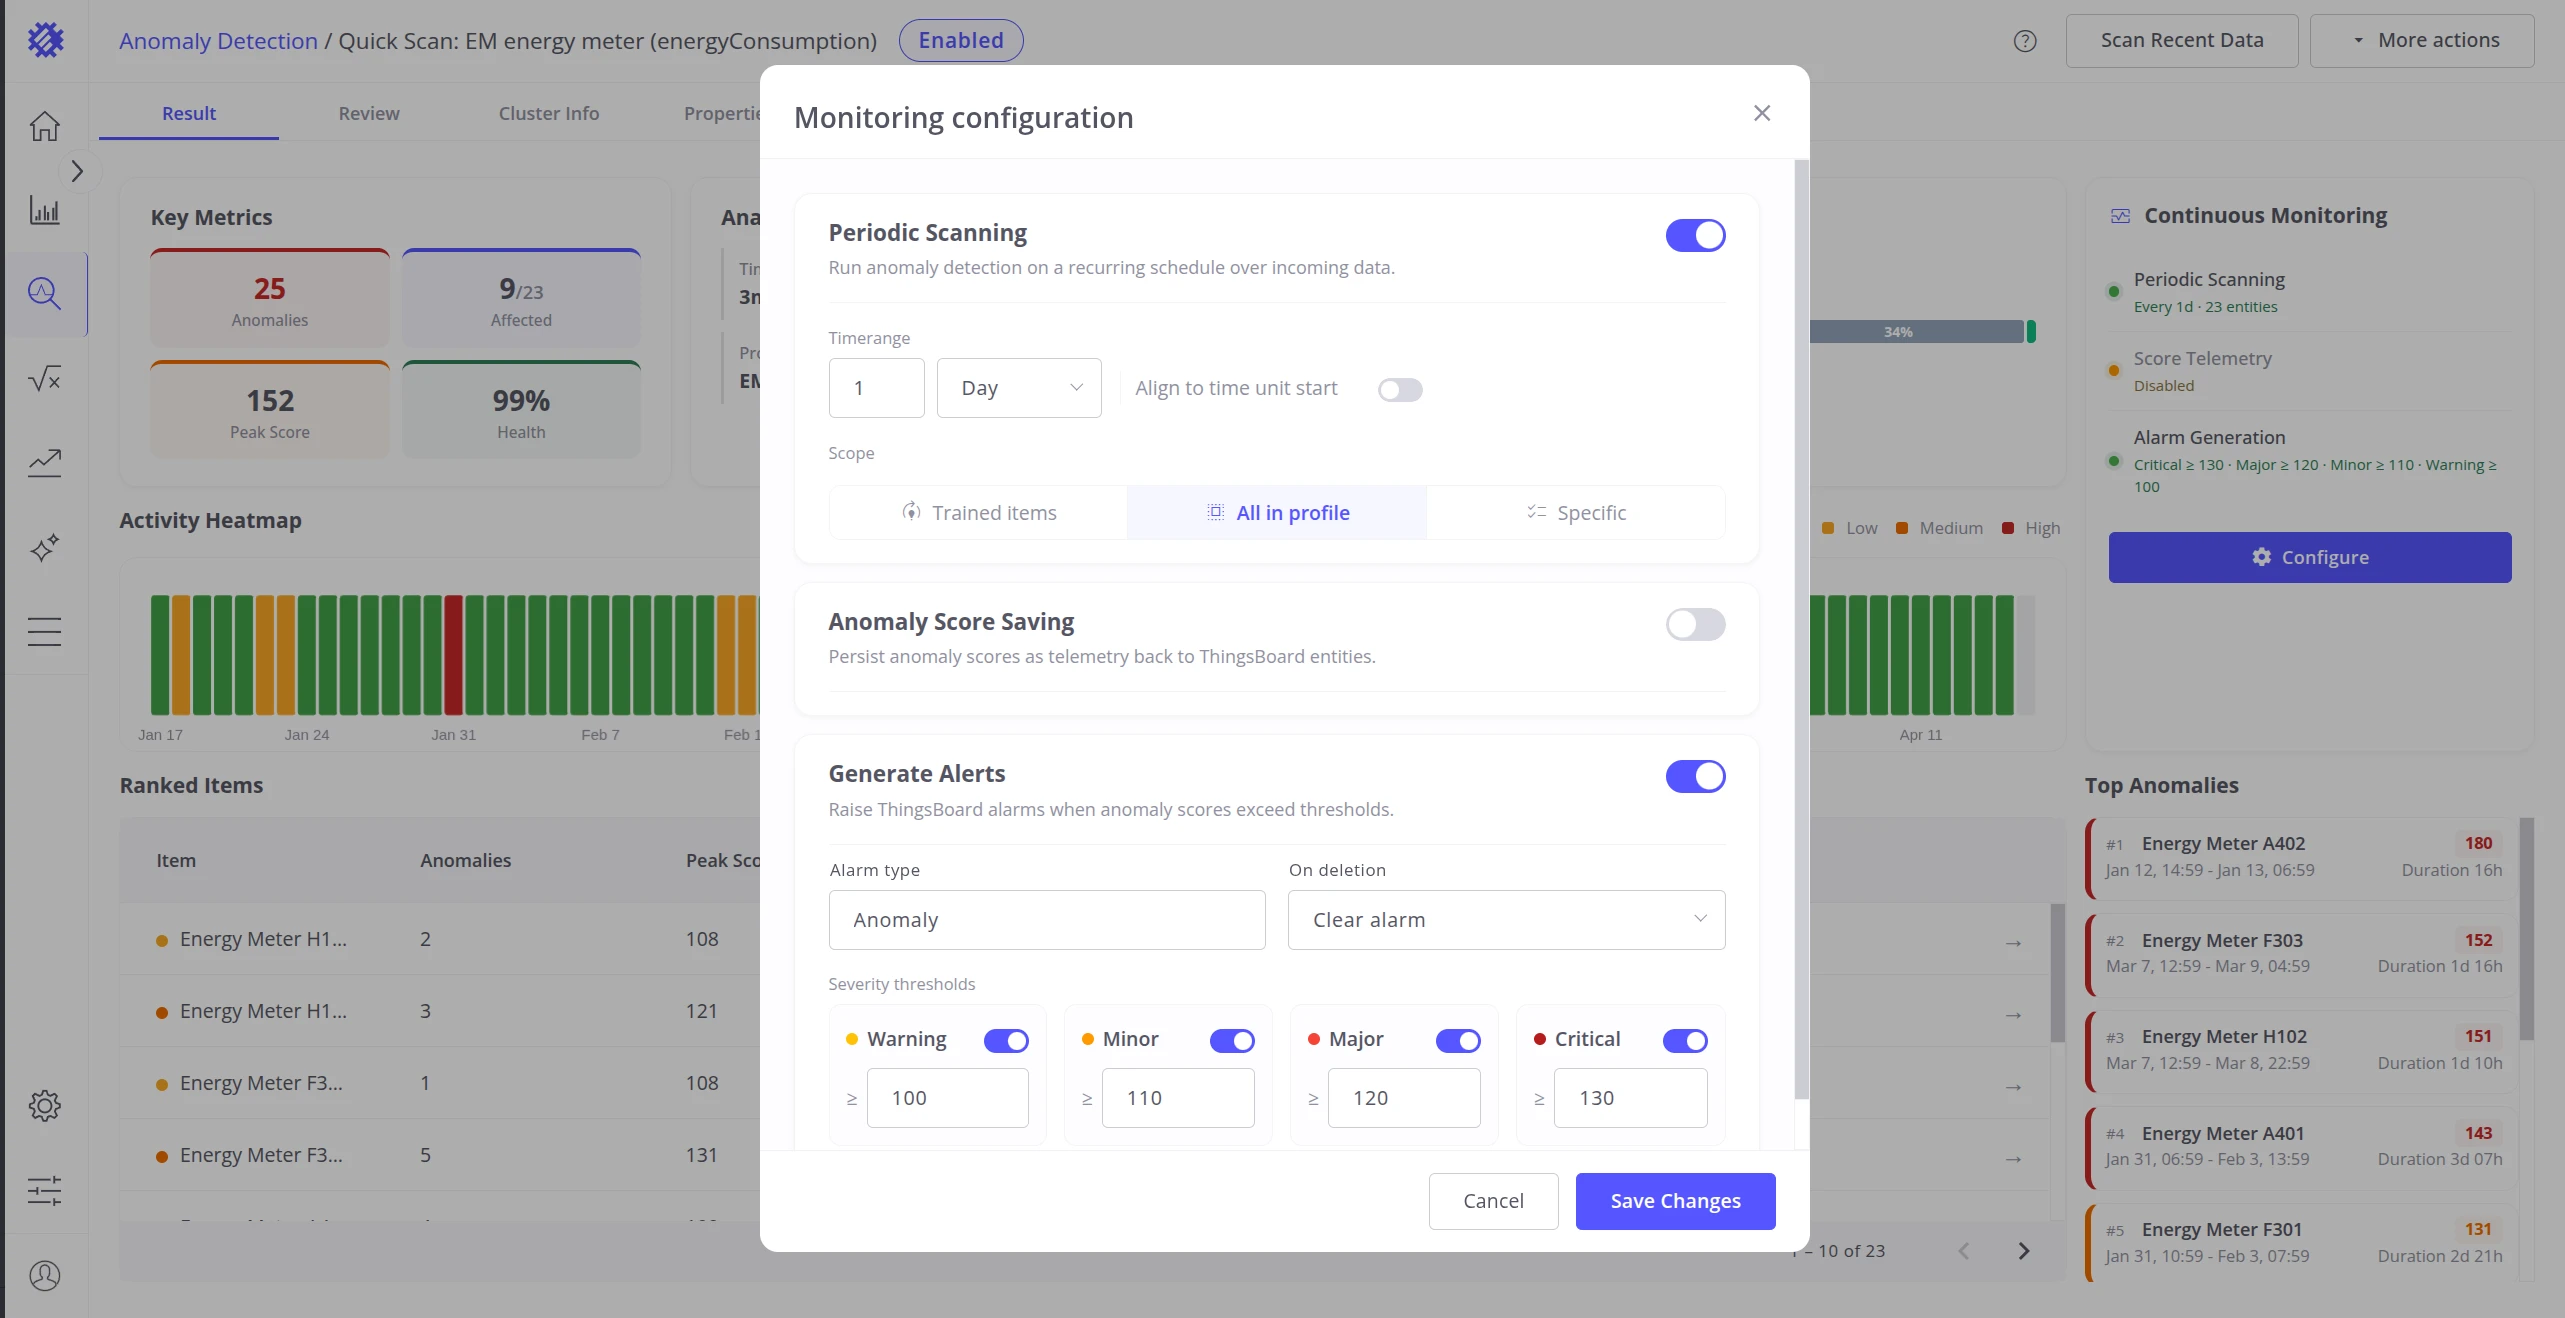
Monitoring opens the monitoring configuration dialog directly, without navigating to the Continuous Monitoring card. Equivalent to clicking Configure on the Result tab. See Monitoring & Alarms for full configuration details.
Was this helpful?